Article

Patterns of Human Milk Oligosaccharides in Mature Milk Are Associated with Certain Gut Microbiota in Infants

1
Department of Nutrition and Food Hygiene, School of Public Health, Peking University, Beijing 100191, China
2
Vanke School of Public Health, Tsinghua University, Beijing 100084, China
3
School of Nursing, Peking University, Beijing 100091, China
4
CAS Key Laboratory of Separation Science for Analytical Chemistry, Dalian Institute of Chemical Physics, Chinese Academy of Sciences, Dalian 116023, China
5
Junlebao Dairy Joint Laboratory of Breast Milk Science and Life Health, Peking University, Beijing 100191, China
*
Author to whom correspondence should be addressed.
Nutrients 2024, 16(9), 1287; https://doi.org/10.3390/nu16091287
Submission received: 19 March 2024 / Revised: 17 April 2024 / Accepted: 22 April 2024 / Published: 25 April 2024
(This article belongs to the Special Issue Roles of Dairy Intake in Health Development)

Abstract

:
Human milk oligosaccharides (HMOs) are complexes that play a crucial role in shaping the early-life gut microbiota. This study intends to explore whether HMO patterns are associated with the gut microbiota of infants. We included 96 Chinese breastfeeding mother–infant dyads. Breast milk and infant faecal samples were collected and tested. With milk 2′-fucosyllactose, difucosyllactose, and lacto-N-fucopentaose-I as biomarkers, we divided the mothers into secretor and non-secretor groups. HMO patterns were extracted using principal component analysis. The majority (70.7%) of mothers were categorised as secretor and five different HMO patterns were identified. After adjustment, the infants of secretor mothers exhibited a lower relative abundance of Bifidobacterium bifidum (β = −0.245, 95%CI: −0.465~−0.025). An HMO pattern characterised by high levels of 3-fucosyllactose, lacto-N-fucopentaose-III, and lacto-N-neodifucohexaose-II was positively associated with the relative abundance of Bifidobacterium breve (p = 0.014), while the pattern characterised by lacto-N-neotetraose, 6′-sialyllactose, and sialyllacto-N-tetraose-b was negatively associated with Bifidobacterium breve (p = 0.027). The pattern characterised by high levels of monofucosyl-lacto-N-hexaose-III and monofucosyl-lacto-N-neohexaose was positively associated with Bifidobacterium dentium (p = 0.025) and Bifidobacterium bifidum (p < 0.001), respectively. This study suggests that HMO patterns from mature breast milk were associated with certain gut microbiota of breastfed infants.

1. Introduction

The World Health Organization (WHO) recommends commencing breastfeeding within 1 h of birth and maintaining exclusive breastfeeding until the baby reaches 6 months of age [1]. Breast milk is the most suitable food for infants aged 0–6 months, as it not only provides infants with the necessary nutrients for their growth and development, but also contains human milk oligosaccharides (HMOs), hormones, cytokines, and other bioactive substances [2,3,4,5]. The nutrients and bioactive substances in breast milk have different patterns of characteristics in colostrum, transitional milk, and mature milk, thus meeting the needs of infants [6,7,8].
The collective term HMOs refers to a class of covalently linked, multifunctional, indigestible, and structurally diverse polysaccharides unique to human breast milk. They are the third largest solid component in breast milk, following lactose and fat [9,10]. Although researchers had discovered as early as the beginning of 20th century that human milk contains unique carbohydrates that can promote the growth of Bifidobacterium bifidum (B. bifidum), the exact structure and other potential functions of these carbohydrates were difficult to determine due to limitations in detection techniques [11]. With the development of analytical technology, more than 200 types of HMOs have been identified [12] and the structure, function, and application of HMOs have become research hotspots in recent years.
The concentration of HMOs is influenced by multiple genetic and non-genetic factors. Genetically, the secretor gene has been reported to be one of the most crucial determinants of HMOs [13]. The secretor gene encodes fucosyltransferase 2 (FUT2), which mediates the synthesis of α-1,2 glycosidic bonded HMOs [14]. Thus, the absence of FUT2 results in an HMO pattern characterised by extremely low levels or an absence of α-1,2 glycosidic bonded HMOs such as 2′-fucosyllactose (2′-FL), difucosyllactose (DFL), and lacto-N-fucopentaose I (LNFP-I) in non-secretor (nSe) mothers. Reports on the percentage of secretor (Se) in Chinese mothers ranges from 50.0% to 81.2% [15,16,17,18], while reviews covering populations from other countries indicated that the percentage of Se is about 80% [19,20]. In addition, non-genetic factors including maternal age, the stage of milk maturation, race, geographic location, and parity also have an impact on HMO concentration [16,21,22,23,24]. Such differences may suggest a unique distribution of HMO patterns and, subsequently, different infant gut microbiota composition in the Chinese population.
However, current studies regarding the association of HMOs with infant gut microbiota in China are mostly focused on the individual HMOs, whereas the HMO patterns are still yet to be considered. A study conducted in Jining and Harbin reported that the concentrations of DFL and LNFP-I in Jining mothers were higher than in Harbin mothers, and the relative abundance of Bifidobacterium in the gut of Jining infants was consistently higher than that of Harbin infants [25]. It is of interest that both DFL and LNFP-I were FUT2-related HMOs that predominantly appear in the Se milk [26]. As the maternal secretor phenotype could shape the HMOs patterns, Bai et al. [15] followed up on mother–infant dyads in Jinzhou and observed that, in contrast to infants fed by Se mothers, those fed by nSe mothers displayed a more substantial shift in the composition of their gut microbiota during lactation. Additionally, the abundance of Bifidobacterium breve (B. breve) was higher in this group. However, there have also been studies suggested that the maternal secretor phenotype is not associated with infant gut microbiota composition [27,28]. These contradictory findings regarding the association of HMOs and the maternal secretor phenotype with infant gut microbiota connotes that a priori Se/nSe HMO patterns might not be sufficient enough in emphasising how the HMOs interacts with infant gut microbiota as a complex.
Using paired maternal–infant data, this study intends to explore the association of different levels and patterns of HMOs in mature milk with the composition of infant gut microbiota.

2. Materials and Methods

2.1. Study Population

This study is part of the 13th Five Year Plan for the National Key Research and Development Program of China (2017YFD0400602). Mother-infant dyads (n = 96) from Chengdu (n = 15), Guangzhou (n = 10), Hohhot (n = 14), Beijing (n = 39), and Suzhou (n = 19), representing western, southern, northern, and eastern China, were recruited for this study.
Mothers who were healthy and aged 20–45 years were considered eligible for inclusion if they had (1) no alcohol or tobacco use; (2) a full-term delivery (37–42 weeks); (3) given birth 1–3 months ago; and (4) exclusively breastfed. Mothers who had (1) mastitis or gastrointestinal infections; (2) used probiotics in the last 3 months; or (3) no milk sample were excluded. Corresponding to their mothers, infants with faecal samples were included, while those with (1) gastrointestinal infections, (2) limb disabilities, or (3) a history of probiotic or prebiotic use after birth were excluded.

2.2. Basic Information Collection

Trained investigators used interview questionnaires to collect the information required about the subjects, including residential city (Chengdu, Guangzhou, Hohhot, Suzhou, Beijing), maternal age (years), infant age (days), delivery modes (caesarean or vaginal), and parity (primipara or multipara).

2.3. Sample Collection and Preservation

The breast milk sample was collected following the previously established standard process [16]. On the day before the investigation, the investigator contacted the subjects by phone and instructed the mothers to complete breastfeeding and empty their breasts before 7 a.m. on the day of the investigation. Breast milk samples were collected between 9 and 11 a.m. in the morning to avoid the influence of circadian rhythms. Trained investigators helped the maternal subjects to collect a total of 45 mL whole milk (including fore and hind milk) into a sterile tube. The remaining milk was returned to the mother and the milk sample was gently mixed and then immediately stored at –80 °C until testing.
An infant faecal sample was collected using a sterilised plastic scoop attached to the inner aspect of the lid of a sterile polypropylene vial with a DNA preservation solution. Parents were asked to collect 0.5 g of infant faecal sample (approximately the size of one peanut) at home around the time of breast milk collection (±24 h) and store the tube at −20 °C immediately after the collection. Samples were transported to the local research institution the next day via ice bags and insulation bags, then stored at −80 °C until testing.

2.4. HMO Analysis

Before analysis, the samples were defatted and diluted. An ACQUITY UPLC I-Class system (Waters, Milford, MA, USA) coupled to a Xevo TQ-XS triple quadrupole mass spectrometer (Waters) was used for analysis. Chromatography was performed on a Waters ACQUITY BEH Amide column (130 Å, 1.7 μm, 2.1 × 150 mm). ESI-MS detection was in the negative-ion mode and collision-induced dissociation tandem MS (CID-MS/MS) was carried out using multi-reaction monitoring (MRM) for both sequence assignment and quantitation. The details of this method have been described in a previous study [29].
Twenty-three HMOs were detected in this study, including 2′-FL, 3-fucosyllactose (3-FL), DFL, LNFP-I, lacto-N-fucopentaose II (LNFP-II), lacto-N-fucopentaose III (LNFP-III), lacto-N-difucohexaose I (LNDFH-I), lacto-N-difucohexaose II (LNDFH-II), lacto-N-neodifucohexaose I (LNnDFH-I), lacto-N-neodifucohexaose II (LNnDFH-II), monofucosyl-lacto-N-hexaose I (MFLNH-I), monofucosyl-lacto-N-hexaose III (MFLNH-III), monofucosyl-lacto-N-neohexaose (MFLNnH), difucosyl-para-lacto-N-neohexaose (DFpLNnH), lacto-N-tetraose (LNT), lacto-N-neotetraose (LNnT), 3′-sialyllactose (3′-SL), 6′-sialyllactose (6′-SL), sialyllacto-N-tetraose b (LSTb), sialyllacto-N-tetraose c (LSTc), disialyllacto-N-tetraose (DSLNT), 3-sialyl-latco-N-fucopentaose II (3′-SLNFP II), and 6-sialyl-latco-N-fucopentaose VI (6′-SLNFP VI). Additionally, the concentration of 3′-SLNFP-II and 6′-SLNFP-VI was presented as 3′-SLNFP-II&6′-SLNFP-VI.
The maternal secretor phenotype was determined based on the presence of 2′-FL, DFL, and LNFP-I [26]. Mothers with high levels of 2′-FL, DFL, and LNFP-I were classified as Se, while those with 2′-FL, DFL, and LNFP-I below the limit of detection (LOD) were classified as nSe.

2.5. 16SRNA Sequencing

16SRNA sequencing was conducted by a 16S full-length polymerase chain reaction (PCR) amplification system provided by Biomarker Technologies Co., Ltd. (Beijing, China). The sequencing was performed as described in previous studies [30]. Briefly, the DNA was extracted from 96 faecal samples and examined for quality, quantity, concentration, and purity. Then, primer pairs 27F (AGRGTTTGATYNTGGCTCAG) and 1492R (TASGGHTACCTTGTTASGACTT) were used for PCR amplification. The PCR amplicons were subsequently purified and quantified. Libraries were prepared from the equally pooled individual DNA amplicons and the purified libraries were sequenced on a PacBio Sequel II platform (Beijing Biomarker Technologies Co., Ltd., Beijing, China)
Circular consensus sequencing (CCS) reads were generated from the faecal samples by barcode-based identification. Full-length amplicon tags were generated from the effective CCS reads which were filtered, clustered, and denoised. Usearch (version 10.0) was used to establish operational taxonomic unit (OTU) by clustering reads with a similarity threshold at 97.0% [31]. With SILVA (Release132, https://www.arb-silva.de/documentation/release-132/ (accessed on 13 December 2017)) as a reference database, the naive Bayesian classifier algorithm was used to obtain species classification information. Infant gut microbiota composition at different taxonomic levels was then calculated.

2.6. Statistical Analysis

R software (version 4.3.2) was used to analyse the data. All statistical tests were two-sided, with p < 0.05 indicating statistically significant differences.
The Shapiro–Wilk method was used to confirm whether the distribution of variables obeyed normality. Results were presented as mean ± standard deviation (SD) for normally distributed continuous data, and median (P25, P75) for continuous non-normal ones. Categorical variables were summarised as numbers and percentages (n, %). Student’s t-tests, analysis of variance (ANOVA), or Kruskall–Wallis tests were used for continuous normal or non-normal variables, and the chi-squared test was applied for the categorical variables.
Principal component analysis (PCA) was performed to draft the patterns of HMOs with a varimax-rotation method. PCA pattern scores were then calculated accordingly. We selected 0.5 as the threshold for the absolute value of factor loading. Thus, certain HMOs with a factor loading of ≥0.5 or ≤−0.5 would be taken as representative HMOs for each pattern.
The association of the relative abundance of infant gut microbiota with maternal secretor phenotypes and HMO patterns was explored using general linear regression and was adjusted for cities (Chengdu, Guangzhou, Hohhot, Beijing, Suzhou), maternal age (≤30 y or >30 y), total concentration of HMOs (mg/L), and mode of delivery (vaginal delivery or caesarean section). And to improve normality of the residuals, the relative abundance of infant gut microbiota was transformed in the form of lg (X + 1).

2.7. Ethical Considerations

This study was approved by the Medical Ethics Research Board of Peking University (No. IRB00001052-19040) and complied with the Declaration of Helsinki. Written informed consent was obtained from all participants.

3. Results

3.1. Characteristics of the Studied Population

In this study, 96 mother–infant dyads were included, among which 42 mothers (43.8%) were aged 30 years or below when they delivered. There were 29 mothers who delivered by caesarean section (30.2%), and 71 mothers were primiparous (74.0%).

3.2. HMO Concentration

The concentration of 14 neutral fucosylated HMOs (2′-FL, 3-FL, DFL, LNFP-I, LNFP-II, LNFP-III, LNDFH-I, LNDFH-II, LNnDFH-I, LNnDFH-II, MFLNH-I, MFLNH-III, MFLNnH, and DFpLNnH), 2 neutral nonfucosylated HMOs (LNT, LNnT), and 7 sialylated HMOs (3′-SL, 6′-SL, LSTb, LSTc, DSLNT, 3′-SLNFP-II, and 6′-SLNFP-VI) were detected.
Among 96 maternal subjects included, 70 (72.9%) of them were identified as Se. As shown in Table 1, for the 23 HMOs detected, the total HMO concentration in nSe mothers was slightly higher than in the Se mothers, but this difference was not significant.
There were significant differences in the total concentration of HMOs between cities. There was no significant difference in the distribution of total HMOs among participants in different maternal age groups, with different delivery modes, or parities.
In the 96 milk samples we detected, the average of total concentration of HMOs was 6109.2 mg/L. 2′-FL was the most abundant HMO, with a median concentration of 1514.0 mg/L. 3-FL (583.0 mg/L) was the second most abundant neutral fucosylated HMO, while LNT (458.7 mg/L) and 6′-SL (253.9 mg/L) were the most abundant neutral nonfucosylated HMOs and sialylated HMOs, respectively. Certain HMO concentrations also varied with different maternal and infant characteristics (data shown in Appendix A). There were maternal subjects with HMO concentrations under the LOD, including 26 subjects (27.1%) with 2′-FL under the LOD, 25 subjects (26.0%) with DFL, 25 subjects (26.0%) with LNFP-I, 8 subjects (8.3%) with LNFP-II, 19 subjects (19.8%) with LNDFH-I, 38 subjects (39.6%) with LNDFH-II, 26 subjects (27.1%) with LNnDFH-I, 5 subjects (5.2%) with LNnDFH-II, 32 subjects (33.3%) with MFLNH-I, 2 subjects (2.1%) with LNnT, and 2 subjects (2.1%) with LSTb.

3.3. Infant Faecal Microbiota

At the phylum level, the infant gut microbiota was dominated by Firmicutes (39.5%), Proteobacteria (36.5%), Bacteroidota (13.6%), and Actinobacteriota (9.9%). At the genus level, Clostridium sensu stricto 1 (C. sensu stricto 1, 18.4%), Klebsiella (15.7%), Escherichia Shigella (10.8%), Bacteroides (10.6%), and Bifidobacterium (9.2%) were the dominant genera. At the species level, the infant gut microbiota was dominated by Klebsiella pneumoniae (K. pneumoniae, 12.2%), Escherichia coli (E. coli, 10.6%), Clostridium perfringens (C. perfringens, 8.1%), Bifidobacterium longum (5.4%), and Bacteroides fragilis (4.8%).

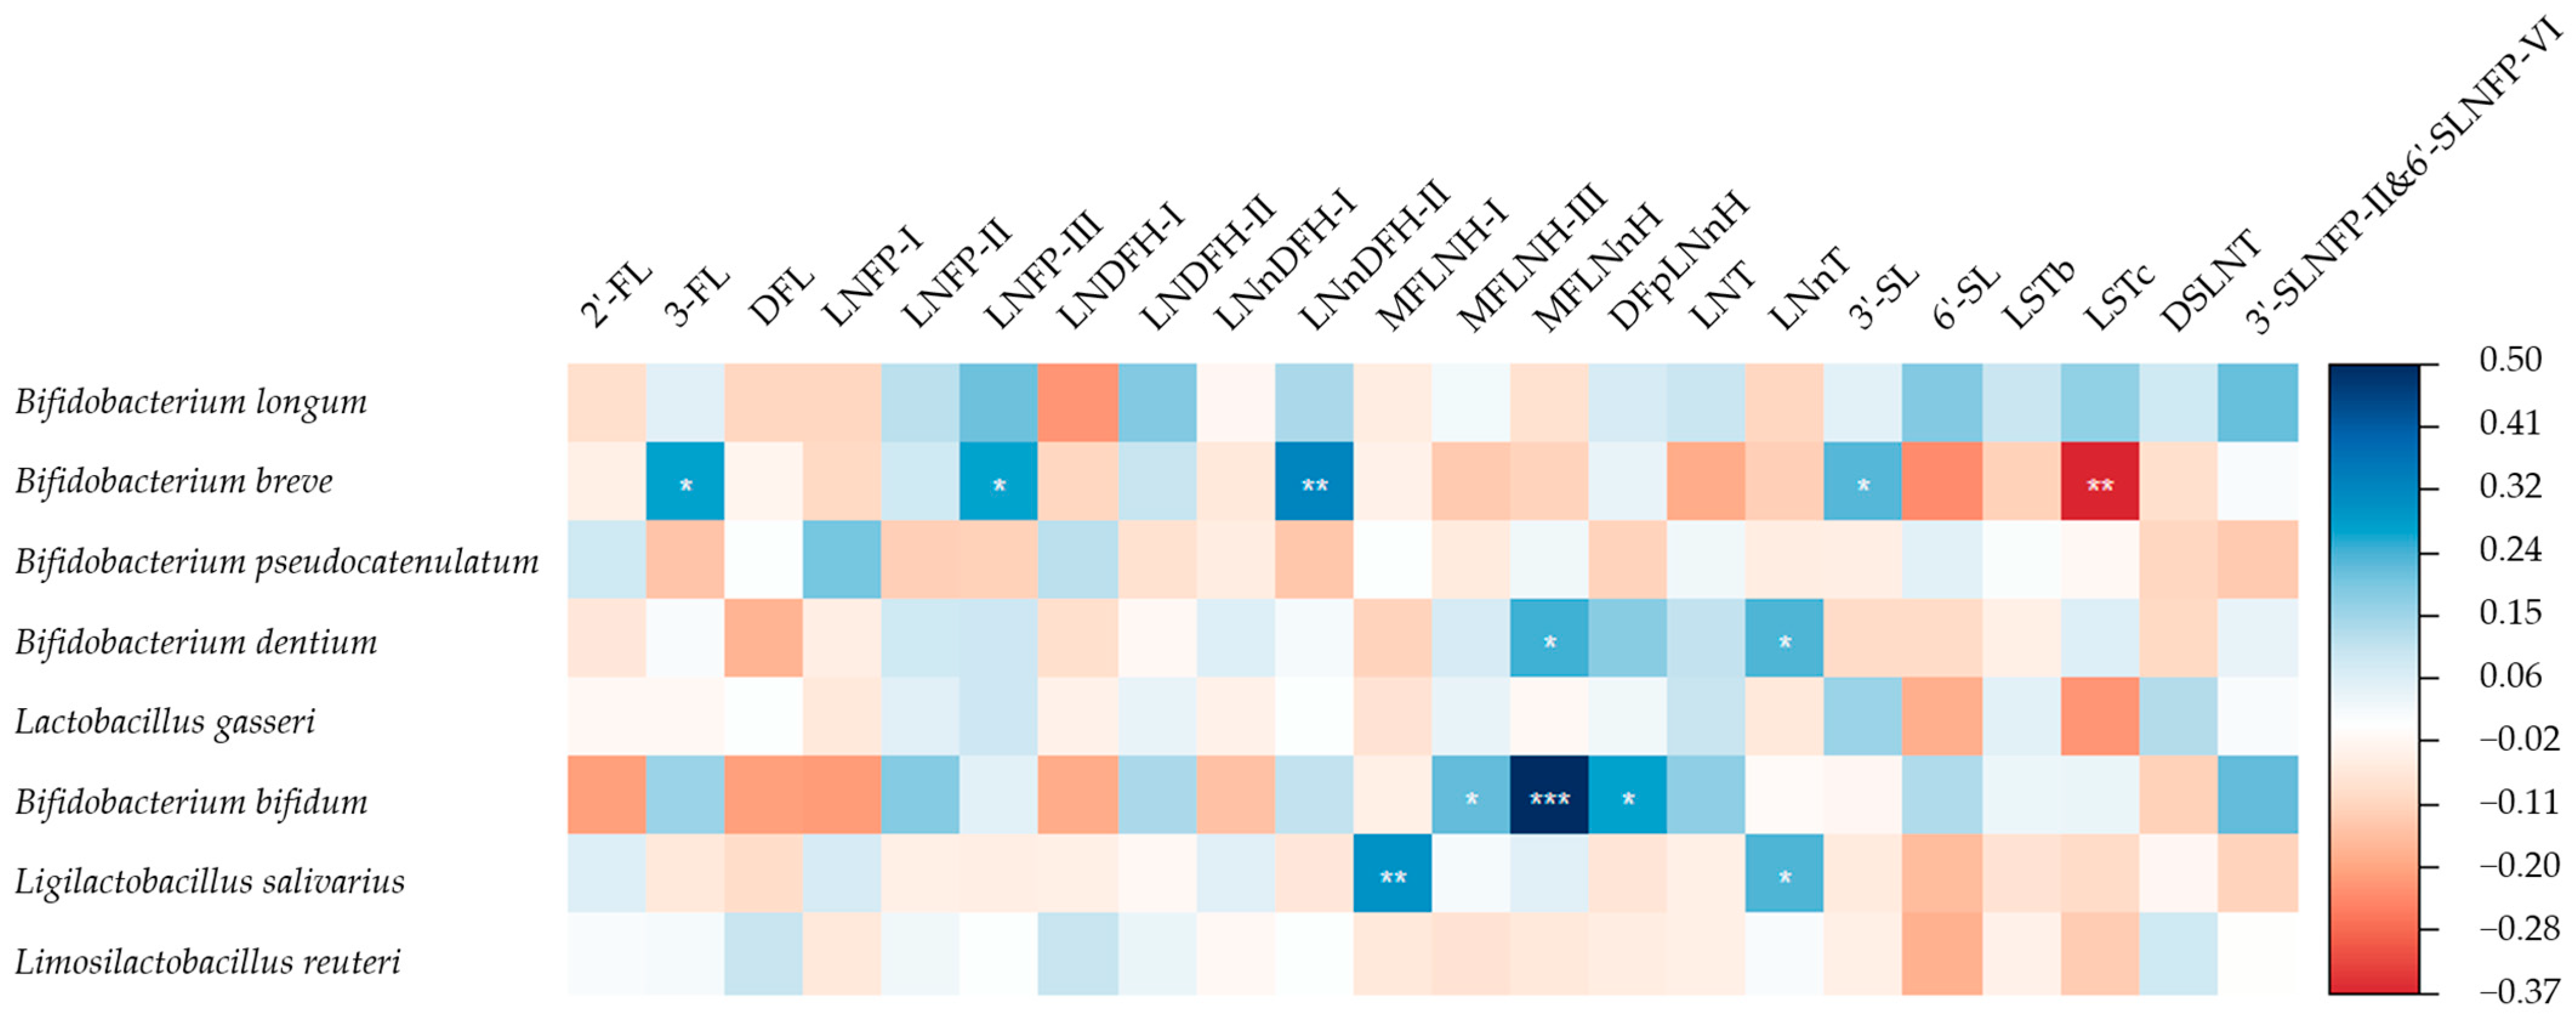
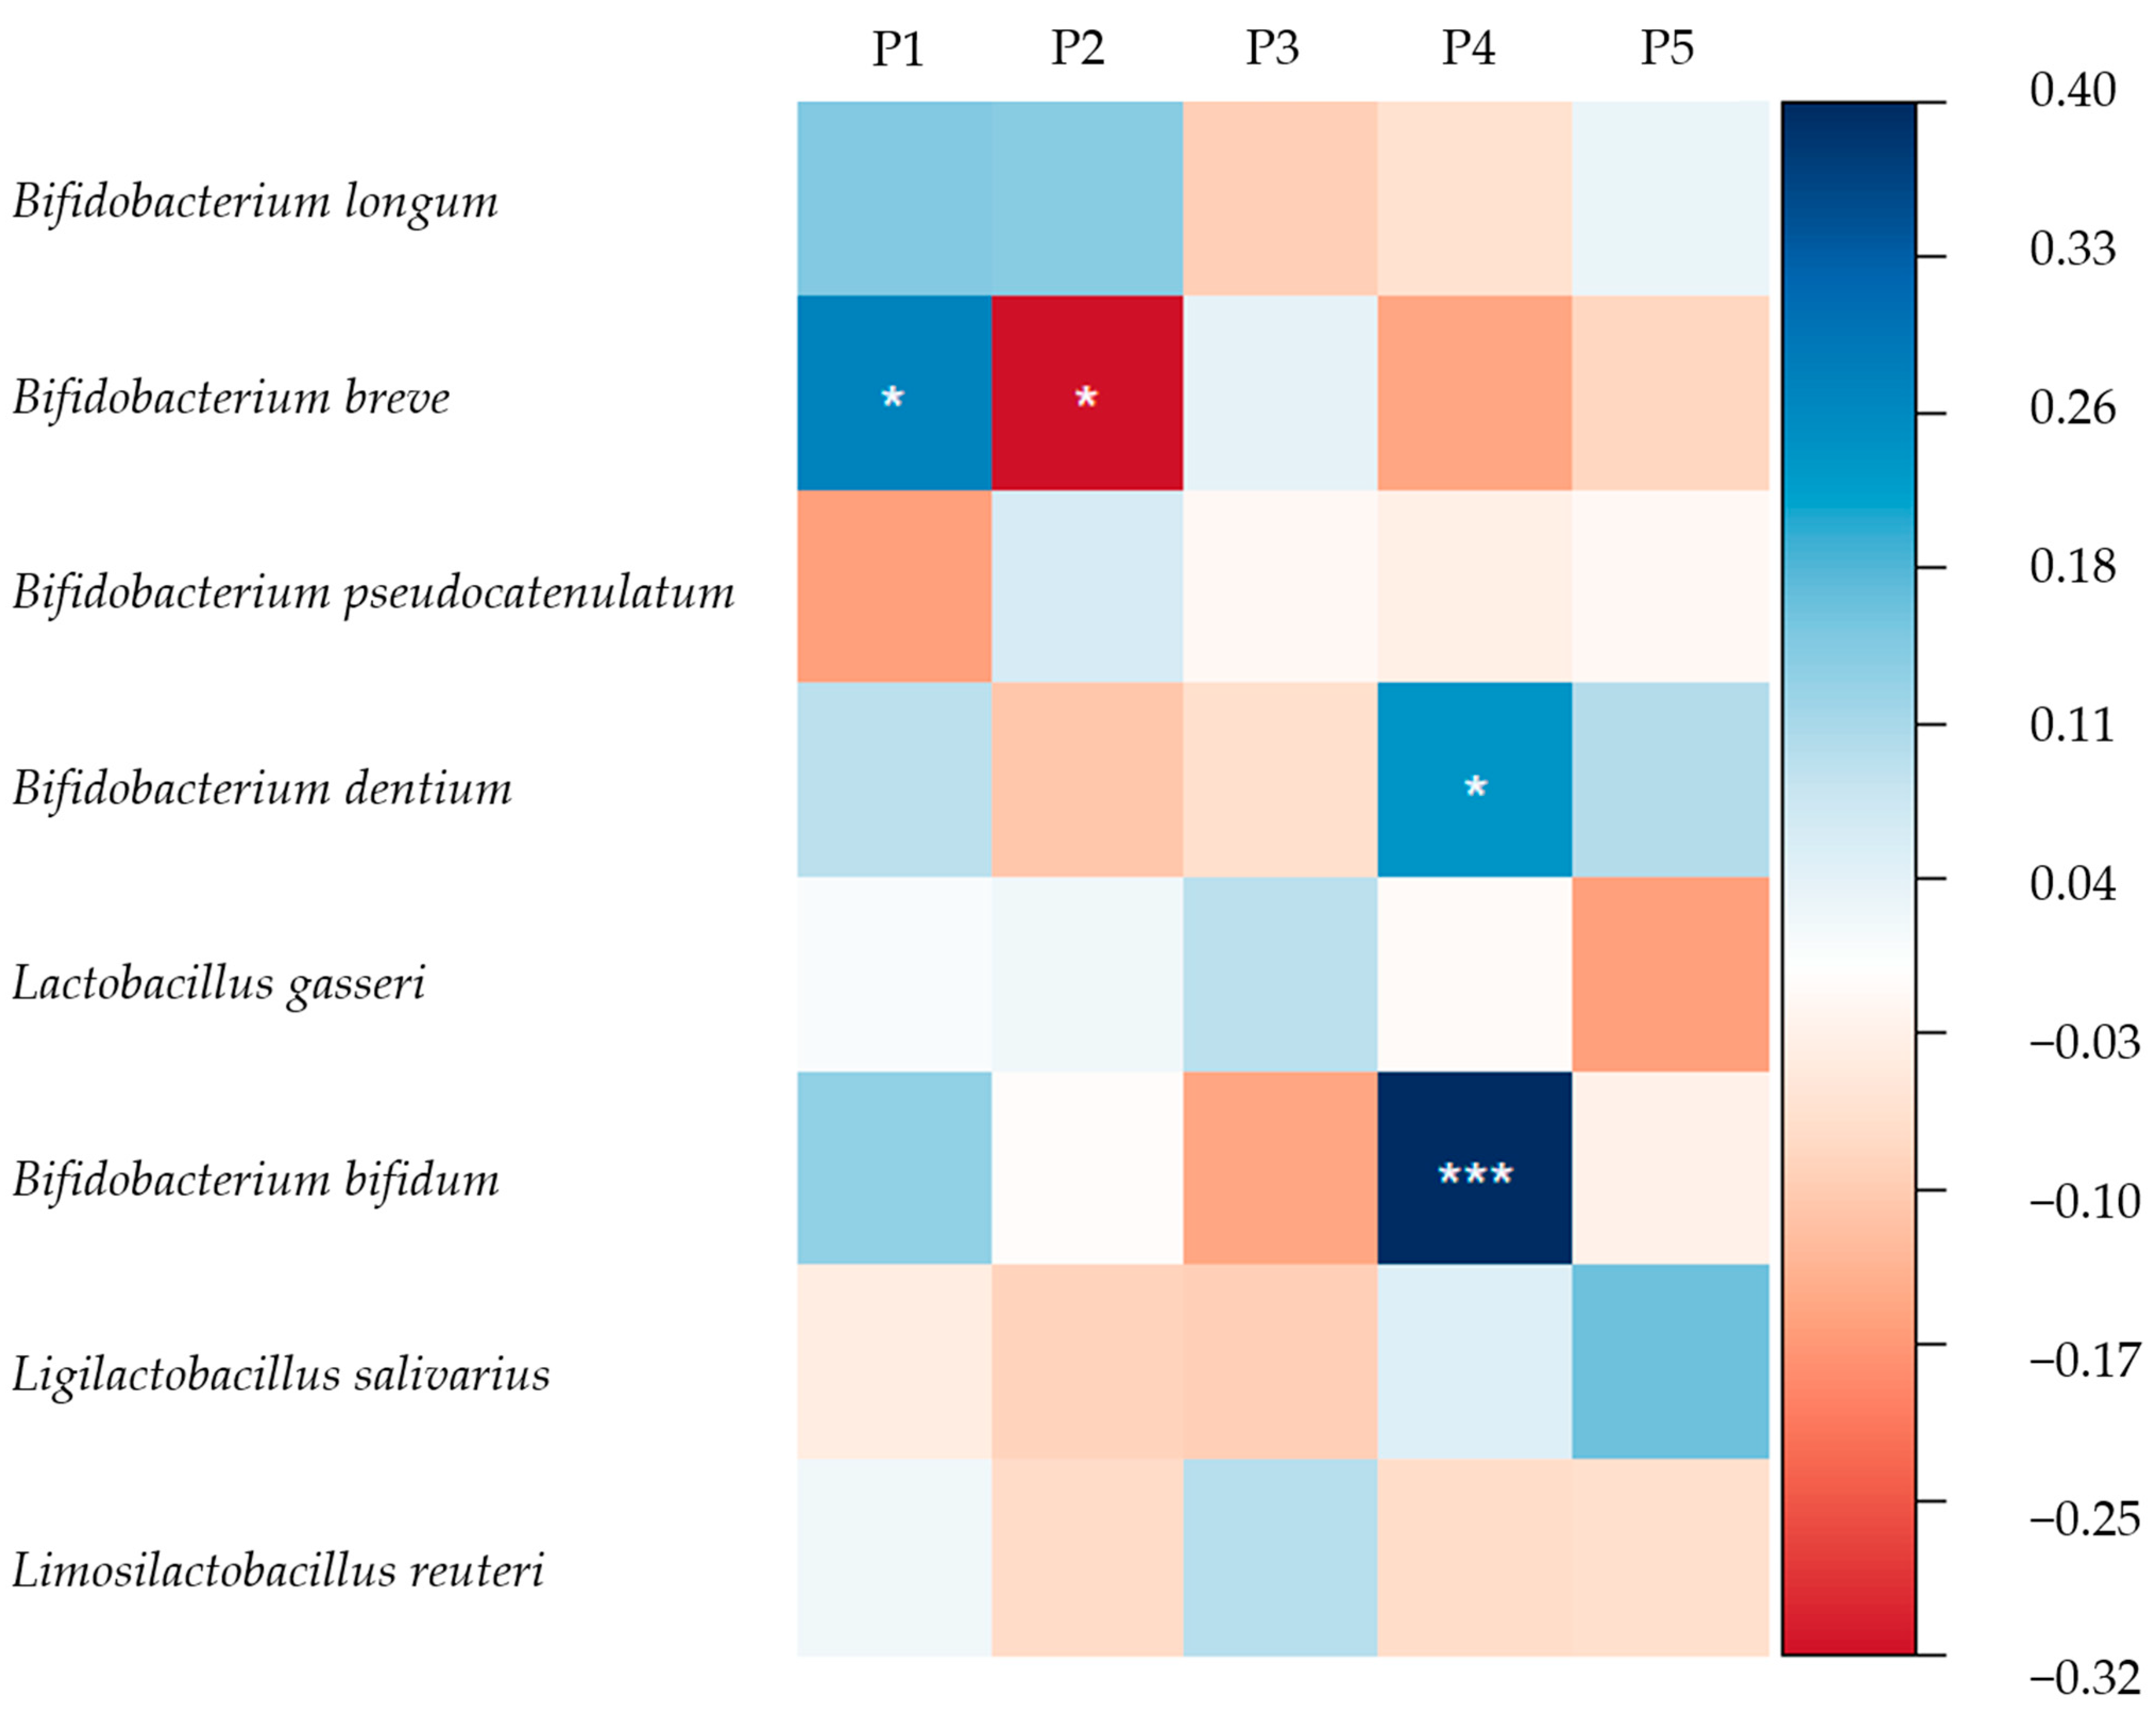
3.4. HMOs and the Gut Microbiome of Breastfed Infants

Firstly, we explored the association between maternal secretor phenotype and the eight most abundant infant gut Bifidobacterium and Lactobacilli (Table 2).
After adjusting for city, maternal age, total concentration of HMOs, and delivery mode, the infants who were nourished by Se mothers were demonstrated to have a lower relative abundance of B. bifidum. The association between maternal secretor phenotype and the 15 most abundant infant gut microbiota except for Bifidobacterium and Lactobacilli were also explored (Supplemental Table S1). After adjustment, the infants who were nourished by Se mothers exhibited a lower relative abundance of Parabacteroides distasonis (P. distasonis).
The association between individual HMO concentrations and infant gut microbiota was then explored. As shown in Figure 1, when city, maternal age, total concentration of HMOs, and delivery mode were controlled for, the relative abundance of B. breve was positively associated with the concentrations of numerous HMOs including 3-FL, LNFP-III, LNnDFH-II, and 3′-SL, while it was negatively associated with LSTc. The relative abundance of Bifidobacterium dentium (B. dentium) was positively associated with the concentrations of MFLNnH and LNnT. The relative abundance of B. bifidum was positively associated with the concentrations of MFLNH-III, MFLNnH, and DFpLNnH. The relative abundance of Ligilactobacillus salivarius (Lgb. salivarius) was positively associated with the concentrations of MFLNH-I and LNnT. The result of the crude model is shown in Supplemental Figure S1.
The adjusted association between HMO concentrations and the 15 most common commensal bacteria in the infant gut was also explored and is shown in Figure 2. After adjustment, the relative abundance of E. coli, C. perfringens, Streptococcus salivarius (S. salivarius), Citrobacter freundii (C. freundii), Haemophilus parainfluenzae (H. parainfluenzae), Veillonella dispar (V. dispar), and Enterobacter aerogenes (E. aerogenes) were positively associated with the concentrations of LNFP-III, LNDFH-I, MFLNH-I, DFL, LSTc, LNDFH-II, and LNDFH-I, respectively. Meanwhile, the relative abundance of K. pneumoniae was negatively associated with the concentrations of LNDFH-II, DFpLNnH, and 3′-SLNFP-II&6′-SLNFP-VI. The relative abundance of V. dispar was negatively associated with the concentration of LNnT and the relative abundance of P. distasonis was negatively associated with the concentrations of DFL and LNDFH-I. The result of the crude model is shown in Supplemental Figure S2.
To explore how the HMO complex plays a role in mediating the infant gut microbiome, principal component analysis (PCA) was performed. With a varimax-rotation method, we drafted five different HMO patterns (Figure 3).
Pattern 1 (P1) was characterised by high levels of 3-FL, LNFP-II, LNFP-III, LNDFH-II, LNnDFH-II, DFpLNnH, and 3′-SLNFP-II&6′-SLNFP-VI as while as low levels of 2′-FL and LNFP-I. Pattern 2 (P2) was characterised by high levels of LNFP-II, LNT, 6′-SL, LSTb, LSTc, DSLNT, and 3′-SLNFP-II&6′-SLNFP-VI. Pattern 3 (P3) was characterised by high levels of DFL and LNDFH-I. Pattern 4 (P4) was characterised by high levels of MFLNH-III and MFLNnH. Pattern 5 (P5) was characterised by high levels of 2′-FL, LNFP-I, LNnDFH-I, MFLNH-I, LNnT, and LSTc. Altogether, these HMO patterns explained 78% of the total variances.
Subsequently, a general linear regression was conducted to explore the association between HMO pattern scores and the transformed relative abundance of infant gut microbiota. As shown in Figure 4, when city, maternal age, total concentration of HMOs, and delivery mode were controlled for, the relative abundance of B. breve was positively associated with the P1 score but negatively associated with the P2 score.
The relative abundances of B. dentium and B. bifidum were positively associated with the P4 score. The results of the crude model are shown in Supplemental Figure S3. As for other commensal bacteria in the infant gut (Figure 5), after adjustment, the relative abundances of C. freundii and E. aerogenes were positively associated with the P3 score, while P. distasonis abundance was negatively related with P3. The relative abundance of V. dispar was negatively associated with the P4 score. The results of the crude model are shown in Supplemental Figure S4.

4. Discussion

In this study, we explored the association of different levels and patterns of HMOs in mature milk with the composition of infant gut microbiota using paired maternal–infant data. To the best of our knowledge, this study is the first in a Chinese population to report certain patterns of HMOs other than the patterns induced by maternal Lewis gene or Secretor gene, might also contribute to the variation of infant gut microbiome. In particular, the HMO pattern characterised by high levels of 3-FL, LNFP-II, LNFP-III, LNDFH-II, LNnDFH-II, DFpLNnH, and 3′-SLNFP-II&6′-SLNFP-VI, as well as low levels of 2′-FL and LNFP-I, was positively associated with B. breve. The HMO pattern characterised by high levels of MFLNH-III and MFLNnH was positively associated with B. dentium and B. bifidum.

4.1. HMOs Concentrations

Previous studies have shown that there are two main types of genes that determine the differences in HMO concentration: the Lewis gene and the Secretor gene [14,32,33]. Due to limitations in sample accessibility and sample size, only the secretor phenotype of maternal subjects was identified based on the presence of 2′-FL, DFL, and LNFP-II in this study, and 72.9% of the maternal subjects were Se. Our results are similar to those of studies conducted in Liaoning (76.8%) [15] and Guangdong (77.0%) [17], but lower than those of a study that included Beijing, Xuchang, and Suzhou (81.0%) [16]. The higher concentration of total HMOs and α-1,2 glycosidic fucosylated HMOs in Se mothers has been well established in previous studies [24]. We observed a non-significantly higher total concentration of HMOs in nSe mothers and all of the α-1,2 glycosidic fucosylated HMOs concentrations were extremely low or below the LOD in nSe samples, while other fucosylated HMOs, except for MFLNnH, were higher in nSe mothers. A higher concentration of LNT in nSe mothers and a higher concentration of LNnT in Se mothers were observed in this study. Previous studies have yielded various results on the concentrations of LNT and LNnT in Se/nSe mothers. Wu et al. [17] reported no differences between maternal secretor phenotypes in 59 Chinese mother–infant dyads, while a study including 427 Canadian mother–infant dyads reported higher concentrations of LNT and LNnT in nSe mothers [24]. Regarding sialylated HMOs, higher concentrations of LSTb, DSLNT, and 3′-SLNFP-II&6′-SLNFP-VI were detected in nSe mothers in this study. Meanwhile, a higher concentration of LSTc in Se mothers, along with no significant difference in 3′-SL, 6′-SL, LSTb, and DSLNT, was reported by Wu et al. [17]. In addition to the influencing factors mentioned earlier (such as maternal age, geographic location, and parity), these inconsistent conclusions may also stem from heterogeneity in the study population and the biases caused by sampling methods.
In terms of nongenetic factors, the stage of milk maturation is one of the most important influencing factors. Previous studies have reported that the total concentration of HMOs in mature milk was approximately 5–20 g/L [34,35,36,37,38]. In our study, the mean of total concentration of HMOs was consistent with previous reports. For individual HMOs, 2′-FL was the most abundant HMOs in our study, which is also consistent with previous reports [20,39]. However, Zhang et al. [40] pointed out that 6′-SL was the most abundant HMO in Chinese mature milk from one-month postpartum. As mentioned, this difference might emerge from the hetero distribution of maternal and infant characteristics such as geographical location, maternal age, and parity between our study and theirs. Another momentous perspective is that, despite the similar procedures applied in the milk sample collection, the bias caused by the unidentical oligosaccharides standards used and the dissimilar approaches of HMO detection could impact the results [29,41]. It is interesting that a study using the high-performance anion-exchange chromatography-pulsed amperometric detector method detected 2′-FL in 99.8% of the Chinese milk samples [42]. Therefore, the detection method of HMOs, especially the impact of the detection limit of HMOs on the results, also calls for attention from researchers.
Few previous studies have been performed in China on patterns in HMOs other than the Se/nSe pattern. Using multiple factor analysis, Jiang et al. [43] drafted three mature milk factors that possessed apparent diversity compared to our results. In their study, 12 types of HMOs including 2′-FL, 3-FL, 3′-SL, 6′-SL, LNFP-I, LNFP-III, LNDFH-II, DSLNT, lacto-N-neohexaose (LNnH), LSTa, LSTb and LSTc were quantified and analysed. Factor 1 was positively associated with LNnH and LNDFH-II but negatively associated with 3′-SL. Factor 2 was positively associated with LNnH, sialyllacto-N-tetraose a (LSTa), LSTb, LSTc, 3-FL, and 2′-FL, but it was negatively associated with DSLNT. Factor 3 was positively associated with LSTc and LNFP-III and negatively associated with 2′-FL and 6′-SL. The distinct differences between their results and ours may be attributed to the different methods used to extract the patterns. Although both factor analysis and PCA are commonly applied to perform data dimension reduction, the result of the PCA method is a set of linearly uncorrelated variables generated though orthogonal transformation from the original data. And, in contrast with the factor analysis, such results could be artifacts of the method and may not actually reflect the biological phenomenon. In addition, the cities from which our samples and theirs (Chengdu, Guangzhou, Beijing, Weihai, Jinhua, and Lanzhou) were collected are not geographically consistent; the influence of geographic difference should be considered, as mentioned earlier [22]. Furthermore, the differences in quantity and methodology of HMO detection may also contribute to the discrepant results [29,41]. It is also of note that their study incorporated proteomics and lipidomics into the analysis, as well as HMOs, whereas our study presented patterns more concentrated on HMOs. The scarce and discordant nature of studies on HMO patterns in China demonstrates the need for more large-scaled studies with consistent analysis methods. Notably, Jiang et al. [43] did not delve into the impact of these HMO patterns on the infant gut microbiota.

4.2. Infant Gut Microbiota

Our result at phylum level is similar to that of Shang et al. [25]. However, in their study on vaginally delivered infants, the dominant microbiota at genus level were Bifidobacterium, Clostridium, Streptococcus, Bacteroides, Klebsiella, Veillonella, Lactobacilli, and Akkermansia. The differences might stem from the different delivery modes of the subjects. Previous studies had shown that for infants who underwent vaginal delivery, the gut was dominated by Bacteroides, Bifidobacterium, Parabacteroides, and Escherichia, while for infants who underwent cesarean section, Klebsiella, Clostridia, Enterobacter, Staphylococcus, and some opportunistic pathogens dominated [44]. Our study included both infants who underwent vaginal delivery and those who underwent cesarean section. Therefore, the dominant genera in our study included Escherichia Shigella, Bacteroides, and Bifidobacterium which were dominant in the vaginal-delivered infants, as well as C. sensu stricto 1 and Klebsiella that were dominant in cesarean-section-delivered infants.

4.3. Association of HMO Patterns in Mature Milk with Infant Gut Microbiota

HMOs, in the form of individual HMOs or the pattern defined by the maternal phenotype, have long been investigated for their functions in immunomodulation, intestinal barrier enhancement, prebiotic effects, anti-adhesion, and infant neurodevelopment [45,46]. Previous studies have demonstrated that HMOs can provide abundant fucose and lactose, thereby affecting the infant gut microbiota through direct energy supply and cross feeding [10].

4.3.1. Association of Se/nSe Pattern with Infant Gut Microbiota

The maternal secretor phenotype could determine the pattern of HMOs and subsequently influence the utilisation of HMOs by the infant gut microbiota. In this study, when cities, maternal age, delivery mode, and total concentration of HMOs were adjusted for, the infants who were nourished by Se mothers exhibited a lower relative abundance of B. bifidum compared to those nourished by nSe mothers. As the total HMO concentration was slightly higher in the nSe mothers than in the Se mothers, our results could be supported by those of Katoh et al. [47], who reported that B. bifidum possessed higher number of extracellular glycoside hydrolases for HMO degradation than other Bifidobacterium strains, and Hu et al. [48], who suggested that B. bifidum was able to metabolise most of the HMOs, while B. longum and B. breve mainly fed on LNT, LNnT (B. breve only), and lacto-N-biose I (LNB). It is of note that HMOs are not the only source of fucose in infants. In a recent study, researchers reported that the secretor phenotype of the infant subjects aged 6 to 9 weeks could affect the fucose content of their intestinal mucosa and thus regulate the composition of their gut microbiota. The study also suggested that the correlation between the gut microbiota of infants and their secretor phenotypes was stronger than that with their mothers’ secretor phenotypes [49]. A unanimous conclusion regarding the association between maternal secretor phenotype and infant gut microbiota is yet to be reached. The colonisation of Bifidobacterium in infants nourished by nSe mothers was shown to be delayed compared to those fed by Se mothers [50]. Wang et al. [46] suggested that the maternal secretor phenotype was not associated with the relative abundance of the gut microbiota, but infants fed by Se mothers exhibited a higher level of faecal 1,2-propanediol, which was produced by Bifidobacterium species in fermentation [51], compared to infants fed by nSe mothers. Meanwhile, Turpin et al. [27] suggested that for healthy infants, the secretor phenotype of their mothers was not associated with their gut microbiota composition, a finding supported by a study by Ramani et al. [28]. Hence, when it comes to application-oriented explorations, the association between HMO patterns other than a prior Se/nSe pattern and infant gut microbiota is an area of interest for future study.

4.3.2. Association of Other HMO Patterns with Infant Gut Microbiota

Beyond the Se/nSe pattern, recent progress in HMO synthesis has provided researchers and enterprises with more possibilities for the combined use of HMOs [52]. We therefore performed PCA and drafted five HMO patterns which explained 78% of the total variances. After adjusting for cities, maternal age, delivery mode, and total HMO concentration, having a P1 pattern was positively associated with the relative abundance of B. breve, while the P2 pattern was negatively associated with B. breve. The B. breve count in colostrum samples was positively correlated to both LNFP-III and LSTc in a previous study [53]. Additionally, LNT was one of the representative HMOs in P2 and is known to be one of the major HMOs catabolised by B. breve in vitro [54]. However, a negative association between P2 and B. breve was observed in this study. The inconsistencies may indicate that other factors beyond HMOs such as host-secreted glycans [55] or colonisation order of the Bifidobacterium species [56] have a greater influence on the infant gut microbiota. Furthermore, other commensal microbiota such as Bacteroides and Lactobacilli also possess the ability to degrade HMOs [57] and the competitive colonisation between these genera may also have an impact on our results. The P4 pattern was positively associated with B. dentium and B. bifidum. These associations were consistent with the individual-level exploration in this study. The ability of B. dentium isolated from infant faeces to produce β-galactosidases hydrolysing LNT and LNnT has been demonstrated in vitro [58], and the structural similarities of MFLNH-III with LNT and MFLNnH with LNnT might contribute to the explanation of our results. The broad HMO metabolic spectrum of B. bifidum was mentioned previously, but the mechanism of its unique association with MFLNH-III, MFLNnH, and DFpLNnH in this study is yet to be examined. Moreover, the pathways deployed by Bifidobacterium to degrade HMOs differed at the species and even strain level [59,60]. Given that the sequencing method used in this study was unable to reach the strain level, the impact of strain-level differences on the results also requires consideration. And again, it is vital to underline the statistically generated nature of the results of PCA, which may lead to misinterpretations and inappropriate presentation of the associations of the HMO patterns we drafted with infant gut microbiota.
At present, HMOs such as 2′-FL and LNnT have been approved for use in infant formula in countries and regions across the world [61]. Given that HMOs ingested by infants through breast milk are, in fact, a complex of structurally similar and diverse oligosaccharides rather than individual HMOs, exploring the association between specific HMO patterns and infant gut microbiota could provide additional insights for subsequent research and commercial applications. Taken together, our results suggest that HMO patterns in mature milk, other than the Se/nSe pattern, are associated with certain gut microbiota, especially Bifidobacterium, in infants.

4.4. Strengths and Limitations

A strength of our study is that all infant subjects were exclusively breastfed by their mothers. A further strength is that our milk samples were collected at least one-month post-partum, so there is no confounding caused by the differences in HMOs between colostrum and mature milk. Moreover, we detected 23 types of HMOs and explored how the HMO complex, in the form of the prior Se/nSe pattern and the five posteriori patterns, plays a role in mediating the infant gut microbiome, providing future studies and applications of combined usage of HMOs with a potential direction.
There are several limitations to this study. Firstly, as a cross-sectional study, we could only estimate a recent association between HMOs and the infant gut microbiota. The time window in which HMOs affect the infant gut microbiota should be further determined. Secondly, there are residual confounders that may affect the results; other deep-seated drivers of HMOs patterns, therefore, require more attention. Thirdly, the 16SRNA method could at best determine the species level; the impact of strain-level differences on the results therefore also needs to be considered. Prospective studies with larger sample sizes and more precise sequencing methods such as metagenome are required to confirm the results of this study.

5. Conclusions

In conclusion, the association of different levels and patterns of HMOs in mature milk with the composition of the infant gut microbiota was explored in this study. Our results suggest that certain HMO patterns contribute to variation in the infant gut microbiome. Particularly, infants who were nourished by Se mothers exhibited a lower relative abundance of B. bifidum. The HMOs pattern characterised by high levels of 3-FL, LNFP-II, LNFP-III, LNDFH-II, LNnDFH-II, DFpLNnH, and 3′-SLNFP-II&6′-SLNFP-VI as well as low levels of 2′-FL and LNFP-I was positively associated with the relative abundance of B. breve. Furthermore, the HMO pattern characterised by high levels of MFLNH-III and MFLNnH was positively associated with the relative abundance of B. dentium and B. bifidum. Such results provide future studies and applications of combined usage of HMOs with a potential direction.

Supplementary Materials

The following supporting information can be downloaded at: https://www.mdpi.com/article/10.3390/nu16091287/s1, Table S1. Association between maternal secretor phenotype and commensal bacteria; Figure S1. Standardised coefficients between individual HMO concentrations and relative abundance of Bifidobacterium and Lactobacilli in crude model; Figure S2. Standardised coefficients between individual HMO concentrations and relative abundance of commensal bacteria; Figure S3. Standardised coefficients between HMO pattern scores and relative abundance of Bifidobacterium and Lactobacilli in crude model, Figure S4. Standardised coefficients between HMO pattern scores and relative abundance of commensal bacteria.

Author Contributions

Conceptualization, S.M., H.J. and Y.Z.; methodology, S.M., A.Z., J.Y. and Y.Z.; software, S.M. and W.Z.; validation, Y.Z., A.Z. and Y.X.; formal analysis, S.M.; investigation, S.M., W.Z. and A.Z.; resources, Y.Z.; data curation, S.M.; writing—original draft preparation, S.M.; writing—review and editing, A.Z., Y.Z., H.J., J.Y. and Y.X.; visualization, S.M.; supervision, Y.Z.; project administration, H.J., Y.Z., A.Z., Y.X. and J.Y.; funding acquisition, Y.Z. All authors have read and agreed to the published version of the manuscript.

Funding

Funding for this study was provided by the 14th Five Year Plan for the National Key Research and Development Program of China, Grant/Award Number: 2022YFD2101500 and the 13th Five Year Plan for the National Key Research and Development Program of China, Grant/Award Number: 2017YFD0400602.

Institutional Review Board Statement

The study was carried out in accordance with the Declaration of Helsinki and has been approved by the Medical Ethics Research Board of Peking University (No. IRB00001052-19040, approved on 13 May 2019).

Informed Consent Statement

Informed consent was obtained from all subjects involved in the study.

Data Availability Statement

The data presented in this study are available on request from the corresponding author. The data are not publicly available due to ethical requirements.

Acknowledgments

We would like to thank all our colleagues and subjects for cooperating.

Conflicts of Interest

We declare that we have no financial and personal relationships with other people or organizations that can inappropriately influence our work.

Appendix A

Table A1. Distribution of HMOs across maternal age groups (mg/L).
HMOs≤30 (n = 42)>30 (n = 54)p
2′-FL a954.5 (0.0, 1730.6)1685.8 (1278.1, 2097.3)0.011 a
3-FL a911.2 (358.4, 1475.9)514.3 (339.9, 740.8)0.063 a
DFL a95.4 (0.0, 214.2)211.6 (125.0, 260.2)0.002 a
LNFP-I a75.2 (0.0, 547.0)401.7 (168.8, 731.9)0.009 a
LNFP-II a290.8 (103.0, 883.9)168.4 (107.1, 345.0)0.234 a
LNFP-III a329.2 (258.5, 410.5)289.8 (229.1, 339.9)0.049 a
LNDFH-I a47.3 (0.0, 526.9)428.6 (298.0, 608.4)0.011 a
LNDFH-II a40.6 (0.0, 138.6)9.2 (0.0, 54.7)0.136 a
LNnDFH-I a14.1 (0.0, 29.3)27.1 (17.0, 36.9)0.006 a
LNnDFH-II a41.4 (21.1, 82.7)23.6 (16.8, 36.4)0.032 a
MFLNH-I a1.5 (0.0, 59.8)35.5 (10.9, 84.5)0.024 a
MFLNH-III a241.5 (153.1, 388.9)193.2 (120.1, 258.1)0.083 a
MFLNnH a97.7 (59.0, 183.0)96.9 (55.6, 152.9)0.679 a
DFpLNnH a171.2 (113.6, 282.6)124.3 (92.7, 183.0)0.045 a
LNT a556.1 (300.1, 899.3)456.8 (294.3, 687.8)0.305 a
LNnT a53.6 (32.1, 90.2)96.6 (54.6, 136.3)0.016 a
3′-SL a91.4 (81.8, 106.1)91.3 (83.5, 108.9)0.621 a
6′-SL a250.6 (185.5, 315.6)259.1 (156.0, 410.0)0.296 a
LSTb a53.7 (29.6, 77.2)50.7 (30.7, 73.5)0.805 a
LSTc b131.1 ± 64.6132.0 ± 57.20.945 b
DSLNT a208.5 (150.3, 306.4)184.1 (133.0, 286.7)0.545 a
3′-SLNFP-II&6′-SLNFP-VI a60.1 (29.2, 83.7)35.3 (25.3, 60.9)0.080 a
Sum b6025.8 ± 1417.06174.0 ± 1241.20.593 b
a: presented as median (P25, P75) and tested with Kruskall–Wallis test, b: presented as mean ± SD and tested with t-test, HMOs: human milk oligosaccharides, 2′-FL: 2′-fucosyllactose, 3-FL: 3-fucosyllactose, DFL: difucosyllactose, LNFP-I: lacto-N-fucopentaose I, LNFP-II: lacto-N-fucopentaose II, LNFP-III: lacto-N-fucopentaose III, LNDFH-I: lacto-N-difucohexaose I, LNDFH-II: lacto-N-difucohexaose II, LNnDFH-I: lacto-N-neodifucohexaose I, LNnDFH-II: lacto-N-neodifucohexaose II, MFLNH-I: monofu-cosyl-lacto-N-hexaose I, MFLNH-III: monofucosyl-lacto-N-hexaose III, MFLNnH: monofucosyl-lacto-N-neohexaose, DFpLNnH: difucosyl-para-lacto-N-neohexaose, LNT: lac-to-N-tetraose, LNnT: lacto-N-neotetraose, 3′-SL: 3′-sialyllactose, 6′-SL: 6′-sialyllactose, LSTb: sialyllacto-N-tetraose b, LSTc: sialyllacto-N-tetraose c, DSLNT: disialyllac-to-N-tetraose, 3′-SLNFP-II: 3-sialyl-latco-N-fucopentaose II, 6′-SLNFP-VI: 6-sialyl-latco-N-fucopentaose VI, Sum: total concentration of the HMOs detected.
Table A2. Distribution of HMOs across cities (mg/L).
HMOsChengdu (n = 15)Guangzhou (n = 10)Hohhot (n = 14)Suzhou (n = 18)Beijing (n = 39)p
2′-FL a0.0 (0.0, 1687.1)1378.7 (1005.0, 2336.0)1445.2 (298.4, 1588.5)1529.6 (800.5, 1758.4)1882.3 (940.4, 2170.3)0.224 a
3-FL a612.9 (376.1, 1416.1)694.5 (390.0, 885.3)867.4 (587.8, 1521.9)550.2 (338.8, 1072.2)454.7 (302.9, 894.3)0.066 a
DFL a0.0 (0.0, 178.7)202.2 (51.2, 242.5)217.6 (47.0, 296.9)201.3 (104.8, 254.8)143.5 (64.2, 244.0)0.224 a
LNFP-I a0.0 (0.0, 441.8)196.9 (62.5, 781.8)153.7 (7.2, 280.6)320.3 (87.7, 688.5)558.2 (179.1, 803.9)0.025 a
LNFP-II a418.9 (112.4, 936.9)144.1 (105.9, 490.0)268.9 (163.3, 476.3)165.7 (98.8, 256.6)230.2 (98.9, 405.0)0.516 a
LNFP-III a371.0 (330.0, 407.0)299.4 (279.3, 330.8)319.6 (281.0, 390.1)241.6 (193.5, 313.5)281.2 (231.2, 374.5)0.010 a
LNDFH-I a39.1 (21.5, 482.3)335.4 (69.5, 623.0)458.7 (116.1, 599.5)312.0 (55.0, 433.4)411.8 (0.0, 636.7)0.795 a
LNDFH-II a10.5 (0.0, 172.9)0.0 (0.0, 43.1)23.2 (3.5, 103.0)26.9 (7.8, 50.7)0.0 (0.0, 114.2)0.715 a
LNnDFH-I a0.0 (0.0, 26.3)17.5 (8.8, 21.1)19.2 (3.9, 25.8)18.9 (4.6, 27.5)32.9 (14.9, 42.4)0.065 a
LNnDFH-II a38.7 (20.2, 78.2)25.7 (17.0, 35.0)41.4 (25.3, 82.4)24.8 (11.0, 43.7)33.5 (17.0, 45.4)0.175 a
MFLNH-I a0.0 (0.0, 30.1)13.0 (2.7, 36.7)21.1 (0.0, 53.2)13.9 (0.0, 86.5)56.5 (5.4, 119.2)0.109 a
MFLNH-III a195.3 (161.4, 400.4)224.9 (147.1, 254.1)237.3 (172.5, 307.6)133.1 (96.4, 174.3)222.3 (174.1, 282.2)0.079 a
MFLNnH a97.6 (74.2, 129.2)94.2 (82.8, 119.9)154.7 (97.1, 217.8)70.8 (53.5, 109.5)119.3 (47.2, 179.6)0.321 a
DFpLNnH a152.3 (119.0, 284.5)121.0 (84.8, 135.4)183.4 (134.1, 220.9)98.9 (84.4, 159.7)139.9 (98.2, 219.5)0.142 a
LNT a605.9 (430.6, 839.5)307.6 (271.2, 393.0)399.4 (266.2, 553.5)420.8 (296.2, 613.8)650.0 (324.6, 933.8)0.059 a
LNnT a52.7 (22.5, 113.5)54.5 (30.5, 82.4)85.0 (30.3, 102.9)82.0 (50.9, 129.3)86.0 (48.0, 136.1)0.479 a
3′-SL a102.2 (85.8, 119.2)90.9 (83.3, 104.8)84.9 (73.1, 95.3)87.4 (82.7, 100.4)94.9 (82.3, 112.1)0.535 a
6′-SL a225.5 (153.8, 279.5)240.3 (113.7, 254.4)206.9 (133.1, 290.4)199.4 (144.1, 288.8)361.6 (259.1, 447.1)<0.001 a
LSTb a66.6 (42.5, 82.9)35.1 (27.9, 48.9)47.2 (17.3, 54.5)40.0 (24.8, 54.6)64.8 (40.3, 83.2)0.009 a
LSTc b147.6 ± 59.9110.5 ± 56.0122.7 ± 70.7105.0 ± 60.0146.3 ± 53.70.074 b
DSLNT a235.3 (201.0, 431.9)197.0 (140.8, 288.9)186.2 (123.9, 281.7)126.4 (79.9, 178.4)203.2 (166.5, 325.6)0.002 a
3′-SLNFP-II&6′-SLNFP-VI a59.4 (32.4, 83.1)31.2 (22.6, 59.4)45.8 (27.1, 60.8)32.2 (23.7, 39.8)54.4 (33.1, 82.0)0.065 a
Sum b5833.8 ± 1050.76003.8 ± 1692.35893.3 ± 1161.25271.4 ± 1122.46706.2 ± 1212.80.002 b
a: presented as median (P25, P75) and tested with Kruskall–Wallis test, b: presented as mean ± SD and tested with t-test, HMOs: human milk oligosaccharides, 2′-FL: 2′-fucosyllactose, 3-FL: 3-fucosyllactose, DFL: difucosyllactose, LNFP-I: lacto-N-fucopentaose I, LNFP-II: lacto-N-fucopentaose II, LNFP-III: lacto-N-fucopentaose III, LNDFH-I: lacto-N-difucohexaose I, LNDFH-II: lacto-N-difucohexaose II, LNnDFH-I: lacto-N-neodifucohexaose I, LNnDFH-II: lacto-N-neodifucohexaose II, MFLNH-I: monofu-cosyl-lacto-N-hexaose I, MFLNH-III: monofucosyl-lacto-N-hexaose III, MFLNnH: monofucosyl-lacto-N-neohexaose, DFpLNnH: difucosyl-para-lacto-N-neohexaose, LNT: lac-to-N-tetraose, LNnT: lacto-N-neotetraose, 3′-SL: 3′-sialyllactose, 6′-SL: 6′-sialyllactose, LSTb: sialyllacto-N-tetraose b, LSTc: sialyllacto-N-tetraose c, DSLNT: disialyllac-to-N-tetraose, 3′-SLNFP-II: 3-sialyl-latco-N-fucopentaose II, 6′-SLNFP-VI: 6-sialyl-latco-N-fucopentaose VI, Sum: total concentration of the HMOs detected.
Table A3. Distribution of HMOs across delivery modes (mg/L).
HMOsCaesarean (n = 29)Vaginal (n = 67)p
2′-FL a1743.1 (1221.7, 2188.1)1485.4 (0.0, 2037.2)0.212 a
3-FL a533.7 (324.9, 922.9)627.5 (363.8, 1133.1)0.478 a
DFL a210.8 (102.8, 253.6)143.5 (0.0, 246.7)0.348 a
LNFP-I a364.7 (135.2, 726.3)249.8 (0.0, 661.1)0.496 a
LNFP-II a175.3 (104.4, 445.9)229.5 (108.3, 728.8)0.607 a
LNFP-III a280.8 (243.5, 350.8)311.6 (235.0, 381.9)0.555 a
LNDFH-I a473.4 (303.8, 593.5)314.6 (7.6, 536.5)0.064 a
LNDFH-II a6.7 (0.0, 55.6)29.4 (0.0, 123.7)0.165 a
LNnDFH-I a27.2 (17.6, 34.9)19.1 (0.0, 35.2)0.310 a
LNnDFH-II a30.4 (18.9, 52.6)33.5 (16.8, 53.6)0.823 a
MFLNH-I a37.4 (0.0, 105.3)16.4 (0.0, 64.4)0.084 a
MFLNH-III a191.2 (168.1, 304.9)196.4 (127.9, 301.6)0.681 a
MFLNnH a145.4 (95.2, 182.7)89.5 (50.4, 148.1)0.013 a
DFpLNnH a133.2 (99.2, 205.9)139.0 (95.3, 225.0)0.883 a
LNT a498.1 (307.3, 644.8)456.3 (293.9, 859.1)0.563 a
LNnT a89.5 (59.8, 136.6)66.4 (36.8, 120.5)0.206 a
3′-SL a94.9 (87.5, 119.7)88.2 (80.6, 106.5)0.070 a
6′-SL a312.7 (196.7, 436.9)248.4 (155.5, 347.9)0.065 a
LSTb a51.1 (29.5, 67.0)51.8 (30.5, 77.1)0.753 a
LSTc b157.1 ± 65.6120.6 ± 54.70.012 b
DSLNT a189.5 (157.0, 273.1)197.5 (129.3, 312.7)0.820 a
3′-SLNFP-II&6′-SLNFP-VI a40.9 (33.1, 64.3)39.2 (25.1, 74.6)0.555 a
Sum b6258.1 ± 1150.86044.7 ± 1384.40.437 b
a: presented as median (P25, P75) and tested with Kruskall–Wallis test, b: presented as mean ± SD and tested with t-test, HMOs: human milk oligosaccharides, 2′-FL: 2′-fucosyllactose, 3-FL: 3-fucosyllactose, DFL: difucosyllactose, LNFP-I: lacto-N-fucopentaose I, LNFP-II: lacto-N-fucopentaose II, LNFP-III: lacto-N-fucopentaose III, LNDFH-I: lacto-N-difucohexaose I, LNDFH-II: lacto-N-difucohexaose II, LNnDFH-I: lacto-N-neodifucohexaose I, LNnDFH-II: lacto-N-neodifucohexaose II, MFLNH-I: monofu-cosyl-lacto-N-hexaose I, MFLNH-III: monofucosyl-lacto-N-hexaose III, MFLNnH: monofucosyl-lacto-N-neohexaose, DFpLNnH: difucosyl-para-lacto-N-neohexaose, LNT: lac-to-N-tetraose, LNnT: lacto-N-neotetraose, 3′-SL: 3′-sialyllactose, 6′-SL: 6′-sialyllactose, LSTb: sialyllacto-N-tetraose b, LSTc: sialyllacto-N-tetraose c, DSLNT: disialyllac-to-N-tetraose, 3′-SLNFP-II: 3-sialyl-latco-N-fucopentaose II, 6′-SLNFP-VI: 6-sialyl-latco-N-fucopentaose VI, Sum: total concentration of the HMOs detected.
Table A4. Distribution of HMOs across parity groups (mg/L).
HMOsPrimipara (n = 71)Multipara (n = 25)p
2′-FL a1568.0 (0.0, 2127.4)1336.0 (1139.2, 1700.1)0.495
3-FL a588.8 (360.4, 1168.3)518.8 (317.9, 754.4)0.341
DFL a177.1 (0.0, 257.0)167.6 (102.8, 240.5)0.960
LNFP-I a271.8 (0.0, 662.9)404.5 (154.6, 705.8)0.441
LNFP-II a229.5 (98.8, 728.8)167.9 (134.3, 418.9)0.809
LNFP-III a303.8 (238.2, 374.5)300.4 (232.4, 378.9)0.764
LNDFH-I a338.0 (11.9, 550.5)394.6 (288.5, 556.7)0.297
LNDFH-II a22.0 (0.0, 123.7)11.4 (0.0, 55.6)0.724
LNnDFH-I a20.7 (0.0, 35.1)20.2 (6.8, 34.9)0.983
LNnDFH-II a33.7 (18.4, 56.7)28.8 (15.7, 36.7)0.236
MFLNH-I a25.6 (0.0, 72.9)24.5 (2.2, 84.8)0.426
MFLNH-III a196.4 (132.9, 298.0)191.2 (157.9, 313.7)0.726
MFLNnH a96.5 (54.9, 173.3)111.1 (59.9, 155.9)0.943
DFpLNnH a139.9 (99.5, 225.6)129.6 (86.9, 142.9)0.299
LNT a445.3 (280.1, 700.7)675.5 (413.3, 804.4)0.130
LNnT a69.7 (39.2, 113.6)107.1 (47.5, 142.6)0.151
3′-SL a94.3 (82.7, 112.1)85.9 (79.6, 101.2)0.092
6′-SL a266.6 (175.6, 377.6)248.8 (155.5, 369.4)0.475
LSTb a51.1 (28.2, 71.0)54.9 (39.1, 83.2)0.172
LSTc b131.9 ± 58.1130.6 ± 67.40.932
DSLNT a197.5 (145.9, 306.0)184.1 (132.3, 266.6)0.673
3′-SLNFP-II&6′-SLNFP-VI a40.9 (28.5, 77.0)36.4 (23.9, 61.4)0.455
Sum b6163.2 ± 1267.95955.8 ± 1460.30.532
a: presented as median (P25, P75) and tested with Kruskall–Wallis test, b: presented as mean ± SD and tested with t-test, HMOs: human milk oligosaccharides, 2′-FL: 2′-fucosyllactose, 3-FL: 3-fucosyllactose, DFL: difucosyllactose, LNFP-I: lacto-N-fucopentaose I, LNFP-II: lacto-N-fucopentaose II, LNFP-III: lacto-N-fucopentaose III, LNDFH-I: lacto-N-difucohexaose I, LNDFH-II: lacto-N-difucohexaose II, LNnDFH-I: lacto-N-neodifucohexaose I, LNnDFH-II: lacto-N-neodifucohexaose II, MFLNH-I: monofu-cosyl-lacto-N-hexaose I, MFLNH-III: monofucosyl-lacto-N-hexaose III, MFLNnH: monofucosyl-lacto-N-neohexaose, DFpLNnH: difucosyl-para-lacto-N-neohexaose, LNT: lac-to-N-tetraose, LNnT: lacto-N-neotetraose, 3′-SL: 3′-sialyllactose, 6′-SL: 6′-sialyllactose, LSTb: sialyllacto-N-tetraose b, LSTc: sialyllacto-N-tetraose c, DSLNT: disialyllac-to-N-tetraose, 3′-SLNFP-II: 3-sialyl-latco-N-fucopentaose II, 6′-SLNFP-VI: 6-sialyl-latco-N-fucopentaose VI, Sum: total concentration of the HMOs detected.

References

  1. WHO. Breastfeeding-Recommendations; WHO: Geneva, Switzerland, 2022.
  2. Christian, P.; Smith, E.R.; Lee, S.E.; Vargas, A.J.; Bremer, A.A.; Raiten, D.J. The need to study human milk as a biological system. Am. J. Clin. Nutr. 2021, 113, 1063–1072. [Google Scholar] [CrossRef] [PubMed]
  3. Lonnerdal, B. Human Milk MicroRNAs/Exosomes: Composition and Biological Effects. In Human Milk: Composition, Clinical Benefits and Future Opportunities; Nestlé Nutrition Institute Workshop Series; Karger Publishers: Basel, Switzerland, 2019; Volume 90, pp. 83–92. [Google Scholar] [CrossRef]
  4. Kim, S.Y.; Yi, D.Y. Components of human breast milk: From macronutrient to microbiome and microRNA. Clin. Exp. Pediatr. 2020, 63, 301–309. [Google Scholar] [CrossRef] [PubMed]
  5. Vizzari, G.; Morniroli, D.; Ceroni, F.; Verduci, E.; Consales, A.; Colombo, L.; Cerasani, J.; Mosca, F.; Gianni, M.L. Human Milk, More Than Simple Nourishment. Children 2021, 8, 863. [Google Scholar] [CrossRef] [PubMed]
  6. Caba-Flores, M.D.; Ramos-Ligonio, A.; Camacho-Morales, A.; Martinez-Valenzuela, C.; Viveros-Contreras, R.; Caba, M. Breast Milk and the Importance of Chrononutrition. Front. Nutr. 2022, 9, 867507. [Google Scholar] [CrossRef] [PubMed]
  7. Zhang, Y.; Deng, Q.; Wang, J.; Wang, H.; Li, Q.; Zhu, B.; Ji, C.; Xu, X.; Johnston, L. The impact of breast milk feeding on early brain development in preterm infants in China: An observational study. PLoS ONE 2022, 17, e272125. [Google Scholar] [CrossRef]
  8. Binia, A.; Lavalle, L.; Chen, C.; Austin, S.; Agosti, M.; Al-Jashi, I.; Pereira, A.B.; Costeira, M.J.; Silva, M.G.; Marchini, G.; et al. Human milk oligosaccharides, infant growth, and adiposity over the first 4 months of lactation. Pediatr. Res. 2021, 90, 684–693. [Google Scholar] [CrossRef] [PubMed]
  9. Warren, C.D.; Chaturvedi, P.; Newburg, A.R.; Oftedal, O.T.; Tilden, C.D.; Newburg, D.S. Comparison of oligosaccharides in milk specimens from humans and twelve other species. Adv. Exp. Med. Biol. 2001, 501, 325–332. [Google Scholar] [CrossRef]
  10. Cheng, L.; Akkerman, R.; Kong, C.; Walvoort, M.; de Vos, P. More than sugar in the milk: Human milk oligosaccharides as essential bioactive molecules in breast milk and current insight in beneficial effects. Crit. Rev. Food Sci. Nutr. 2021, 61, 1184–1200. [Google Scholar] [CrossRef] [PubMed]
  11. Bode, L. Human milk oligosaccharides: Every baby needs a sugar mama. Glycobiology 2012, 22, 1147–1162. [Google Scholar] [CrossRef]
  12. Wicinski, M.; Sawicka, E.; Gebalski, J.; Kubiak, K.; Malinowski, B. Human Milk Oligosaccharides: Health Benefits, Potential Applications in Infant Formulas, and Pharmacology. Nutrients 2020, 12, 266. [Google Scholar] [CrossRef]
  13. Kunz, C.; Meyer, C.; Collado, M.C.; Geiger, L.; Garcia-Mantrana, I.; Bertua-Rios, B.; Martinez-Costa, C.; Borsch, C.; Rudloff, S. Influence of Gestational Age, Secretor, and Lewis Blood Group Status on the Oligosaccharide Content of Human Milk. J. Pediatr. Gastroenterol. Nutr. 2017, 64, 789–798. [Google Scholar] [CrossRef]
  14. Williams, J.E.; McGuire, M.K.; Meehan, C.L.; McGuire, M.A.; Brooker, S.L.; Kamau-Mbuthia, E.W.; Kamundia, E.W.; Mbugua, S.; Moore, S.E.; Prentice, A.M.; et al. Key genetic variants associated with variation of milk oligosaccharides from diverse human populations. Genomics 2021, 113, 1867–1875. [Google Scholar] [CrossRef] [PubMed]
  15. Bai, Y.; Tao, J.; Zhou, J.; Fan, Q.; Liu, M.; Hu, Y.; Xu, Y.; Zhang, L.; Yuan, J.; Li, W.; et al. Fucosylated Human Milk Oligosaccharides and N-Glycans in the Milk of Chinese Mothers Regulate the Gut Microbiome of Their Breast-Fed Infants during Different Lactation Stages. mSystems 2018, 3, e00206-18. [Google Scholar] [CrossRef] [PubMed]
  16. Wang, M.; Zhao, Z.; Zhao, A.; Zhang, J.; Wu, W.; Ren, Z.; Wang, P.; Zhang, Y. Neutral Human Milk Oligosaccharides Are Associated with Multiple Fixed and Modifiable Maternal and Infant Characteristics. Nutrients 2020, 12, 826. [Google Scholar] [CrossRef]
  17. Wu, J.; Wu, S.; Huo, J.; Ruan, H.; Xu, X.; Hao, Z.; Wei, Y. Systematic Characterization and Longitudinal Study Reveal Distinguishing Features of Human Milk Oligosaccharides in China. Curr. Dev. Nutr. 2020, 4, a113. [Google Scholar] [CrossRef] [PubMed]
  18. Castanys-Mu Oz, E.; Martin, M.J.; Prieto, P.A. 2′-fucosyllactose: An abundant, genetically determined soluble glycan present in human milk. Nutr. Rev. 2013, 71, 773–789. [Google Scholar] [CrossRef]
  19. Zhang, S.; Li, T.; Xie, J.; Zhang, D.; Pi, C.; Zhou, L.; Yang, W. Gold standard for nutrition: A review of human milk oligosaccharide and its effects on infant gut microbiota. Microb. Cell Factories 2021, 20, 108. [Google Scholar] [CrossRef] [PubMed]
  20. Soyyilmaz, B.; Miks, M.H.; Rohrig, C.H.; Matwiejuk, M.; Meszaros-Matwiejuk, A.; Vigsnaes, L.K. The Mean of Milk: A Review of Human Milk Oligosaccharide Concentrations throughout Lactation. Nutrients 2021, 13, 2737. [Google Scholar] [CrossRef]
  21. Huang, C.; Lu, Y.; Kong, L.; Guo, Z.; Zhao, K.; Xiang, Z.; Ma, X.; Gao, H.; Liu, Y.; Gao, Z.; et al. Human milk oligosaccharides in milk of mothers with term and preterm delivery at different lactation stage. Carbohydr. Polym. 2023, 321, 121263. [Google Scholar] [CrossRef]
  22. McGuire, M.K.; Meehan, C.L.; McGuire, M.A.; Williams, J.E.; Foster, J.; Sellen, D.W.; Kamau-Mbuthia, E.W.; Kamundia, E.W.; Mbugua, S.; Moore, S.E.; et al. What’s normal? Oligosaccharide concentrations and profiles in milk produced by healthy women vary geographically. Am. J. Clin. Nutr. 2017, 105, 1086–1100. [Google Scholar] [CrossRef]
  23. Dinleyici, M.; Barbieur, J.; Dinleyici, E.C.; Vandenplas, Y. Functional effects of human milk oligosaccharides (HMOs). Gut Microbes 2023, 15, 2186115. [Google Scholar] [CrossRef] [PubMed]
  24. Azad, M.B.; Robertson, B.; Atakora, F.; Becker, A.B.; Subbarao, P.; Moraes, T.J.; Mandhane, P.J.; Turvey, S.E.; Lefebvre, D.L.; Sears, M.R.; et al. Human Milk Oligosaccharide Concentrations Are Associated with Multiple Fixed and Modifiable Maternal Characteristics, Environmental Factors, and Feeding Practices. J. Nutr. 2018, 148, 1733–1742. [Google Scholar] [CrossRef]
  25. Shang, J.; Yang, S.; Meng, X. Correlations between oligosaccharides in breast milk and the composition of the gut microbiome in breastfed infants. J. Dairy Sci. 2022, 105, 4818–4828. [Google Scholar] [CrossRef] [PubMed]
  26. Siziba, L.P.; Mank, M.; Stahl, B.; Gonsalves, J.; Blijenberg, B.; Rothenbacher, D.; Genuneit, J. Human Milk Oligosaccharide Profiles over 12 Months of Lactation: The Ulm SPATZ Health Study. Nutrients 2021, 13, 1973. [Google Scholar] [CrossRef] [PubMed]
  27. Turpin, W.; Bedrani, L.; Espin-Garcia, O.; Xu, W.; Silverberg, M.S.; Smith, M.I.; Guttman, D.S.; Griffiths, A.; Moayyedi, P.; Panaccione, R.; et al. FUT2 genotype and secretory status are not associated with fecal microbial composition and inferred function in healthy subjects. Gut Microbes 2018, 9, 357–368. [Google Scholar] [CrossRef] [PubMed]
  28. Ramani, S.; Stewart, C.J.; Laucirica, D.R.; Ajami, N.J.; Robertson, B.; Autran, C.A.; Shinge, D.; Rani, S.; Anandan, S.; Hu, L.; et al. Human milk oligosaccharides, milk microbiome and infant gut microbiome modulate neonatal rotavirus infection. Nat. Commun. 2018, 9, 5010. [Google Scholar] [CrossRef] [PubMed]
  29. Li, J.; Bi, Y.; Zheng, Y.; Cao, C.; Yu, L.; Yang, Z.; Chai, W.; Yan, J.; Lai, J.; Liang, X. Development of high-throughput UPLC-MS/MS using multiple reaction monitoring for quantitation of complex human milk oligosaccharides and application to large population survey of secretor status and Lewis blood group. Food Chem. 2022, 397, 133750. [Google Scholar] [CrossRef]
  30. Xiao, C.; Wang, M.; Yang, X.; Sun, J.; Weng, L.; Qiu, Z. Rice Water-Fried Atractylodis Rhizoma Relieves Spleen Deficiency Diarrhea by Regulating the Intestinal Microbiome. Oxidative Med. Cell. Longev. 2023, 2023, 1983616. [Google Scholar] [CrossRef] [PubMed]
  31. Edgar, R.C. UPARSE: Highly accurate OTU sequences from microbial amplicon reads. Nat. Methods 2013, 10, 996–998. [Google Scholar] [CrossRef]
  32. Tonon, K.M.; de Morais, B.M.; Abrão, A.C.F.V.; Miranda, A.; Morais, T.B. Maternal and Infant Factors Associated with Human Milk Oligosaccharides Concentrations According to Secretor and Lewis Phenotypes. Nutrients 2019, 11, 1358. [Google Scholar] [CrossRef]
  33. Ferreira, A.L.; Alves, R.; Figueiredo, A.; Alves-Santos, N.; Freitas-Costa, N.; Batalha, M.; Yonemitsu, C.; Manivong, N.; Furst, A.; Bode, L.; et al. Human Milk Oligosaccharide Profile Variation Throughout Postpartum in Healthy Women in a Brazilian Cohort. Nutrients 2020, 12, 790. [Google Scholar] [CrossRef] [PubMed]
  34. Wang, J.; Chen, M.S.; Wang, R.S.; Hu, J.Q.; Liu, S.; Wang, Y.Y.; Xing, X.L.; Zhang, B.W.; Liu, J.M.; Wang, S. Current Advances in Structure-Function Relationships and Dose-Dependent Effects of Human Milk Oligosaccharides. J. Agric. Food Chem. 2022, 70, 6328–6353. [Google Scholar] [CrossRef] [PubMed]
  35. Xu, G.; Davis, J.C.; Goonatilleke, E.; Smilowitz, J.T.; German, J.B.; Lebrilla, C.B. Absolute Quantitation of Human Milk Oligosaccharides Reveals Phenotypic Variations during Lactation. J. Nutr. 2017, 147, 117–124. [Google Scholar] [CrossRef]
  36. Viverge, D.; Grimmonprez, L.; Cassanas, G.; Bardet, L.; Bonnet, H.; Solere, M. Variations of lactose and oligosaccharides in milk from women of blood types secretor A or H, secretor Lewis, and secretor H/nonsecretor Lewis during the course of lactation. Ann. Nutr. Metab. 1985, 29, 1–11. [Google Scholar] [CrossRef] [PubMed]
  37. Coppa, G.V.; Gabrielli, O.; Pierani, P.; Catassi, C.; Carlucci, A.; Giorgi, P.L. Changes in carbohydrate composition in human milk over 4 months of lactation. Pediatrics 1993, 91, 637–641. [Google Scholar] [CrossRef] [PubMed]
  38. Elwakiel, M.; Hageman, J.A.; Wang, W.; Szeto, I.M.; van Goudoever, J.B.; Hettinga, K.A.; Schols, H.A. Human Milk Oligosaccharides in Colostrum and Mature Milk of Chinese Mothers: Lewis Positive Secretor Subgroups. J. Agric. Food Chem. 2018, 66, 7036–7043. [Google Scholar] [CrossRef] [PubMed]
  39. Li, X.; Mao, Y.; Liu, S.; Wang, J.; Li, X.; Zhao, Y.; Hill, D.R.; Wang, S. Vitamins, Vegetables and Metal Elements Are Positively Associated with Breast Milk Oligosaccharide Composition among Mothers in Tianjin, China. Nutrients 2022, 14, 4131. [Google Scholar] [CrossRef]
  40. Zhang, W.; Vervoort, J.; Pan, J.; Gao, P.; Zhu, H.; Wang, X.; Zhang, Y.; Chen, B.; Liu, Y.; Li, Y.; et al. Comparison of twelve human milk oligosaccharides in mature milk from different areas in China in the Chinese Human Milk Project (CHMP) study. Food Chem. 2022, 395, 133554. [Google Scholar] [CrossRef]
  41. Zhang, W.; Wang, T.; Chen, X.; Pang, X.; Zhang, S.; Obaroakpo, J.U.; Shilong, J.; Lu, J.; Lv, J. Absolute quantification of twelve oligosaccharides in human milk using a targeted mass spectrometry-based approach. Carbohydr. Polym. 2019, 219, 328–333. [Google Scholar] [CrossRef]
  42. Liu, S.; Mao, Y.; Wang, J.; Tian, F.; Hill, D.R.; Xiong, X.; Li, X.; Zhao, Y.; Wang, S. Lactational and geographical variation in the concentration of six oligosaccharides in Chinese breast milk: A multicenter study over 13 months postpartum. Front. Nutr. 2023, 10, 1267287. [Google Scholar] [CrossRef]
  43. Jiang, S.; Pan, J.; Li, Y.; Ju, M.; Zhang, W.; Lu, J.; Lv, J.; Li, K. Comprehensive Human Milk Patterns Are Related to Infant Growth and Allergy in the CHMP Study. Mol. Nutr. Food Res. 2021, 65, e2100011. [Google Scholar] [CrossRef] [PubMed]
  44. Xiao, L.; Zhao, F. Microbial transmission, colonisation and succession: From pregnancy to infancy. Gut 2023, 72, 772–786. [Google Scholar] [CrossRef] [PubMed]
  45. Kiely, L.J.; Busca, K.; Lane, J.A.; van Sinderen, D.; Hickey, R.M. Molecular strategies for the utilisation of human milk oligosaccharides by infant gut-associated bacteria. FEMS Microbiol. Rev. 2023, 47, fuad056. [Google Scholar] [CrossRef] [PubMed]
  46. Wang, A.; Diana, A.; Rahmannia, S.; Gibson, R.S.; Houghton, L.A.; Slupsky, C.M. Impact of milk secretor status on the fecal metabolome and microbiota of breastfed infants. Gut Microbes 2023, 15, 2257273. [Google Scholar] [CrossRef] [PubMed]
  47. Katoh, T.; Ojima, M.N.; Sakanaka, M.; Ashida, H.; Gotoh, A.; Katayama, T. Enzymatic Adaptation of Bifidobacterium bifidum to Host Glycans, Viewed from Glycoside Hydrolyases and Carbohydrate-Binding Modules. Microorganisms 2020, 8, 481. [Google Scholar] [CrossRef] [PubMed]
  48. Hu, M.; Li, M.; Li, C.; Miao, M.; Zhang, T. Effects of Human Milk Oligosaccharides in Infant Health Based on Gut Microbiota Alteration. J. Agric. Food Chem. 2023, 71, 994–1001. [Google Scholar] [CrossRef] [PubMed]
  49. Thorman, A.W.; Adkins, G.; Conrey, S.C.; Burrell, A.R.; Yu, Y.; White, B.; Burke, R.; Haslam, D.; Payne, D.C.; Staat, M.A.; et al. Gut Microbiome Composition and Metabolic Capacity Differ by FUT2 Secretor Status in Exclusively Breastfed Infants. Nutrients 2023, 15, 471. [Google Scholar] [CrossRef] [PubMed]
  50. Lewis, Z.T.; Totten, S.M.; Smilowitz, J.T.; Popovic, M.; Parker, E.; Lemay, D.G.; Van Tassell, M.L.; Miller, M.J.; Jin, Y.S.; German, J.B.; et al. Maternal fucosyltransferase 2 status affects the gut bifidobacterial communities of breastfed infants. Microbiome 2015, 3, 13. [Google Scholar] [CrossRef]
  51. Bunesova, V.; Lacroix, C.; Schwab, C. Fucosyllactose and L-fucose utilization of infant Bifidobacterium longum and Bifidobacterium kashiwanohense. BMC Microbiol. 2016, 16, 248. [Google Scholar] [CrossRef]
  52. Zheng, J.; Xu, H.; Fang, J.; Zhang, X. Enzymatic and chemoenzymatic synthesis of human milk oligosaccharides and derivatives. Carbohydr. Polym. 2022, 291, 119564. [Google Scholar] [CrossRef]
  53. Aakko, J.; Kumar, H.; Rautava, S.; Wise, A.; Autran, C.; Bode, L.; Isolauri, E.; Salminen, S. Human milk oligosaccharide categories define the microbiota composition in human colostrum. Benef. Microbes 2017, 8, 563–567. [Google Scholar] [CrossRef] [PubMed]
  54. Ruiz-Moyano, S.; Totten, S.M.; Garrido, D.A.; Smilowitz, J.T.; German, J.B.; Lebrilla, C.B.; Mills, D.A. Variation in consumption of human milk oligosaccharides by infant gut-associated strains of Bifidobacterium breve. Appl. Environ. Microbiol. 2013, 79, 6040–6049. [Google Scholar] [CrossRef] [PubMed]
  55. Lordan, C.; Roche, A.K.; Delsing, D.; Nauta, A.; Groeneveld, A.; MacSharry, J.; Cotter, P.D.; van Sinderen, D. Linking human milk oligosaccharide metabolism and early life gut microbiota: Bifidobacteria and beyond. Microbiol. Mol. Biol. Rev. 2024, 88, e9423. [Google Scholar] [CrossRef] [PubMed]
  56. Ojima, M.N.; Jiang, L.; Arzamasov, A.A.; Yoshida, K.; Odamaki, T.; Xiao, J.; Nakajima, A.; Kitaoka, M.; Hirose, J.; Urashima, T.; et al. Priority effects shape the structure of infant-type Bifidobacterium communities on human milk oligosaccharides. ISME J. 2022, 16, 2265–2279. [Google Scholar] [CrossRef]
  57. Borewicz, K.; Gu, F.; Saccenti, E.; Arts, I.; Penders, J.; Thijs, C.; van Leeuwen, S.S.; Lindner, C.; Nauta, A.; van Leusen, E.; et al. Correlating Infant Fecal Microbiota Composition and Human Milk Oligosaccharide Consumption by Microbiota of 1-Month-Old Breastfed Infants. Mol. Nutr. Food Res. 2019, 63, e1801214. [Google Scholar] [CrossRef] [PubMed]
  58. Moya-Gonzalvez, E.M.; Rubio-Del-Campo, A.; Rodriguez-Diaz, J.; Yebra, M.J. Infant-gut associated Bifidobacterium dentium strains utilize the galactose moiety and release lacto-N-triose from the human milk oligosaccharides lacto-N-tetraose and lacto-N-neotetraose. Sci. Rep. 2021, 11, 23328. [Google Scholar] [CrossRef] [PubMed]
  59. Sakanaka, M.; Gotoh, A.; Yoshida, K.; Odamaki, T.; Koguchi, H.; Xiao, J.Z.; Kitaoka, M.; Katayama, T. Varied Pathways of Infant Gut-Associated Bifidobacterium to Assimilate Human Milk Oligosaccharides: Prevalence of the Gene Set and Its Correlation with Bifidobacteria-Rich Microbiota Formation. Nutrients 2019, 12, 71. [Google Scholar] [CrossRef] [PubMed]
  60. Katayama, T. Host-derived glycans serve as selected nutrients for the gut microbe: Human milk oligosaccharides and bifidobacteria. Biosci. Biotechnol. Biochem. 2016, 80, 621–632. [Google Scholar] [CrossRef]
  61. Kassai, S.; de Vos, P. Gastrointestinal barrier function, immunity, and neurocognition: The role of human milk oligosaccharide (hMO) supplementation in infant formula. Compr. Rev. Food Sci. Food Saf. 2024, 23, e13271. [Google Scholar] [CrossRef]
Figure 1. Standardised coefficients between individual HMO concentrations and relative abundance of Bifidobacterium and Lactobacilli. *: p < 0.05, **: p < 0.01, ***: p < 0.001. The eight most abundant infant gut microbiota from Bifidobacterium and Lactobacilli were explored. Adjusted for city, maternal age, total concentration of HMOs, and delivery mode. The relative abundance of infant gut microbiota was transformed in the form of lg (X + 1). 2′-FL: 2′-fucosyllactose, 3-FL: 3-fucosyllactose, DFL: difucosyllactose, LNFP-I: lacto-N-fucopentaose I, LNFP-II: lacto-N-fucopentaose II, LNFP-III: lacto-N-fucopentaose III, LNDFH-I: lacto-N-difucohexaose I, LNDFH-II: lacto-N-difucohexaose II, LNnDFH-I: lacto-N-neodifucohexaose I, LNnDFH-II: lacto-N-neodifucohexaose II, MFLNH-I: monofu-cosyl-lacto-N-hexaose I, MFLNH-III: monofucosyl-lacto-N-hexaose III, MFLNnH: monofucosyl-lacto-N-neohexaose, DFpLNnH: difucosyl-para-lacto-N-neohexaose, LNT: lac-to-N-tetraose, LNnT: lacto-N-neotetraose, 3′-SL: 3′-sialyllactose, 6′-SL: 6′-sialyllactose, LSTb: sialyllacto-N-tetraose b, LSTc: sialyllacto-N-tetraose c, DSLNT: disialyllac-to-N-tetraose, 3′-SLNFP-II: 3-sialyl-latco-N-fucopentaose II, 6′-SLNFP-VI: 6-sialyl-latco-N-fucopentaose VI, Sum: total concentration of the HMOs detected.
Nutrients 16 01287 g001
Figure 2. Standardised coefficients between individual HMO concentrations and the relative abundance of commensal bacteria. *: p < 0.05, **: p < 0.01. The 15 most abundant infant gut microbiota except for Bifidobacterium and Lactobacilli were explored. Adjusted for city, maternal age, total concentration of HMOs, and deliver mode. The relative abundance of infant gut microbiota was transformed in the form of lg (X + 1). 2′-FL: 2′-fucosyllactose, 3-FL: 3-fucosyllactose, DFL: difucosyllactose, LNFP-I: lacto-N-fucopentaose I, LNFP-II: lacto-N-fucopentaose II, LNFP-III: lacto-N-fucopentaose III, LNDFH-I: lacto-N-difucohexaose I, LNDFH-II: lacto-N-difucohexaose II, LNnDFH-I: lacto-N-neodifucohexaose I, LNnDFH-II: lacto-N-neodifucohexaose II, MFLNH-I: monofu-cosyl-lacto-N-hexaose I, MFLNH-III: monofucosyl-lacto-N-hexaose III, MFLNnH: monofucosyl-lacto-N-neohexaose, DFpLNnH: difucosyl-para-lacto-N-neohexaose, LNT: lac-to-N-tetraose, LNnT: lacto-N-neotetraose, 3′-SL: 3′-sialyllactose, 6′-SL: 6′-sialyllactose, LSTb: sialyllacto-N-tetraose b, LSTc: sialyllacto-N-tetraose c, DSLNT: disialyllac-to-N-tetraose, 3′-SLNFP-II: 3-sialyl-latco-N-fucopentaose II, 6′-SLNFP-VI: 6-sialyl-latco-N-fucopentaose VI, Sum: total concentration of the HMOs detected.
Nutrients 16 01287 g002
Figure 3. Factor loadings of different HMO patterns. Different colours indicate different patterns. HMOs with a factor loading of ≥0.5 or ≤−0.5 were taken as representative HMOs for each pattern and presented in bold font. P1–P5: HMOs Pattern 1–5. 2′-FL: 2′-fucosyllactose, 3-FL: 3-fucosyllactose, DFL: difucosyllactose, LNFP-I: lacto-N-fucopentaose I, LNFP-II: lacto-N-fucopentaose II, LNFP-III: lacto-N-fucopentaose III, LNDFH-I: lacto-N-difucohexaose I, LNDFH-II: lacto-N-difucohexaose II, LNnDFH-I: lacto-N-neodifucohexaose I, LNnDFH-II: lacto-N-neodifucohexaose II, MFLNH-I: monofucosyl-lacto-N-hexaose I, MFLNH-III: monofucosyl-lacto-N-hexaose III, MFLNnH: monofucosyl-lacto-N-neohexaose, DFpLNnH: difucosyl-para-lacto-N-neohexaose, LNT: lacto-N-tetraose, LNnT: lacto-N-neotetraose, 3′-SL: 3′-sialyllactose, 6′-SL: 6′-sialyllactose, LSTb: sialyllacto-N-tetraose b, LSTc: sialyllacto-N-tetraose c, DSLNT: disialyllacto-N-tetraose, 3′-SLNFP-II: 3-sialyl-latco-N-fucopentaose II, 6′-SLNFP-VI: 6-sialyl-latco-N-fucopentaose VI.
Nutrients 16 01287 g003
Figure 4. Standardised coefficients between HMO pattern scores and relative abundance of Bifidobacterium and Lactobacilli. *: p < 0.05, ***: p < 0.001. The eight most abundant infant gut microbiota from Bifidobacterium and Lactobacilli were explored. Adjusted for city, maternal age, total concentration of HMOs, and delivery mode. The relative abundance of infant gut microbiota was transformed in the form of lg (X + 1).
Nutrients 16 01287 g004
Figure 5. Standardised coefficients between HMO pattern scores and relative abundance of commensal bacteria. *: p < 0.05. The 15 most abundant infant gut microbiota except for Bifidobacterium and Lactobacilli were explored. Adjusted for city, maternal age, total concentration of HMOs, and delivery mode. The relative abundance of infant gut microbiota was transformed in the form of lg (X + 1).
Nutrients 16 01287 g005
Table 1. Distribution of HMOs across maternal secretor phenotypes (mg/L).
HMOsSe (n = 70)nSe (n = 26)p
2′-FL1760.5 (1405.0, 2188.3)--
3-FL a454.0 (317.3, 638.5)1522.7 (1181.0, 1871.8)<0.001
DFL216.4 (144.5, 271.7)--
LNFP-I447.3 (252.1, 804.5)--
LNFP-II a154.8 (94.0, 250.3)992.7 (834.9, 1191.8)<0.001
LNFP-III a281.0 (226.2, 335.2)403.5 (320.1, 464.8)<0.001
LNDFH-I a479.9 (318.5, 639.9)3.9 (0.0, 21.1)<0.001
LNDFH-II a0.0 (0.0, 35.2)179.7 (119.1, 328.2)<0.001
LNnDFH-I28.2 (19.1, 37.1)--
LNnDFH-II a22.4 (15.7, 34.0)90.8 (59.1, 116.7)<0.001
MFLNH-I48.0 (17.9, 98.4)--
MFLNH-III a178.0 (120.6, 243.0)423.7 (225.4, 626.9)<0.001
MFLNnH a97.8 (57.1, 154.4)96.4 (50.1, 215.7)0.677
DFpLNnH a116.4 (84.1, 140.3)361.2 (278.9, 465.4)<0.001
LNT a374.9 (279.7, 578.8)896.2 (652.5, 1081.7)<0.001
LNnT a104.9 (65.0, 136.3)36.4 (18.2, 51.7)<0.001
3′-SL a88.7 (81.1, 106.1)101.8 (86.5, 112.9)0.124
6′-SL a249.6 (158.4, 348.9)284.2 (226.7, 391.9)0.213
LSTb a41.4 (26.3, 57.9)77.1 (62.0, 102.6)<0.001
LSTc b133.9 ± 63.6125.4 ± 50.90.503
DSLNT a172.8 (121.0, 257.6)281.4 (217.7, 416.4)<0.001
3′-SLNFP-II&6′-SLNFP-VI a33.8 (24.3, 54.3)91.3 (75.9, 119.4)<0.001
Sum b6063.2 ± 1299.96232.8 ± 1376.30.589
a: presented as median (P25, P75) and tested with Kruskall–Wallis test, b: presented as mean ± SD and tested with t-test, HMOs: human milk oligosaccharides, 2′-FL: 2′-fucosyllactose, 3-FL: 3-fucosyllactose, DFL: difucosyllactose, LNFP-I: lacto-N-fucopentaose I, LNFP-II: lacto-N-fucopentaose II, LNFP-III: lacto-N-fucopentaose III, LNDFH-I: lacto-N-difucohexaose I, LNDFH-II: lacto-N-difucohexaose II, LNnDFH-I: lacto-N-neodifucohexaose I, LNnDFH-II: lacto-N-neodifucohexaose II, MFLNH-I: monofu-cosyl-lacto-N-hexaose I, MFLNH-III: monofucosyl-lacto-N-hexaose III, MFLNnH: monofucosyl-lacto-N-neohexaose, DFpLNnH: difucosyl-para-lacto-N-neohexaose, LNT: lac-to-N-tetraose, LNnT: lacto-N-neotetraose, 3′-SL: 3′-sialyllactose, 6′-SL: 6′-sialyllactose, LSTb: sialyllacto-N-tetraose b, LSTc: sialyllacto-N-tetraose c, DSLNT: disialyllac-to-N-tetraose, 3′-SLNFP-II: 3-sialyl-latco-N-fucopentaose II, 6′-SLNFP-VI: 6-sialyl-latco-N-fucopentaose VI, Sum: total concentration of the HMOs detected.
Table 2. Associations between maternal secretor phenotype and Bifidobacterium and Lactobacilli β (95%CI) a.
SpeciesCrude ModelModel 1
Bifidobacterium longum−0.088 (−0.292, 0.116)−0.161 (−0.385, 0.063)
Bifidobacterium breve−0.129 (−0.332, 0.074)−0.111 (−0.334, 0.113)
Bifidobacterium pseudocatenulatum0.132 (−0.071, 0.335)0.165 (−0.058, 0.388)
Bifidobacterium dentium−0.056 (−0.261, 0.148)−0.128 (−0.353, 0.097)
Lactobacillus gasseri0.039 (−0.166, 0.244)0.013 (−0.207, 0.233)
Bifidobacterium bifidum−0.160 (−0.362, 0.042)−0.245 (−0.465, −0.025)
Ligilactobacillus salivarius0.065 (−0.140, 0.269)0.032 (−0.196, 0.259)
Limosilactobacillus reuteri0.087 (−0.117, 0.291)0.063 (−0.154, 0.281)
The eight most abundant infant gut microbiota from Bifidobacterium and Lactobacilli were explored. Crude model: only the maternal secretor phenotype was included. Model 1: Adjusted for city (Chengdu, Guangzhou, Hohhot, Beijing, Suzhou), maternal age (≤30 y or >30 y), total concentration of HMOs (mg/L), and mode of delivery (vaginal delivery or caesarean section). a: results of linear regression with nSe mothers as reference, the relative abundance of infant gut microbiota was transformed in the form of lg (X + 1).
Disclaimer/Publisher’s Note: The statements, opinions and data contained in all publications are solely those of the individual author(s) and contributor(s) and not of MDPI and/or the editor(s). MDPI and/or the editor(s) disclaim responsibility for any injury to people or property resulting from any ideas, methods, instructions or products referred to in the content.

