
Plasma 25-Hydroxyvitamin D Level and VDR Gene Single Nucleotide Polymorphism rs2228570 Influence on COVID-19 Susceptibility among the Kazakh Ethnic Group—A Pilot Study

 ,
, 
Abstract
:1. Introduction
2. Materials and Methods
2.1. Study Subjects
2.2. Plasma IgG and IgM for SARS-CoV-2 and Plasma 25(OH)D Assays
2.3. The rs2228570 of VDR Gene Genotyping
2.4. Statistical Analysis
3. Results
3.1. Study Flow
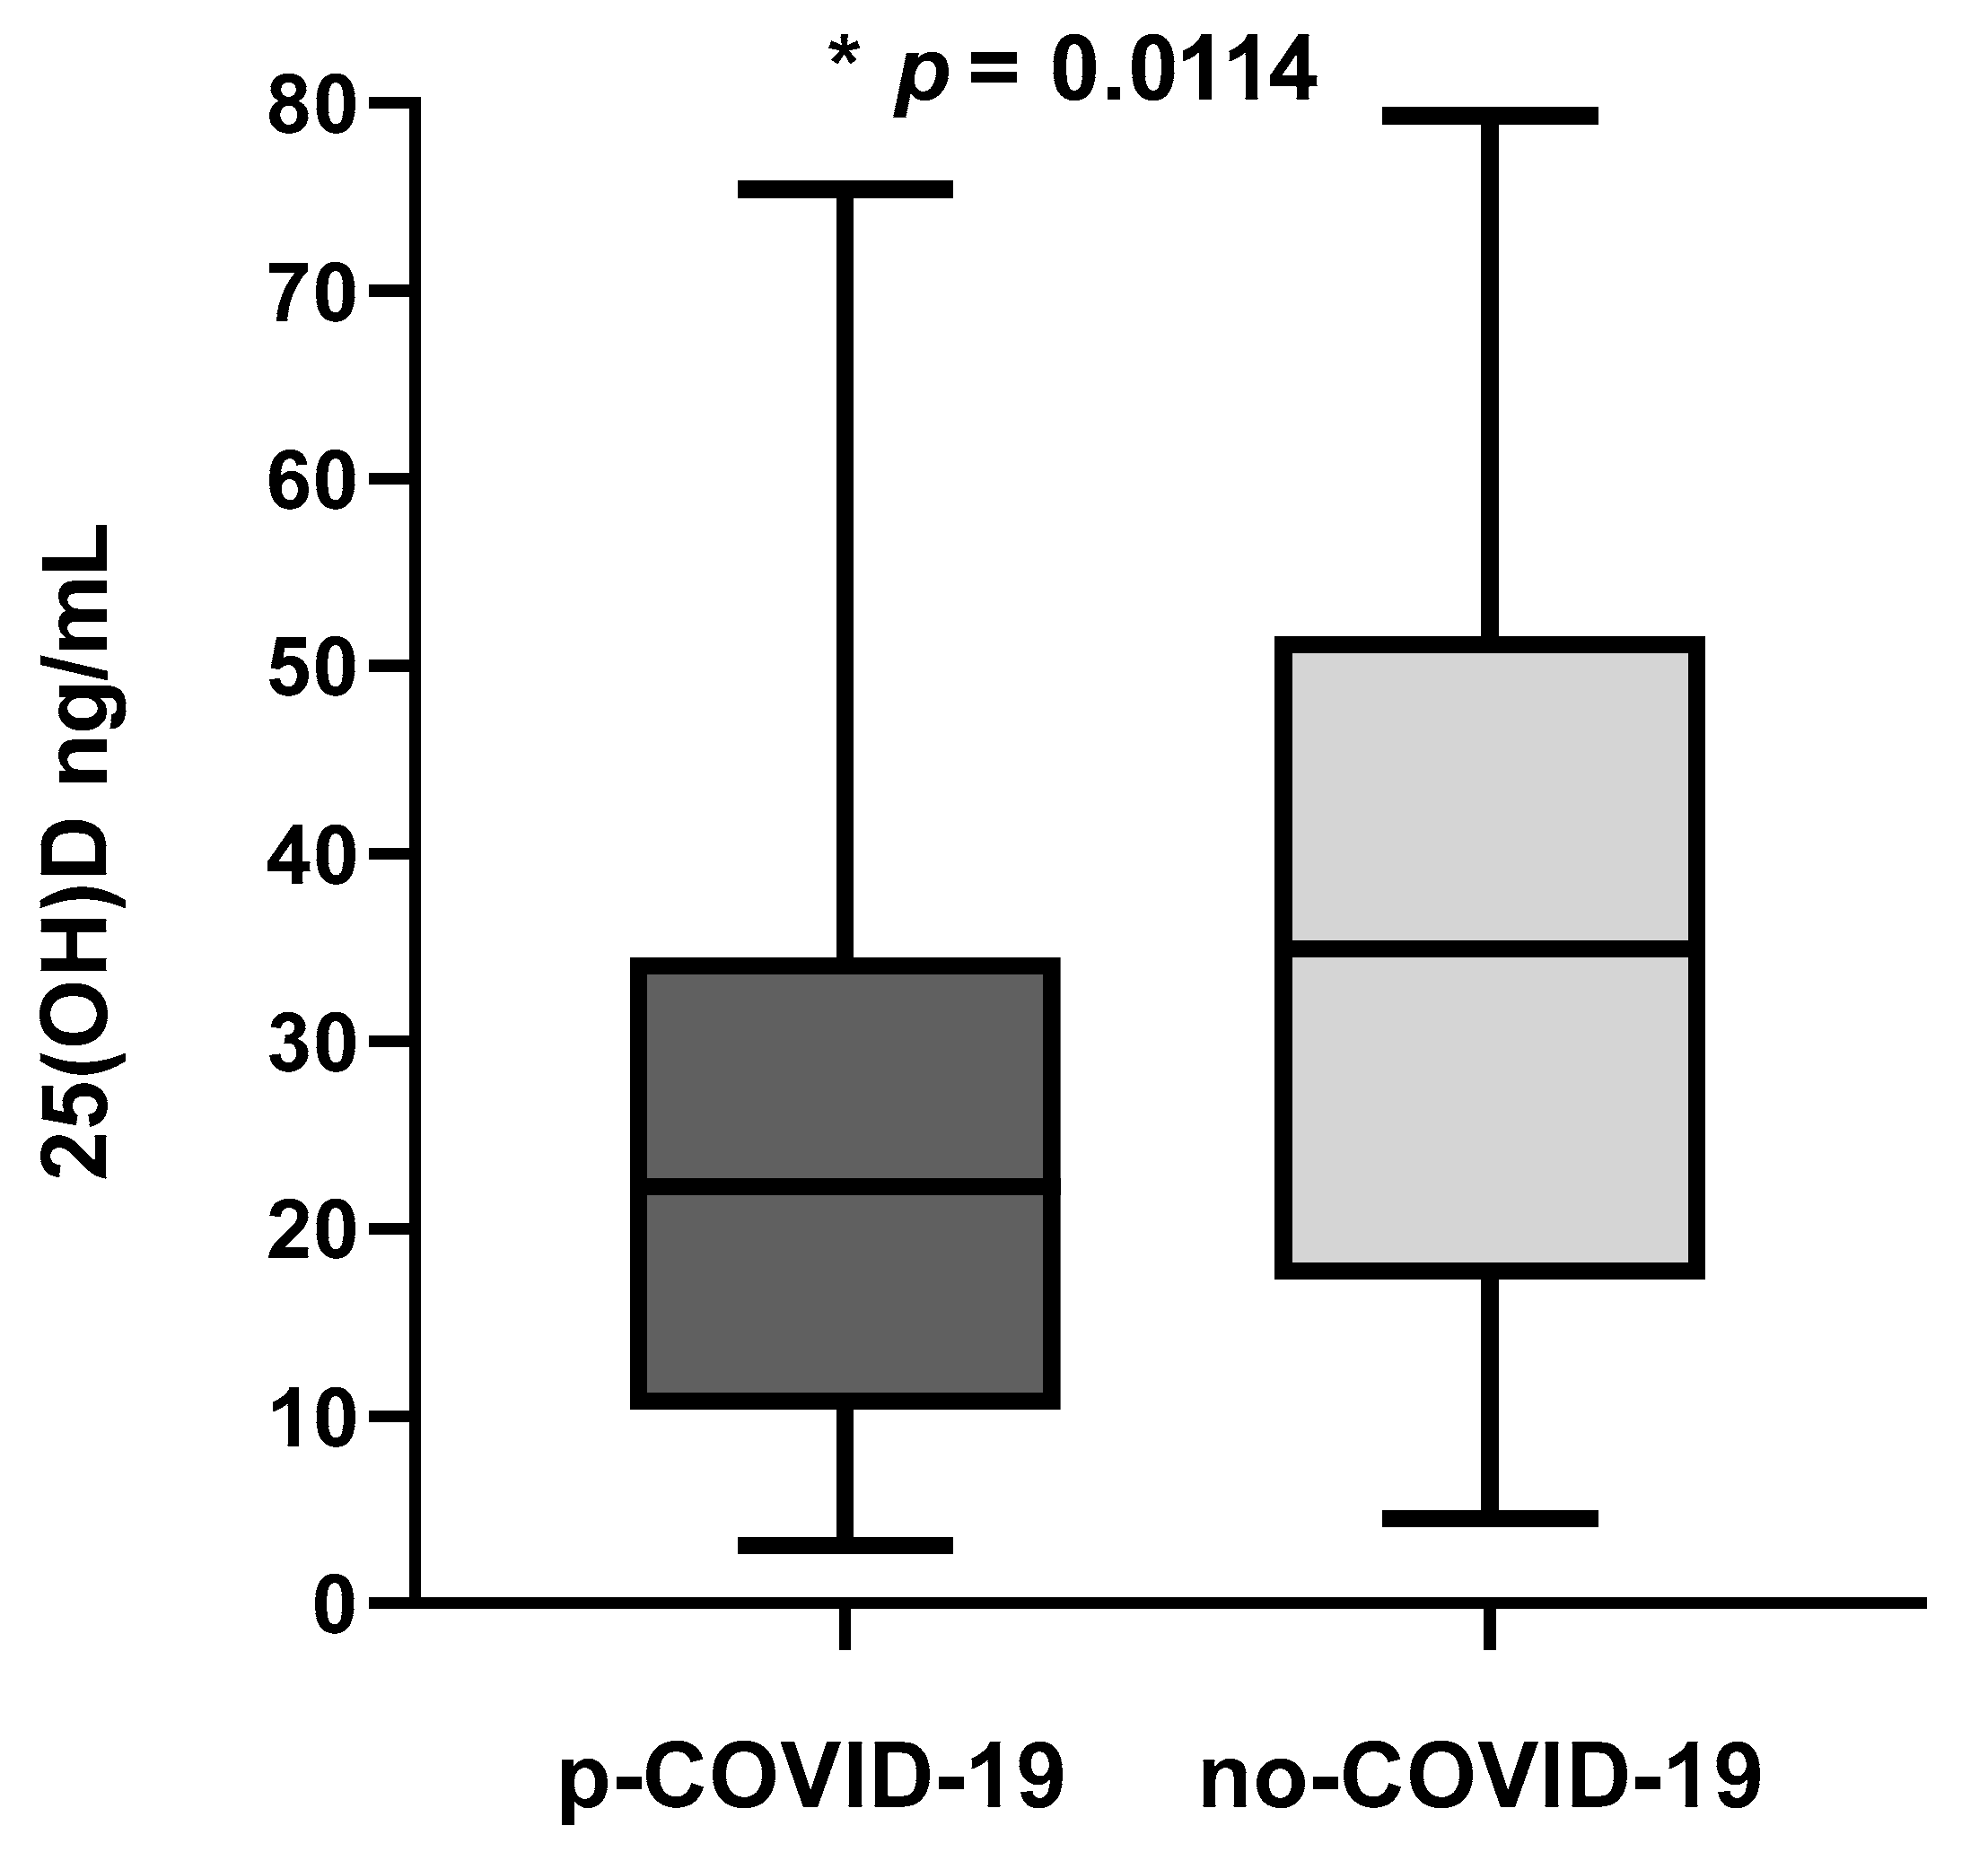
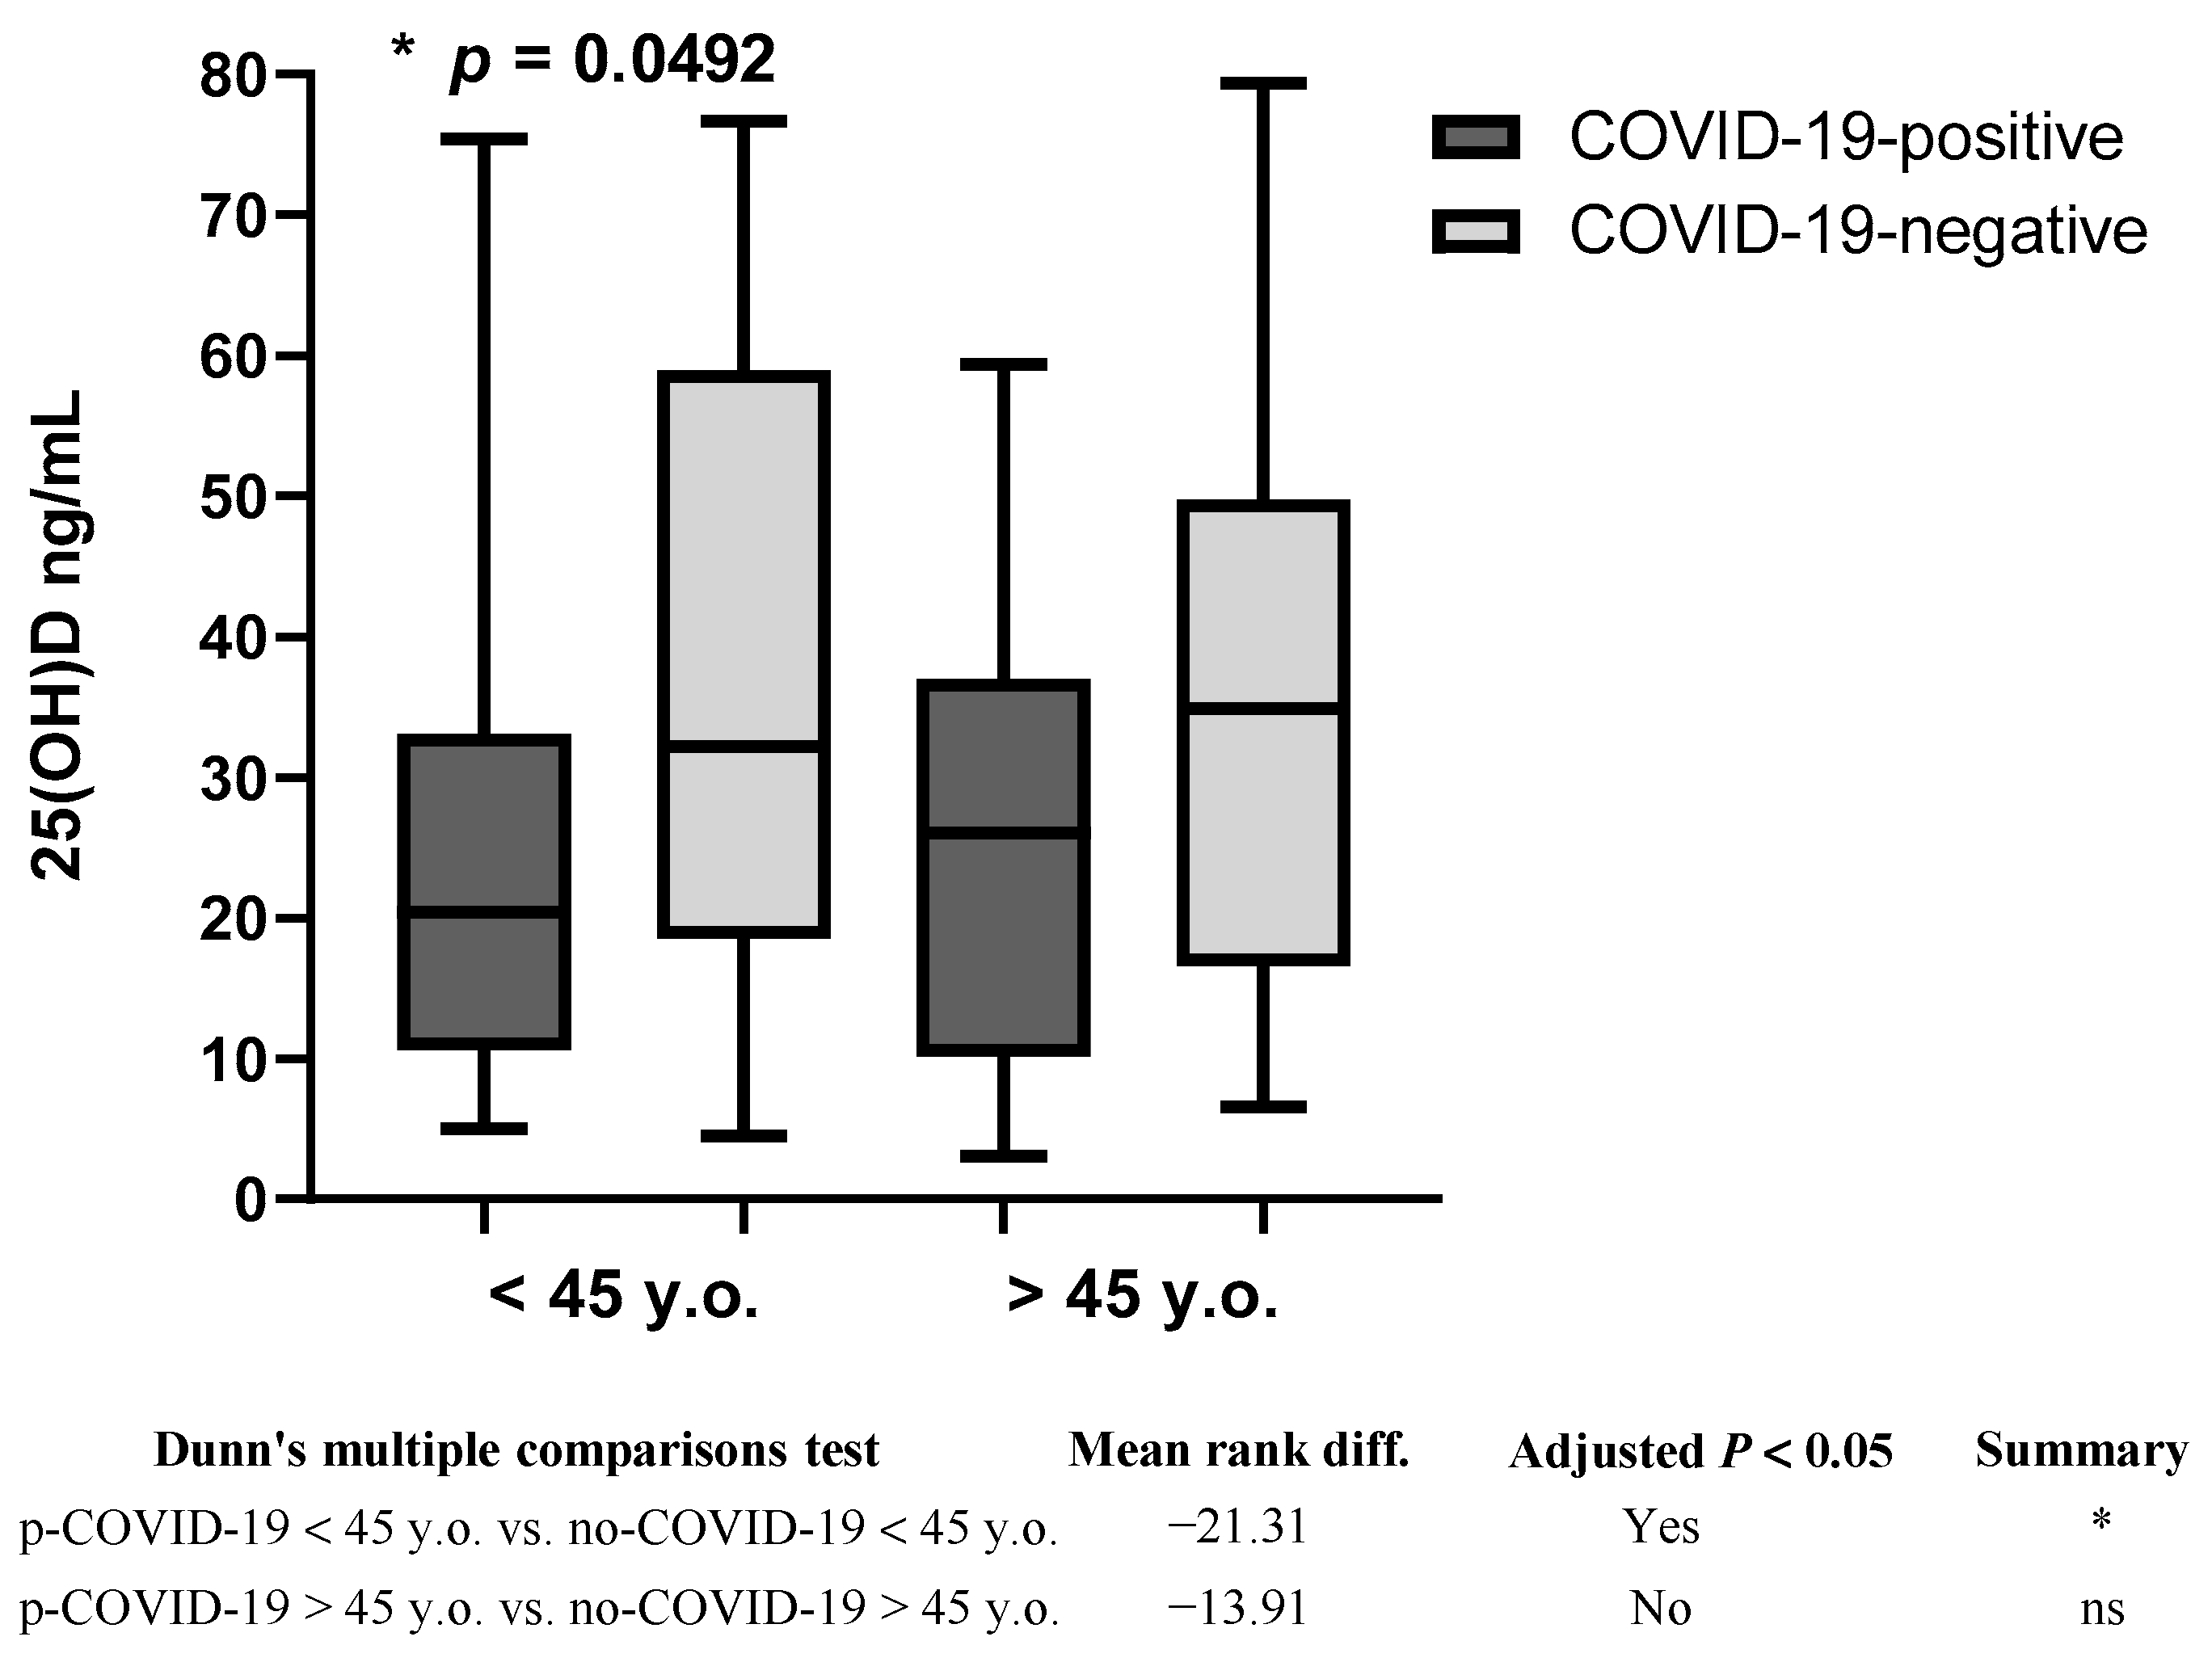
3.2. Plasma 25(OH)D Concentration
3.3. 25(OH)D Concentration and rs2228570
3.4. rs2228570 and COVID-19
4. Discussion
5. Conclusions
Supplementary Materials
Author Contributions
Funding
Institutional Review Board Statement
Informed Consent Statement
Data Availability Statement
Conflicts of Interest
References
- Liu, Y.-C.; Kuo, R.-L.; Shih, S.-R. COVID-19: The First Documented Coronavirus Pandemic in History. Biomed. J. 2020, 43, 328–333. [Google Scholar] [CrossRef] [PubMed]
- COVID—Coronavirus Statistics—Worldometer. Available online: https://www.worldometers.info/coronavirus/ (accessed on 28 March 2023).
- Li, L.; Huang, T.; Wang, Y.; Wang, Z.; Liang, Y.; Huang, T.; Zhang, H.; Sun, W.; Wang, Y. COVID-19 Patients’ Clinical Characteristics, Discharge Rate, and Fatality Rate of Meta-analysis. J. Med. Virol. 2020, 92, 577–583. [Google Scholar] [CrossRef]
- Brito, D.T.M.; Ribeiro, L.H.C.; da Cunha Daltro, C.H.; de Barros Silva, R. The Possible Benefits of Vitamin D in COVID-19. Nutrition 2021, 91–92, 111356. [Google Scholar] [CrossRef]
- Nimavat, N.; Singh, S.; Singh, P.; Singh, S.K.; Sinha, N. Vitamin D Deficiency and COVID-19: A Case-Control Study at a Tertiary Care Hospital in India. Ann. Med. Surg. 2021, 68, 102661. [Google Scholar] [CrossRef] [PubMed]
- Uitterlinden, A.G.; Fang, Y.; van Meurs, J.B.J.; Pols, H.A.P.; van Leeuwen, J.P.T.M. Genetics and Biology of Vitamin D Receptor Polymorphisms. Gene 2004, 338, 143–156. [Google Scholar] [CrossRef] [Green Version]
- Kumar, R.; Rathi, H.; Haq, A.; Wimalawansa, S.J.; Sharma, A. Putative Roles of Vitamin D in Modulating Immune Response and Immunopathology Associated with COVID-19. Virus Res. 2021, 292, 198235. [Google Scholar] [CrossRef]
- Bradley, R.; Schloss, J.; Brown, D.; Celis, D.; Finnell, J.; Hedo, R.; Honcharov, V.; Pantuso, T.; Peña, H.; Lauche, R.; et al. The Effects of Vitamin D on Acute Viral Respiratory Infections: A Rapid Review. Adv. Integr. Med. 2020, 7, 192–202. [Google Scholar] [CrossRef]
- Soltani-Zangbar, M.S.; Mahmoodpoor, A.; Dolati, S.; Shamekh, A.; Valizadeh, S.; Yousefi, M.; Sanaie, S. Serum Levels of Vitamin D and Immune System Function in Patients with COVID-19 Admitted to Intensive Care Unit. Gene Rep. 2022, 26, 101509. [Google Scholar] [CrossRef]
- Ali, N. Role of Vitamin D in Preventing of COVID-19 Infection, Progression and Severity. J. Infect. Public Health 2020, 13, 1373–1380. [Google Scholar] [CrossRef]
- Chandran, M.; Chan Maung, A.; Mithal, A.; Parameswaran, R. Vitamin D in COVID-19: Dousing the Fire or Averting the Storm?—A Perspective from the Asia-Pacific. Osteoporos. Sarcopenia 2020, 6, 97–105. [Google Scholar] [CrossRef]
- Wacker, M.; Holick, M. Vitamin D—Effects on Skeletal and Extraskeletal Health and the Need for Supplementation. Nutrients 2013, 5, 111–148. [Google Scholar] [CrossRef] [PubMed] [Green Version]
- Jones, G. The Discovery and Synthesis of the Nutritional Factor Vitamin D. Int. J. Paleopathol. 2018, 23, 96–99. [Google Scholar] [CrossRef] [PubMed]
- Jayawardena, R.; Jeyakumar, D.T.; Francis, T.V.; Misra, A. Impact of the Vitamin D Deficiency on COVID-19 Infection and Mortality in Asian Countries. Diabetes Metab. Syndr. Clin. Res. Rev. 2021, 15, 757–764. [Google Scholar] [CrossRef]
- Hewison, M. Vitamin D and the Intracrinology of Innate Immunity. Mol. Cell. Endocrinol. 2010, 321, 103–111. [Google Scholar] [CrossRef] [Green Version]
- Biesalski, H.K. Vitamin D Deficiency and Co-Morbidities in COVID-19 Patients—A Fatal Relationship? NFS J. 2020, 20, 10–21. [Google Scholar] [CrossRef]
- Gromova, O.; Doschanova, A.; Lokshin, V.; Tuletova, A.; Grebennikova, G.; Daniyarova, L.; Kaishibayeva, G.; Nurpeissov, T.; Khan, V.; Semenova, Y.; et al. Vitamin D Deficiency in Kazakhstan: Cross-Sectional Study. J. Steroid Biochem. Mol. Biol. 2020, 199, 105565. [Google Scholar] [CrossRef]
- Bergman, P.; Lindh, A.U.; Björkhem-Bergman, L.; Lindh, J.D. Vitamin D and Respiratory Tract Infections: A Systematic Review and Meta-Analysis of Randomized Controlled Trials. PLoS ONE 2013, 8, e65835. [Google Scholar] [CrossRef] [PubMed] [Green Version]
- Urashima, M.; Segawa, T.; Okazaki, M.; Kurihara, M.; Wada, Y.; Ida, H. Randomized Trial of Vitamin D Supplementation to Prevent Seasonal Influenza A in Schoolchildren. Am. J. Clin. Nutr. 2010, 91, 1255–1260. [Google Scholar] [CrossRef] [PubMed] [Green Version]
- Merzon, E.; Tworowski, D.; Gorohovski, A.; Vinker, S.; Golan Cohen, A.; Green, I.; Frenkel-Morgenstern, M. Low Plasma 25(OH) Vitamin D Level Is Associated with Increased Risk of COVID-19 Infection: An Israeli Population-based Study. FEBS J. 2020, 287, 3693–3702. [Google Scholar] [CrossRef]
- Kaufman, H.W.; Niles, J.K.; Kroll, M.H.; Bi, C.; Holick, M.F. SARS-CoV-2 Positivity Rates Associated with Circulating 25-Hydroxyvitamin D Levels. PLoS ONE 2020, 15, e0239252. [Google Scholar] [CrossRef] [PubMed]
- Singh, S.; Kaur, R.; Singh, R.K. Revisiting the Role of Vitamin D Levels in the Prevention of COVID-19 Infection and Mortality in European Countries Post Infections Peak. Aging Clin. Exp. Res. 2020, 32, 1609–1612. [Google Scholar] [CrossRef] [PubMed]
- Padhi, S.; Suvankar, S.; Panda, V.K.; Pati, A.; Panda, A.K. Lower Levels of Vitamin D Are Associated with SARS-CoV-2 Infection and Mortality in the Indian Population: An Observational Study. Int. Immunopharmacol. 2020, 88, 107001. [Google Scholar] [CrossRef]
- Bakaloudi, D.R.; Chourdakis, M. A Critical Update on the Role of Mild and Serious Vitamin D Deficiency Prevalence and the COVID-19 Epidemic in Europe. Nutrition 2022, 93, 111441. [Google Scholar] [CrossRef]
- Hastie, C.E.; Mackay, D.F.; Ho, F.; Celis-Morales, C.A.; Katikireddi, S.V.; Niedzwiedz, C.L.; Jani, B.D.; Welsh, P.; Mair, F.S.; Gray, S.R.; et al. Vitamin D Concentrations and COVID-19 Infection in UK Biobank. Diabetes Metab. Syndr. Clin. Res. Rev. 2020, 14, 561–565. [Google Scholar] [CrossRef]
- Bikle, D.D. Vitamin D Metabolism, Mechanism of Action, and Clinical Applications. Chem. Biol. 2014, 21, 319–329. [Google Scholar] [CrossRef] [Green Version]
- Nabih, E.S.; Kamel, T.B. Association between Vitamin D Receptor Gene FokI Polymorphism and Atopic Childhood Bronchial Asthma. Egypt. J. Chest Dis. Tuberc. 2014, 63, 547–552. [Google Scholar] [CrossRef] [Green Version]
- Warwick, T.; Schulz, M.H.; Günther, S.; Gilsbach, R.; Neme, A.; Carlberg, C.; Brandes, R.P.; Seuter, S. A Hierarchical Regulatory Network Analysis of the Vitamin D Induced Transcriptome Reveals Novel Regulators and Complete VDR Dependency in Monocytes. Sci. Rep. 2021, 11, 6518. [Google Scholar] [CrossRef] [PubMed]
- Pike, J.W.; Meyer, M.B. The Vitamin D Receptor: New Paradigms for the Regulation of Gene Expression by 1,25-Dihydroxyvitamin D3. Endocrinol. Metab. Clin. N. Am. 2010, 39, 255–269. [Google Scholar] [CrossRef] [Green Version]
- Teymoori-Rad, M.; Marashi, S.M. Vitamin D and Covid-19: From Potential Therapeutic Effects to Unanswered Questions. Rev. Med. Virol. 2021, 31, e2159. [Google Scholar] [CrossRef]
- Tuoresmäki, P.; Väisänen, S.; Neme, A.; Heikkinen, S.; Carlberg, C. Patterns of Genome-Wide VDR Locations. PLoS ONE 2014, 9, e96105. [Google Scholar] [CrossRef] [PubMed] [Green Version]
- Carlberg, C.; Campbell, M.J. Vitamin D Receptor Signaling Mechanisms: Integrated Actions of a Well-Defined Transcription Factor. Steroids 2013, 78, 127–136. [Google Scholar] [CrossRef] [Green Version]
- Abdollahzadeh, R.; Shushizadeh, M.H.; Barazandehrokh, M.; Choopani, S.; Azarnezhad, A.; Paknahad, S.; Pirhoushiaran, M.; Makani, S.Z.; Yeganeh, R.Z.; Al-Kateb, A.; et al. Association of Vitamin D Receptor Gene Polymorphisms and Clinical/Severe Outcomes of COVID-19 Patients. Infect. Genet. Evol. 2021, 96, 105098. [Google Scholar] [CrossRef] [PubMed]
- rs2228570—SNP—NCBI. Available online: https://www.ncbi.nlm.nih.gov/snp/?term=rs2228570 (accessed on 28 March 2023).
- Alvarez, A.E.; Marson, F.A.L.; Bertuzzo, C.S.; Bastos, J.C.S.; Baracat, E.C.E.; Brandão, M.B.; Tresoldi, A.T.; das Neves Romaneli, M.T.; Almeida, C.C.B.; de Oliveira, T.; et al. Association between Single Nucleotide Polymorphisms in TLR4, TLR2, TLR9, VDR, NOS2 and CCL5 Genes with Acute Viral Bronchiolitis. Gene 2018, 645, 7–17. [Google Scholar] [CrossRef] [PubMed]
- Wang, Y.; Li, H. A Meta-Analysis on Associations between Vitamin D Receptor Genetic Variants and Tuberculosis. Microb. Pathog. 2019, 130, 59–64. [Google Scholar] [CrossRef]
- Silva-Ramírez, B.; Saenz-Saenz, C.A.; Bracho-Vela, L.A.; Peñuelas-Urquides, K.; Mata-Tijerina, V.; Escobedo-Guajardo, B.L.; González-Ríos, N.R.; Vázquez-Monsiváis, O.; de León, M.B. Association between Vitamin D Receptor Gene Polymorphisms and Pulmonary Tuberculosis in a Mexican Population. Indian J. Tuberc. 2019, 66, 70–75. [Google Scholar] [CrossRef]
- Alagarasu, K.; Honap, T.; Mulay, A.P.; Bachal, R.V.; Shah, P.S.; Cecilia, D. Association of Vitamin D Receptor Gene Polymorphisms with Clinical Outcomes of Dengue Virus Infection. Hum. Immunol. 2012, 73, 1194–1199. [Google Scholar] [CrossRef]
- Kresfelder, T.L.; Janssen, R.; Bont, L.; Venter, M. Confirmation of an Association between Single Nucleotide Polymorphisms in the VDR Gene with Respiratory Syncytial Virus Related Disease in South African Children. J. Med. Virol. 2011, 83, 1834–1840. [Google Scholar] [CrossRef] [Green Version]
- Jafarpoor, A.; Jazayeri, S.M.; Bokharaei-Salim, F.; Ataei-Pirkooh, A.; Ghaziasadi, A.; Soltani, S.; Sadeghi, A.; Marvi, S.S.; Poortahmasebi, V.; Khorrami, S.M.S.; et al. VDR Gene Polymorphisms Are Associated with the Increased Susceptibility to COVID-19 among Iranian Population: A Case-control Study. Int. J. Immunogenet. 2022, 49, 243–253. [Google Scholar] [CrossRef] [PubMed]
- Kotur, N.; Skakic, A.; Klaassen, K.; Gasic, V.; Zukic, B.; Skodric-Trifunovic, V.; Stjepanovic, M.; Zivkovic, Z.; Ostojic, O.; Stevanovic, G.; et al. Association of Vitamin D, Zinc and Selenium Related Genetic Variants With COVID-19 Disease Severity. Front. Nutr. 2021, 8, 689419. [Google Scholar] [CrossRef]
- Apaydin, T.; Polat, H.; Dincer Yazan, C.; Ilgin, C.; Elbasan, O.; Dashdamirova, S.; Bayram, F.; Tukenmez Tigen, E.; Unlu, O.; Tekin, A.F.; et al. Effects of Vitamin D Receptor Gene Polymorphisms on the Prognosis of COVID-19. Clin. Endocrinol. 2022, 96, 819–830. [Google Scholar] [CrossRef]
- Böger, B.; Fachi, M.M.; Vilhena, R.O.; Cobre, A.F.; Tonin, F.S.; Pontarolo, R. Systematic Review with Meta-Analysis of the Accuracy of Diagnostic Tests for COVID-19. Am. J. Infect. Control 2021, 49, 21–29. [Google Scholar] [CrossRef] [PubMed]
- To, K.K.-W.; Tsang, O.T.-Y.; Leung, W.-S.; Tam, A.R.; Wu, T.-C.; Lung, D.C.; Yip, C.C.-Y.; Cai, J.-P.; Chan, J.M.-C.; Chik, T.S.-H.; et al. Temporal Profiles of Viral Load in Posterior Oropharyngeal Saliva Samples and Serum Antibody Responses during Infection by SARS-CoV-2: An Observational Cohort Study. Lancet Infect. Dis. 2020, 20, 565–574. [Google Scholar] [CrossRef] [PubMed] [Green Version]
- Sethuraman, N.; Jeremiah, S.S.; Ryo, A. Interpreting Diagnostic Tests for SARS-CoV-2. JAMA 2020, 323, 2249. [Google Scholar] [CrossRef]
- Zhou, C.; Bu, G.; Sun, Y.; Ren, C.; Qu, M.; Gao, Y.; Zhu, Y.; Wang, L.; Sun, L.; Liu, Y. Evaluation of Serum IgM and IgG Antibodies in COVID-19 Patients by Enzyme Linked Immunosorbent Assay. J. Med. Virol. 2021, 93, 2857–2866. [Google Scholar] [CrossRef]
- Luo, C.; Liu, M.; Li, Q.; Zheng, X.; Ai, W.; Gong, F.; Fan, J.; Liu, S.; Wang, X.; Luo, J. Dynamic Changes and Prevalence of SARS-CoV-2 IgG/IgM Antibodies: Analysis of Multiple Factors. Int. J. Infect. Dis. 2021, 108, 57–62. [Google Scholar] [CrossRef]
- Song, K.-H.; Kim, D.-M.; Lee, H.; Ham, S.Y.; Oh, S.-M.; Jeong, H.; Jung, J.; Kang, C.K.; Park, J.Y.; Kang, Y.M.; et al. Dynamics of Viral Load and Anti-SARS-CoV-2 Antibodies in Patients with Positive RT-PCR Results after Recovery from COVID-19. Korean J. Intern. Med. 2021, 36, 11–14. [Google Scholar] [CrossRef]
- Orces, C. The Association between Body Mass Index and Vitamin D Supplement Use among Adults in the United States. Cureus 2019, 11, e5721. [Google Scholar] [CrossRef]
- Lagunova, Z.; Porojnicu, A.; Lindberg, F.; Hexeberg, S.; Moan, J. The Dependency of Vitamin D Status on Body Mass Index, Gender, Age and Season. Obes. Metab. 2009, 6, 52. [Google Scholar] [CrossRef]
- Muscogiuri, G.; Barrea, L.; Somma, C.D.; Laudisio, D.; Salzano, C.; Pugliese, G.; de Alteriis, G.; Colao, A.; Savastano, S. Sex Differences of Vitamin D Status across BMI Classes: An Observational Prospective Cohort Study. Nutrients 2019, 11, 3034. [Google Scholar] [CrossRef] [Green Version]
- Marik, P.E.; Kory, P.; Varon, J. Does Vitamin D Status Impact Mortality from SARS-CoV-2 Infection? Med. Drug Discov. 2020, 6, 100041. [Google Scholar] [CrossRef]
- Sooriyaarachchi, P.; Jeyakumar, D.T.; King, N.; Jayawardena, R. Impact of Vitamin D Deficiency on COVID-19. Clin. Nutr. ESPEN 2021, 44, 372–378. [Google Scholar] [CrossRef]
- D’Avolio, A.; Avataneo, V.; Manca, A.; Cusato, J.; De Nicolò, A.; Lucchini, R.; Keller, F.; Cantù, M. 25-Hydroxyvitamin D Concentrations Are Lower in Patients with Positive PCR for SARS-CoV-2. Nutrients 2020, 12, 1359. [Google Scholar] [CrossRef] [PubMed]
- Gallelli, L.; Mannino, G.C.; Luciani, F.; de Sire, A.; Mancuso, E.; Gangemi, P.; Cosco, L.; Monea, G.; Averta, C.; Minchella, P.; et al. Vitamin D Serum Levels in Subjects Tested for SARS-CoV-2: What Are the Differences among Acute, Healed, and Negative COVID-19 Patients? A Multicenter Real-Practice Study. Nutrients 2021, 13, 3932. [Google Scholar] [CrossRef]
- Israel, A.; Cicurel, A.; Feldhamer, I.; Stern, F.; Dror, Y.; Giveon, S.M.; Gillis, D.; Strich, D.; Lavie, G. Vitamin D Deficiency Is Associated with Higher Risks for SARS-CoV-2 Infection and COVID-19 Severity: A Retrospective Case–Control Study. Intern. Emerg. Med. 2022, 17, 1053–1063. [Google Scholar] [CrossRef] [PubMed]
- Mukherjee, S.B.; Gorohovski, A.; Merzon, E.; Levy, E.; Mukherjee, S.; Frenkel-Morgenstern, M. Seasonal UV Exposure and Vitamin D: Association with the Dynamics of COVID-19 Transmission in Europe. FEBS Open Biol. 2021, 12, 106–117. [Google Scholar] [CrossRef]
- Wierzbicka, A.; Oczkowicz, M. Sex Differences in Vitamin D Metabolism, Serum Levels and Action. Br. J. Nutr. 2022, 128, 2115–2130. [Google Scholar] [CrossRef]
- Vallejo, M.S.; Blümel, J.E.; Arteaga, E.; Aedo, S.; Tapia, V.; Araos, A.; Sciaraffia, C.; Castelo-Branco, C. Gender Differences in the Prevalence of Vitamin D Deficiency in a Southern Latin American Country: A Pilot Study. Climacteric 2020, 23, 410–416. [Google Scholar] [CrossRef]
- AlQuaiz, A.M.; Kazi, A.; Fouda, M.; Alyousefi, N. Age and Gender Differences in the Prevalence and Correlates of Vitamin D Deficiency. Arch. Osteoporos. 2018, 13, 49. [Google Scholar] [CrossRef]
- Zhumina, A.G.; Li, K.; Konovalova, A.A.; Li, Y.A.; Ishmuratova, M.Y.; Pogossyan, G.P.; Danilenko, M. Plasma 25-Hydroxyvitamin D Levels and VDR Gene Expression in Peripheral Blood Mononuclear Cells of Leukemia Patients and Healthy Subjects in Central Kazakhstan. Nutrients 2020, 12, 1229. [Google Scholar] [CrossRef]
- Dastani, Z.; Li, R.; Richards, B. Genetic Regulation of Vitamin D Levels. Calcif. Tissue Int. 2013, 92, 106–117. [Google Scholar] [CrossRef] [PubMed]
- Divanoglou, N.; Komninou, D.; Stea, E.A.; Argiriou, A.; Papatzikas, G.; Tsakalof, A.; Pazaitou-Panayiotou, K.; Georgakis, M.K.; Petridou, E. Association of Vitamin D Receptor Gene Polymorphisms with Serum Vitamin D Levels in a Greek Rural Population (Velestino Study). Lifestyle Genom. 2021, 14, 81–90. [Google Scholar] [CrossRef] [PubMed]
- Li, K.; Shi, Q.; Yang, L.; Li, X.; Liu, L.; Wang, L.; Li, Q.; Wang, G.; Li, C.-Y.; Gao, T.-W. The Association of Vitamin D Receptor Gene Polymorphisms and Serum 25-Hydroxyvitamin D Levels with Generalized Vitiligo: Association of VDR Polymorphisms and Vitiligo Risk. Br. J. Dermatol. 2012, 167, 815–821. [Google Scholar] [CrossRef] [PubMed]
- Baturin, A.K.; Sorokina, E.Y.; Vrzhesinskaya, O.A.; Beketova, N.A.; Sokolnikov, A.A.; Kobelkova, I.V.; Keshabyats, E.E.; Kodentsova, V.M.; Makurina, O.N.; Peskova, E.V. The study of the association between rs2228570 polymorphism of VDR gene and vitamin D blood serum concentration in the inhabitants of the Russian Arctic. Vopr. Pitan. 2017, 86, 77–84. [Google Scholar] [CrossRef] [PubMed]
- Mohammad, M.; Alourfi, Z.; Haddad, S. Relationship between Vitamin D Receptor Gene FokI Polymorphism and 25-Hydroxyvitamin D Levels in Apparently Healthy Syrians. Meta Gene 2021, 29, 100945. [Google Scholar] [CrossRef]
- Das, B.; Bhanushali, A.; Lajpal, N.; Kulkarni, S.; Chavan, S.; Sarita, S. Frequency of FokI and TaqI Polymorphism of Vitamin D Receptor Gene in Indian Population and Its Association with 25-Hydroxyvitamin D Levels. Indian J. Hum. Genet. 2009, 15, 108. [Google Scholar] [CrossRef] [Green Version]
- Hassan, I.; Bhat, Y.; Majid, S.; Sajad, P.; Rasool, F.; Malik, R.; Ul Haq, I. Association of Vitamin D Receptor Gene Polymorphisms and Serum 25-Hydroxy Vitamin D Levels in Vitiligo—A Case-Control Study. Indian Dermatol. Online J. 2019, 10, 131. [Google Scholar] [CrossRef]
- Laplana, M.; Royo, J.L.; Fibla, J. Vitamin D Receptor Polymorphisms and Risk of Enveloped Virus Infection: A Meta-Analysis. Gene 2018, 678, 384–394. [Google Scholar] [CrossRef] [Green Version]
- Hashemi, S.M.A.; Thijssen, M.; Hosseini, S.Y.; Tabarraei, A.; Pourkarim, M.R.; Sarvari, J. Human Gene Polymorphisms and Their Possible Impact on the Clinical Outcome of SARS-CoV-2 Infection. Arch. Virol. 2021, 166, 2089–2108. [Google Scholar] [CrossRef]


| p-COVID-19 | no-COVID-19 | p Value | |
|---|---|---|---|
| Total (n) | 88 | 31 | |
| Age (years; mean ± SD) | 43 ± 14.38 | 41 ± 15.24 | NS |
| Sex (M/F) | 27/61 | 12/19 | |
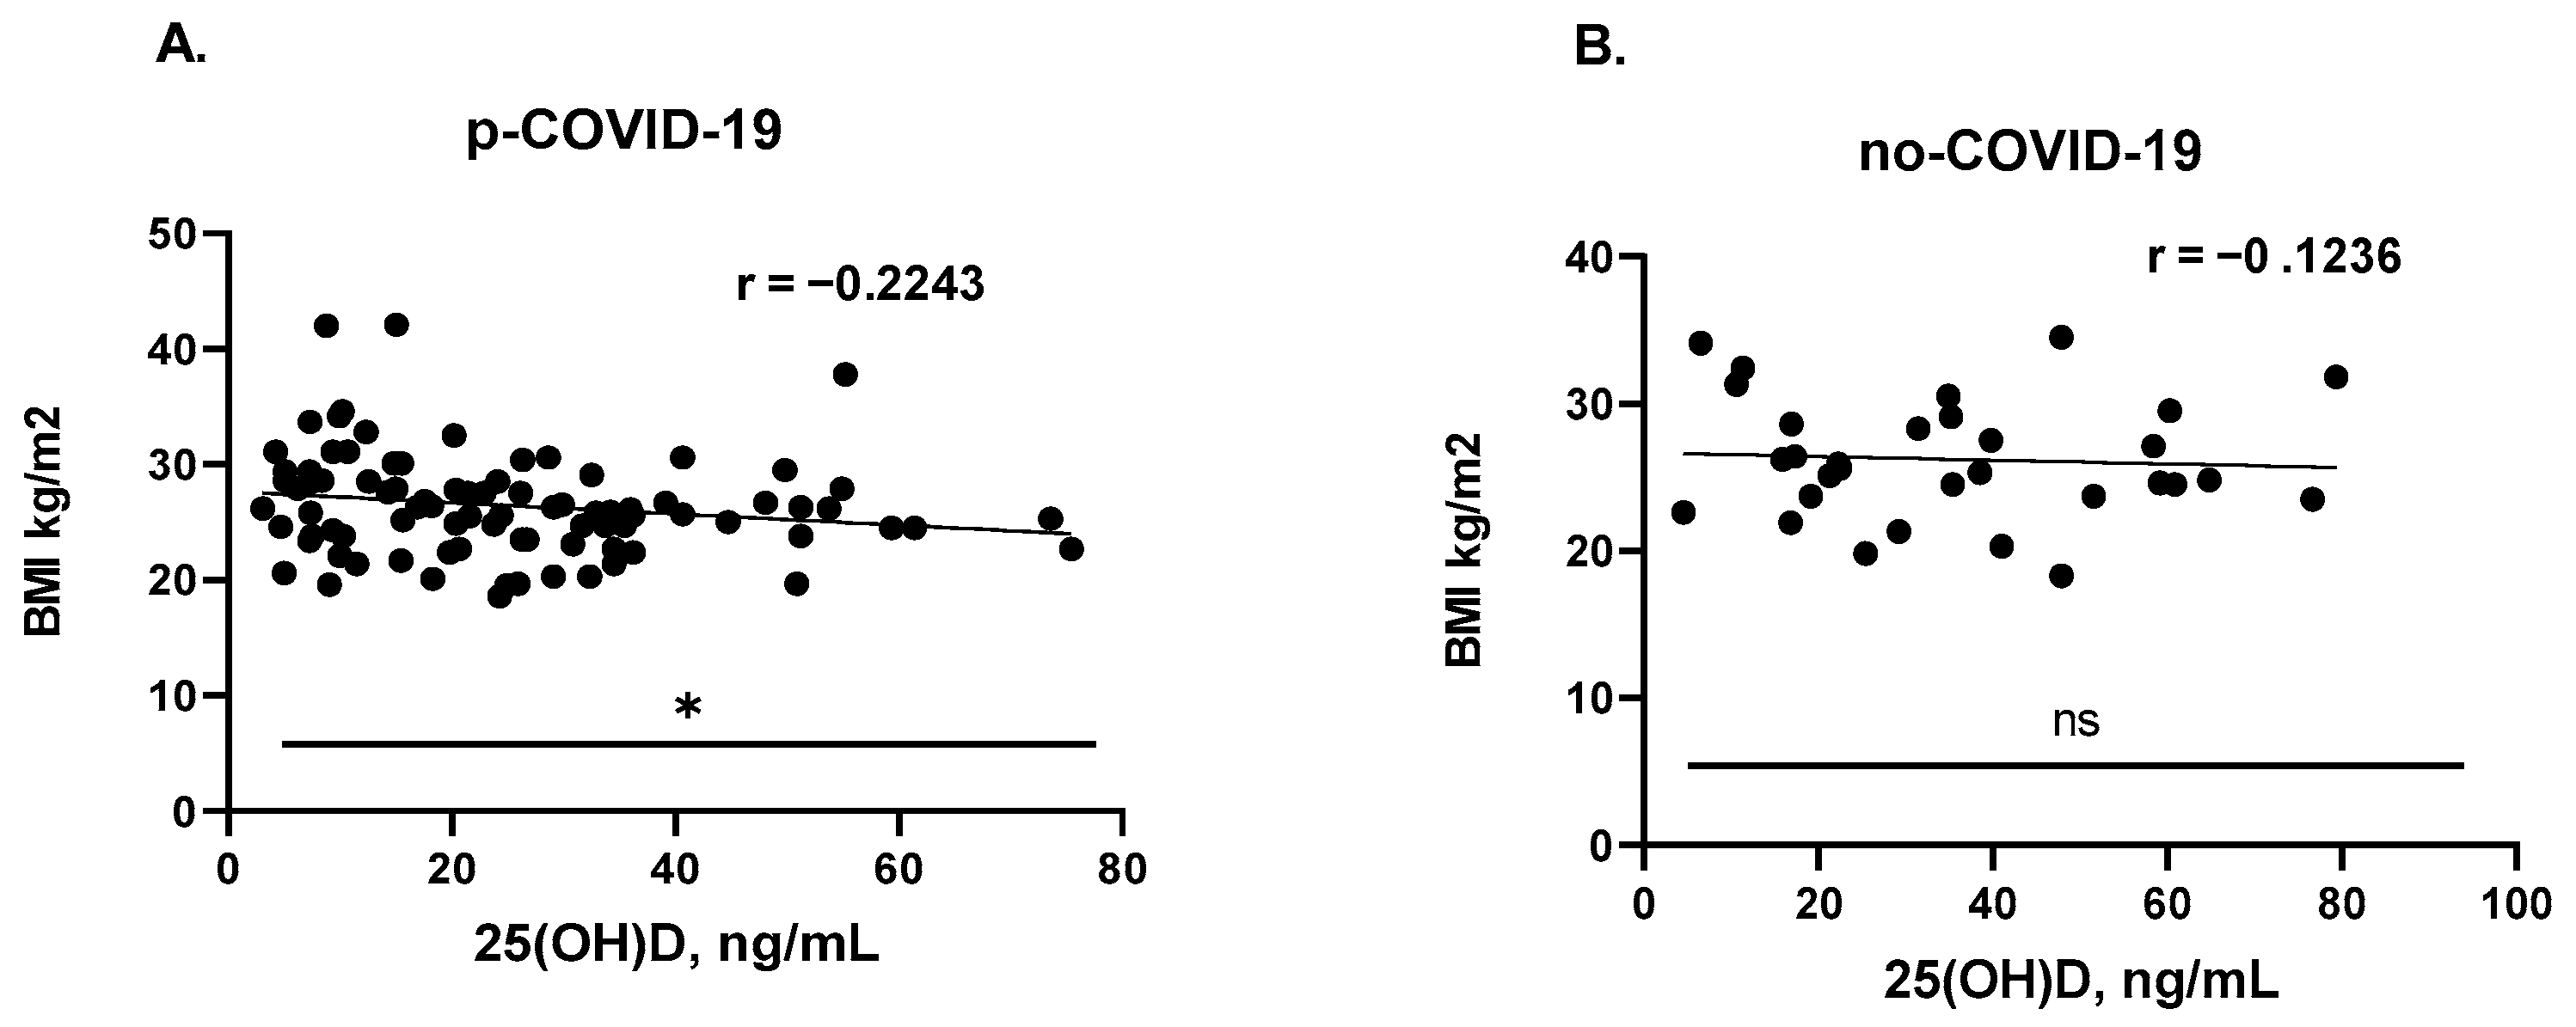
| BMI (mean ± SD) | 26.44 ± 4.479 | 26.22 ± 4.098 | NS |
| Tobacco use (M/F) | 21 (15/6) | 5 (4/1) | |
| IgM (ng/mL; mean ± SD) | 1.691 ± 3.008 | 0.399 ± 0.181 | **** |
| IgG (ng/mL; mean ± SD) | 7.086 ± 3.881 | 0.3191 ± 0.2282 | **** |
| 25(OH)D (ng/mL; mean ± SD) | 25.17 ± 16.65 | 35.58 ± 20.67 | * |
| rs2228570 | p-COVID-19 (n) | no-COVID-19 (n) | OR (CI 95%) | χ2 | p-Value # |
|---|---|---|---|---|---|
| Genotypes | n = 88 (Freq.) | n = 31(Freq.) | |||
| AA | 9 (10.23%) | 2 (6.45%) | 1.652 (0.3850–7.963) | 0.3895 | 0.7260 |
| CC | NA | 1 (3.23%) | 0.1149 (0.004558–2.895) | 2.863 | 0.2605 |
| GG | 27 (30.68%) | 3 (9.68%) | 4.131 (1.223–13.71) | 5.364 | 0.0288 * |
| TT | 2 (2.27%) | NA | 1.821 (0.08506–38.97) | 0.7166 | ref (1.00) |
| AC | 1 (1.14%) | 4 (12.90%) | 0.07759 (0.006289–0.5156) | 7.886 | 0.0161 * |
| AG | 27 (30.68%) | 12 (38.71%) | 0.7008 (0.3047–1.566) | 0.6706 | 0.5051 |
| AT | 8 (9.09%) | NA | 6.652 (0.3728–118.7) | 3.021 | 0.1096 |
| CG | 2 (2.27%) | 5 (16.13%) | 0.1209 (0.02351–0.6340) | 7.950 | 0.0128 * |
| TG | 12 (13.64%) | 4 (12.90%) | 1.066 (0.3389–3.226) | 0.01059 | ref (1.00) |
| Alleles | n = 176 (Freq.) | n = 62 (Freq.) | |||
| A | 54 (30.68%) | 20 (32.26%) | 0.9295 (0.497–1.724) | 0.05317 | 0.8736 |
| C | 3 (1.70%) | 11 (17.74%) | 0.0804 (0.02357–0.2798) | 21.30 | <0.0001 **** |
| G | 95 (53.98%) | 27 (43.55%) | 1.520 (0.8606–2.755) | 1.996 | 0.1843 |
| T | 24 (13.64%) | 4 (6.45%) | 2.289 (0.7916–6.330) | 2.280 | 0.1702 |
Disclaimer/Publisher’s Note: The statements, opinions and data contained in all publications are solely those of the individual author(s) and contributor(s) and not of MDPI and/or the editor(s). MDPI and/or the editor(s) disclaim responsibility for any injury to people or property resulting from any ideas, methods, instructions or products referred to in the content. |
© 2023 by the authors. Licensee MDPI, Basel, Switzerland. This article is an open access article distributed under the terms and conditions of the Creative Commons Attribution (CC BY) license (https://creativecommons.org/licenses/by/4.0/).
Share and Cite
Protas, V.V.; Pogossyan, G.P.; Li, K.G.; Zhumina, A.G.; Bisseneva, A.K.; Shaikina, D.N. Plasma 25-Hydroxyvitamin D Level and VDR Gene Single Nucleotide Polymorphism rs2228570 Influence on COVID-19 Susceptibility among the Kazakh Ethnic Group—A Pilot Study. Nutrients 2023, 15, 1781. https://doi.org/10.3390/nu15071781
Protas VV, Pogossyan GP, Li KG, Zhumina AG, Bisseneva AK, Shaikina DN. Plasma 25-Hydroxyvitamin D Level and VDR Gene Single Nucleotide Polymorphism rs2228570 Influence on COVID-19 Susceptibility among the Kazakh Ethnic Group—A Pilot Study. Nutrients. 2023; 15(7):1781. https://doi.org/10.3390/nu15071781
Chicago/Turabian StyleProtas, Valeriya V., Gayane P. Pogossyan, Konstantin G. Li, Assel G. Zhumina, Anar K. Bisseneva, and Dinara N. Shaikina. 2023. "Plasma 25-Hydroxyvitamin D Level and VDR Gene Single Nucleotide Polymorphism rs2228570 Influence on COVID-19 Susceptibility among the Kazakh Ethnic Group—A Pilot Study" Nutrients 15, no. 7: 1781. https://doi.org/10.3390/nu15071781