
The Impact of Obesity on the Excretion of Steroid Metabolites in Boys and Girls: A Comparison with Normal-Weight Children


Abstract
:1. Introduction
2. Research Design and Methods
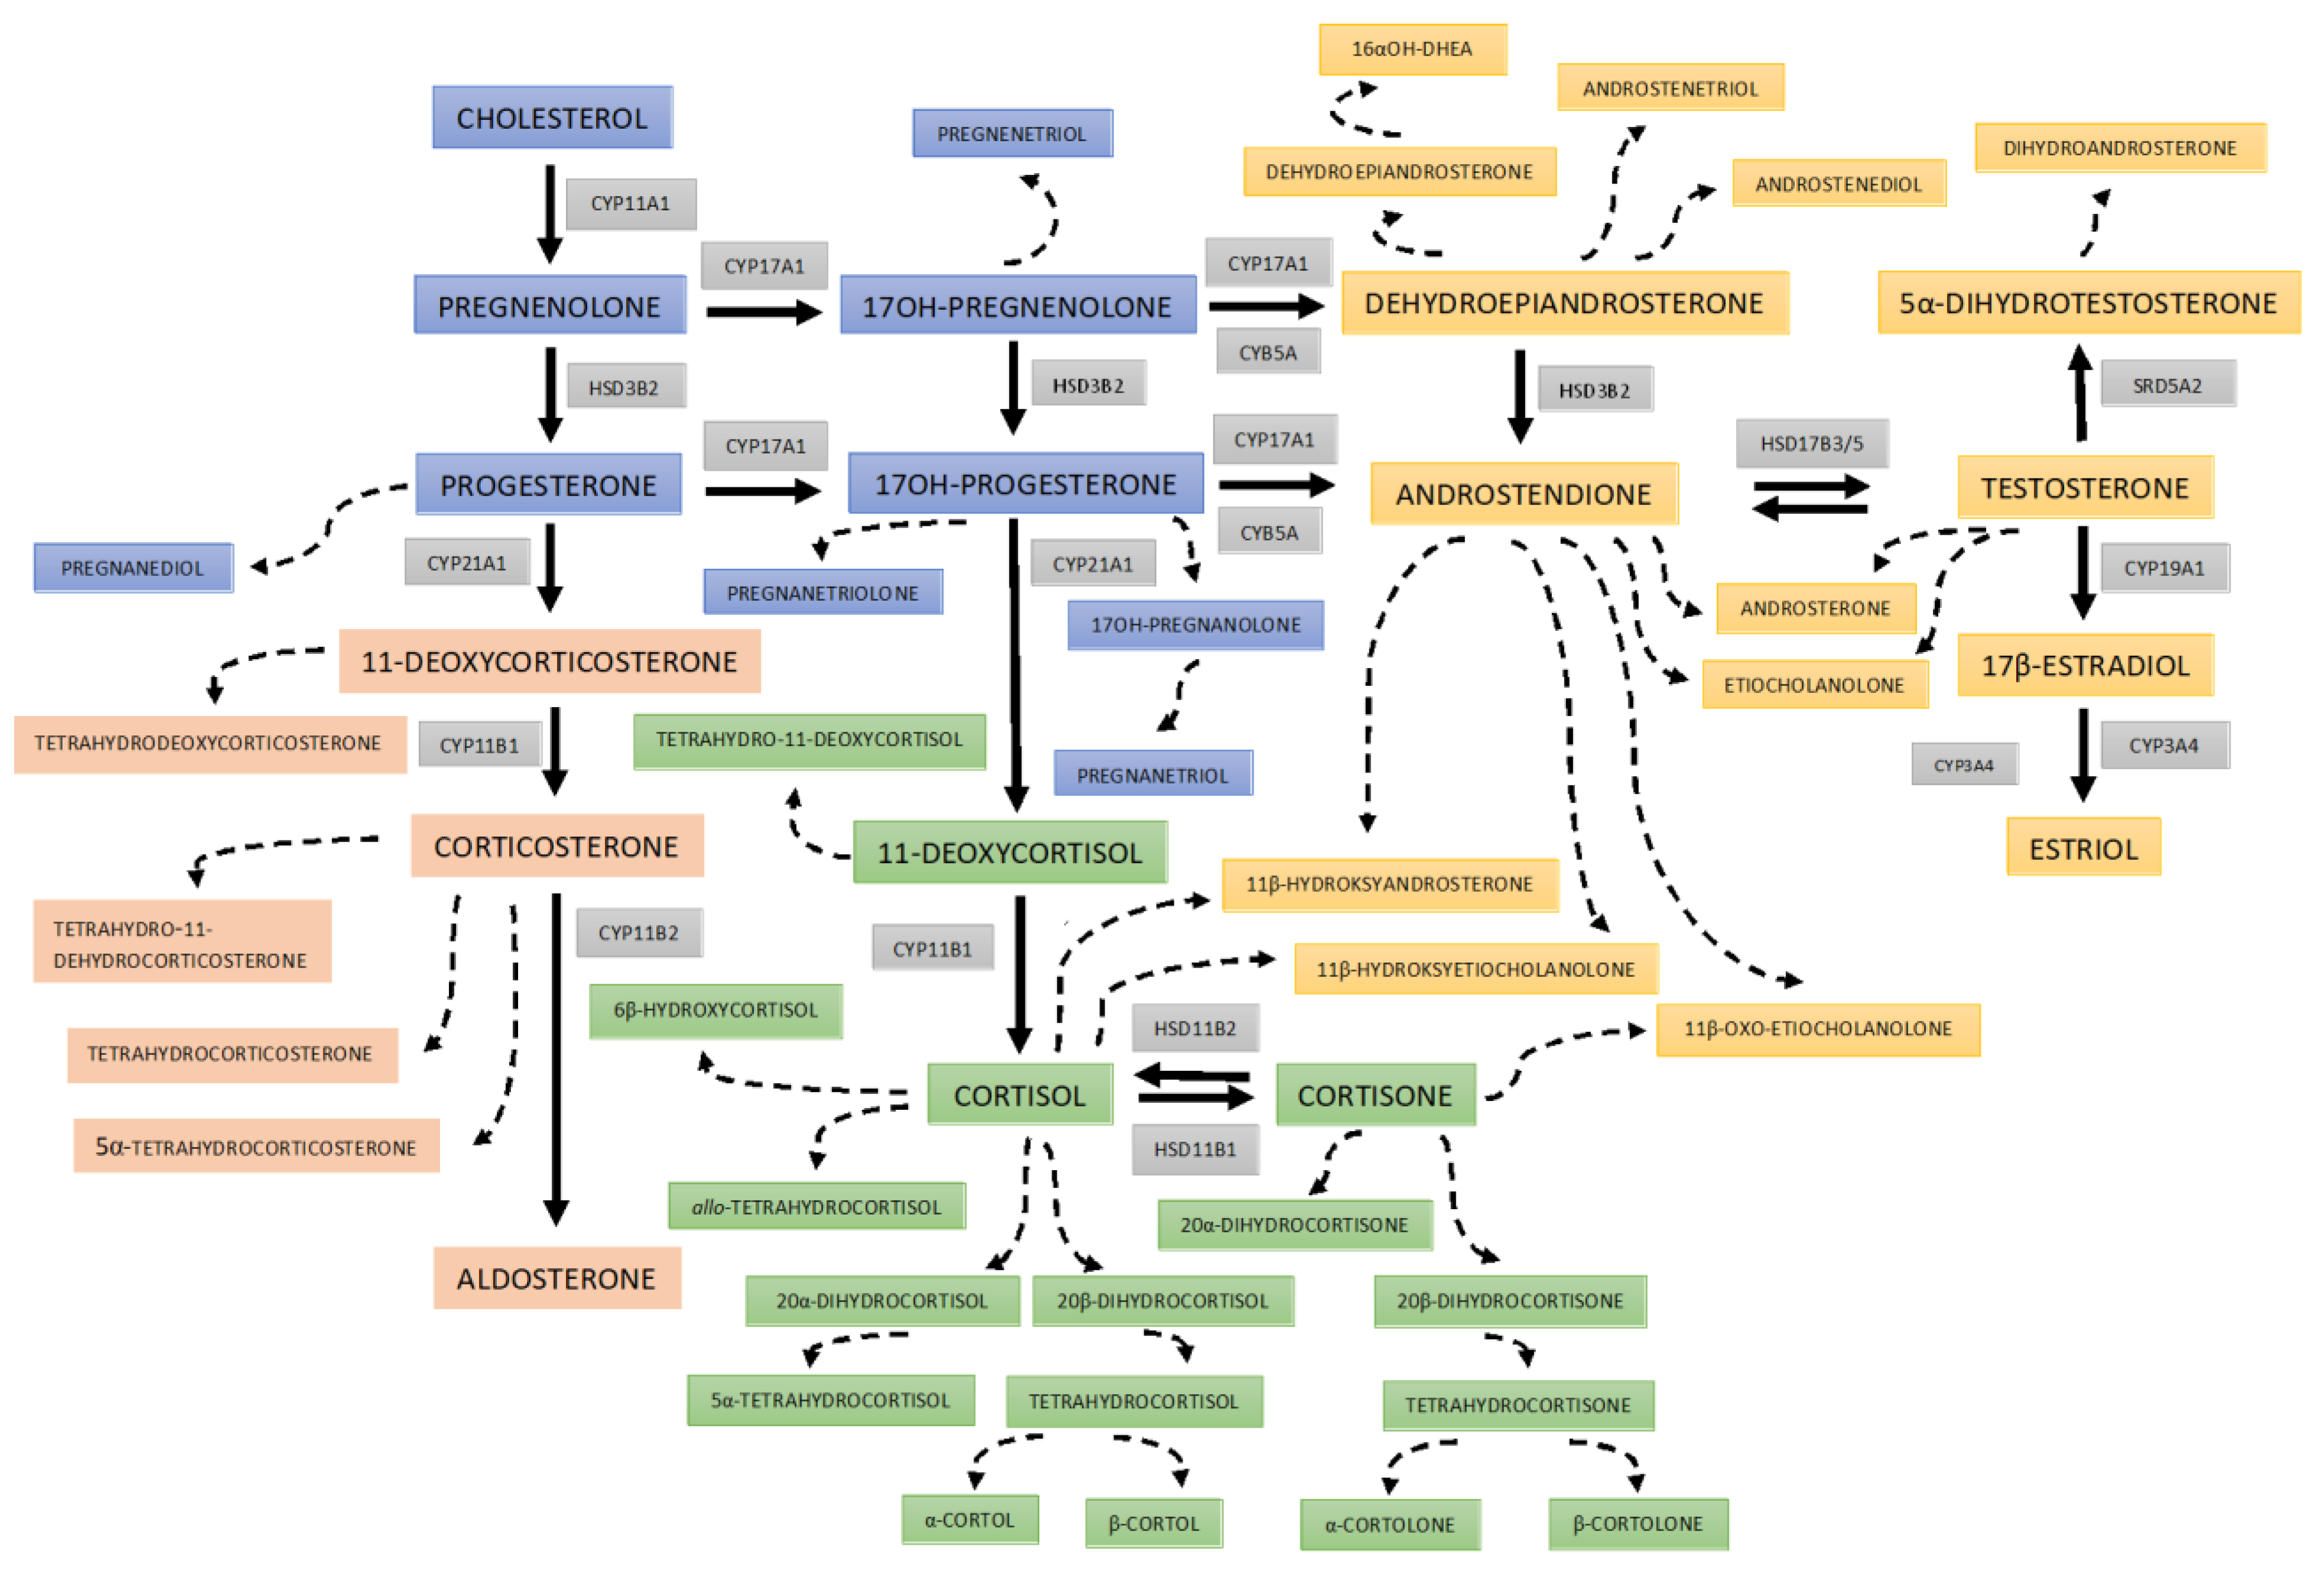
2.1. Quantification of the Urinary Steroid Metabolites
2.2. Statistical Analyses
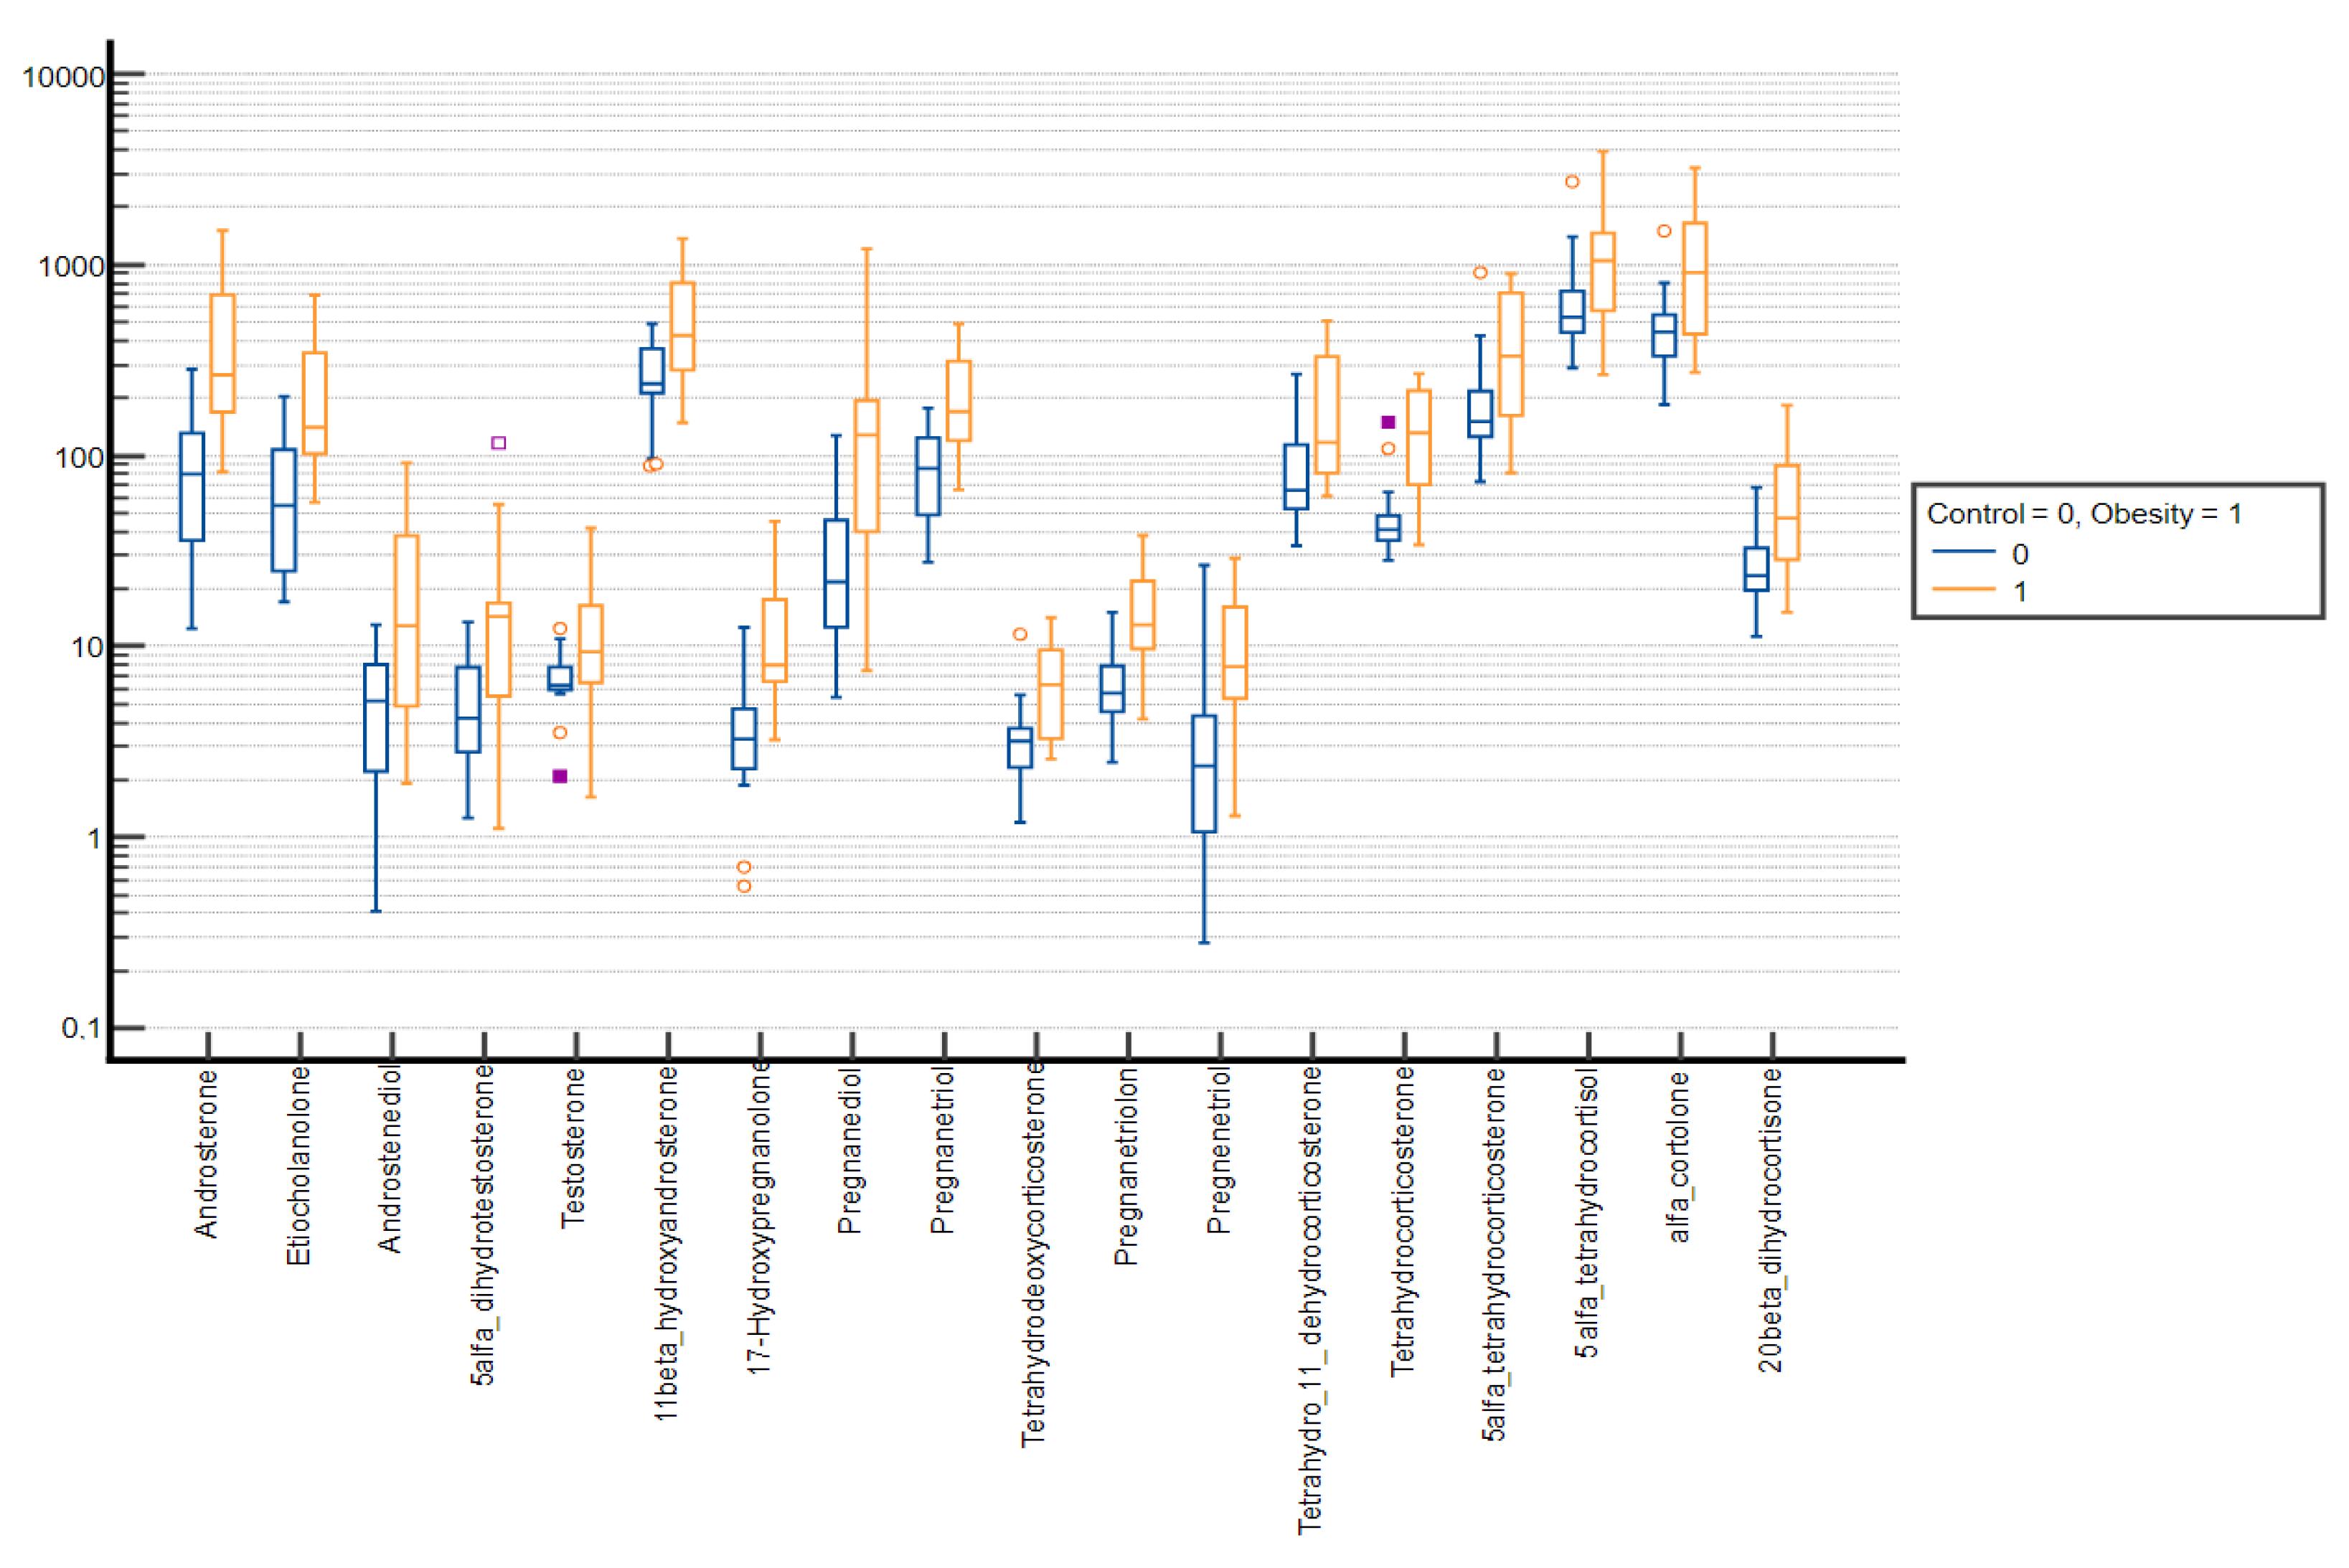
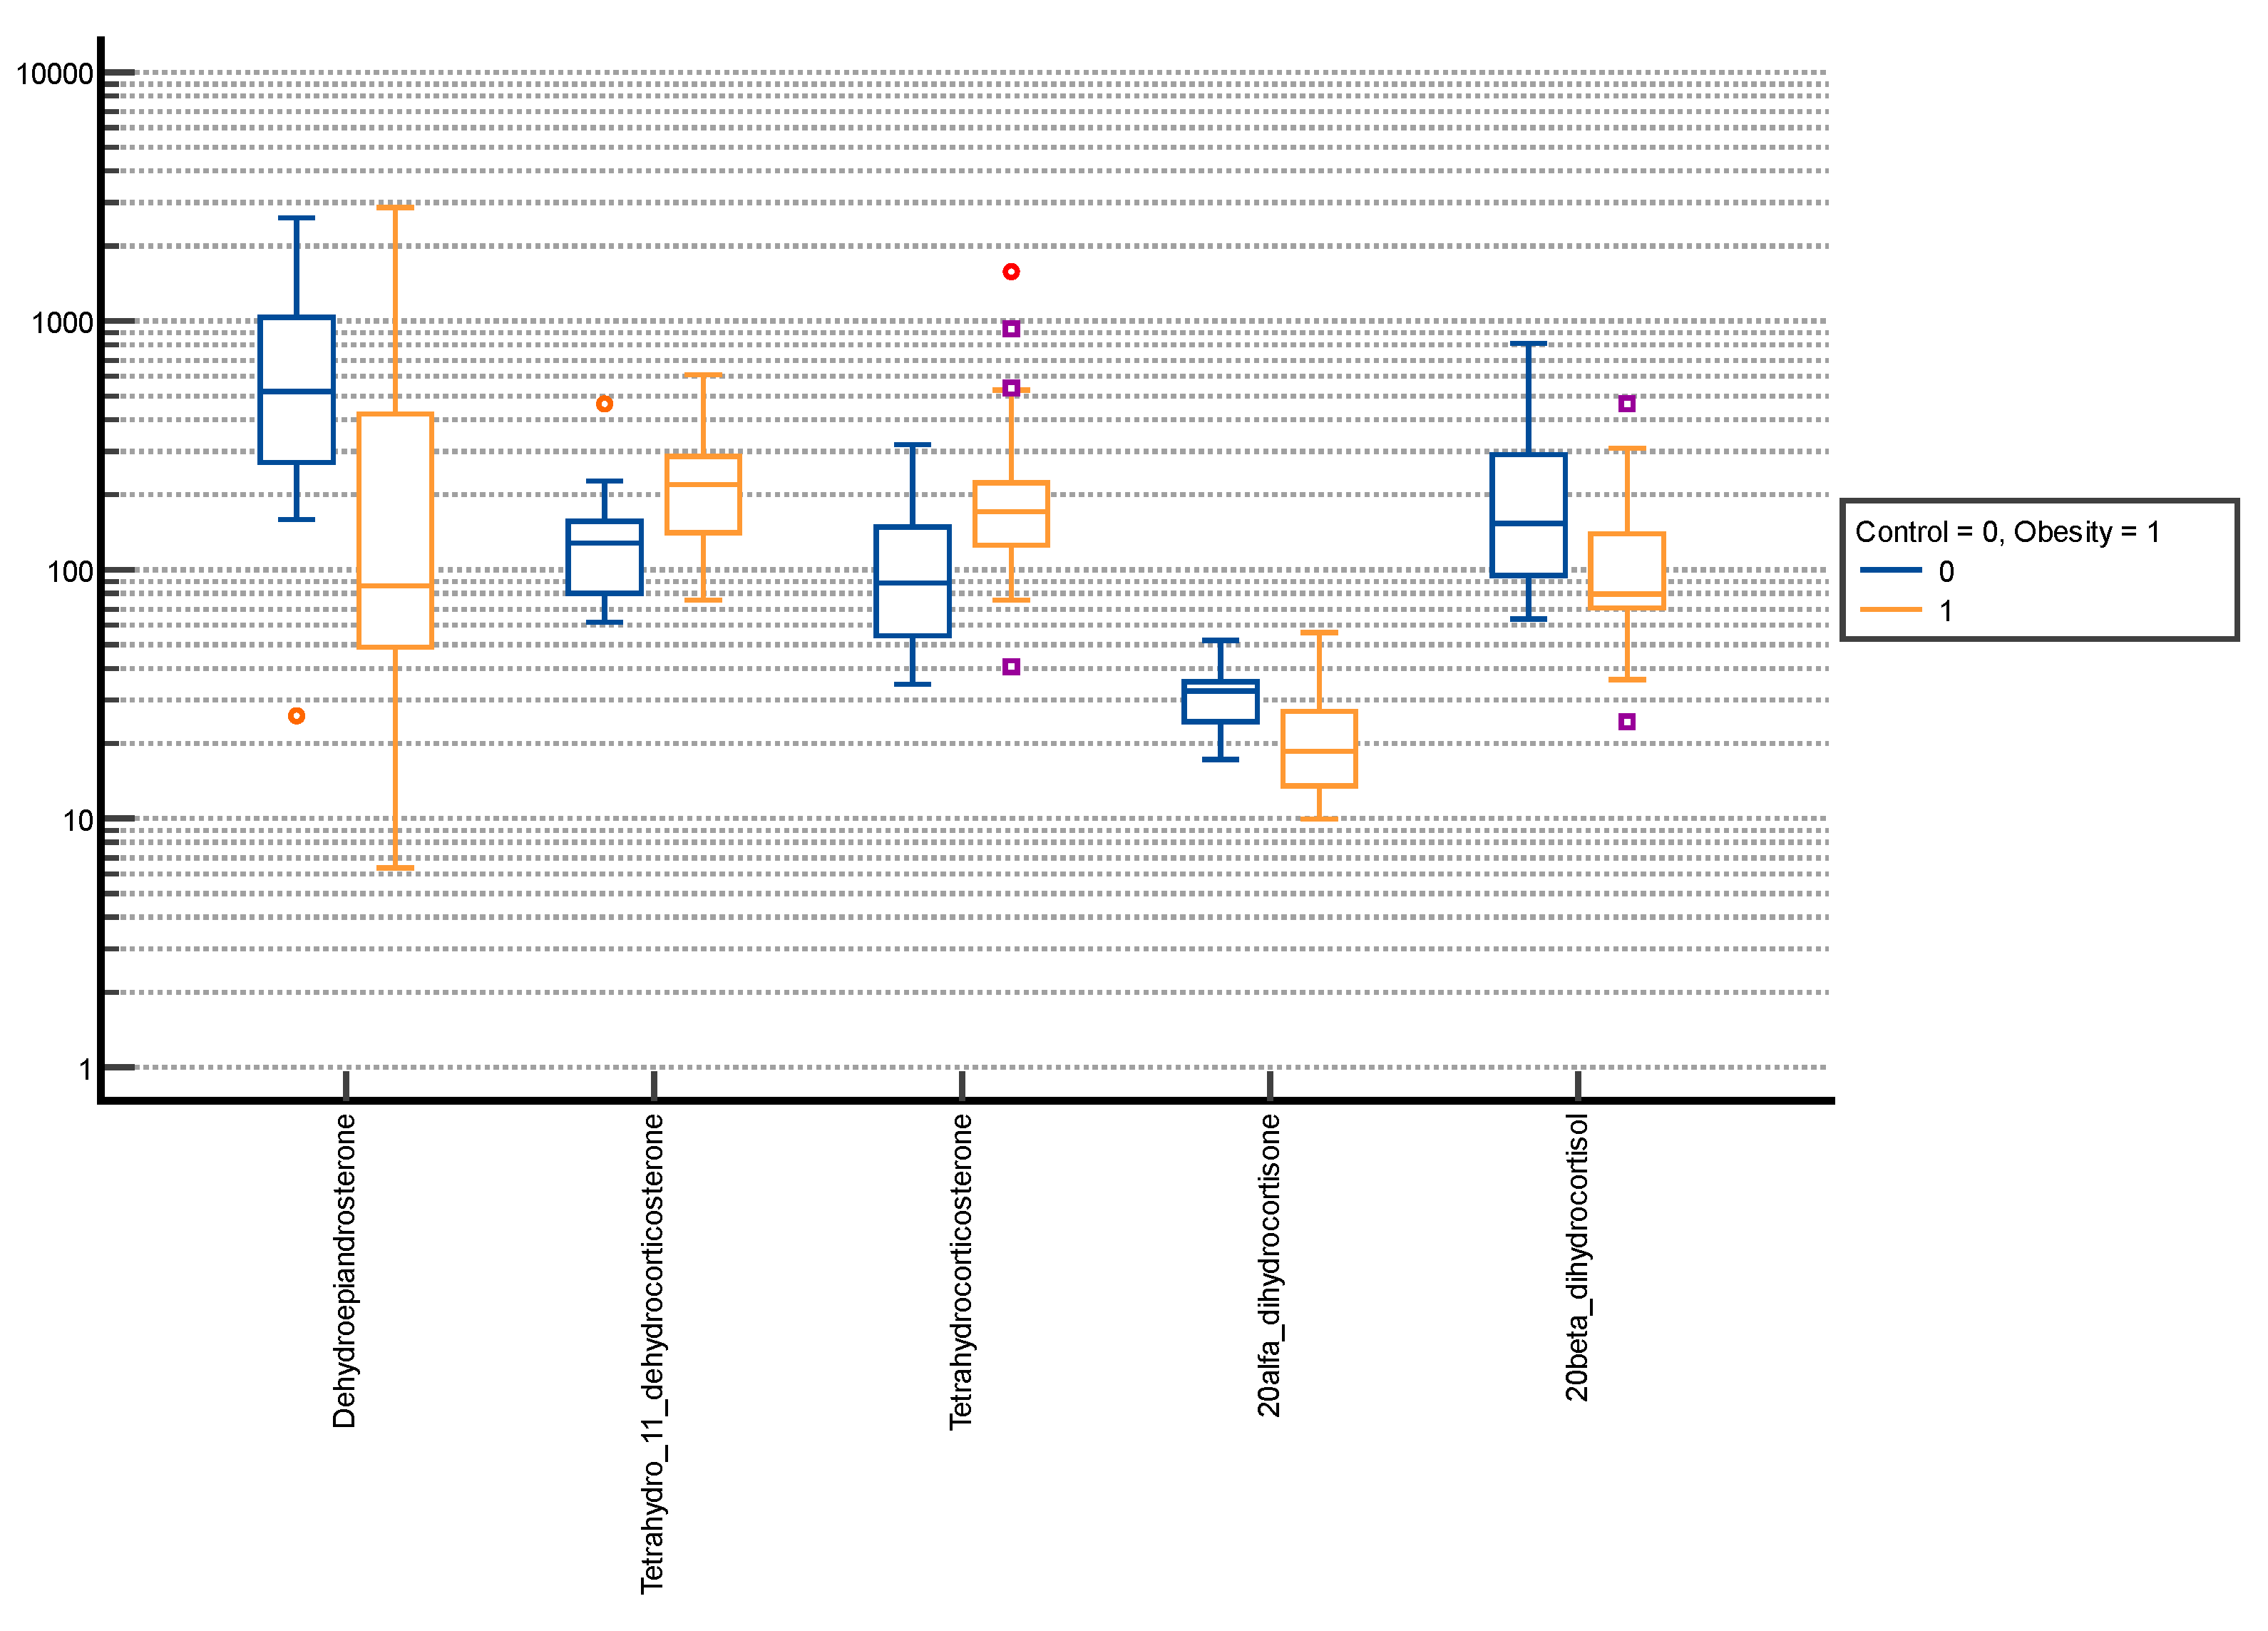
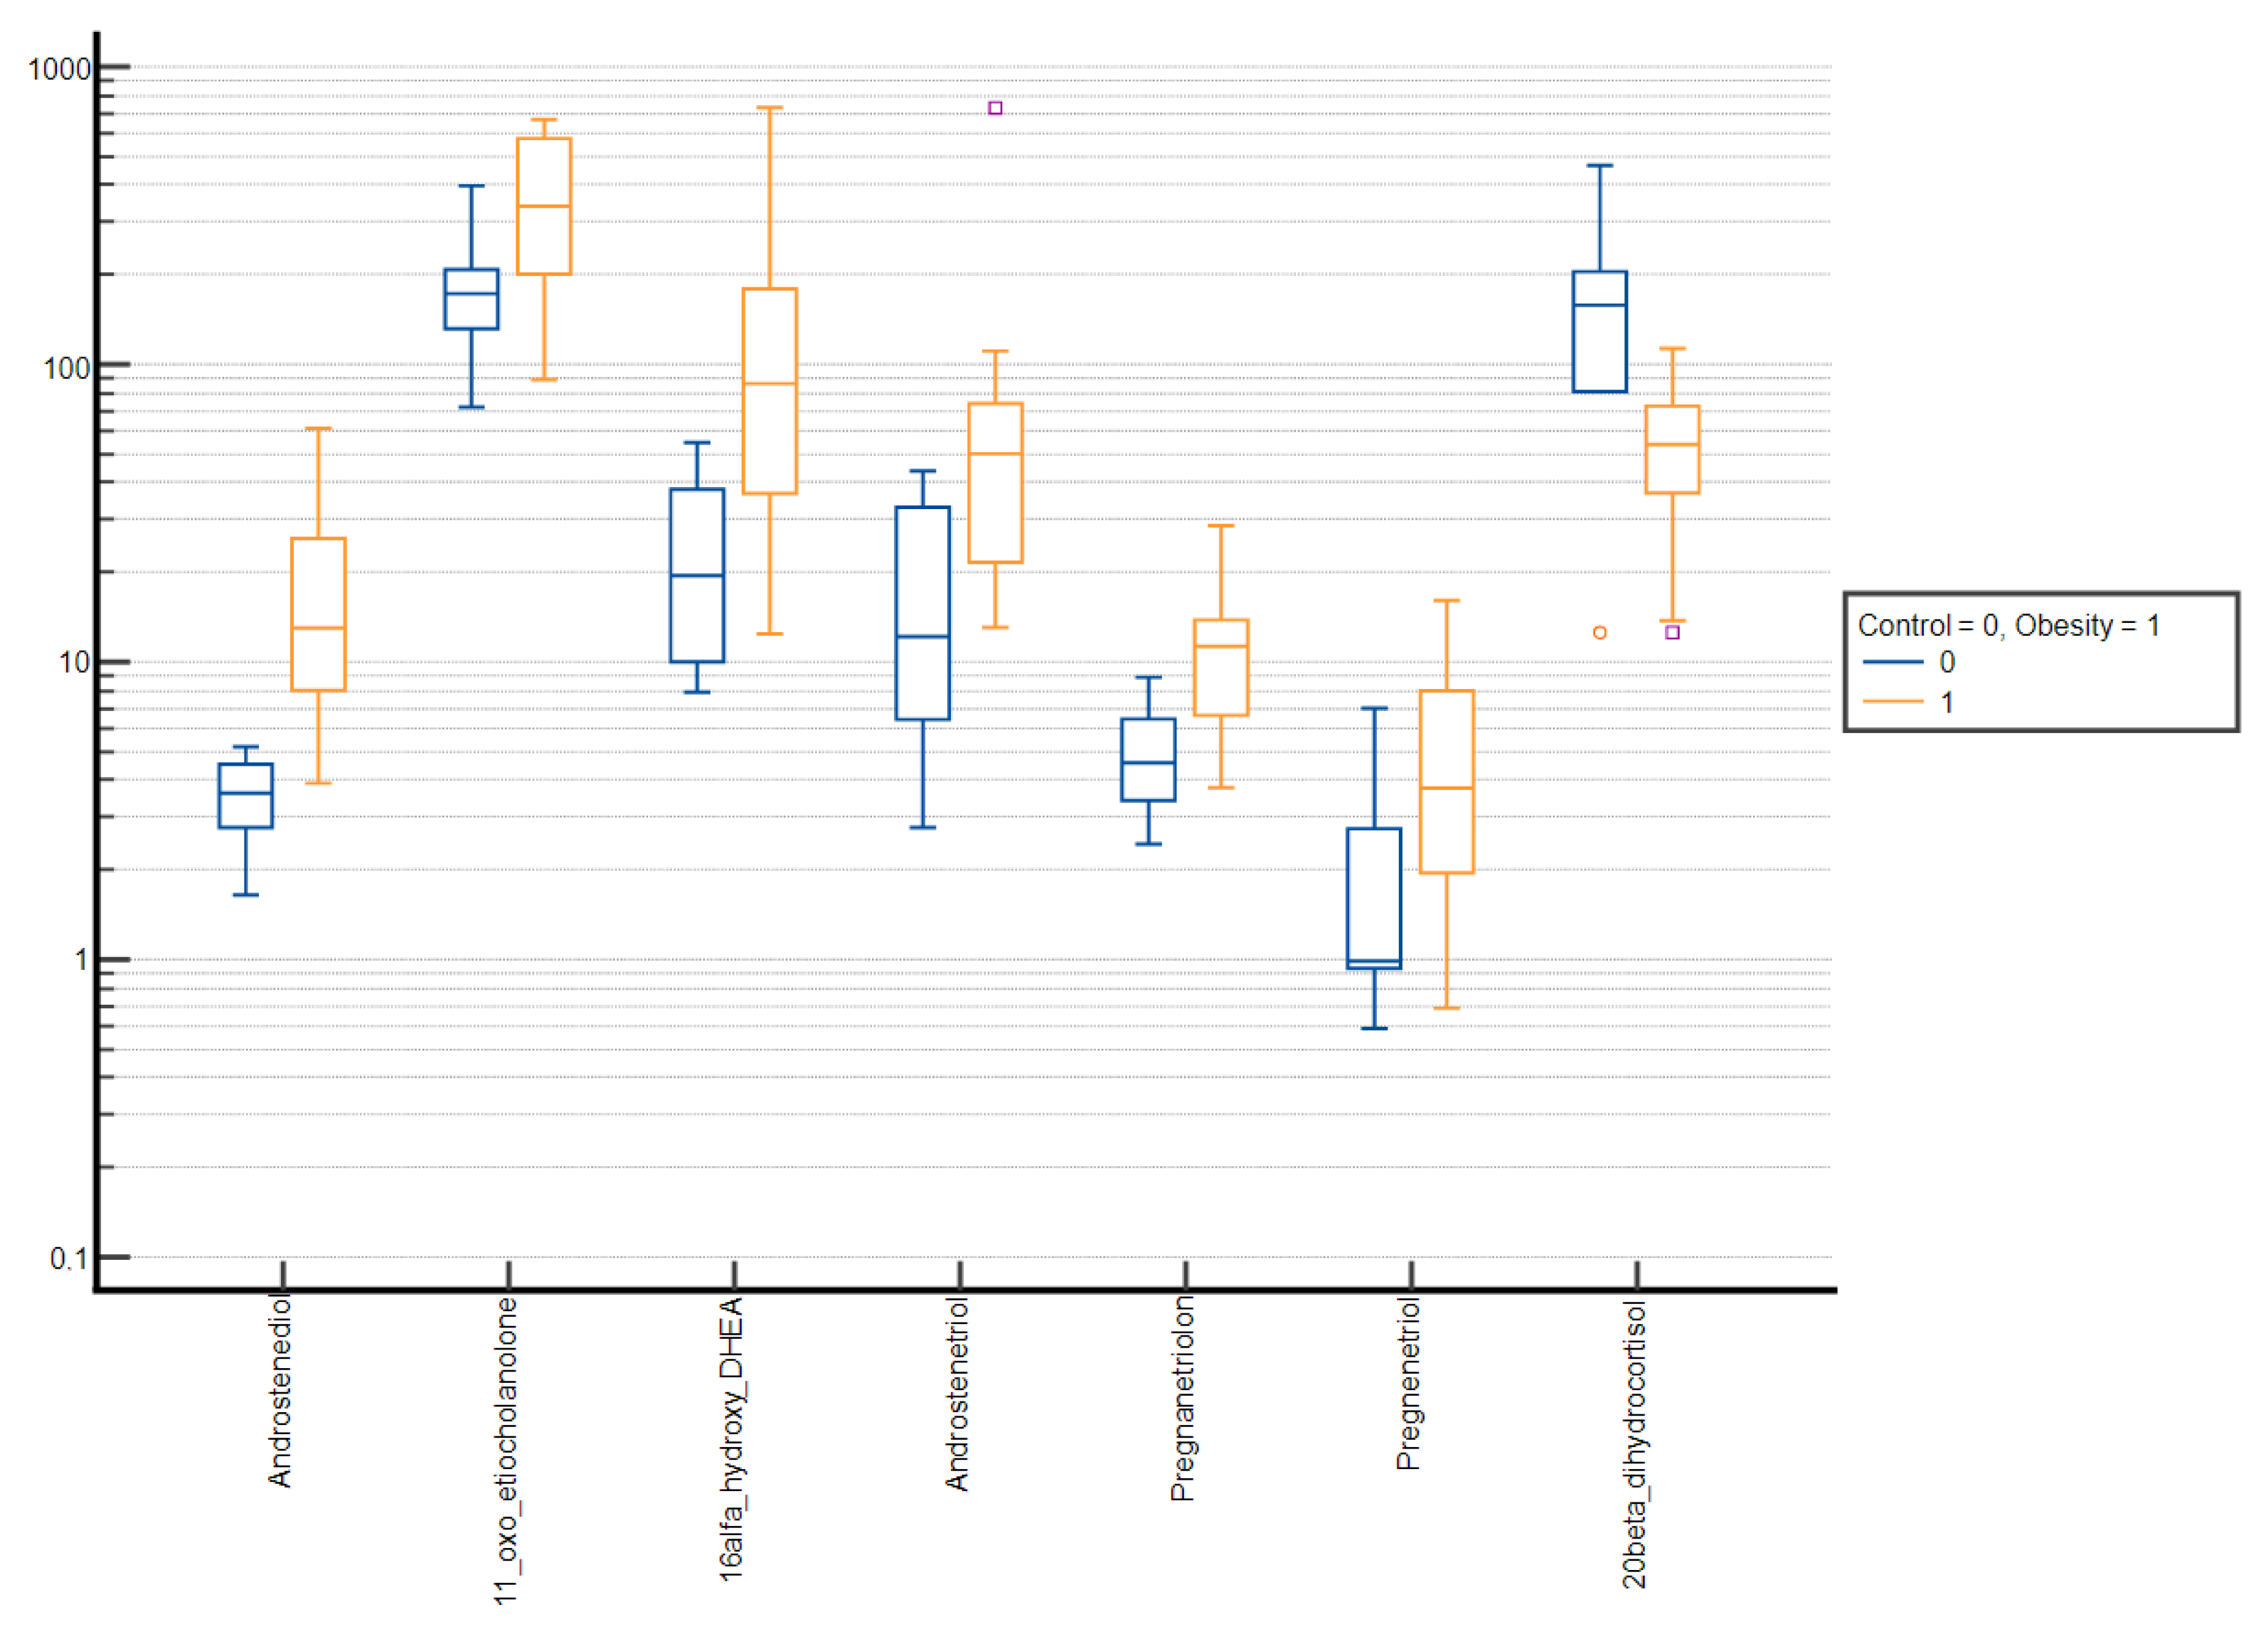
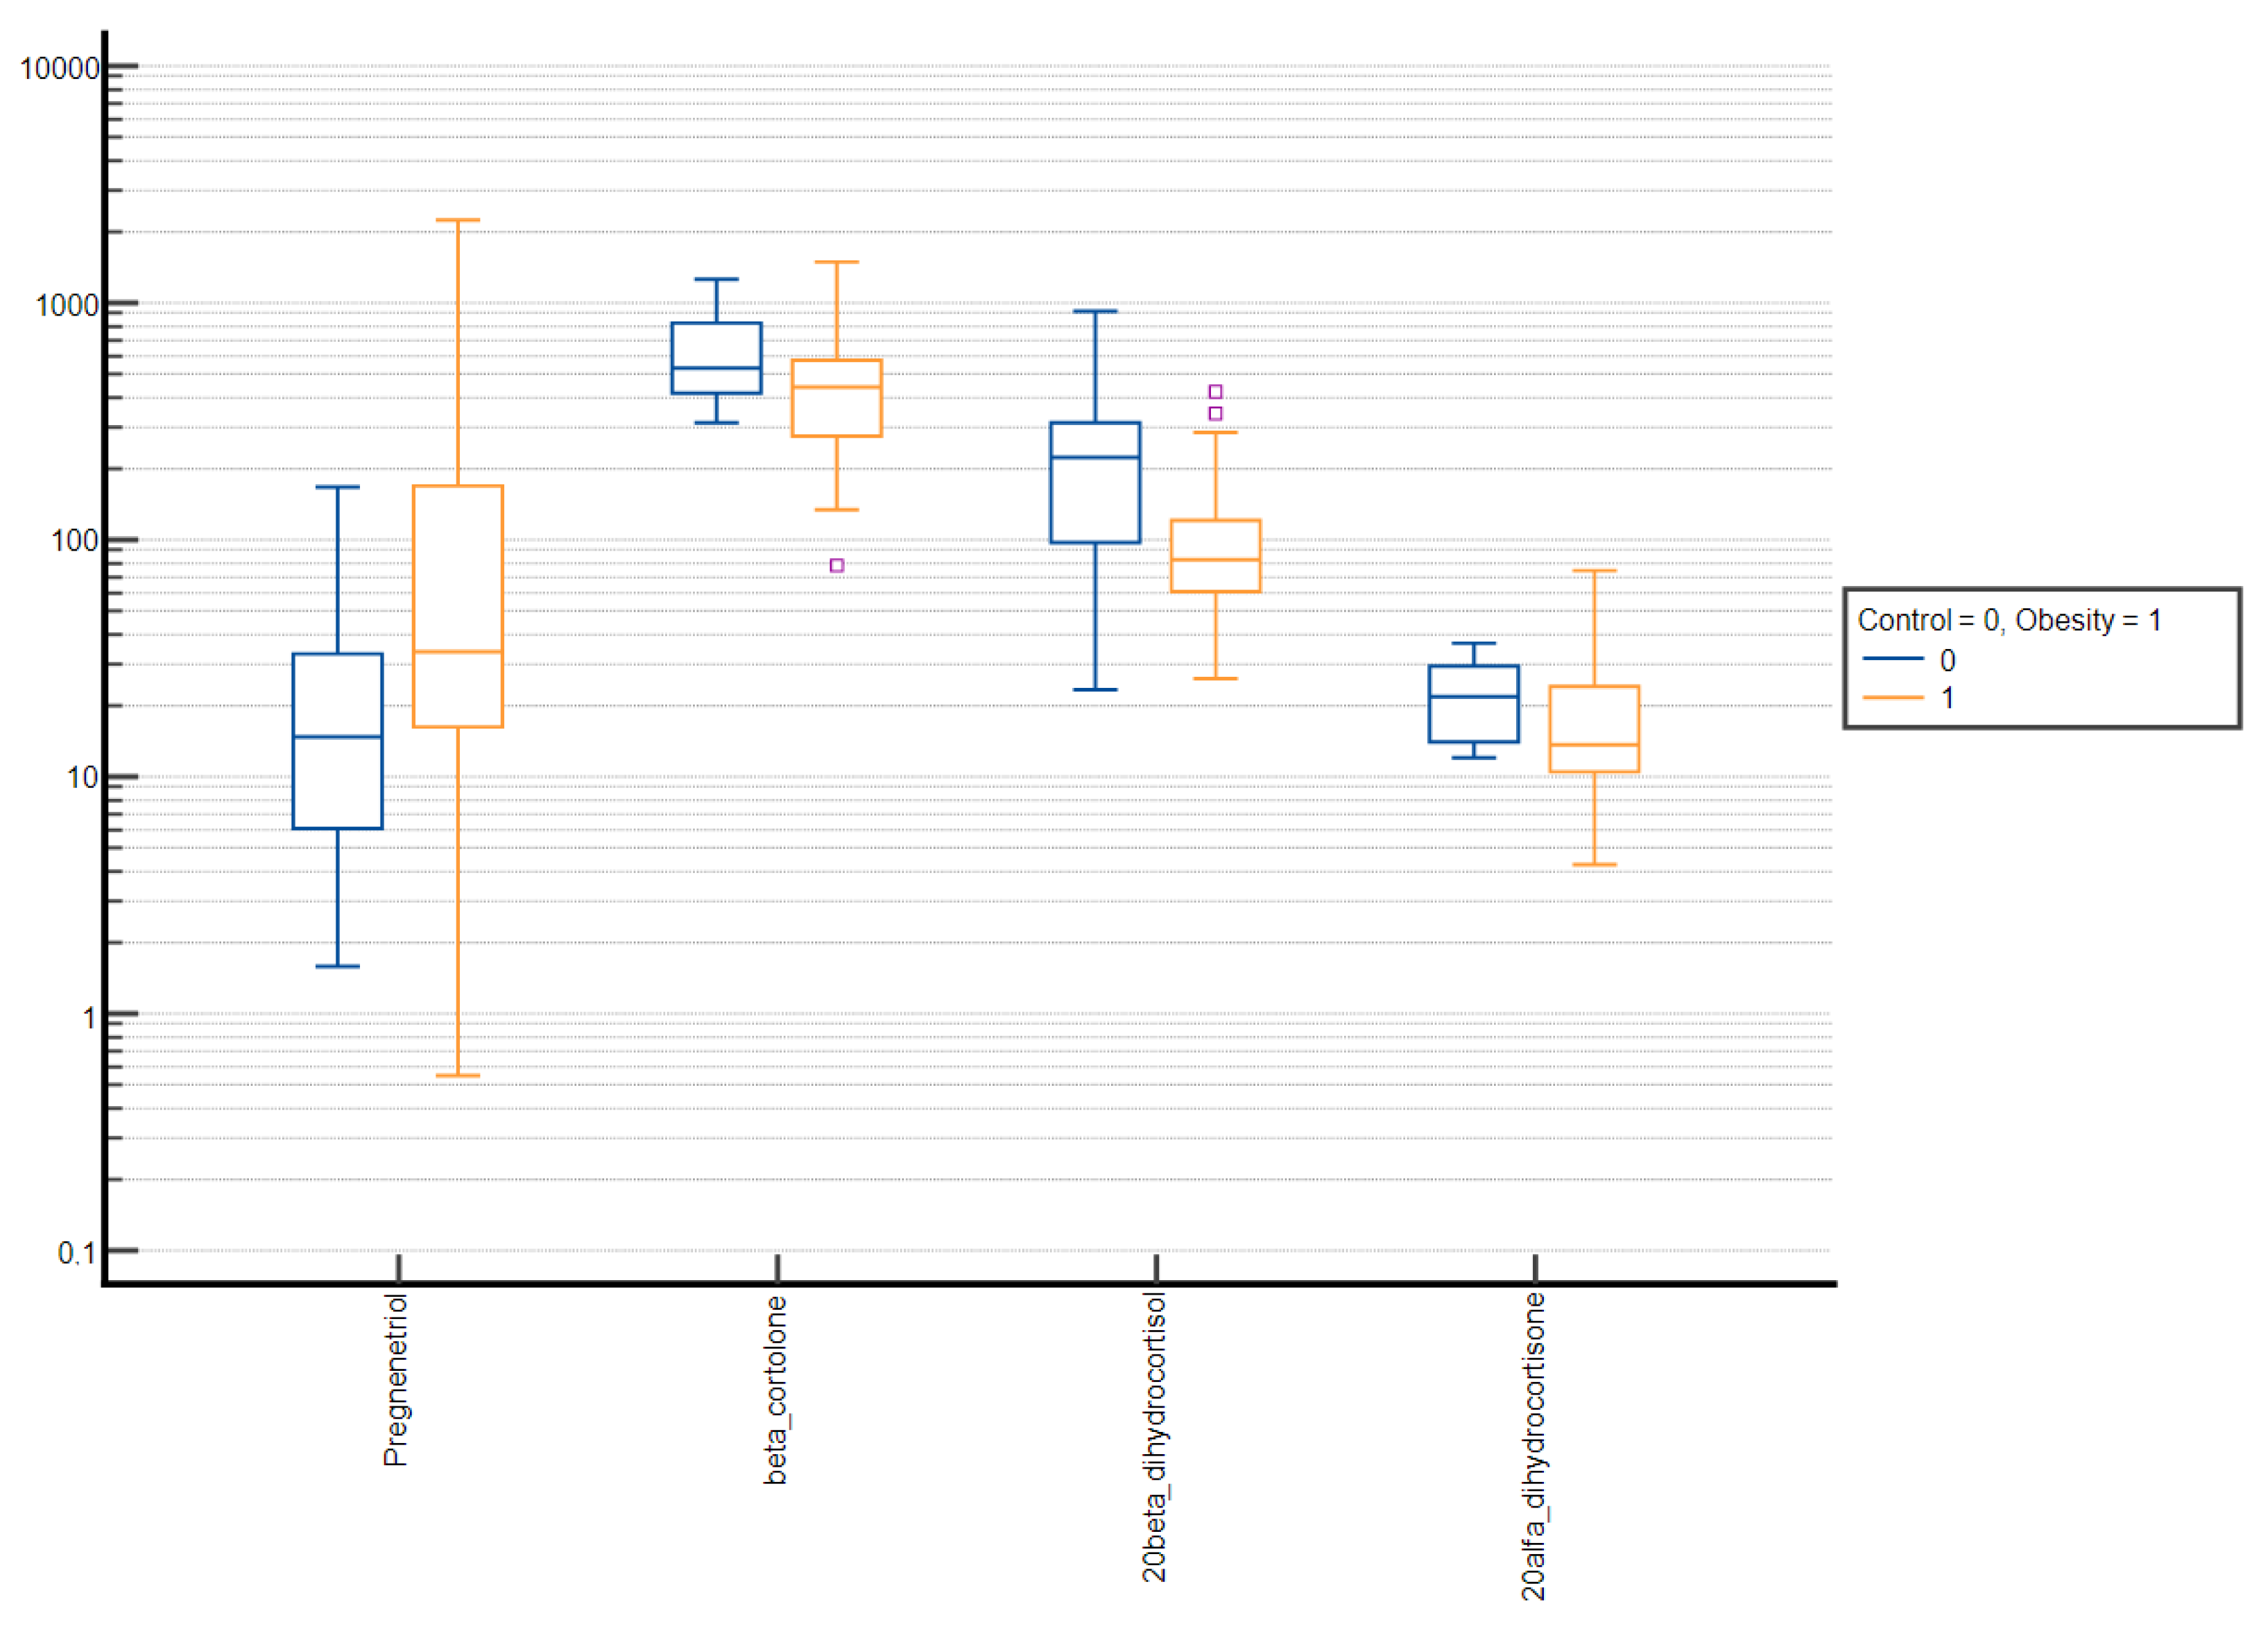
3. Results
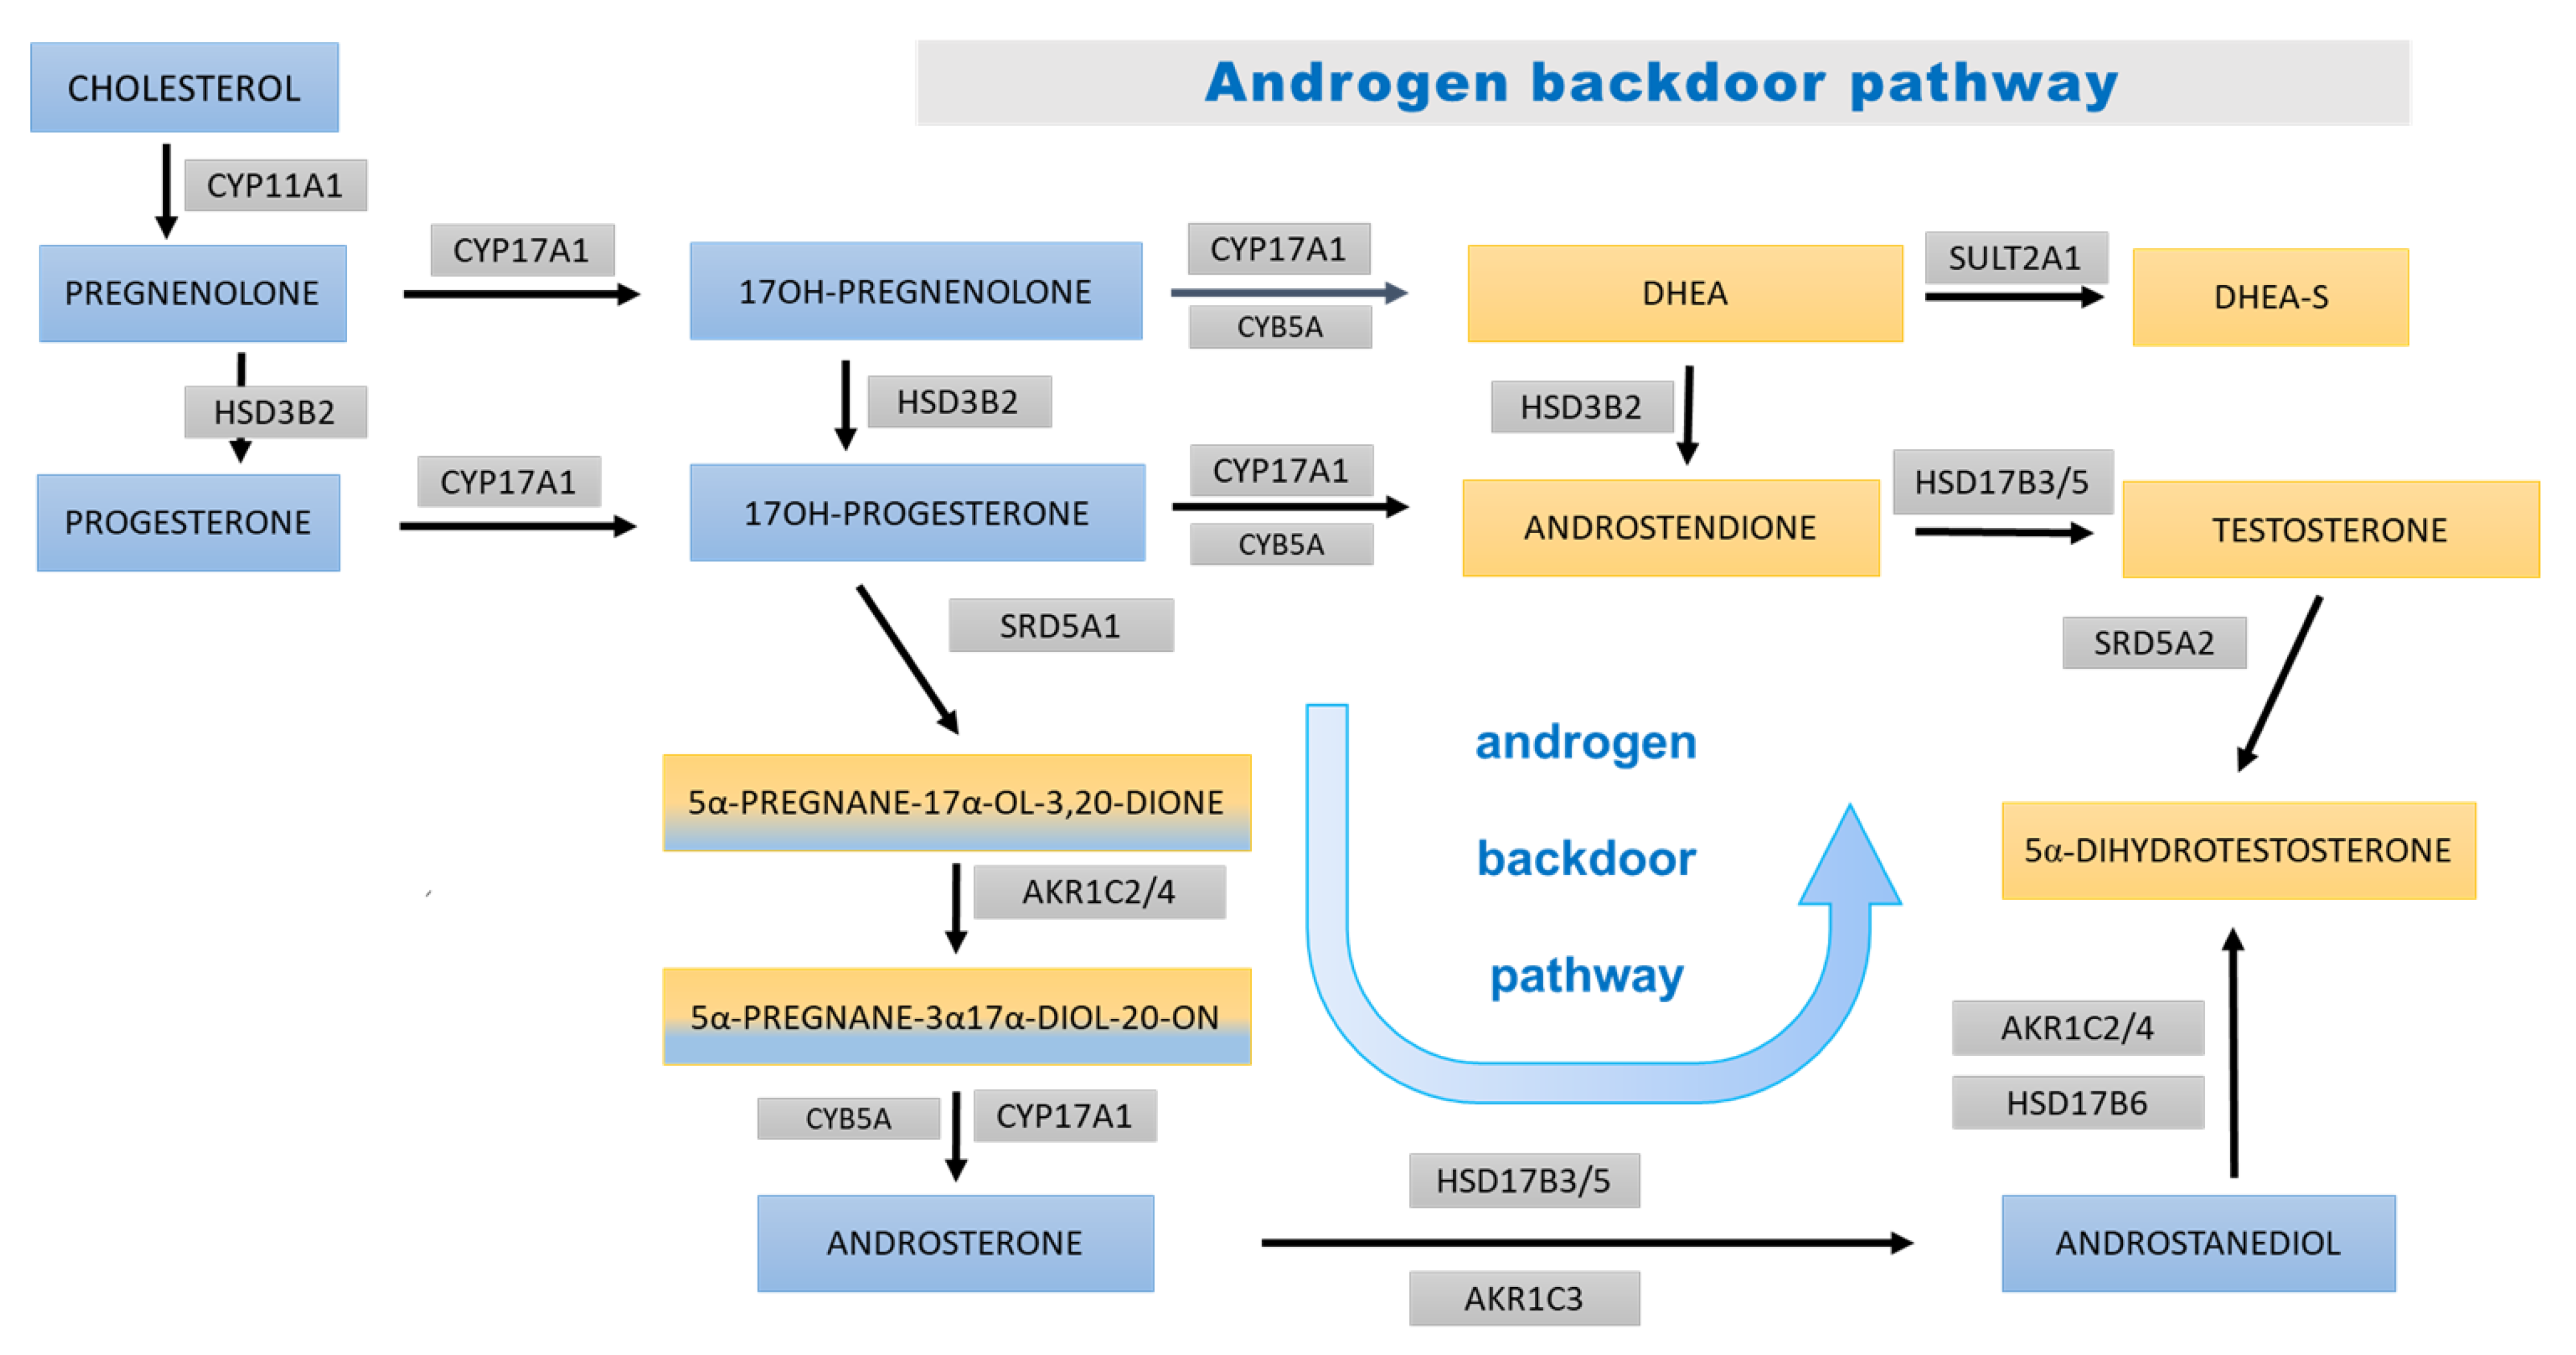
4. Discussion
4.1. General Remarks
4.2. Prepubertal Results
4.3. Pubertal Results
5. Concluding Remarks
Supplementary Materials
Author Contributions
Funding
Institutional Review Board Statement
Informed Consent Statement
Data Availability Statement
Conflicts of Interest
References
- NCD Risk Factor Collaboration (NCD-RisC). Worldwide trends in body-mass index, underweight, overweight, and obesity from 1975 to 2016: A pooled analysis of 2416 population-based measurement studies in 128·9 million children, adolescents, and adults. Lancet 2017, 390, 2627–2642. [Google Scholar] [CrossRef] [PubMed] [Green Version]
- Kim, E.S.; Kwon, Y.; Choe, Y.H.; Kim, M.J. COVID-19-related school closing aggravate obesity and glucose intolerance in pediatric patients with obesity. Sci. Rep. 2021, 11, 5494. [Google Scholar] [CrossRef] [PubMed]
- Weihrauch-Blüher, S.; Schwarz, P.; Klusmann, J.-H. Childhood obesity: Increased risk for cardiometabolic disease and cancer in adulthood. Metab.-Clin. Exp. 2019, 92, 147–152. [Google Scholar] [CrossRef] [PubMed]
- Gurnani, M.; Birken, C.; Hamilton, J. Childhood Obesity: Causes, Consequences, and Management. Pediatr. Clin. N. Am. 2015, 62, 821–840. [Google Scholar] [CrossRef]
- Thomas-Eapen, N. Childhood Obesity. Prim. Care 2021, 48, 505–515. [Google Scholar] [CrossRef]
- Nagl, M.; Hilbert, A.; de Zwaan, M.; Braehler, E.; Kersting, A. The German Version of the Dutch Eating Behavior Questionnaire: Psychometric Properties, Measurement Invariance, and Population-Based Norms. PLoS ONE 2016, 11, e0162510. [Google Scholar] [CrossRef]
- Sominsky, L.; Spencer, S.J. Eating behavior and stress: A pathway to obesity. Front. Psychol. 2014, 5, 434. [Google Scholar] [CrossRef]
- Kuckuck, S.; van der Valk, E.S.; Scheurink, A.J.W.; van der Voorn, B.; Iyer, A.M.; Visser, J.A.; Delhanty, P.J.D.; Berg, S.A.A.V.D.; van Rossum, E.F.C. Glucocorticoids, stress and eating: The mediating role of appetite-regulating hormones. Obes. Rev. Off. J. Int. Assoc. Study Obes. 2023, 24, e13539. [Google Scholar] [CrossRef]
- Lee, M.-J.; Pramyothin, P.; Karastergiou, K.; Fried, S.K. Deconstructing the roles of glucocorticoids in adipose tissue biology and the development of central obesity. Biochim. Biophys. Acta BBA-Mol. Basis Dis. 2014, 1842, 473–481. [Google Scholar] [CrossRef] [Green Version]
- Witt, B.R.; Thorneycroft, I.H. Reproductive steroid hormones: Generation, degradation, reception, and action. Clin. Obstet. Gynecol. 1990, 33, 563–575. [Google Scholar] [CrossRef]
- Lee, S.R.; Lee, S.-Y.; Kim, S.-Y.; Ryu, S.-Y.; Park, B.-K.; Hong, E.-J. Hydroxylation and sulfation of sex steroid hormones in inflammatory liver. J. Biomed. Res. 2017, 31, 437–444. [Google Scholar] [CrossRef] [PubMed]
- Vicennati, V.; Pasquali, R. Abnormalities of the hypothalamic-pituitary-adrenal axis in nondepressed women with abdominal obesity and relations with insulin resistance: Evidence for a central and a peripheral alteration. J. Clin. Endocrinol. Metab. 2000, 85, 4093–4098. [Google Scholar] [CrossRef] [PubMed]
- Bose, M.; Oliván, B.; Laferrère, B. Stress and obesity: The role of the hypothalamic–pituitary–adrenal axis in metabolic disease. Curr. Opin. Endocrinol. Diabetes Obes. 2009, 16, 340–346. [Google Scholar] [CrossRef] [PubMed] [Green Version]
- Baudrand, R.; Vaidya, A. Cortisol dysregulation in obesity-related metabolic disorders. Curr. Opin. Endocrinol. Diabetes Obes. 2015, 22, 143–149. [Google Scholar] [CrossRef] [Green Version]
- Incollingo Rodriguez, A.C.; Epel, E.S.; White, M.L.; Standen, E.C.; Seckl, J.R.; Tomiyama, A.J. Hypothalamic-pituitary-adrenal axis dysregulation and cortisol activity in obesity: A systematic review. Psychoneuroendocrinology 2015, 62, 301–318. [Google Scholar] [CrossRef] [Green Version]
- Tenk, J.; Mátrai, P.; Hegyi, P.; Rostás, I.; Garami, A.; Szabó, I.; Solymár, M.; Pétervári, E.; Czimmer, J.; Márta, K.; et al. In Obesity, HPA Axis Activity Does Not Increase with BMI, but Declines with Aging: A Meta-Analysis of Clinical Studies. PLoS ONE 2016, 11, e0166842. [Google Scholar] [CrossRef] [Green Version]
- Juricskay, Z.; Molnár, D. Steroid metabolism in obese children II. Steroid excretion of obese and normal weight children. Acta Paediatr. Hung. 1988, 29, 395–403. [Google Scholar]
- Reinehr, T.; Kulle, A.; Wolters, B.; Lass, N.; Welzel, M.; Riepe, F.; Holterhus, P.-M. Steroid Hormone Profiles in Prepubertal Obese Children Before and After Weight Loss. J. Clin. Endocrinol. Metab. 2013, 98, E1022–E1030. [Google Scholar] [CrossRef] [Green Version]
- Kim, S.-H.; Kim, S.-E.; Choi, M.H.; Park, M.J. Altered glucocorticoid metabolism in girls with central obesity. Mol. Cell. Endocrinol. 2021, 527, 111225. [Google Scholar] [CrossRef]
- Yu, T.; Zhou, W.; Wu, S.; Liu, Q.; Li, X. Evidence for disruption of diurnal salivary cortisol rhythm in childhood obesity: Relationships with anthropometry, puberty and physical activity. BMC Pediatr. 2020, 20, 381. [Google Scholar] [CrossRef]
- Knutsson, U.; Dahlgren, J.; Marcus, C.; Rosberg, S.; Brönnegård, M.; Stierna, P.; Albertsson-Wikland, K. Circadian cortisol rhythms in healthy boys and girls: Relationship with age, growth, body composition, and pubertal development. J. Clin. Endocrinol. Metab. 1997, 82, 536–540. [Google Scholar] [CrossRef] [PubMed]
- Abraham, S.; Rubino, D.; Sinaii, N.; Ramsey, S.; Nieman, L. Cortisol, obesity and the metabolic syndrome: A cross-sectional study of obese subjects and review of the literature. Obes. Silver Spring Md. 2013, 21, E105–E117. [Google Scholar] [CrossRef] [PubMed] [Green Version]
- Strain, G.W.; Zumoff, B.; Strain, J.J.; Levin, J.; Fukushima, D.K. Cortisol production in obesity. Metab. Clin. Exp. 1980, 29, 980–985. [Google Scholar] [CrossRef] [PubMed]
- Genitsaridi, S.-M.; Karampatsou, S.; Papageorgiou, I.; Mantzou, A.; Papathanasiou, C.; Kassari, P.; Paltoglou, G.; Kourkouti, C.; Charmandari, E. Hair Cortisol Concentrations in Overweight and Obese Children and Adolescents. Horm. Res. Paediatr. 2019, 92, 229–236. [Google Scholar] [CrossRef] [PubMed]
- Bornstein, S.R.; Uhlmann, K.; Haidan, A.; Ehrhart-Bornstein, M.; Scherbaum, W.A. Evidence for a novel peripheral action of leptin as a metabolic signal to the adrenal gland: Leptin inhibits cortisol release directly. Diabetes 1997, 46, 1235–1238. [Google Scholar] [CrossRef] [PubMed] [Green Version]
- Kruse, M.; Bornstein, S.R.; Uhlmann, K.; Paeth, G.; Scherbaum, W.A. Leptin down-regulates the steroid producing system in the adrenal. Endocr. Res. 1998, 24, 587–590. [Google Scholar] [CrossRef]
- Buechler, C.; Wanninger, J.; Neumeier, M. Adiponectin, a key adipokine in obesity related liver diseases. World J. Gastroenterol. WJG 2011, 17, 2801–2811. [Google Scholar] [CrossRef] [Green Version]
- Targher, G.; Bertolini, L.; Scala, L.; Poli, F.; Zenari, L.; Falezza, G. Decreased plasma adiponectin concentrations are closely associated with nonalcoholic hepatic steatosis in obese individuals. Clin. Endocrinol. 2004, 61, 700–703. [Google Scholar] [CrossRef]
- Cheek, D.B.; Graystone, J.E.; Seamark, R.F.; McIntosh, J.E.; Phillipou, G.; Court, J.M. Urinary steroid metabolites and the overgrowth of lean and fat tissues in obese girls. Am. J. Clin. Nutr. 1981, 34, 1804–1810. [Google Scholar] [CrossRef]
- Wiegand, S.; Richardt, A.; Remer, T.; Wudy, S.A.; Tomlinson, J.W.; Hughes, B.; Grüters, A.; Stewart, P.M.; Strasburger, C.J.; Quinkler, M. Reduced 11beta-hydroxysteroid dehydrogenase type 1 activity in obese boys. Eur. J. Endocrinol. 2007, 157, 319–324. [Google Scholar] [CrossRef] [Green Version]
- Veldhorst, M.A.B.; Noppe, G.; Jongejan, M.H.T.M.; Kok, C.B.M.; Mekic, S.; Koper, J.W.; van Rossum, E.F.C.; van den Akker, E.L. Increased Scalp Hair Cortisol Concentrations in Obese Children. J. Clin. Endocrinol. Metab. 2014, 99, 285–290. [Google Scholar] [CrossRef] [PubMed] [Green Version]
- Krone, N.; Hughes, B.A.; Lavery, G.G.; Stewart, P.M.; Arlt, W.; Shackleton, C.H.L. Gas chromatography/mass spectrometry (GC/MS) remains a pre-eminent discovery tool in clinical steroid investigations even in the era of fast liquid chromatography tandem mass spectrometry (LC/MS/MS). J. Steroid Biochem. Mol. Biol. 2010, 121, 496–504. [Google Scholar] [CrossRef] [PubMed]
- Shackleton, C.; Pozo, O.J.; Marcos, J. GC/MS in Recent. Years Has. Defined the Normal and Clinically Disordered Steroidome: Will. It Soon Be Surpassed by LC/Tandem MS in This Role? J. Endocr. Soc. 2018, 2, 974–996. [Google Scholar] [CrossRef] [PubMed] [Green Version]
- Schiffer, L.; Barnard, L.; Baranowski, E.S.; Gilligan, L.C.; Taylor, A.E.; Arlt, W.; Shackleton, C.H.; Storbeck, K.-H. Human steroid biosynthesis, metabolism and excretion are differentially reflected by serum and urine steroid metabolomes: A comprehensive review. J. Steroid Biochem. Mol. Biol. 2019, 194, 105439. [Google Scholar] [CrossRef]
- Gawlik, A.; Shmoish, M.; Hartmann, M.F.; Malecka-Tendera, E.; Wudy, S.A.; Hochberg, Z. Peer group normalization and urine to blood context in steroid metabolomics: The case of CAH and obesity. Steroids 2014, 88, 83–89. [Google Scholar] [CrossRef]
- Gawlik, A.; Shmoish, M.; Hartmann, M.F.; Malecka-Tendera, E.; Wudy, S.A.; Hochberg, Z. Steroid Metabolomic Disease Signature of Nonsyndromic Childhood Obesity. J. Clin. Endocrinol. Metab. 2016, 101, 4329–4337. [Google Scholar] [CrossRef] [Green Version]
- Sumińska, M.; Podgórski, R.; Fichna, P.; Fichna, M. Steroid Metabolism in Children and Adolescents With Obesity and Insulin Resistance: Altered SRD5A and 20α/20βHSD Activity. Front. Endocrinol. 2021, 12, 759971. [Google Scholar] [CrossRef] [PubMed]
- Pruszkowska-Przybylska, P.; Sitek, A.; Rosset, I.; Sobalska-Kwapis, M.; Słomka, M.; Strapagiel, D.; Żądzińska, E.; Morling, N. Cortisol concentration affects fat and muscle mass among Polish children aged 6–13 years. BMC Pediatr. 2021, 21, 365. [Google Scholar] [CrossRef]
- Li, J.; Papadopoulos, V.; Vihma, V. Steroid biosynthesis in adipose tissue. Steroids 2015, 103, 89–104. [Google Scholar] [CrossRef]
- Atkovska, K.; Klingler, J.; Oberwinkler, J.; Keller, S.; Hub, J.S. Rationalizing Steroid Interactions with Lipid Membranes: Conformations, Partitioning, and Kinetics. ACS Cent. Sci. 2018, 4, 1155–1165. [Google Scholar] [CrossRef]
- Chapman, K.; Holmes, M.; Seckl, J. 11β-hydroxysteroid dehydrogenases: Intracellular gate-keepers of tissue glucocorticoid action. Physiol. Rev. 2013, 93, 1139–1206. [Google Scholar] [CrossRef] [Green Version]
- Stewart, P.M. Tissue-specific Cushing’s syndrome, 11beta-hydroxysteroid dehydrogenases and the redefinition of corticosteroid hormone action. Eur. J. Endocrinol. 2003, 149, 163–168. [Google Scholar] [CrossRef] [PubMed] [Green Version]
- Seckl, J.R.; Walker, B.R. Minireview: 11beta-hydroxysteroid dehydrogenase type 1—A tissue-specific amplifier of glucocorticoid action. Endocrinology 2001, 142, 1371–1376. [Google Scholar] [CrossRef] [PubMed]
- Gregory, S.; Hill, D.; Grey, B.; Ketelbey, W.; Miller, T.; Muniz-Terrera, G.; Ritchie, C.W. 11β-hydroxysteroid dehydrogenase type 1 inhibitor use in human disease-a systematic review and narrative synthesis. Metabolism 2020, 108, 154246. [Google Scholar] [CrossRef] [PubMed]
- Almeida, C.; Monteiro, C.; Silvestre, S. Inhibitors of 11β-Hydroxysteroid Dehydrogenase Type 1 as Potential Drugs for Type 2 Diabetes Mellitus—A Systematic Review of Clinical and In Vivo Preclinical Studies. Sci. Pharm. 2021, 89, 5. [Google Scholar] [CrossRef]
- Glasow, A.; Bornstein, S.R. Leptin and the adrenal gland. Eur. J. Clin. Investig. 2000, 30, 39–45. [Google Scholar] [CrossRef]
- Li, P.; Sun, F.; Cao, H.-M.; Ma, Q.-Y.; Pan, C.-M.; Ma, J.-H.; Zhang, X.-N.; Jiang, H.; Song, H.-D.; Chen, M.-D. Expression of adiponectin receptors in mouse adrenal glands and the adrenocortical Y-1 cell line: Adiponectin regulates steroidogenesis. Biochem. Biophys. Res. Commun. 2009, 390, 1208–1213. [Google Scholar] [CrossRef]
- Nigro, E.; Scudiero, O.; Monaco, M.L.; Palmieri, A.; Mazzarella, G.; Costagliola, C.; Bianco, A.; Daniele, A. New Insight into Adiponectin Role in Obesity and Obesity-Related Diseases. BioMed. Res. Int. 2014, 2014, e658913. [Google Scholar] [CrossRef]
- Kaser, S.; Tatarczyk, T.; Stadlmayr, A.; Ciardi, C.; Ress, C.; Tschoner, A.; Sandhofer, A.; Paulweber, B.; Ebenbichler, C.F.; Patsch, J.R. Effect of obesity and insulin sensitivity on adiponectin isoform distribution. Eur. J. Clin. Investig. 2008, 38, 827–834. [Google Scholar] [CrossRef]
- Meyer, L.K.; Ciaraldi, T.P.; Henry, R.R.; Wittgrove, A.C.; Phillips, S.A. Adipose tissue depot and cell size dependency of adiponectin synthesis and secretion in human obesity. Adipocyte 2013, 2, 217–226. [Google Scholar] [CrossRef] [Green Version]
- Escher, G.; Nawrocki, A.; Staub, T.; Vishwanath, B.S.; Frey, B.M.; Reichen, J.; Frey, F.J. Down-regulation of hepatic and renal 11β-hydroxysteroid dehydrogenase in rats with liver cirrhosis. Gastroenterology 1998, 114, 175–184. [Google Scholar] [CrossRef] [PubMed]
- Rajala, U.M.; Keinänen-Kiukaanniemi, S.M.; Hirsso, P.K.; Jokelainen, J.J.; Laakso, M.A.; Hiltunen, L.A.; Ruokonen, A.O.; Härkönen, P.K.; Timonen, M.J. Associations of total testosterone and sex hormone-binding globulin levels with insulin sensitivity in middle-aged Finnish men. Diabetes Care 2007, 30, e13. [Google Scholar] [CrossRef] [PubMed] [Green Version]
- Vandewalle, S.; Taes, Y.; Fiers, T.; Van Helvoirt, M.; Debode, P.; Herregods, N.; Ernst, C.; Van Caenegem, E.; Roggen, I.; Verhelle, F.; et al. Sex steroids in relation to sexual and skeletal maturation in obese male adolescents. J. Clin. Endocrinol. Metab. 2014, 99, 2977–2985. [Google Scholar] [CrossRef]
- Cao, B.; Gong, C.; Wu, D.; Liang, X.; Li, W.; Liu, M.; Su, C.; Qin, M.; Meng, X.; Wei, L. A cross-sectional survey of adrenal steroid hormones among overweight/obese boys according to puberty stage. BMC Pediatr. 2019, 19, 414. [Google Scholar] [CrossRef] [PubMed]
- Charkaluk, M.-L.; Trivin, C.; Brauner, R. Premature pubarche as an indicator of how body weight influences the onset of adrenarche. Eur. J. Pediatr. 2004, 163, 89–93. [Google Scholar] [CrossRef]
- Neville, K.A.; Walker, J.L. Precocious pubarche is associated with SGA, prematurity, weight gain, and obesity. Arch. Dis. Child. 2005, 90, 258–261. [Google Scholar] [CrossRef] [PubMed] [Green Version]
- Pielecka, J.; Quaynor, S.D.; Moenter, S.M. Androgens increase gonadotropin-releasing hormone neuron firing activity in females and interfere with progesterone negative feedback. Endocrinology 2006, 147, 1474–1479. [Google Scholar] [CrossRef] [Green Version]
- Kamrath, C.; Hochberg, Z.; Hartmann, M.F.; Remer, T.; Wudy, S.A. Increased activation of the alternative “backdoor” pathway in patients with 21-hydroxylase deficiency: Evidence from urinary steroid hormone analysis. J. Clin. Endocrinol. Metab. 2012, 97, E367–E375. [Google Scholar] [CrossRef] [Green Version]
- Corvalán, C.; Uauy, R.; Mericq, V. Obesity is positively associated with dehydroepiandrosterone sulfate concentrations at 7 y in Chilean children of normal birth weight. Am. J. Clin. Nutr. 2013, 97, 318–325. [Google Scholar] [CrossRef] [Green Version]
- Kim, S.H.; Moon, J.Y.; Sasano, H.; Choi, M.H.; Park, M.J. Body Fat Mass Is Associated With Ratio of Steroid Metabolites Reflecting 17,20-Lyase Activity in Prepubertal Girls. J. Clin. Endocrinol. Metab. 2016, 101, 4653–4660. [Google Scholar] [CrossRef] [Green Version]
- Remer, T.; Manz, F. Role of nutritional status in the regulation of adrenarche. J. Clin. Endocrinol. Metab. 1999, 84, 3936–3944. [Google Scholar] [CrossRef]
- Shi, L.; Wudy, S.A.; Buyken, A.E.; Hartmann, M.F.; Remer, T. Body fat and animal protein intakes are associated with adrenal androgen secretion in children. Am. J. Clin. Nutr. 2009, 90, 1321–1328. [Google Scholar] [CrossRef] [PubMed] [Green Version]
- Ahmed, M.L.; Ong, K.K.L.; Morrell, D.J.; Cox, L.; Drayer, N.; Perry, L.; Preece, M.A.; Dunger, D.B. Longitudinal study of leptin concentrations during puberty: Sex differences and relationship to changes in body composition. J. Clin. Endocrinol. Metab. 1999, 84, 899–905. [Google Scholar] [CrossRef] [PubMed]
- Livingstone, D.E.W.; Jones, G.C.; Smith, K.; Jamieson, P.M.; Andrew, R.; Kenyon, C.J.; Walker, B.R. Understanding the Role of Glucocorticoids in Obesity: Tissue-Specific Alterations of Corticosterone Metabolism in Obese Zucker Rats. Endocrinology 2000, 141, 560–563. [Google Scholar] [CrossRef] [PubMed]
- Bentley-Lewis, R.; Adler, G.K.; Perlstein, T.; Seely, E.W.; Hopkins, P.N.; Williams, G.H.; Garg, R. Body Mass Index Predicts Aldosterone Production in Normotensive Adults on a High-Salt Diet. J. Clin. Endocrinol. Metab. 2007, 92, 4472–4475. [Google Scholar] [CrossRef] [Green Version]
- Rossi, G.P.; Seccia, T.M. Changes in aldosterone and obesity-related cardiometabolic risk factors with a 1-year weight loss intervention in normotensive overweight and obese young adults. Hypertens. Res. 2013, 36, 856–858. [Google Scholar] [CrossRef]
- Cat, A.N.D.; Friederich-Persson, M.; White, A.; Touyz, R.M. Adipocytes, aldosterone and obesity-related hypertension. J. Mol. Endocrinol. 2016, 57, F7–F21. [Google Scholar] [CrossRef] [Green Version]
- Kawarazaki, W.; Fujita, T. The Role of Aldosterone in Obesity-Related Hypertension. Am. J. Hypertens. 2016, 29, 415–423. [Google Scholar] [CrossRef] [Green Version]
- Kotanidou, E.P.; Giza, S.; Tsinopoulou, V.-R.; Vogiatzi, M.; Galli-Tsinopoulou, A. Diagnosis and Management of Endocrine Hypertension in Children and Adolescents. Curr. Pharm. Des. 2020, 26, 5591–5608. [Google Scholar] [CrossRef]
- Brady, T.M. Obesity-Related Hypertension in Children. Front. Pediatr. 2017, 5, 197. [Google Scholar] [CrossRef] [Green Version]
- Calhoun, D.A.; Sharma, K. The Role of Aldosteronism in Causing Obesity-Related Cardiovascular Risk. Cardiol. Clin. 2010, 28, 517–527. [Google Scholar] [CrossRef] [PubMed] [Green Version]
- Xie, D.; Bollag, W.B. Obesity, hypertension and aldosterone: Is leptin the link? J. Endocrinol. 2016, 230, F7–F11. [Google Scholar] [CrossRef] [PubMed] [Green Version]
- Huby, A.-C.; Antonova, G.; Groenendyk, J.; Gomez-Sanchez, C.E.; Bollag, W.B.; Filosa, J.A.; Belin de Chantemèle, E.L. Adipocyte-Derived Hormone Leptin Is a Direct Regulator of Aldosterone Secretion, Which Promotes Endothelial Dysfunction and Cardiac Fibrosis. Circulation 2015, 132, 2134–2145. [Google Scholar] [CrossRef] [PubMed]
- White, M.C.; Fleeman, R.; Arnold, A.C. Sex differences in the metabolic effects of the renin-angiotensin system. Biol. Sex. Differ. 2019, 10, 31. [Google Scholar] [CrossRef] [PubMed] [Green Version]
- Harshfield, G.A.; Alpert, B.S.; Pulliam, D.A.; Somes, G.W.; Wilson, D.K. Ambulatory blood pressure recordings in children and adolescents. Pediatrics 1994, 94, 180–184. [Google Scholar] [CrossRef]
- Reckelhoff, J.F. Gender differences in the regulation of blood pressure. Hypertens. Dallas Tex. 1979 2001, 37, 1199–1208. [Google Scholar] [CrossRef] [Green Version]
- Finken, M.J.J.; Wirix, A.J.G.; von Rosenstiel-Jadoul, I.A.; van der Voorn, B.; Chinapaw, M.J.M.; Hartmann, M.F.; Holthe, J.E.K.-V.; Wudy, S.A.; Rotteveel, J. Role of glucocorticoid metabolism in childhood obesity-associated hypertension. Endocr. Connect. 2022, 11, e220130. [Google Scholar] [CrossRef]
- Gao, X.; Yamazaki, Y.; Tezuka, Y.; Omata, K.; Ono, Y.; Morimoto, R.; Nakamura, Y.; Satoh, F.; Sasano, H. Gender differences in human adrenal cortex and its disorders. Mol. Cell. Endocrinol. 2021, 526, 111177. [Google Scholar] [CrossRef]
- Utriainen, P.; Laakso, S.; Liimatta, J.; Jääskeläinen, J.; Voutilainen, R. Premature Adrenarche-A Common Condition with Variable Presentation. Horm. Res. Paediatr. 2015, 83, 221–231. [Google Scholar] [CrossRef]
- Malendowicz, L.K.; Fichna, P. Sex differences in adrenocortical structure and function. IV. Effects of postpubertal gonadectomy and sex hormones on adrenal steroid 5alpha-reductase activity in the rat. Endokrinologie 1978, 72, 36–42. [Google Scholar]
- Malendowicz, L.K.; Fichna, P. Effects of duration of gonadectomy, sex and age on adrenal steroid 5alpha-reductase activity in the rat. Experientia 1981, 37, 602–603. [Google Scholar] [CrossRef]
- Wudy, S.A.; Hartmann, M.F.; Remer, T. Sexual dimorphism in cortisol secretion starts after age 10 in healthy children: Urinary cortisol metabolite excretion rates during growth. Am. J. Physiol. Endocrinol. Metab. 2007, 293, E970–E976. [Google Scholar] [CrossRef] [PubMed] [Green Version]
- Wells, J.C. Sexual dimorphism of body composition. Best Pract. Res. Clin. Endocrinol. Metab. 2007, 21, 415–430. [Google Scholar] [CrossRef] [PubMed]
- Kang, M.; Yoo, J.E.; Kim, K.; Choi, S.; Park, S.M. Associations between birth weight, obesity, fat mass and lean mass in Korean adolescents: The Fifth Korea National Health and Nutrition Examination Survey. BMJ Open 2018, 8, e018039. [Google Scholar] [CrossRef] [PubMed] [Green Version]
- DE Ridder, C.M.; Bruning, P.F.; Zonderland, M.L.; Thijssen, J.H.H.; Bonfrer, J.M.G.; Blankenstein, M.A.; Huisveld, I.A.; Erich, W.B.M. Body fat mass, body fat distribution, and plasma hormones in early puberty in females. J. Clin. Endocrinol. Metab. 1990, 70, 888–893. [Google Scholar] [CrossRef]
- de Ridder, C.M.; Thijssen, J.H.; Bruning, P.F.; Van den Brande, J.L.; Zonderland, M.L.; Erich, W.B. Body fat mass, body fat distribution, and pubertal development: A longitudinal study of physical and hormonal sexual maturation of girls. J. Clin. Endocrinol. Metab. 1992, 75, 442–446. [Google Scholar] [CrossRef]
- Mogri, M.; Dhindsa, S.; Quattrin, T.; Ghanim, H.; Dandona, P. Testosterone concentrations in young pubertal and post-pubertal obese males. Clin. Endocrinol. 2013, 78, 593–599. [Google Scholar] [CrossRef] [Green Version]
- Vandewalle, S.; De Schepper, J.; Kaufman, J.-M. Androgens and obesity in male adolescents. Curr. Opin. Endocrinol. Diabetes Obes. 2015, 22, 230–237. [Google Scholar] [CrossRef]
- Reinehr, T.; de Sousa, G.; Roth, C.L.; Andler, W. Androgens before and after weight loss in obese children. J. Clin. Endocrinol. Metab. 2005, 90, 5588–5595. [Google Scholar] [CrossRef] [Green Version]
- Isidori, A.M.; Caprio, M.; Strollo, F.; Moretti, C.; Frajese, G.; Isidori, A.; Fabbri, A. Leptin and androgens in male obesity: Evidence for leptin contribution to reduced androgen levels. J. Clin. Endocrinol. Metab. 1999, 84, 3673–3680. [Google Scholar] [CrossRef] [Green Version]
- Tena-Sempere, M.; Barreiro, M.L. Leptin in male reproduction: The testis paradigm. Mol. Cell. Endocrinol. 2002, 188, 9–13. [Google Scholar] [CrossRef] [PubMed]
- Martins, F.F.; Aguila, M.B.; Mandarim-de-Lacerda, C.A. Impaired steroidogenesis in the testis of leptin-deficient mice (ob/ob -/-). Acta Histochem. 2017, 119, 508–515. [Google Scholar] [CrossRef]
- Pal, S.B. Urinary pregnanetriol and delta 5-pregnentriol in women with idiopathic hirsutism. Endokrinologie 1979, 74, 42–46. [Google Scholar] [PubMed]
- Thomas, F.J.; Steinbeck, A.W. Quantitative Estimation Of Urinary Pregnanetriol, Pregnanetriolone, Tetrahydro S And Δ5-Pregnenetriol In The Investigation of Adrenocortical Function. Eur. J. Endocrinol. 1969, 60, 657–668. [Google Scholar] [CrossRef] [PubMed]
- Sachdeva, S. Hirsutism: Evaluation And Treatment. Indian J. Dermatol. 2010, 55, 3–7. [Google Scholar] [CrossRef] [PubMed]
- Samara-Boustani, D.; Colmenares, A.; Elie, C.; Dabbas, M.; Beltrand, J.; Caron, V.; Ricour, C.; Jacquin, P.; Tubiana-Rufi, N.; Levy-Marchal, C.; et al. High prevalence of hirsutism and menstrual disorders in obese adolescent girls and adolescent girls with type 1 diabetes mellitus despite different hormonal profiles. Eur. J. Endocrinol. 2012, 166, 307–316. [Google Scholar] [CrossRef] [PubMed] [Green Version]


| Normal Weight (n = 76) | Obesity (n = 115) | p Value | |
|---|---|---|---|
| Sex (male/female) | 41/35 | 51/64 | 0.195 |
| Median (IQR) | Median (IQR) | ||
| Age (years) | 11.5 (8–13) | 12 (9–14) | 0.051 |
| BMI (kg/m2) | 17.10 (15.55–18.86) | 28.93 (26.02–32.78) | <0.001 |
| z score BMI/SDS BMI | 0.02 (−0.72–0.43) | 2.20 (1.90–2.50) | <0.001 |
| Mean ± SD | Mean ± SD | ||
| Body surface area (m2) | 1.27 ± 0.32 | 1.83 ± 0.41 | <0.001 |
| Normal Weight (n = 76) | Obesity (n = 115) | p Value | |||
|---|---|---|---|---|---|
| Mean ± SD | Median (IQR) | Mean ± SD | Median (IQR) | ||
| Androsterone | 845.80 ± 890.07 | 450.63 (141.95–1386.35) | 1279.66 ± 1171.43 | 996.49 (429.78–1792.42) | 0.001 |
| Etiocholanolone | 591.47 ± 738.17 | 343.10 (107.88–660.85) | 693.45 ± 647.57 | 506.89 (241.14–955.38) | 0.015 |
| Dihydroandrosterone | 28.49 ± 23.68 | 21.88 (13.22–33.34) | 41.34 ± 38.52 | 28.34 (13.03–55.14) | 0.056 |
| Dehydroepiandrosterone | 176.47 ± 253.68 | 51.41 (18.21–235.71) | 188.49 ± 344.23 | 58.80 (22.97–156.85) | 0.895 |
| Androstenediol | 18.55 ± 18.92 | 11.40 (4.63–25.72) | 49.00 ± 67.49 | 30.37 (14.92–59.42) | <0.001 |
| 11-oxo-etiocholanolone | 392.08 ± 279.23 | 311.45 (213.12–490.92) | 443.61 ± 316.10 | 354.42 (209.57–629.06) | 0.341 |
| 5α-dihydrotestosterone | 11.16 ± 9.37 | 8.33 (4.74–14.27) | 14.91 ± 12.69 | 11.74 (5.39–18.62) | 0.047 |
| 17β-estradiol | 0.86 ± 0.93 | 0.56 (0.26–1.08) | 1.40 ± 1.32 | 1.01 (0.40–1.99) | 0.006 |
| Testosterone | 16.66 ± 17.28 | 10.89 (6.55–18.07) | 21.85 ± 18.28 | 16.14 (9.05–31.01) | 0.007 |
| 11β-hydroxyandrosterone | 656.84 ± 451.76 | 521.4 (311.87–888.41) | 889.12 ± 642.59 | 755.95 (415.01–1243.58) | 0.012 |
| 11β-hydroxyetiocholanolone | 188.11 ± 195.92 | 124.13 (46.39–239.81) | 240.42 ± 213.05 | 184.57 (75.47–333.51) | 0.056 |
| 17-hydroxypregnanolone | 13.17 ± 14.57 | 7.73 (3.76–14.92) | 18.96 ± 16.42 | 14.44 (7.61–24.09) | <0.001 |
| 16α-hydroxy-DHEA | 167.09 ± 188.99 | 74.55 (38.71–209.44) | 325.20 ± 340.57 | 211.16 (75.37–482.19) | <0.001 |
| Pregnanediol | 110.41 ± 126.58 | 62.30 (38.99–122.43) | 239.98 ± 251.82 | 155.29 (65.84–318.51) | <0.001 |
| Pregnanetriol | 310.12 ± 293.26 | 196.82 (109.49–359.81) | 401.44 ± 262.69 | 329.16 (192.70–546.69) | <0.001 |
| Androstenetriol | 135.31 ± 148.68 | 72.61 (34.14–185.76) | 231.29 ± 256.07 | 134.13 (39.82–359.94) | 0.016 |
| Tetrahydro-11-deoxycortisol | 58.73 ± 35.64 | 46.55 (33.14–75.32) | 57.63 ± 39.59 | 50.06 (28.13–81.68) | 0.695 |
| Tetrahydrodeoxycorticosterone | 4.79 ± 3.60 | 3.46 (2.50–5.91) | 6.66 ± 5.69 | 4.51 (3.02–8.63) | 0.017 |
| Estriol | 1.67 ± 2.00 | 1.14 (0.34–2.22) | 3.22 ± 4.43 | 1.45 (0.52–3.91) | 0.035 |
| Pregnanetriolone | 11.12 ± 8.24 | 8.63 (5.56–14.63) | 13.78 ± 10.56 | 10.51 (6.81–16.37) | 0.021 |
| Pregnenetriol | 18.10 ± 31.88 | 5.85 (2.85–20.68) | 59.16 ± 121.42 | 15.79 (5.42–38.89) | <0.001 |
| Tetrahydrocortisone | 2371.15 ± 1146.68 | 2161.63 (1558.55–2992.66) | 2720.05 ± 1667.70 | 2372.18 (1541.86–3648.83) | 0.303 |
| Tetrahydro-11-dehydrocorticosterone | 122.62 ± 75.87 | 102.48 (64.13–148.94) | 163.75 ± 106.48 | 136.53 (81.84–226.31) | 0.008 |
| Tetrahydrocorticosterone | 72.84 ± 42.60 | 59.68 (41.91–93.35) | 144.18 ± 113.52 | 113.08 (68.76–178.99) | <0.001 |
| 5α-tetrahydrocorticosterone | 289.81 ± 169.52 | 252.70 (161.16–385.92) | 389.78 ± 266.51 | 336.39 (183.71–526.18) | 0.022 |
| Tetrahydrocortisol | 721.02 ± 420.19 | 592.07 (443.3–911.84) | 1021.99 ± 706.78 | 850.32 (494.23–1484.35) | 0.006 |
| 5α-tetrahydrocortisol | 1011.64 ± 590.83 | 833.27 (549.55–1299.59) | 1332.93 ± 864.83 | 1099.11 (689.64–1807.75) | 0.015 |
| α-cortolone | 1004.45 ± 604.63 | 913.48 (513.79–1418.05) | 1361.10 ± 778.73 | 1186.50 (776.58–1886.82) | 0.001 |
| β-cortolone | 382.01 ± 176.54 | 349.27 (271.85–452.78) | 430.64 ± 246.56 | 377.28 (251.96–563.77) | 0.384 |
| α-cortol | 184.50 ± 107.48 | 163.35 (98.24–236.65) | 272.91 ± 194.44 | 235.22 (123.49–382.65) | 0.002 |
| β-cortol | 292.23 ± 151.55 | 267.11 (186.21–353.62) | 396.11 ± 251.42 | 314.35 (198.22–512.97) | 0.010 |
| Cortisone | 105.78 ± 44.98 | 95.19 (74.54–129.84) | 107.96 ± 59.26 | 93.87 (63.20–146.34) | 0.724 |
| Cortisol | 111.13 ± 51.77 | 95.76 (75.73–139.24) | 117.29 ± 70.74 | 108.28 (66.51–154.64) | 0.835 |
| 20α-dihydrocortisone | 17.84 ± 8.76 | 14.69 (11.05–23.04) | 15.61 ± 8.37 | 13.45 (9.91–20.08) | 0.085 |
| 20β-dihydrocortisone | 48.01 ± 27.76 | 37.19 (26.62–65.76) | 70.63 ± 43.62 | 60.75 (39.80–96.14) | <0.001 |
| 20α-dihydrocortisol | 31.40 ± 21.39 | 23.85 (15.21–44.24) | 60.73 ± 63.58 | 37.0 (22.71–72.40) | 0.001 |
| 20β-dihydrocortisol | 162.61 ± 113.96 | 136.18 (74.06–242.47) | 90.75 ± 60.33 | 75.17 (55.01–105.95) | <0.001 |
| 6β-hydroxycortisol | 40.12 ± 20.41 | 35.65 (25.25–47.90) | 37.96 ± 27.82 | 33.12 (16.66–47.63) | 0.098 |
| Normal Weight (n = 41) | Obesity (n = 51) | p Value | |||
|---|---|---|---|---|---|
| Mean ± SD | Median (IQR) | Mean ± SD | Median (IQR) | ||
| Androsterone | 653.13 ± 803.43 | 282.87 (87.38–866.49) | 1356.86 ± 1307.30 | 1028.14 (457.14–1575.73) | <0.001 |
| Etiocholanolone | 485.24 ± 693.07 | 152.90 (54.78–566.72) | 650.52 ± 640.08 | 429.14 (270.90–696.39) | 0.008 |
| Dihydroandrosterone | 30.99 ± 24.02 | 24.58 (15.51–36.72) | 44.07 ± 37.02 | 29.87 (11.89–60.15) | 0.154 |
| Dehydroepiandrosterone | 230.36 ± 280.89 | 122.47 (40.09–269.88) | 167.99 ± 236.94 | 64.00 (25.58–189.07) | 0.134 |
| Androstenediol | 13.94 ± 15.42 | 7.52 (3.94–17.11) | 45.03 ± 59.82 | 31.39 (14.71–58.17) | <0.001 |
| 11-oxo-etiocholanolone | 409.79 ± 271.85 | 323.25 (262.54–493.25) | 497.65 ± 368.65 | 462.34 (179.27–666.90) | 0.369 |
| 5α-dihydrotestosterone | 11.87 ± 11.07 | 7.78 (4.47–13.40) | 17.78 ± 13.66 | 14.71 (8.73–18.62) | 0.002 |
| 17β-estradiol | 0.66 ± 0.79 | 0.33 (0.19–0,83) | 1.15 ± 1.01 | 0.93 (0.45–1.62) | 0.006 |
| Testosterone | 17.52 ± 19.69 | 8.20 (6.23–17.56) | 28.76 ± 21.21 | 22.67 (11.99–39.29) | <0.001 |
| 11β-hydroxyandrosterone | 570.48 ± 419.82 | 430.25 (255.67–710.36) | 951.00 ± 640.34 | 794.23 (457.24–1374.93) | 0.001 |
| 11β-hydroxyetiocholanolone | 181.18 ± 165.77 | 116.51 (68.01–264.51) | 258.74 ± 217.19 | 209.98 (93.13–347.41) | 0.846 |
| 17-hydroxypregnanolone | 11.83 ± 13.99 | 6.01 (3.17–14.07) | 19.66 ± 15.51 | 16.20 (8.00–25.21) | <0.001 |
| 16α-hydroxy-DHEA | 184.53 ± 206.65 | 75.50 (50.25–219.01) | 332.24 ± 309.51 | 216.51 (85.78–534.38) | 0.009 |
| Pregnanediol | 75.76 ± 97.04 | 50.42 (22.67–93.72) | 220.95 ± 222.41 | 160.36 (68.86–281.56) | <0.001 |
| Pregnanetriol | 264.78 ± 290.62 | 161.12 (88.11–291.54) | 385.38 ± 271.80 | 306.26 (204.64–498.22) | <0.001 |
| Androstenetriol | 109.19 ± 129.82 | 61.74 (26.42–149.43) | 215.18 ± 239.55 | 135.05 (36.18–269.45) | 0.029 |
| Tetrahydro-11-deoxycortisol | 55.54 ± 39.58 | 42.15 (24.29–72.07) | 56.63 ± 43.65 | 49.59 (20.46–91.03) | 0.859 |
| Tetrahydrodeoxycorticosterone | 3.96 ± 2.97 | 3.40 (1.93–4.63) | 6.75 ± 4.93 | 5.25 (3.27–8.74) | 0.001 |
| Estriol | 1.01 ± 1.23 | 0.54 (0.25–1.33) | 1.87 ± 2.06 | 1.29 (0.52–2.03) | 0.013 |
| Pregnanetriolone | 11.59 ± 9.19 | 8.60 (5.27–15.09) | 15.08 ± 8.57 | 12.11 (7.95–21.86) | 0.007 |
| Pregnenetriol | 16.93 ± 28.70 | 5.85 (3.08–21.58) | 51.89 ± 114.63 | 16.26 (6.23–38.34) | <0.001 |
| Tetrahydrocortisone | 2216.66 ± 1140.52 | 1893.05 (1342.96–2665.82) | 2892.98 ± 1848.39 | 2485.20 (1539.14–4126.22) | 0.162 |
| Tetrahydro-11-dehydrocorticosterone | 110.72 ± 68.27 | 92.03 (59.35–140.44) | 198.45 ± 119.34 | 165.07 (85.75–269.29) | <0.001 |
| Tetrahydrocorticosterone | 65.96 ± 40.18 | 50.58 (38.73–84.21) | 170.96 ± 102.09 | 166.37 (105.61–213.84) | <0.001 |
| 5α-tetrahydrocorticosterone | 269.23 ± 187.98 | 217.74 (150.55–319.23) | 461.15 ± 297.05 | 386.10 (227.10–692.72) | <0.001 |
| Tetrahydrocortisol | 686.75 ± 410.34 | 588.34 (408.85–876,87) | 1023.41 ± 697.91 | 877.25 (495.11–1493.72) | 0.021 |
| 5α-tetrahydrocortisol | 1013.30 ± 679.39 | 727.36 (525.08–1400.68) | 1369.13 ± 899.68 | 1082.87 (810.26–1687.00) | 0.028 |
| α-cortolone | 828.45 ± 538.89 | 680.93 (455.89–1069.10) | 1529.24 ± 899.47 | 1315.29 (782.57–2211.02) | <0.001 |
| β-cortolone | 352.96 ± 144.16 | 337.57 (267.95–421.68) | 469.75 ± 265.91 | 435.00 (254.44–646.26) | 0.067 |
| α-cortol | 171.85 ± 108.28 | 154.34 (85.04–202.52) | 296.45 ± 216.01 | 231.41 (127.20–437.34) | 0.004 |
| β-cortol | 285.70 ± 142.82 | 262.60 (185.45–335.85) | 411.79 ± 245.49 | 344.56 (208.11–595.33) | 0.022 |
| Cortisone | 102.93 ± 48.73 | 87.54 (66.59–130.07) | 114.64 ± 59.41 | 101.73 (69.27–157.83) | 0.376 |
| Cortisol | 105.14 ± 51.72 | 85.89 (69.19–124.61) | 121.35 ± 62.58 | 115.50 (71.60–161.68) | 0.160 |
| 20α-dihydrocortisone | 17.84 ± 9.45 | 15.22 (10.37–23.78) | 17.80 ± 8.54 | 15.96 (11.56–24.14) | 0.830 |
| 20β-dihydrocortisone | 42.89 ± 26.29 | 32.65 (23.10–58.10) | 79.51 ± 45.29 | 63.84 (52.71–115.57) | <0.001 |
| 20α-dihydrocortisol | 30.27 ± 21.73 | 21.04 (14.93–43.17) | 66.84 ± 60.47 | 48.67 (27.02–82.09) | <0.001 |
| 20β-dihydrocortisol | 141.13 ± 109.10 | 108.09 (61.63–175.12) | 94.64 ± 54.98 | 77.27 (61.33–116.12) | 0.101 |
| 6β-hydroxycortisol | 39.18 ± 18.70 | 35.63 (24.95–48.02) | 40.41 ± 25.64 | 34.23 (23.46–51.37) | 0.846 |
| Normal Weight (n = 35) | Obesity (n = 64) | p Value | |||
|---|---|---|---|---|---|
| Mean ± SD | Median (IQR) | Mean ± SD | Median (IQR) | ||
| Androsterone | 1066.79 ± 932.27 | 920.82 (330.86–1631.84) | 1216.16 ± 1042.25 | 990.39 (402.24–1873.63) | 0.452 |
| Etiocholanolone | 719.57 ± 769.87 | 447.42 (166.18–713.82) | 728.76 ± 651.54 | 559.42 (192.67–1070.65) | 0.534 |
| Dihydroandrosterone | 25.70 ± 22.98 | 20.81 (10.97–30.14) | 39.21 ± 39.52 | 25.47 (13.35–47.04) | 0.123 |
| Dehydroepiandrosterone | 116.42 ± 203.24 | 26.09 (13.50–73.53) | 204.76 ± 409.12 | 57.87 (22.64–141.59) | 0.051 |
| Androstenediol | 23.68 ± 21.02 | 15.25 (6.25–32.84) | 52.22 ± 72.95 | 26.31 (15.04–59.76) | 0.007 |
| 11-oxo-etiocholanolone | 370.73 ± 286.42 | 284.79 (182.12–457.45) | 403.08 ± 262.87 | 315.47 (210.59–592.21) | 0.382 |
| 5α-dihydrotestosterone | 10.31 ± 6.67 | 8.58 (5.52–14.62) | 12.67 ± 11.38 | 7.69 (3.41–18.41) | 0.967 |
| 17β-estradiol | 1.10 ± 1.02 | 0.93 (0.34–1.27) | 1.59 ± 1.49 | 1.13 (0.38–2.29) | 0.296 |
| Testosterone | 15.69 ± 14.05 | 11.46 (7.73–17.98) | 16.27 ± 13.09 | 13.09 (6.77–20.59) | 0.802 |
| 11β-hydroxyandrosterone | 758.44 ± 466.62 | 717.92 (393.80–947.83) | 839.02 ± 640.04 | 720.87 (383.20–1048.98) | 0.800 |
| 11β-hydroxyetiocholanolone | 196.46 ± 226.73 | 134.04 (45.14–205.93) | 226.46 ± 208.77 | 175.76 (69.88–274.73) | 0.227 |
| 17-hydroxypregnanolone | 14.69 ± 15.07 | 10.34 (4.55–17.24) | 18.39 ± 17.11 | 12.27 (7.08–22.78) | 0.147 |
| 16α-hydroxy-DHEA | 145.42 ± 161.83 | 73.59 (34.59–192.17) | 319.51 ± 363.68 | 203.60 (71.15–344.09) | 0.010 |
| Pregnanediol | 153.46 ± 144.51 | 84.99 (56.94–194.70) | 255.89 ± 272.98 | 121.03 (60.05–341.56) | 0.118 |
| Pregnanetriol | 364.78 ± 287.06 | 275.16 (147.60–449.71) | 414.87 ± 254.04 | 403.79 (191.49–548.23) | 0.174 |
| Androstenetriol | 164.41 ± 162.32 | 117.22 (44.81–234.20) | 244.33 ± 268.00 | 120.99 (55.45–390.61) | 0.271 |
| Tetrahydro-11-deoxycortisol | 62.47 ± 29.97 | 54.64 (41.68–82.55) | 58.40 ± 36.10 | 51.19 (35.09–72.99) | 0.380 |
| Tetrahydrodeoxycorticosterone | 5.70 ± 4.01 | 3.60 (2.98–7.44) | 6.60 ± 6.20 | 4.36 (2.80–8.32) | 0.887 |
| Estriol | 2.48 ± 2.42 | 1.52 (1.00–3.03) | 4.39 ± 5.48 | 2.01 (0.56–6.23) | 0.496 |
| Pregnanetriolone | 10.53 ± 6.85 | 8.88 (5.99–12.74) | 12.76 ± 11.78 | 9.59 (6.43–13.53) | 0.447 |
| Pregnenetriol | 19.43 ± 35.11 | 5.85 (2.85–14.48) | 65.13 ± 126.43 | 15.27 (4.00–44.33) | 0.025 |
| Tetrahydrocortisone | 2552.12 ± 1127.24 | 2246.55 (1762.23–3400.38) | 2582.81 ± 1494.81 | 2371.05 (1651.51–3371.48) | 0.819 |
| Tetrahydro-11-dehydrocorticosterone | 136.22 ± 81.62 | 106.18 (71.02–160.85) | 136.76 ± 86.11 | 117.83 (67.93–181.15) | 0.994 |
| Tetrahydrocorticosterone | 80.94 ± 43.92 | 67.00 (49.09–99.84) | 123.67 ± 117.49 | 92.40 (51.96–147.67) | 0.125 |
| 5α-tetrahydrocorticosterone | 312.74 ± 142.79 | 319.87 (187.29–409.20) | 332.23 ± 223.00 | 293.21 (167.32–426.06) | 0.813 |
| Tetrahydrocortisol | 762.34 ± 428.13 | 607.95 (452.74–942.51) | 1020.84 ± 713.88 | 793.66 (495.93–1438.85) | 0.134 |
| 5α-tetrahydrocortisol | 1009.79 ± 473.00 | 916.86 (728.80–1228.78) | 1304.32 ± 835.15 | 1158.05 (573.10–1846.48) | 0.142 |
| α-cortolone | 1216.69 ± 611.42 | 1093.47 (825.42–1541.25) | 1227.66 ± 636.68 | 1165.45 (777.78–1598.56) | 0.973 |
| β-cortolone | 417.04 ± 203.57 | 356.66 (287.58–515.08) | 399.60 ± 225.25 | 341.12 (237.95–536.46) | 0.580 |
| α-cortol | 199.75 ± 104.49 | 181.04 (106.95–246.01) | 253.55 ± 172.31 | 236.48 (119.12–337.55) | 0.223 |
| β-cortol | 300.35 ± 161.37 | 277.50 (190.24–359.54) | 383.20 ± 255.48 | 308.58 (183.24–498.16) | 0.166 |
| Cortisone | 109.04 ± 40.03 | 108.61 (78.08–126.55) | 102.66 ± 58.61 | 88.70 (62.27–136.47) | 0.164 |
| Cortisol | 117.98 ± 50.97 | 104.99 (81.90–148.10) | 114.14 ± 76.35 | 99.96 (60.83–141.61) | 0.304 |
| 20α-dihydrocortisone | 17.84 ± 7.89 | 14.07 (12.53–22.13) | 13.87 ± 7.80 | 12.15 (9.01–16.27) | 0.009 |
| 20β-dihydrocortisone | 53.85 ± 28.24 | 45.49 (33.63–69.77) | 63.73 ± 40.96 | 58.96 (37.33–75.50) | 0.311 |
| 20α-dihydrocortisol | 32.80 ± 20.87 | 24.64 (18.27–44.90) | 55.79 ± 65.57 | 31.89 (20.03–56.11) | 0.218 |
| 20β-dihydrocortisol | 187.87 ± 114.37 | 174.49 (107.56–262.23) | 87.79 ± 63.96 | 66.59 (51.02–103.82) | <0.001 |
| 6β-hydroxycortisol | 41.23 ± 22.19 | 35.68 (27.85–45.96) | 36.02 ± 29.29 | 26.21 (15.79–46.69) | 0.061 |
Disclaimer/Publisher’s Note: The statements, opinions and data contained in all publications are solely those of the individual author(s) and contributor(s) and not of MDPI and/or the editor(s). MDPI and/or the editor(s) disclaim responsibility for any injury to people or property resulting from any ideas, methods, instructions or products referred to in the content. |
© 2023 by the authors. Licensee MDPI, Basel, Switzerland. This article is an open access article distributed under the terms and conditions of the Creative Commons Attribution (CC BY) license (https://creativecommons.org/licenses/by/4.0/).
Share and Cite
Sumińska, M.; Podgórski, R.; Fichna, P.; Mazur, A.; Fichna, M. The Impact of Obesity on the Excretion of Steroid Metabolites in Boys and Girls: A Comparison with Normal-Weight Children. Nutrients 2023, 15, 1734. https://doi.org/10.3390/nu15071734
Sumińska M, Podgórski R, Fichna P, Mazur A, Fichna M. The Impact of Obesity on the Excretion of Steroid Metabolites in Boys and Girls: A Comparison with Normal-Weight Children. Nutrients. 2023; 15(7):1734. https://doi.org/10.3390/nu15071734
Chicago/Turabian StyleSumińska, Marta, Rafał Podgórski, Piotr Fichna, Artur Mazur, and Marta Fichna. 2023. "The Impact of Obesity on the Excretion of Steroid Metabolites in Boys and Girls: A Comparison with Normal-Weight Children" Nutrients 15, no. 7: 1734. https://doi.org/10.3390/nu15071734