

Variation Patterns of Hemoglobin Levels by Gestational Age during Pregnancy: A Cross-Sectional Analysis of a Multi-Center Retrospective Cohort Study in China
 ,
,  , and
, and
Abstract
:
1. Introduction
2. Methods
2.1. Study Design and Data Collection
2.2. Traditional RANGE of Hemoglobin Measurement and Maternal Anthropometrics
2.3. Statistical Analysis
3. Results
3.1. Baseline Characteristics
3.1.1. Hemoglobin Levels during Pregnancy
3.1.2. Prevalence of Anemia among Pregnant Women
3.2. Subgroup Percentages of Maternal Hemoglobin Concentration and Anemia
3.3. Subgroup Logistic Regression Analyses of Hemoglobin Levels and Anemia
4. Discussion
4.1. Summary
4.2. Comparisons and Applications
4.3. Limitations
5. Conclusions
Author Contributions
Funding
Institutional Review Board Statement
Informed Consent Statement
Data Availability Statement
Conflicts of Interest
References
- Pasricha, S.-R.; Colman, K.; Centeno-Tablante, E.; Garcia-Casal, M.-N.; Peña-Rosas, J.-P. Revisiting WHO haemoglobin thresholds to define anaemia in clinical medicine and public health. Lancet Haematol. 2018, 5, e60–e62. [Google Scholar] [CrossRef] [PubMed]
- Drukker, L.; Hants, Y.; Farkash, R.; Ruchlemer, R.; Samueloff, A.; Grisaru-Granovsky, S. Iron deficiency anemia at admission for labor and delivery is associated with an increased risk for Cesarean section and adverse maternal and neonatal outcomes. Transfusion 2015, 55, 2799–2806. [Google Scholar] [CrossRef]
- Haider, B.A.; Olofin, I.; Wang, M.; Spiegelman, D.; Ezzati, M.; Fawzi, W.W. Anaemia, prenatal iron use, and risk of adverse pregnancy outcomes: Systematic review and meta-analysis. BMJ 2013, 346, f3443. [Google Scholar] [CrossRef] [PubMed] [Green Version]
- Smith, C.; Teng, F.; Branch, E.; Chu, S.; Joseph, K.S. Maternal and Perinatal Morbidity and Mortality Associated with Anemia in Pregnancy. Obs. Gynecol. 2019, 134, 1234–1244. [Google Scholar] [CrossRef] [PubMed]
- Mwangi, M.N.; Mzembe, G.; Moya, E.; Braat, S.; Harding, R.; Robberstad, B.; Simpson, J.; Stones, W.; Rogerson, S.; Biselele, K.; et al. Protocol for a multicentre, parallel-group, open-label randomised controlled trial comparing ferric carboxymaltose with the standard of care in anaemic Malawian pregnant women: The REVAMP trial. BMJ Open 2021, 11, e053288. [Google Scholar] [CrossRef]
- Lopez, A.; Cacoub, P.; Macdougall, I.C.; Peyrin-Biroulet, L. Iron deficiency anaemia. Lancet 2016, 387, 907–916. [Google Scholar] [CrossRef]
- Steer, P.; Alam, M.A.; Wadsworth, J.; Welch, A. Relation between maternal haemoglobin concentration and birth weight in different ethnic groups. BMJ 1995, 310, 489–491. [Google Scholar] [CrossRef] [PubMed] [Green Version]
- Dewey, K.G.; Oaks, B.M. U-shaped curve for risk associated with maternal hemoglobin, iron status, or iron supplementation. Am. J. Clin. Nutr. 2017, 106, 1694S–1702S. [Google Scholar] [CrossRef] [Green Version]
- Shi, H.; Chen, L.; Wang, Y.; Sun, M.; Guo, Y.; Ma, S.; Wang, X.; Jiang, H.; Wang, X.; Lu, J.; et al. Severity of Anemia During Pregnancy and Adverse Maternal and Fetal Outcomes. JAMA Netw. Open 2022, 5, e2147046. [Google Scholar] [CrossRef]
- Ziaei, S.; Norrozi, M.; Faghihzadeh, S.; Jafarbegloo, E. A randomised placebo-controlled trial to determine the effect of iron supplementation on pregnancy outcome in pregnant women with haemoglobin > or = 13.2 g/dL. BJOG 2007, 114, 684–688. [Google Scholar] [CrossRef]
- Centers for Disease Control (CDC). CDC criteria for anemia in children and childbearing-aged women. Morb. Mortal. Wkly. Rep. 1989, 38, 400–404. [Google Scholar]
- Lin, L.; Wei, Y.; Zhu, W.; Wang, C.; Su, R.; Feng, H.; Yang, H.; Gestational diabetes mellitus Prevalence Survey (GPS) study Group. Prevalence, risk factors and associated adverse pregnancy outcomes of anaemia in Chinese pregnant women: A multicentre retrospective study. BMC Pregnancy Childbirth 2018, 18, 111. [Google Scholar] [CrossRef] [Green Version]
- Tan, J.; He, G.; Qi, Y.; Yang, H.; Xiong, Y.; Liu, C.; Wang, W.; Zou, K.; Lee, A.H.; Sun, X.; et al. Prevalence of anemia and iron deficiency anemia in Chinese pregnant women (IRON WOMEN): A national cross-sectional survey. BMC Pregnancy Childbirth 2020, 20, 670. [Google Scholar] [CrossRef]
- Jung, J.; Rahman, M.M.; Rahman, M.S.; Swe, K.T.; Islam, M.R.; Rahman, M.O.; Akter, S. Effects of hemoglobin levels during pregnancy on adverse maternal and infant outcomes: A systematic review and meta-analysis. Ann. N. Y. Acad. Sci. 2019, 1450, 69–82. [Google Scholar] [CrossRef] [PubMed] [Green Version]
- Parks, S.; Hoffman, M.K.; Goudar, S.S.; Patel, A.; Saleem, S.; Ali, S.A.; Goldenberg, R.L.; Hibberd, P.L.; Moore, J.; Wallace, D.; et al. Maternal anaemia and maternal, fetal, and neonatal outcomes in a prospective cohort study in India and Pakistan. BJOG 2019, 126, 737–743. [Google Scholar] [CrossRef] [PubMed]
- Nair, M.; Churchill, D.; Robinson, S.; Nelson-Piercy, C.; Stanworth, S.J.; Knight, M. Association between maternal haemoglobin and stillbirth: A cohort study among a multi-ethnic population in England. Br. J. Haematol. 2017, 179, 829–837. [Google Scholar] [CrossRef] [PubMed] [Green Version]
- Zhang, Q.; Ananth, C.V.; Rhoads, G.G.; Li, Z. The impact of maternal anemia on perinatal mortality: A population-based, prospective cohort study in China. Ann. Epidemiol. 2009, 19, 793–799. [Google Scholar] [CrossRef]
- Cao, C.; O’Brien, K.O. Pregnancy and iron homeostasis: An update. Nutr. Rev. 2013, 71, 35–51. [Google Scholar] [CrossRef]
- Gonzales, G.F.; Steenland, K.; Tapia, V. Maternal hemoglobin level and fetal outcome at low and high altitudes. Am. J. Physiol. Regul. Integr. Comp. Physiol. 2009, 297, R1477–R1485. [Google Scholar] [CrossRef] [Green Version]
- Wunderer, F.; Traeger, L.; Sigurslid, H.H.; Meybohm, P.; Bloch, D.B.; Malhotra, R. The role of hepcidin and iron homeostasis in atherosclerosis. Pharm. Res. 2020, 153, 104664. [Google Scholar] [CrossRef]
- Nekoui, A.; Blaise, G. Erythropoietin and Nonhematopoietic Effects. Am. J. Med. Sci. 2017, 353, 76–81. [Google Scholar] [CrossRef]
- Osol, G.; Ko, N.L.; Mandalà, M. Plasticity of the Maternal Vasculature during Pregnancy. Annu. Rev. Physiol. 2019, 81, 89–111. [Google Scholar] [CrossRef] [PubMed]
- McArdle, H.J.; Gambling, L.; Kennedy, C. Iron deficiency during pregnancy: The consequences for placental function and fetal outcome. Proc. Nutr. Soc. 2014, 73, 9–15. [Google Scholar] [CrossRef] [PubMed] [Green Version]
- Kadyrov, M.; Kosanke, G.; Kingdom, J.; Kaufmann, P. Increased fetoplacental angiogenesis during first trimester in anaemic women. Lancet 1998, 352, 1747–1749. [Google Scholar] [CrossRef]
- Peña-Rosas, J.P.; De-Regil, L.M.; Dowswell, T.; Viteri, F.E. Daily oral iron supplementation during pregnancy. Cochrane Database Syst. Rev. 2012, 12, CD004736. [Google Scholar]
- Georgieff, M.K.; Krebs, N.F.; Cusick, S.E. The Benefits and Risks of Iron Supplementation in Pregnancy and Childhood. Annu. Rev. Nutr. 2019, 39, 121–146. [Google Scholar] [CrossRef]
- Rawal, S.; Hinkle, S.N.; Bao, W.; Zhu, Y.; Grewal, J.; Albert, P.S.; Weir, N.L.; Tsai, M.Y.; Zhang, C. A longitudinal study of iron status during pregnancy and the risk of gestational diabetes: Findings from a prospective, multiracial cohort. Diabetologia 2017, 60, 249–257. [Google Scholar] [CrossRef] [PubMed] [Green Version]
- Chang, S.-C.; O’Brien, K.O.; Nathanson, M.S.; Mancini, J.; Witter, F.R. Hemoglobin concentrations influence birth outcomes in pregnant African-American adolescents. J. Nutr. 2003, 133, 2348–2355. [Google Scholar] [CrossRef] [Green Version]
- Scanlon, K.S.; Yip, R.; Schieve, L.A.; Cogswell, M.E. High and low hemoglobin levels during pregnancy: Differential risks for preterm birth and small for gestational age. Obs. Gynecol. 2000, 96, 741–748. [Google Scholar] [CrossRef]
- Scholl, T.O. High third-trimester ferritin concentration: Associations with very preterm delivery, infection, and maternal nutritional status. Obs. Gynecol. 1998, 92, 161–166. [Google Scholar] [CrossRef]
- Toldi, G.; Stenczer, B.; Molvarec, A.; Takáts, Z.; Beko, G.; Rigó, J., Jr.; Vásárhelyi, B. Hepcidin concentrations and iron homeostasis in preeclampsia. Clin. Chem. Lab. Med. 2010, 48, 1423–1426. [Google Scholar] [CrossRef] [PubMed]
- New, S.; Wirth, M. Anaemia, pregnancy, and maternal mortality: The problem with globally standardised haemoglobin cutoffs. BJOG 2015, 122, 166–169. [Google Scholar] [CrossRef] [PubMed]


| Characteristics | n (%) |
|---|---|
| Year | |
| 2015 | 22,824 (15.9) |
| 2016 | 35,706 (24.9) |
| 2017 | 42,555 (29.7) |
| 2018 | 32,773 (22.9) |
| 2019 | 8414 (5.9) |
| 2020 | 1035 (0.7) |
| Area | |
| Eastern China | 77,441 (54.0) |
| Central China | 26,523 (18.5) |
| Western China | 39,343 (27.5) |
| Hukou | |
| Urban residents | 99,767 (69.6) |
| Migrants | 22,856 (15.9) |
| Rural residents | 20,684 (14.4) |
| Age, mean (SD) | 28.78 (4.48) |
| Age group | |
| 15–19 | 1347 (1.0) |
| 20–24 | 20,676 (14.4) |
| 25–29 | 66,386 (46.3) |
| 30–34 | 38,506 (26.9) |
| 35–39 | 13,981 (9.8) |
| 40–49 | 2411 (1.7) |
| Ethnics | |
| Han | 140,088 (97.8) |
| Others a | 3219 (2.2) |
| Education | |
| High school | 35,938 (25.1) |
| College | 46,994 (32.8) |
| Master | 6943 (4.8) |
| Others | 53,432 (37.3) |
| Gravidity | |
| Primigravid | 79,412 (55.4) |
| Multipara | 63,895 (44.6) |
| Pre-pregnancy BMI b, mean (SD), kg/m2 | 21.44 (3.31) |
| Pre-pregnancy BMI group | |
| Normal weight(18.5 ≤ BMI < 24) | 99,886 (69.7) |
| Underweight(BMI < 18.5) | 19,825 (13.8) |
| Overweight (24 ≤ BMI < 28) | 17,679 (12.3) |
| Obesity(BMI ≥ 28) | 4698 (3.3) |
| Unknown | 1219 (0.9) |
| Week | n | Hemoglobin Concentrations(g/L) | Anemia(%) | |||||||||||||
|---|---|---|---|---|---|---|---|---|---|---|---|---|---|---|---|---|
| Mean | SD | Median | 1 | 3 | 5 | 10 | 25 | 50 | 75 | 90 | 95 | 97 | 99 | |||
| 1st trimester | 65,691 | 125.75 | 11.17 | 126 | 94 | 103 | 108 | 112 | 120 | 126 | 133 | 140 | 143 | 146 | 150 | 6.2 |
| 5 | 1515 | 121.59 | 8.58 | 120 | 87 | 101 | 110 | 120 | 120 | 120 | 120 | 130 | 135 | 143 | 149 | 1.9 |
| 6 | 979 | 124.52 | 12.76 | 124 | 86 | 89 | 101 | 111 | 120 | 124 | 133 | 140 | 144 | 146 | 149 | 6.6 |
| 7 | 2302 | 125.90 | 12.44 | 126 | 85 | 95 | 106 | 112 | 120 | 126 | 134 | 141 | 145 | 147 | 154 | 7.0 |
| 8 | 7277 | 127.84 | 11.17 | 128 | 95 | 105 | 110 | 115 | 121 | 128 | 135 | 141 | 145 | 148 | 152 | 4.4 |
| 9 | 5626 | 127.20 | 11.67 | 128 | 92 | 99 | 108 | 113 | 120 | 128 | 135 | 141 | 145 | 147 | 151 | 5.9 |
| 10 | 6538 | 126.18 | 11.68 | 127 | 92 | 96 | 107 | 112 | 120 | 127 | 134 | 140 | 144 | 147 | 151 | 6.6 |
| 11 | 8127 | 125.64 | 11.43 | 126 | 94 | 98 | 107 | 112 | 119 | 126 | 133 | 139 | 143 | 147 | 152 | 6.8 |
| 12 | 25,653 | 125.49 | 10.56 | 126 | 97 | 102 | 108 | 112 | 119 | 126 | 132 | 138 | 142 | 145 | 149 | 6.1 |
| 13 | 7711 | 124.24 | 11.36 | 124 | 93 | 99 | 106 | 111 | 118 | 124 | 131 | 139 | 143 | 146 | 149 | 8.2 |
| 2nd trimester | 69,184 | 123.47 | 13.01 | 123 | 90 | 99 | 103 | 108 | 115 | 123 | 132 | 141 | 146 | 148 | 154 | 11.5 |
| 14 | 3904 | 123.96 | 11.90 | 124 | 90 | 98 | 105 | 110 | 117 | 124 | 131 | 139 | 143 | 146 | 150 | 8.6 |
| 15 | 5782 | 126.24 | 12.79 | 126 | 88 | 100 | 106 | 112 | 118 | 126 | 134 | 142 | 147 | 149 | 154 | 6.8 |
| 16 | 8976 | 126.62 | 12.13 | 127 | 93 | 103 | 107 | 112 | 119 | 127 | 134 | 142 | 146 | 148 | 154 | 6.5 |
| 17 | 6758 | 125.61 | 12.64 | 125 | 92 | 101 | 105 | 111 | 118 | 125 | 134 | 143 | 147 | 148 | 153 | 8.3 |
| 18 | 5125 | 125.79 | 13.82 | 126 | 88 | 99 | 103 | 110 | 117 | 126 | 135 | 144 | 147 | 148 | 154 | 9.3 |
| 19 | 2728 | 125.11 | 14.91 | 124 | 87 | 95 | 101 | 108 | 116 | 124 | 135 | 145 | 149 | 152 | 157 | 11.7 |
| 20 | 2786 | 122.93 | 14.19 | 122 | 85 | 94 | 101 | 106 | 114 | 122 | 132 | 142 | 147 | 149 | 155 | 14.2 |
| 21 | 3846 | 121.56 | 13.74 | 120 | 88 | 94 | 100 | 106 | 113 | 120 | 130 | 141 | 146 | 148 | 154 | 16.5 |
| 22 | 3190 | 121.98 | 13.93 | 121 | 86 | 93 | 100 | 106 | 113 | 121 | 131 | 141 | 146 | 148 | 152 | 15.2 |
| 23 | 3317 | 122.99 | 14.27 | 123 | 86 | 94 | 99 | 105 | 114 | 123 | 132 | 142 | 147 | 149 | 155 | 14.5 |
| 24 | 9481 | 122.04 | 11.79 | 122 | 93 | 96 | 103 | 108 | 115 | 122 | 130 | 137 | 142 | 146 | 150 | 12.1 |
| 25 | 5808 | 121.73 | 12.27 | 121 | 91 | 94 | 103 | 108 | 114 | 121 | 130 | 137 | 143 | 147 | 153 | 13.5 |
| 26 | 5721 | 120.93 | 11.97 | 120 | 90 | 97 | 102 | 107 | 113 | 120 | 128 | 136 | 142 | 146 | 151 | 14.7 |
| 27 | 4363 | 121.17 | 12.14 | 120 | 92 | 98 | 103 | 107 | 113 | 120 | 128 | 136 | 142 | 147 | 152 | 14.4 |
| 3rd trimester | 56,042 | 118.71 | 12.64 | 118 | 89 | 96 | 99 | 104 | 110 | 118 | 126 | 134 | 141 | 145 | 154 | 21.9 |
| 28 | 12,159 | 117.91 | 10.78 | 117 | 95 | 99 | 102 | 105 | 111 | 117 | 124 | 131 | 136 | 141 | 147 | 21.0 |
| 29 | 2621 | 122.12 | 12.81 | 122 | 94 | 99 | 102 | 106 | 113 | 122 | 130 | 140 | 145 | 147 | 156 | 15.4 |
| 30 | 3746 | 121.27 | 12.29 | 121 | 93 | 97 | 101 | 106 | 113 | 121 | 129 | 136 | 142 | 145 | 153 | 16.2 |
| 31 | 3301 | 119.36 | 12.56 | 120 | 90 | 95 | 100 | 104 | 111 | 120 | 127 | 134 | 141 | 147 | 155 | 21.1 |
| 32 | 7713 | 117.97 | 11.67 | 118 | 90 | 95 | 99 | 103 | 110 | 118 | 126 | 132 | 136 | 139 | 149 | 22.4 |
| 33 | 3728 | 118.62 | 12.66 | 118 | 90 | 95 | 99 | 103 | 110 | 118 | 126 | 134 | 140 | 146 | 156 | 22.7 |
| 34 | 6140 | 120.30 | 12.28 | 120 | 92 | 98 | 101 | 106 | 112 | 120 | 128 | 136 | 142 | 146 | 149 | 17.9 |
| 35 | 3207 | 120.47 | 12.85 | 120 | 88 | 95 | 100 | 105 | 112 | 120 | 128 | 137 | 142 | 146 | 153 | 17.7 |
| 36 | 7191 | 118.02 | 11.62 | 118 | 92 | 97 | 100 | 104 | 110 | 118 | 125 | 132 | 137 | 142 | 149 | 22.0 |
| 37 | 3656 | 119.39 | 12.93 | 119 | 87 | 94 | 100 | 104 | 111 | 119 | 127 | 135 | 142 | 146 | 154 | 20.6 |
| 38 | 2677 | 119.10 | 13.94 | 119 | 83 | 89 | 98 | 102 | 111 | 119 | 127 | 136 | 143 | 148 | 157 | 21.6 |
| 39 | 2966 | 117.30 | 14.41 | 118 | 80 | 86 | 93 | 99 | 109 | 118 | 126 | 135 | 141 | 146 | 155 | 25.8 |
| 40 | 2981 | 117.86 | 13.60 | 119 | 84 | 89 | 96 | 101 | 110 | 119 | 126 | 133 | 141 | 146 | 154 | 24.5 |
| 41 | 542 | 121.75 | 18.57 | 119 | 79 | 90 | 95 | 100 | 109 | 119 | 134 | 151 | 157 | 158 | 160 | 26.9 |
| Gestational Period | n | Hb, X(SD), g/L | Prevalence of Anemia, % (WHO Criteria) | |||
|---|---|---|---|---|---|---|
| Total | Mild | Moderate | Severe | |||
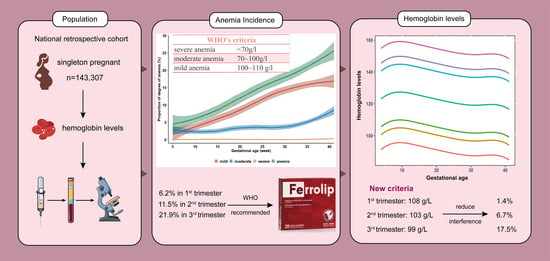
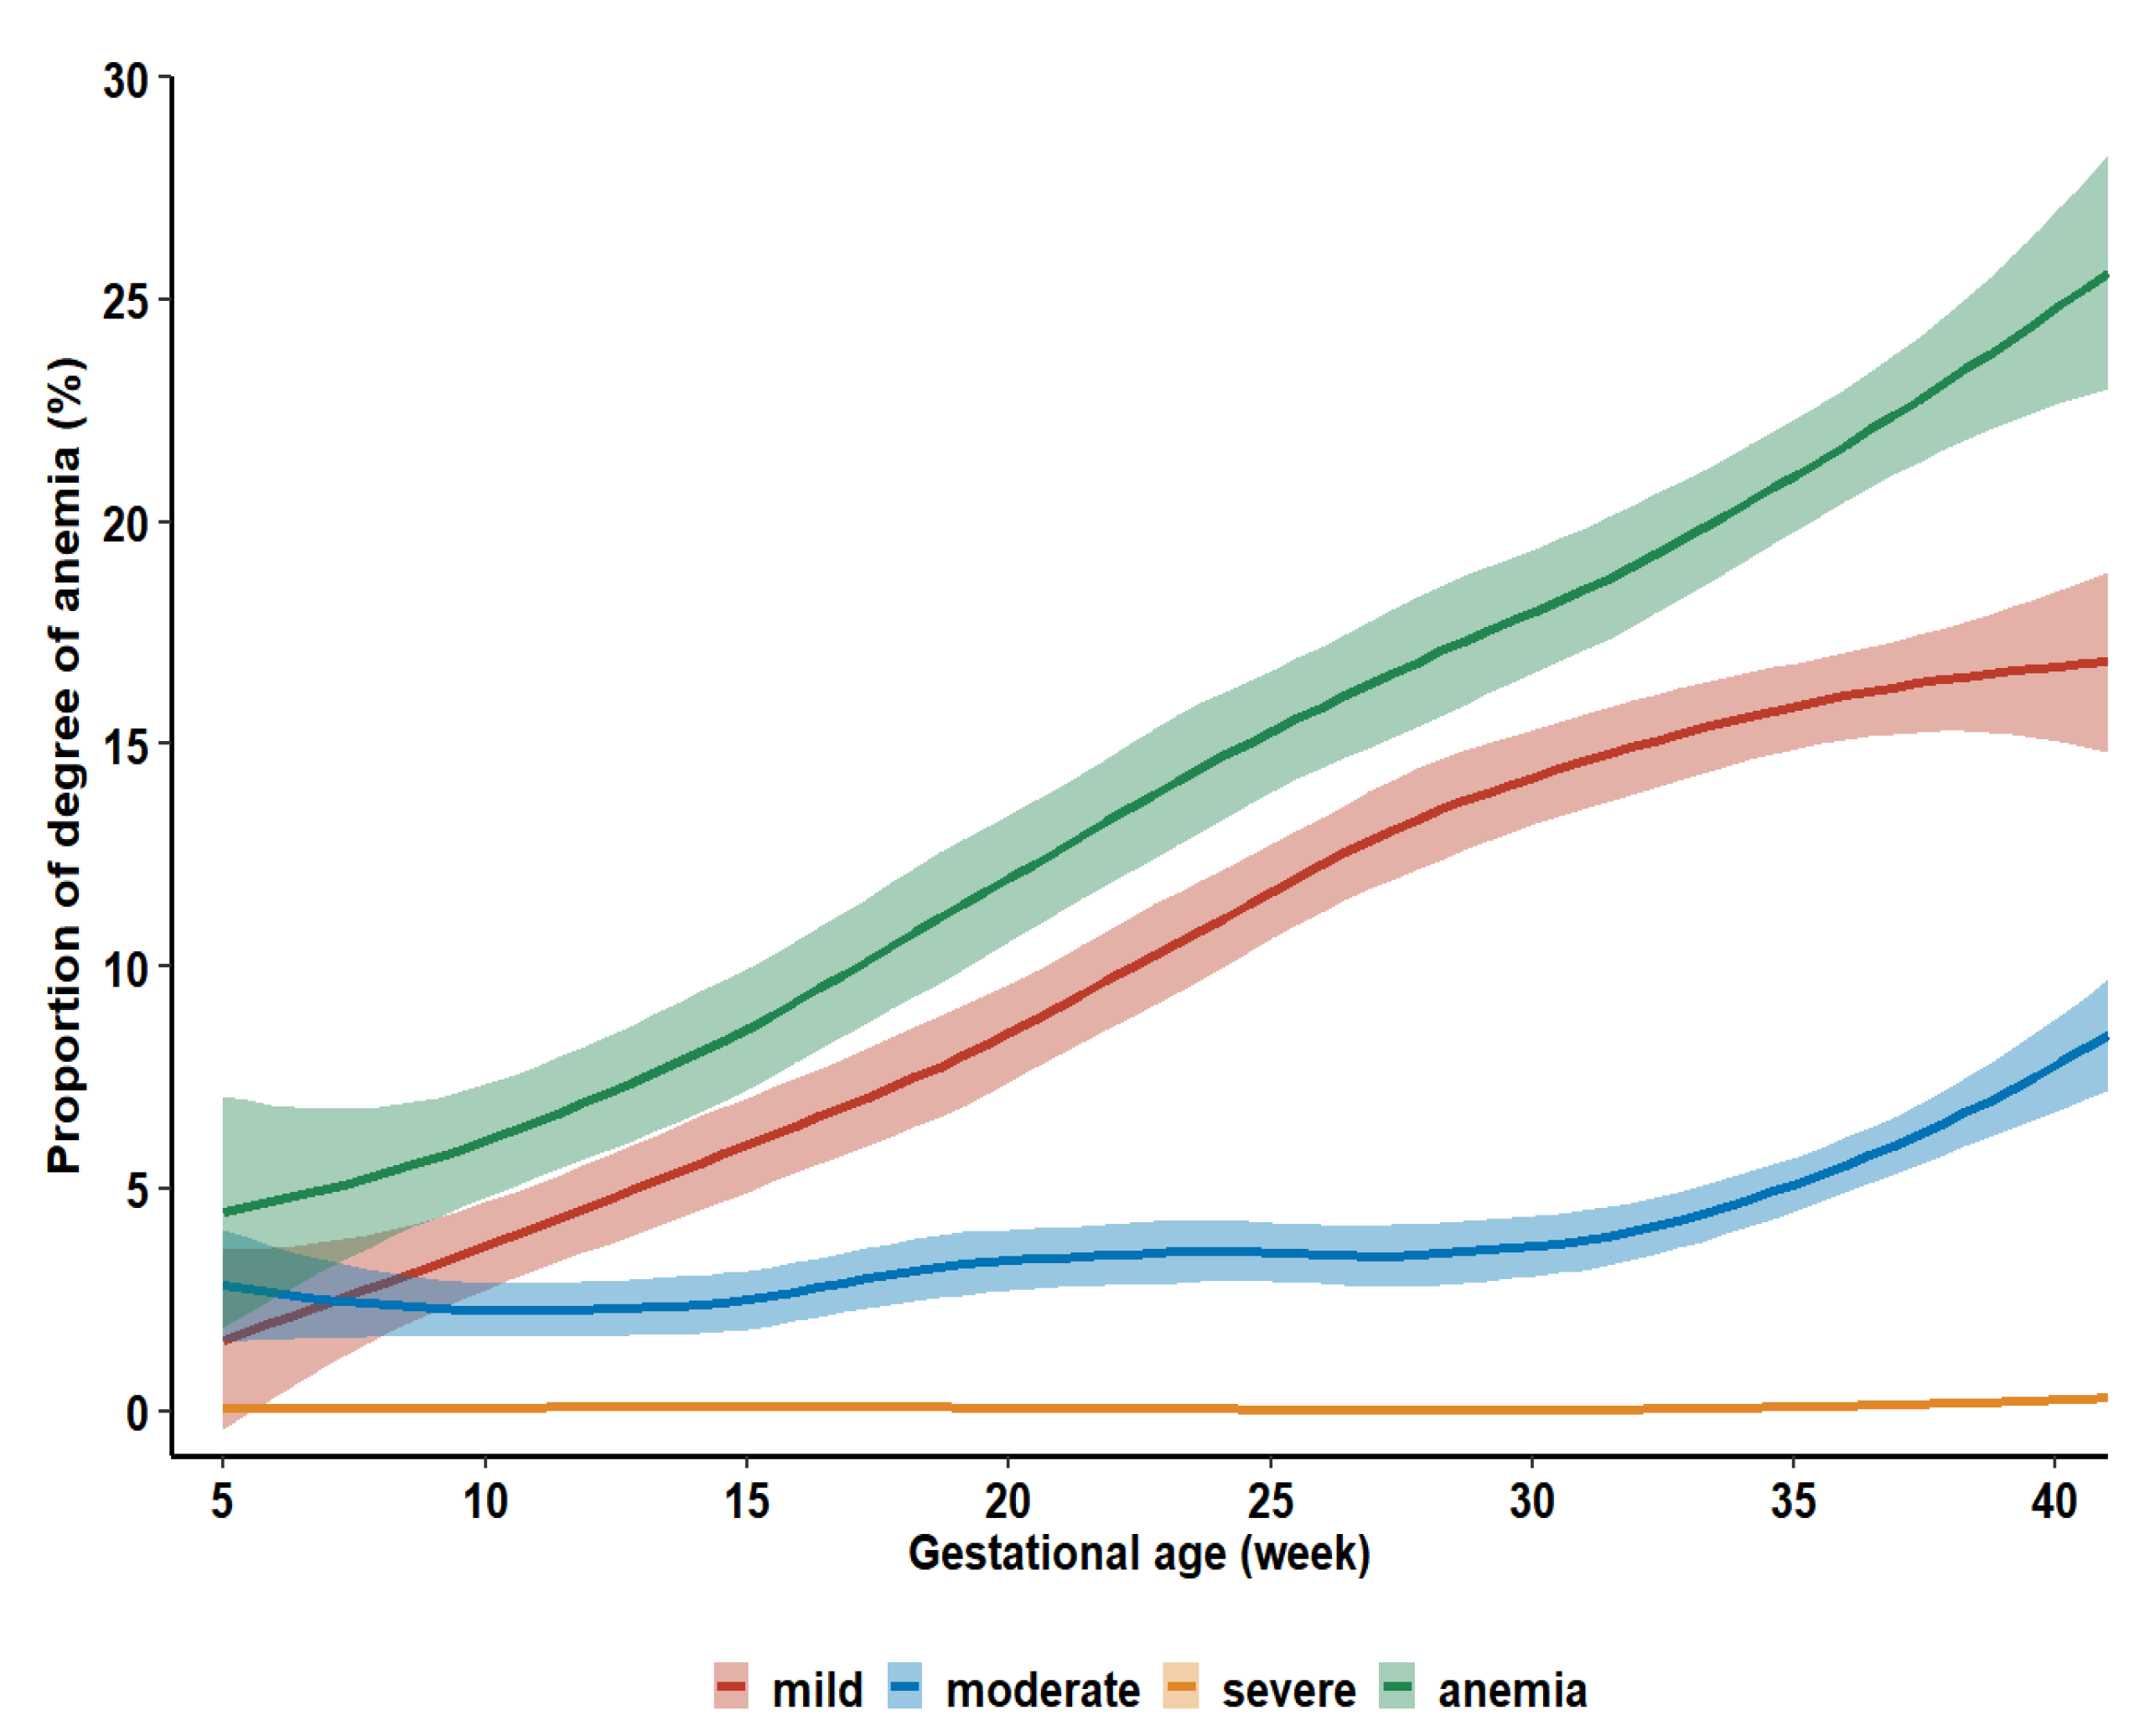
| 1st trimester | 65,691 | 125.75 (11.17) | 6.2 | 4.3 | 1.9 | 0.1 |
| 2nd trimester | 69,184 | 123.47 (13.01) | 11.5 | 8.4 | 3.0 | 0.1 |
| 3rd trimester | 56,042 | 118.71 (12.63) | 21.9 | 16.7 | 5.1 | 0.1 |
| Characteristics | n | Hemoglobin Concentrations a | ||
|---|---|---|---|---|
| First Trimester | Second Trimester | Third Trimester | ||
| Year | ||||
| 2015 | 22,824 | 127.95(127.78,128.11) | 122.27(122.06,122.49) | 117.67(117.47,117.87) |
| 2016 | 35,706 | 125.40(125.25,125.55) | 123.06(122.88,123.24) | 117.03(116.87,117.20) |
| 2017 | 42,555 | 125.09(124.94,125.24) | 121.52(121.31,121.72) | 118.14(117.93,118.36) |
| 2018 | 32,773 | 125.06(124.81,125.31) | 124.53(124.33,124.72) | 121.11(120.82,121.40) |
| 2019 | 8414 | 121.87(120.75,122.98) | 127.50(127.13,127.87) | 124.97(124.44,125.50) |
| 2020 | 1035 | 114.12(105.80,122.45) | 130.95(130.37,131.53) | 130.39(129.66,131.12) |
| Area | ||||
| East | 77,441 | 127.27(127.14,127.41) | 124.01(123.89,124.14) | 118.89(118.75,119.03) |
| Central | 26,523 | 124.81(124.68,124.95) | 120.03(119.80,120.27) | 118.28(117.92,118.65) |
| West | 39,343 | 124.17(123.99,124.34) | 123.98(123.79,124.18) | 118.54(118.36,118.72) |
| Hukou | ||||
| Urban residents | 99,767 | 125.78(125.68,125.87) | 122.98(122.86,123.09) | 119.05(118.93,119.17) |
| Migrants | 22,856 | 126.30(126.01,126.59) | 126.64(126.42,126.87) | 118.75(118.39,119.10) |
| Rural residents | 20,684 | 125.15(124.91,125.39) | 120.92(120.67,121.17) | 117.14(116.88,117.40) |
| Age group | ||||
| 15–19 | 1347 | 124.70(123.64,125.77) | 124.21(123.18,125.25) | 117.40(116.21,118.60) |
| 20–24 | 20,676 | 125.16(124.94,125.39) | 122.73(122.47,122.98) | 118.08(117.79,118.38) |
| 25–29 | 66,386 | 126.11(125.98,126.23) | 123.42(123.28,123.56) | 118.82(118.66,118.97) |
| 30–34 | 38,506 | 125.60(125.43,125.76) | 123.79(123.60,123.98) | 118.68(118.48,118.87) |
| 35–39 | 13,981 | 125.48(125.19,125.77) | 123.83(123.51,124.15) | 119.17(118.82.119.51) |
| 40–49 | 2411 | 124.25(123.44,125.06) | 124.20(123.40,125.00) | 119.74(118.82,120.67) |
| Ethnics | ||||
| Han | 140,088 | 125.74(125.65,125.83) | 123.45(123.35,123.54) | 118.72(118.62,118.83) |
| Others b | 3219 | 125.98(125.39,126.58) | 124.76(124.11,125.42) | 118.36(117.70,119.03) |
| Education | ||||
| High school | 35,938 | 125.30(125.13,125.47) | 122.60(122.39,122.81) | 117.91(117.69,118.14) |
| College | 46,994 | 126.27(126.12,126.42) | 123.55(123.37,123.72) | 119.78(119.60,119.96) |
| Master | 6943 | 126.28(125.97,126.59) | 124.69(124.29,125.10) | 117.23(116.89,117.58) |
| Other | 53,432 | 125.48(125.34,125.63) | 123.77(123.62,123.92) | 118.42(118.25,118.59) |
| Primigravida | ||||
| Yes | 79,412 | 126.02(125.90,126.15) | 124.75(124.62,124.88) | 120.14(119.98,120.29) |
| No | 63,895 | 125.45(125.33,125.57) | 121.67(121.53,121.81) | 117.21(117.07,117.34) |
| p-BMI group | ||||
| 18.5~23.99 | 99,886 | 125.46(125.36,125.56) | 123.58(123.46,123.69) | 118.85(118.72,118.98) |
| <18.5 | 19,825 | 124.30(124.08,124.53) | 123.13(122.87,123.39) | 117.90(117.61,118.18) |
| 24~27.99 | 17,679 | 128.05(127.81,128.28) | 123.68(123.41,123.95) | 119.01(118.73,119.29) |
| >=28 | 4698 | 129.74(129.26,130.21) | 123.12(122.66,123.57) | 118.43(117.91,118.95) |
| Unknown | 1219 | 123.89(122.90,124.88) | 120.01(119.07,120.95) | 117.08(116.16,118.00) |
| Characteristics | Anemia in the 1st Trimester | Anemia in the 2nd Trimester | Anemia in the 3rd Trimester | |||||||||
|---|---|---|---|---|---|---|---|---|---|---|---|---|
| Mild | Moderate | Severe | Total | Mild | Moderate | Severe | Total | Mild | Moderate | Severe | Total | |
| Year n (%) | ||||||||||||
| 2015 | 408 (2.88) | 123 (0.87) | 4 (0.03) | 535 (3.77) | 814 (8.12) | 225 (2.24) | 2 (0.02) | 1041 (10.39) | 2017 (17.20) | 472 (4.02) | 10 (0.09) | 2499 (21.31) |
| 2016 | 745 (3.92) | 271 (1.43) | 2 (0.01) | 1018 (5.36) | 1241 (7.66) | 478 (2.95) | 7 (0.04) | 1726 (10.65) | 3064 (17.99) | 984 (5.78) | 5 (0.03) | 4053 (23.80) |
| 2017 | 1225 (5.58) | 370 (1.69) | 29 (0.13) | 1624 (7.40) | 2012 (12.19) | 542 (3.28) | 41 (0.25) | 2595 (15.72) | 2453 (16.89) | 1005 (6.92) | 22 (0.15) | 3480 (23.96) |
| 2018 | 406 (4.20) | 339 (3.51) | 4 (0.04) | 749 (7.75) | 1469 (7.45) | 677 (3.43) | 1 (0.01) | 2147 (10.89) | 1443 (15.93) | 360 (3.98) | 4 (0.04) | 1807 (19.95) |
| Area n (%) | ||||||||||||
| East | 876 (2.97) | 666 (2.26) | 25 (0.08) | 1567 (5.32) | 3373 (7.68) | 1312 (2.99) | 41 (0.09) | 4726 (10.76) | 1230 (42.80) | 10 (23.80) | 10 (0.03) | 6857 (21.58) |
| Central | 750 (3.98) | 172 (0.91) | 4 (0.02) | 926 (4.92) | 1175 (12.73) | 323 (3.50) | 1 (0.01) | 1499 (16.25) | 476 (16.60) | 2 (4.80) | 2 (0.04) | 1263 (24.08) |
| West | 1196 (6.89) | 381 (2.19) | 13 (0.07) | 1590 (9.15) | 1293 (8.05) | 446 (2.78) | 10 (0.06) | 1749 (10.90) | 1166 (40.60) | 30 (71.40) | 30 (0.16) | 4175 (21.94) |
| Hukou n (%) | ||||||||||||
| Urban residents | 2148 (4.38) | 734 (1.50) | 20 (0.04) | 2902 (5.92) | 4335 (9.77) | 1144 (2.58) | 19 (0.04) | 5498 (12.39) | 7066 (16.77) | 1939 (4.60) | 14 (0.03) | 9019 (21.41) |
| Migrants | 212 (2.89) | 264 (3.60) | 4 (0.05) | 480 (6.55) | 467 (3.13) | 565 (3.79) | 6 (0.04) | 1038 (6.96) | 764 (15.73) | 249 (5.13) | 3 (0.06) | 1016 (20.91) |
| Rural residents | 462 (4.96) | 221 (2.37) | 18 (0.19) | 701 (7.53) | 1039 (10.50) | 372 (3.76) | 27 (0.27) | 1438 (14.53) | 1551 (17.14) | 684 (7.56) | 25 (0.28) | 2260 (24.98) |
| Age group n (%) | ||||||||||||
| 15–19 | 19 (4.50) | 10 (2.37) | 0 (0.00) | 29 (6.87) | 45 (5.80) | 34 (4.38) | 3 (0.39) | 82 (10.57) | 74 (16.23) | 38 (8.33) | 0 (0.00) | 112 (24.56) |
| 20–24 | 421 (4.69) | 182 (2.03) | 3 (0.03) | 606 (6.76) | 939 (9.00) | 399 (3.83) | 4 (0.04) | 1342 (12.87) | 1389 (18.02) | 488 (6.33) | 8 (0.10) | 1885 (24.45) |
| 25–29 | 1262 (4.00) | 510 (1.62) | 22 (0.07) | 1794 (5.69) | 2678 (8.40) | 867 (2.72) | 19 (0.06) | 3564 (11.17) | 4213 (16.27) | 1293 (4.99) | 16 (0.06) | 5522 (21.33) |
| 30–34 | 761 (4.26) | 363 (2.03) | 10 (0.06) | 1134 (6.36) | 1541 (8.45) | 540 (2.96) | 17 (0.09) | 2098 (11.50) | 2653 (16.98) | 751 (4.81) | 11 (0.07) | 3415 (21.85) |
| 35–39 | 297 (4.98) | 127 (2.13) | 4 (0.07) | 428 (7.18) | 536 (8.04) | 206 (3.09) | 8 (0.12) | 750 (11.24) | 928 (16.92) | 259 (4.72) | 6 (0.11) | 1193 (21.75) |
| 40–49 | 62 (6.53) | 27 (2.85) | 3 (0.32) | 92 (9.69) | 102 (8.70) | 35 (2.99) | 1 (0.09) | 138 (11.77) | 124 (14.29) | 43 (4.95) | 1 (0.12) | 168 (19.35) |
| Ethnics n (%) | ||||||||||||
| Han | 2740 (4.27) | 1186 (1.85) | 42 (0.07) | 3968 (6.18) | 5748 (8.48) | 2044 (3.02) | 51 (0.08) | 7843 (11.57) | 9199 (16.79) | 2806 (5.12) | 41 (0.07) | 12,046 (21.98) |
| Other | 82 (5.58) | 33 (2.24) | 0 (0.00) | 115 (7.82) | 93 (6.53) | 37 (2.60) | 1 (0.07) | 131 (9.19) | 182 (14.67) | 66 (5.32) | 1 (0.08) | 249 (20.06) |
| Education n (%) | ||||||||||||
| High school | 660 (3.90) | 373 (2.21) | 11 (0.07) | 1044 (6.18) | 1430 (9.06) | 597 (3.78) | 21 (0.13) | 2048 (12.97) | 2205 (17.75) | 772 (6.21) | 15 (0.12) | 2992 (24.08) |
| College | 925 (4.26) | 349 (1.61) | 18 (0.08) | 1292 (5.96) | 2090 (9.60) | 554 (2.54) | 23 (0.11) | 2667 (12.25) | 3183 (16.17) | 757 (3.85) | 10 (0.05) | 3950 (20.07) |
| Master | 167 (4.07) | 47 (1.15) | 2 (0.05) | 216 (5.27) | 227 (7.18) | 46 (1.45) | 3 (0.09) | 276 (8.73) | 633 (18.48) | 115 (3.36) | 1 (0.03) | 749 (21.87) |
| Other | 1070 (4.65) | 450 (1.96) | 11 (0.05) | 1531 (6.66) | 2094 (7.36) | 884 (3.11) | 5 (0.02) | 2983 (10.48) | 3360 (16.38) | 1228 (5.99) | 16 (0.08) | 4604 (22.45) |
| Primigravida n (%) | ||||||||||||
| Yes | 1291 (3.83) | 671 (1.99) | 20 (0.06) | 1982 (5.87) | 2934 (7.24) | 1210 (2.99) | 21 (0.05) | 4165 (10.28) | 4512 (15.64) | 1237 (4.29) | 12 (0.04) | 5761 (19.97) |
| No | 1531 (4.79) | 548 (1.72) | 22 (0.07) | 2101 (6.58) | 2907 (10.14) | 871 (3.04) | 31 (0.11) | 3809 (13.28) | 4869 (17.90) | 1635 (6.01) | 30 (0.11) | 6534 (24.02) |
| Pre-pregnancy BMI n (%) | ||||||||||||
| 18.5~23.99 | 1945 (4.29) | 868 (1.91) | 35 (0.08) | 2848 (6.28) | 4045 (8.46) | 1420 (2.97) | 33 (0.07) | 5498 (11.49) | 6388 (16.70) | 1949 (5.10) | 23 (0.06) | 8360 (21.86) |
| <18.5 | 527 (5.58) | 217 (2.30) | 1 (0.01) | 745 (7.89) | 922 (9.11) | 362 (3.58) | 6 (0.06) | 1290 (12.75) | 1284 (17.39) | 438 (5.93) | 4 (0.05) | 1726 (23.37) |
| 24~27.99 | 252 (3.01) | 106 (1.27) | 5 (0.06) | 363 (4.34) | 604 (7.45) | 209 (2.58) | 10 (0.12) | 823 (10.15) | 1295 (16.43) | 365 (4.63) | 13 (0.16) | 1673 (21.22) |
| >=28 | 66 (3.19) | 18 (0.87) | 0 (0.00) | 84 (4.06) | 195 (7.78) | 64 (2.55) | 3 (0.12) | 262 (10.45) | 306 (15.47) | 95 (4.80) | 2 (0.10) | 403 (20.37) |
| Unknown | 32 (6.82) | 10 (2.13) | 1 (0.21) | 43 (9.17) | 75 (12.20) | 26 (4.23) | 0 (0.00) | 101 (16.42) | 108 (19.74) | 25 (4.57) | 0 (0.00) | 133 (24.31) |
| Characteristics | Trimesters OR (95%Confidential Interval) | ||
|---|---|---|---|
| 1st Trimester | 2nd Trimester | 3rd Trimester | |
| Year (Ref. = 2015) | |||
| 2016 | −1.714(−1.962, −1.465) d | 0.600(0.280, 0.920) d | −0.608(−0.907, −0.308) d |
| 2017 | −0.833(−1.117, −0.549) d | −0.282(−0.609, 0.045) | 1.314(0.987, 1.641) d |
| 2018 | −1.059(−1.387, −0.730) d | 1.270(0.947, 1.593) d | 3.628(3.282, 3.974) d |
| 2019 | −4.611(−5.367, −3.854) d | 3.499(3.068, 3.930) d | 7.179(6.671, 7.688) d |
| 2020 | −12.147(−17.539, −6.755) d | 7.491(6.606, 8.377) d | 12.556(11.634, 13.477) d |
| Area (Ref. = Eastern) | |||
| Central | −2.146(−2.392, −1.899) d | −2.281(−2.583, −1.979) d | 0.046(−0.328, 0.420) |
| Western | −2.664(−2.926, −2.402) d | 1.699(1.439, 1.958) d | 0.094(−0.159, 0.346) |
| Hukou (Ref. = Urban residents) | |||
| Migrants | −0.245(−0.542, −0.053) d | 3.006(2.707, 3.305) d | 0.003(−0.373, 0.379) |
| Rural residents | −0.562(−0.818, −0.307) | −1.534(−1.826, −1.242) d | −1.569(−1.867, −1.270) d |
| Education (Ref. = High school) | |||
| College | 0.634(0.404, 0.863) d | 1.338(1.062, 1.614) d | 1.157(0.869, 1.446) d |
| Master | −0.0176(−0.406, 0.372) | 2.641(2.138, 3.144) d | −0.507(−0.994, −0.019) c |
| Other | 0.164(0.066, 0.393) | 0.262(0.010, 0.513) c | −0.164(−0.446, 0.118) |
| Age | −0.080(−0.102, −0.059) d | 0.078(0.056, 0.101) d | 0.115(0.090, 0.140) d |
| Ethnics a (Ref. = Han) | |||
| Other | 0.105(−0.466, 0.676) | 0.620(−0.049, 1.289) | 0.401(−0.293, 1.095) |
| Gravidity (Ref. = Multipara) | |||
| Primigravid | −0.305(−0.489, −0.122) d | −2.143(−2.357, −1.929) d | −2.427(−2.649, −2.205) d |
| Pre-pregnancy BMI b (Ref. = 18.5~23.99) | |||
| <18.5 | −1.255(−1.501, −1.009) d | −0.862(−1.136, −0.588) d | −0.791(−1.100, −0.483) d |
| 24~28 | 2.382(2.123, 2.641) d | 1.100(0.797, 1.402) d | 0.742(0.442, 1.042) d |
| ≥28 | 3.822(3.335, 4.309) d | 1.091(0.576, 1.605) d | 0.477(−0.080, 1.034) |
| Unknown | −1.560(−2.560, −0.560) c | −2.275(−3.287, −1.264) d | −2.014(−3.053, −0.975) d |
| Characteristics | Trimesters (95%Confidential Interval) | ||
|---|---|---|---|
| 1st Trimester | 2nd Trimester | 3rd Trimester | |
| Geographical area (Ref.: Eastern China) | |||
| Central China | 0.939(0.859, 1.026) | 1.347(1.261, 1.438) d | 1.075(1.002, 1.154) c |
| Western China | 1.788(1.652, 1.935) d | 0.811(0.763, 0.863) d | 0.938(0.895, 0.983) d |
| Hukou (Ref.: Urban residents) | |||
| Migrants | 1.213(1.089, 1.351) d | 0.537(0.496, 0.581) d | 0.875(0.827, 0.926) |
| Rural residents | 1.274(1.164, 1.395) d | 1.192(1.115, 1.274) d | 0.826(0.758, 0.901) d |
| Ethics a (Ref.: Han) | |||
| Other | 0.908(0.746, 1.104) | 0.881(0.734, 1.057) | 1.081(0.939, 1.244) |
| Education (Ref.: High school) | |||
| College | 0.890(0.816, 0.971) c | 0.877(0.822, 0.937) d | 1.093(1.036, 1.154) d |
| Master | 0.871(0.746, 1.018) | 0.600(0.524, 0.687) d | 0.935(0.887, 0.986) |
| Other | 0.953(0.876, 1.036) | 0.845(0.795, 0.898) d | 1.058(0.964, 1.161) c |
| Gravidity (Ref.: Multipara) | |||
| Primigravid | 0.988(0.922, 1.059) | 0.847(0.804, 0.892) d | 0.772(0.740, 0.806) d |
| Age | 1.027(1.019, 1.035) d | 0.994(0.988, 1.000) c | 0.987(0.982, 0.992) d |
| Pre-pregnancy BMI b group (Ref: Normal weight(18.5 ≤ BMI < 24)) | |||
| Underweight(BMI < 18.5) | 1.246(1.144, 1.356) d | 1.198(1.122, 1.280) d | 0.910(0.747, 1.109) c |
| Overweight (24 ≤ BMI < 28) | 0.676(0.604, 0.757) d | 0.779(0.720, 0.842) d | 1.000(0.816, 1.226) |
| Obesity (BMI ≥ 28) | 0.656(0.525, 0.820) d | 0.761(0.667, 0.869) d | 0.873(0.712, 1.070) c |
| Unknown | 1.443(1.050, 1.982) c | 1.330(1.071, 1.652) c | 0.800(0.639, 1.002) |
Disclaimer/Publisher’s Note: The statements, opinions and data contained in all publications are solely those of the individual author(s) and contributor(s) and not of MDPI and/or the editor(s). MDPI and/or the editor(s) disclaim responsibility for any injury to people or property resulting from any ideas, methods, instructions or products referred to in the content. |
© 2023 by the authors. Licensee MDPI, Basel, Switzerland. This article is an open access article distributed under the terms and conditions of the Creative Commons Attribution (CC BY) license (https://creativecommons.org/licenses/by/4.0/).
Share and Cite
Sun, M.; Gu, T.; Wu, T.; Gong, X.; Li, X.; Huang, J.; Li, Y.; Zhao, Y.; Shi, H.; Wei, Y. Variation Patterns of Hemoglobin Levels by Gestational Age during Pregnancy: A Cross-Sectional Analysis of a Multi-Center Retrospective Cohort Study in China. Nutrients 2023, 15, 1383. https://doi.org/10.3390/nu15061383
Sun M, Gu T, Wu T, Gong X, Li X, Huang J, Li Y, Zhao Y, Shi H, Wei Y. Variation Patterns of Hemoglobin Levels by Gestational Age during Pregnancy: A Cross-Sectional Analysis of a Multi-Center Retrospective Cohort Study in China. Nutrients. 2023; 15(6):1383. https://doi.org/10.3390/nu15061383
Chicago/Turabian StyleSun, Mengxing, Tingfei Gu, Tianchen Wu, Xiaoli Gong, Xiaona Li, Jiaqi Huang, You Li, Yangyu Zhao, Huifeng Shi, and Yuan Wei. 2023. "Variation Patterns of Hemoglobin Levels by Gestational Age during Pregnancy: A Cross-Sectional Analysis of a Multi-Center Retrospective Cohort Study in China" Nutrients 15, no. 6: 1383. https://doi.org/10.3390/nu15061383