
Standard vs. Nutrient-Enriched Cow’s Milk and Its Impacts on Child Growth: A Systematic Review and Meta-Analysis

Abstract
:1. Introduction
2. Materials and Methods
2.1. Eligibility Criteria
2.2. Information Sources
2.3. Search Strategy
2.4. Selection Process
2.5. Data Collection Process
2.6. Data Items
2.7. Study Risk of Bias Assessment
2.8. Outcome Measures
2.9. Synthesis Methods
3. Results
3.1. Study Selection
3.2. Study Characteristics
3.3. Quality Assessment

| Author (Year) | Design | Outcome Instrument | Quality Score | Study Sample | Outcomes |
|---|---|---|---|---|---|
| (a) | |||||
| Moschonis et al. (2016) [24] Greece | Cross-sectional study | BMI, Height, Endurance run test (ERT) | Good | 600 | Milk consumption had a positive correlation (β = 0.10; p = 0.017) with the number of ERT stages completed and a negative correlation (β = −0.10; p = 0.014) with body mass index (BMI). Type of milk intake: Formula milk |
| Guo et al. (2020) [26] China | Cross-sectional study | Weight, Height, BMI | Good | 40,607 | After adjusting for confounding factors, the low- and high-intake groups for girls were 0.83 cm (95% confidence interval: 0.00, 1.68 cm) and 1.26 cm (0.34, 2.19 cm) taller than the no-intake group, respectively. Boys who consumed more milk than those who did not have lower BMIs (−0.56, 95% CI: −1.00, −0.12 kg/m2) and a decreased risk of obesity (OR = 0.67, 95% CI: 0.46, 0.97). Type of milk intake: Questionnaire which includes classification of milk intake as - Plain milk/yogurt - Plain whole, low-fat, skim cow’s milk |
| Wiley et al. (2005) [23] USA | Cross-sectional study | Height | Good | 2592 | After considering factors such as age, birthweight, energy intake, and ethnicity, milk consumption did not affect the height of children aged 5 to 11 years. Type of milk intake: Formula milk |
| Hopkins et al. (2015) [25] UK | Cohort | Weight, Height, and BMI | Good | 1112 | From 8 months to 10 years of age, children in the cow’s milk group were heavier than breastfed children, with weight differences of ≥0.27 SD scores (SDSs) and an average of 0.48 SDSs (after adjusting for maternal education, smoking, and parity). At 18 months of age, there was a maximum weight difference (0.70 SDS; 95% CI: 0.41, 1.00 SDS; p = < 0.0001). Children in the cow’s milk group had greater BMI SDSs starting at age 8 months (at age 9; p = 0.001) and were taller at some ages (25–43 mo; p = 0.01). From 8 to 37 months of age, children in the formula milk group were heavier and taller than breastfed children. At 8 months of age, there were obvious dietary differences between the milk groups, some of which persisted to 18 months. The differences in growth that were observed were not attenuated by adjusting for current protein and energy intakes. Type of milk intake: Cow’s or Formula milk |
| (b) | |||||
| Kuriyan et al. (2016) [27] India | Randomised control trial | Anthropometry, Height, Cognitive measures, Physical endurance and Agility, Blood biochemistry. | Good | 224 | Anthropometry: Children’s mean height changes in the control group (3.7 ± 0.8 cm) and the intervention group (4.0 ± 0.9 cm) both exhibited a trend towards significance, with the intervention group showing a stronger effect (p = 0.07). Cognitive and physical performance: Most of the cognitive measures in the paired analyses of morning and evening showed a significant improvement from baseline to end line (p < 0.01), except for Trial A, which had no correct answers for the evening assessment in the control group, and Trial B, which had no correct answers for the evening assessment in both groups. At the end of this study, both groups improved their physical endurance and agility, and there was no significant interaction between the study groups regarding time or status. Type of milk intake: Formula milk |
| Zhu et al. (2005) [20] | Randomised control trial | Metacarpal morphometry and bone age, biochemical analysis, Body weight, Height, Sitting height, BMC, Bone area, BMD of total body and forearm, dietary intakes, Breast, and pubic hair development, and Date of menarche. | Fair | 606 girls with complete hand X-ray radiographs and 128 girls with complete biochemical analysis. | Subjects in all 3 groups were noticeably heavier and taller at 24-mo compared to baseline. After adjusting for pubertal status and school clustering, 24-mo supplementation resulted in larger gains in periosteal diameter (1.2%) and cortical thickness (5.7%) compared to the control, but smaller gains in medullary diameter (6.7%) (p < 0.05). In comparison to the control group, the calcium and vitamin D–fortified milk (CaD) milk group had lower serum bone alkaline phosphatase (BAP) at 12 mo (19.9%) and parathyroid hormone (PTH) at 12 mo (46.2%) and 24 mo (16.4%). (p < 0.05). After clustering by the school was considered, the effect of milk supplementation on increasing Insulin-like growth factor I (IGF-I) concentrations at 24 mo (16.7–23.3%) were no longer significant. Increases in periosteal diameter, CCT, and second metacarpal length were observed in all 3 groups of girls. Contrarily, over 24 months, medullary diameter increased in the control group, decreased in the Ca milk group, and remained unchanged in the CaD milk group. After adjusting for baseline value, bone age, Tanner breast, and pubic hair development stage, menarcheal status at 24 mo, and clustering by the school, supplementation had resulted in significantly greater increases in periosteal diameter, CCT, and length of the second metacarpal after 24 mo compared to the control intervention and significantly smaller gains in medullary diameter. Periosteal diameter changes were correlated positively with total-body BMC changes (r = 0.418, p < 0.001), bone area changes (r = 0.233, p < 0.001), and BMD changes (r = 0.139, p = 0.015). Percentage changes in medullary diameter were negatively correlated with those of total-body BMC (r = −0.163, p = 0.004) and BMD (r = 0.234, p < 0.001). Percentage changes in CCT were positively correlated with those of total-body BMC (r = 0.329, p < 0.001) and BMD (r = 0.251, p < 0.001). Type of milk intake: Formula milk |
| Zhu et al. (2006) [22] China | Randomised control trial | Bone area, body weight, and height | Fair | 587 | Between the groups, there were no significant differences in the total-body BMC and BMD changes since baseline. Sitting height increased significantly in the calcium-fortified milk group (0.9 ± 0.3%; p = 0.02) than in the control group. The serum 25-hydroxyvitamin D concentrations of the group receiving calcium- and vitamin D-fortified milk were 17.1 6.7% lower than those of the control group (p = 0.04), but this difference was reduced by adjusting for physical activity level (14.2 ± 6.7%; p = 0.08). Type of milk intake: Formula milk |
| Du et al. (2004) [21] China | Randomised control trial | The distal forearm of the non-dominant arm, Proximal forearm of the non-dominant arm, Total body, BMC, Bone area (BA), BMD, Height, Sitting height, and Weight. | Fair | 698 | With or without the addition of cholecalciferol, two years of milk consumption resulted in significantly bigger changes in height (≥0.6%), sitting height (≥0.8%), body weight (≥2.9%), total-body BMC (≥1.2%), and BMD (≥3.2%). The change in total-body BMC (2.4% vs. 1.2%) and BMD (5.5% vs. 3.2%) was significantly higher in subjects who received additional cholecalciferol than in subjects who received milk without added cholecalciferol. Type of milk intake: Formula milk |
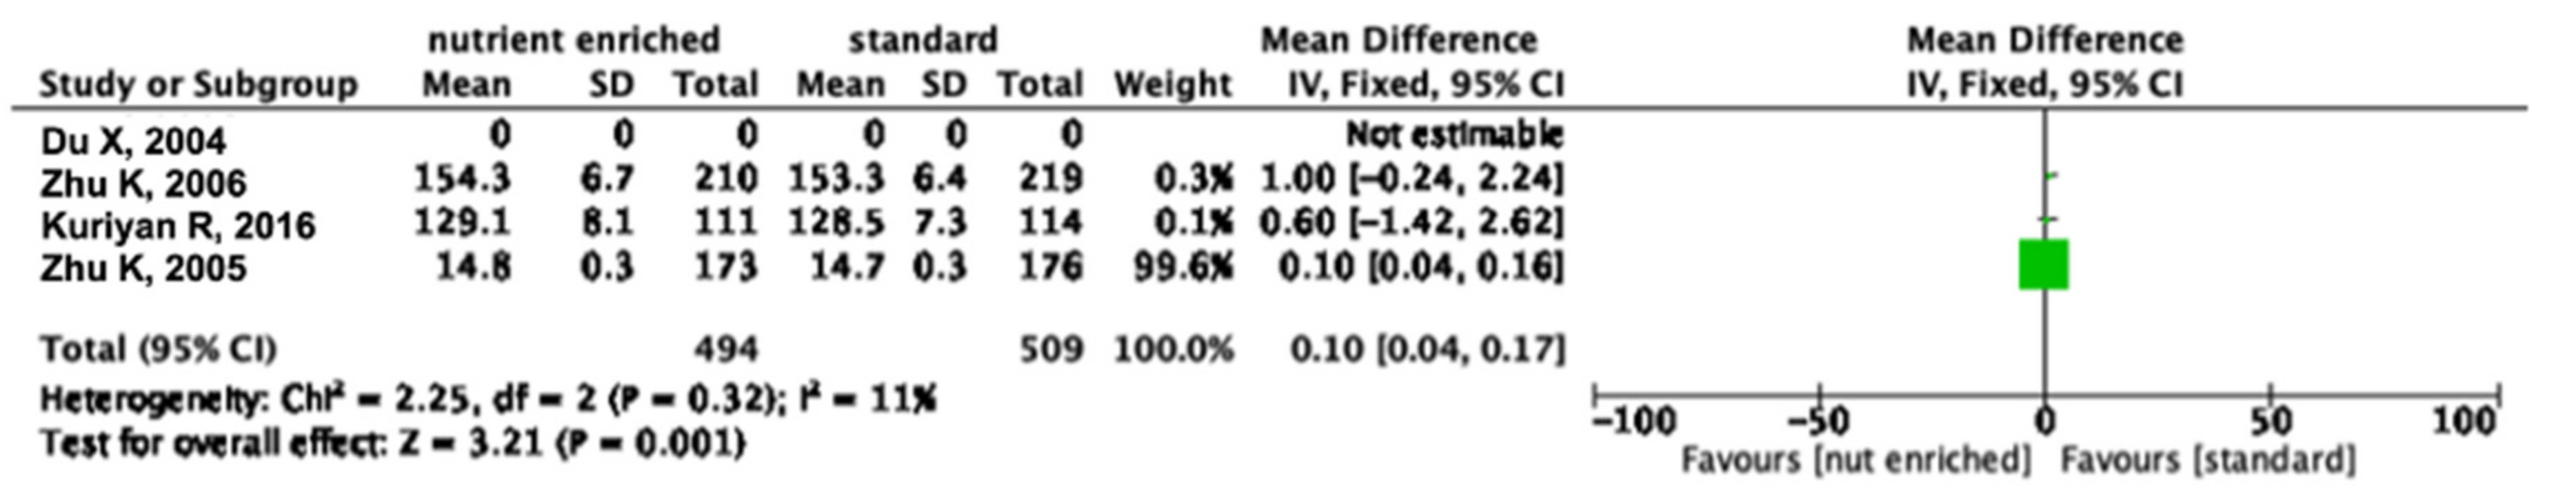
3.4. Meta-Analysis
3.5. Different Types of Cow’s Milk and Height
4. Discussion
5. Conclusions
Author Contributions
Funding
Institutional Review Board Statement
Informed Consent Statement
Data Availability Statement
Conflicts of Interest
References
- World Health Organization. Stunting in a Nutshell. 2015. Available online: https://www.who.int/news/item/19-11-2015-stunting-in-a-nutshell (accessed on 2 December 2022).
- unicef. Malnutrition in Children—UNICEF DATA. 2022. Available online: https://data.unicef.org/topic/nutrition/malnutrition/ (accessed on 2 December 2022).
- UNICEF-WHO; The World Bank. Joint Child Malnutrition Estimates (UNICEF-WHO-The World Bank)—2021—UNICEF DATA. 2021. Available online: https://data.unicef.org/resources/jme-report-2021/ (accessed on 2 December 2022).
- Bogale, T.Y.; Bala, E.T.; Tadesse, M.; Asamoah, B.O. Prevalence and associated factors for stunting among 6-12 years old school age children from rural community of Humbo district, Southern Ethiopia. BMC Public Health 2018, 18, 1–8. [Google Scholar] [CrossRef] [PubMed]
- Prince, A.K.; Laar, A. Nutritional Status of School-Age Children in The Nkwanta South District—Volta Region of Ghana. Eur. Sci. J. ESJ 2014, 10, 1857–7881. [Google Scholar]
- Joulaei, H.; Keshani, P.; Ashourpour, M.; Bemani, P.; Amiri, S.; Rahimi, J.; Aliakbarpour, M.; Salehi-Abargouei, A. The prevalence of stunting among children and adolescents living in the Middle East and North Africa region (MENA): A systematic review and meta-analysis. J. Glob. Health 2021, 11, 1–12. [Google Scholar] [CrossRef] [PubMed]
- Senbanjo, I.O.; Oshikoya, K.A.; Odusanya, O.O.; Njokanma, O.F. Prevalence of and Risk factors for Stunting among School Children and Adolescents in Abeokuta, Southwest Nigeria. J. Health Popul. Nutr. 2011, 29, 364. [Google Scholar] [CrossRef]
- Grenov, B.; Larnkjær, A.; Mølgaard, C.; Michaelsen, K.F. Role of Milk and Dairy Products in Growth of the Child. Nestle Nutr. Inst. Workshop Ser. 2020, 93, 77–90. [Google Scholar]
- Gillard, B.K.; Simbala, J.A.; Goodglick, L. Reference intervals for amylase isoenzymes in serum and plasma of infants and children. Clin. Chem. 1983, 29, 1119–1123. [Google Scholar] [CrossRef]
- Yoshiike, N.; Hayashi, F. New Food Guides in Japan and the US Japanese Food Guide Spinning Top and MyPyramid. Jpn. J. Nutr. Diet. 2006, 64, 1–11. [Google Scholar] [CrossRef]
- Home|Food-Based Dietary Guidelines|Food and Agriculture Organization of the United Nations. Available online: https://www.fao.org/nutrition/nutrition-education/food-dietary-guidelines/en/ (accessed on 2 December 2022).
- Abargouei, A.S.; Janghorbani, M.; Salehi-Marzijarani, M.; Esmaillzadeh, A. Effect of dairy consumption on weight and body composition in adults: A systematic review and meta-analysis of randomized controlled clinical trials. Int. J. Obes. 2012, 36, 1485–1493. [Google Scholar] [CrossRef] [Green Version]
- Chen, M.; Pan, A.; Malik, V.S.; Hu, F.B. Effects of dairy intake on body weight and fat: A meta-analysis of randomized controlled trials. Am. J. Clin. Nutr. 2012, 96, 735–747. [Google Scholar] [CrossRef] [Green Version]
- Soedamah-Muthu, S.S.; Ding, E.L.; Al-Delaimy, W.K.; Hu, F.B.; Engberink, M.F.; Willett, W.C.; Geleijnse, J.M. Milk and dairy consumption and incidence of cardiovascular diseases and all-cause mortality: Dose-response meta-analysis of prospective cohort studies. Am. J. Clin. Nutr. 2011, 93, 158–171. [Google Scholar] [CrossRef] [Green Version]
- Ralston, R.A.; Lee, J.H.; Truby, H.; Palermo, C.E.; Walker, K.Z. A systematic review and meta-analysis of elevated blood pressure and consumption of dairy foods. J. Hum. Hypertens. 2012, 26, 3–13. [Google Scholar] [CrossRef] [PubMed] [Green Version]
- Moreno, L.A.; Bel-Serrat, S.; Santaliestra-Pasías, A.; Bueno, G. Dairy products, yogurt consumption, and cardiometabolic risk in children and adolescents. Nutr. Rev. 2015, 73 (Suppl. 1), 8–14. [Google Scholar] [CrossRef] [PubMed]
- Van Slyke, L.L. The standardization of market milk. J. Dairy Sci. 1917, 4, 361–370. [Google Scholar] [CrossRef]
- Yeh, E.B.; Barbano, D.M.; Drake, M.A. Vitamin Fortification of Fluid Milk. J. Food Sci. 2017, 82, 856–864. [Google Scholar] [CrossRef] [Green Version]
- Overview of Food Ingredients, Additives & Colors|FDA. Available online: https://www.fda.gov/food/food-ingredients-packaging/overview-food-ingredients-additives-colors (accessed on 3 February 2023).
- Zhu, K.; Du, X.; Cowell, C.T.; Greenfield, H.; Blades, B.; Dobbins, T.A.; Zhang, Q.; Fraser, D.R. Effects of school milk intervention on cortical bone accretion and indicators relevant to bone metabolism in Chinese girls aged 10–12 y in Beijing. Am. J. Clin. Nutr. 2005, 81, 1168–1175. [Google Scholar] [CrossRef] [Green Version]
- Du, X.; Zhu, K.; Trube, A.; Zhang, Q.; Ma, G.S.; Hu, X.Q.; Fraser, D.; Greenfield, H. School-milk intervention trial enhances growth and bone mineral accretion in Chinese girls aged 10–12 years in Beijing. Br. J. Nutr. 2004, 92, 159–168. [Google Scholar] [CrossRef] [PubMed] [Green Version]
- Zhu, K.; Zhang, Q.; Foo, H.; Trube, A.; Ma, G.; Hu, X.; Du, X.; Cowell, C.T.; Fraser, D.R.; Greenfield, H. Growth, bone mass, and vitamin D status of Chinese adolescent girls 3 y after withdrawal of milk supplementation 1–3. Am. J. Clin. Nutr. 2006, 83, 714–735. [Google Scholar] [CrossRef] [PubMed] [Green Version]
- Wiley, A.S. Does milk make children grow? relationships between milk consumption and height in NHANES 1999–2002. Am. J. Hum. Biol. 2005, 17, 425–441. [Google Scholar] [CrossRef]
- Moschonis, G.; van den Heuvel, E.G.H.M.; Mavrogianni, C.; Singh-Povel, C.M.; Leotsinidis, M.; Manios, Y. Associations of Milk Consumption and Vitamin B₂ and Β12 Derived from Milk with Fitness, Anthropometric and Biochemical Indices in Children. The Healthy Growth Study. Nutrients 2016, 8, 634. [Google Scholar] [CrossRef]
- Hopkins, D.; Steer, C.D.; Northstone, K.; Emmett, P.M. Effects on childhood body habitus of feeding large volumes of cow or formula milk compared with breastfeeding in the latter part of infancy. Am. J. Clin. Nutr. 2015, 102, 1096–1103. [Google Scholar] [CrossRef] [Green Version]
- Guo, Q.; Wang, B.; Cao, S.; Jia, C.; Yu, X.; Zhao, L.; Dellarco, M.; Duan, X. Association between milk intake and childhood growth: Results from a nationwide cross-sectional survey. Int. J. Obes. 2020, 44, 2194–2202. [Google Scholar] [CrossRef] [PubMed]
- Kuriyan, R.; Thankachan, P.; Selvam, S.; Pauline, M.; Srinivasan, K.; Kamath-Jha, S.; Vinoy, S.; Misra, S.; Finnegan, Y.; Kurpad, A.V. The effects of regular consumption of a multiple micronutrient fortified milk beverage on the micronutrient status of school children and on their mental and physical performance. Clin. Nutr. 2016, 35, 190–198. [Google Scholar] [CrossRef] [PubMed]
- Kaneshiro, N.K. School Age Child Development: MedlinePlus Medical Encyclopedia Image. 2020. Available online: https://medlineplus.gov/ency/imagepages/9870.htm (accessed on 14 February 2023).
- Rodríguez, L.; Cervantes, E.; Ortiz, R. Malnutrition and Gastrointestinal and Respiratory Infections in Children: A Public Health Problem. Int. J. Environ. Res. Public Health 2011, 8, 1174–1205. [Google Scholar] [CrossRef] [PubMed] [Green Version]
- Baker, J.L.; Olsen, L.W.; Sørensen, T.I.A. Childhood Body-Mass Index and the Risk of Coronary Heart Disease in Adulthood. N. Engl. J. Med. 2007, 357, 2329. [Google Scholar] [CrossRef]
- National Institutes of Health. Calcium-Fact Sheet for Health Professionals. In Office of Dietary Supplements National Institutes of Health; 2020. Available online: https://ods.od.nih.gov/factsheets/Calcium-HealthProfessional/ (accessed on 20 February 2023).
- Institute of Medicine (US) Committee on Use of Dietary Reference Intakes in Nutrition Labeling. Overview of Food Fortification in the United States and Canada. Diet. Ref. Intakes Guid. Princ. Nutr. Labeling Fortif. 2003, 45–47. [Google Scholar]
- Wang, X.; Cheng, Z. Cross-Sectional Studies: Strengths, Weaknesses, and Recommendations. Chest 2020, 158, S65–S71. [Google Scholar] [CrossRef]
- Lin, S.L.; Tarrant, M.; Hui, L.L.; Kwok, M.K.; Lam, T.H.; Leung, G.M.; Schooling, C.M. The role of dairy products and milk in adolescent obesity: Evidence from Hong Kong’s “Children of 1997” birth cohort. PLoS ONE 2012, 7, e52575. [Google Scholar] [CrossRef] [Green Version]
- Bayless, T.M.; Brown, E.; Paige, D.M. Lactase Non-persistence and Lactose Intolerance. Curr. Gastroenterol. Rep. 2017, 19, 23. [Google Scholar] [CrossRef]
- Malik, T.F.; Panuganti, K.K. Lactose Intolerance; StatPearls: Tampa, FL, USA, 2022. [Google Scholar]
- Bronner, F. Extracellular and intracellular regulation of calcium homeostasis. Sci. World J. 2001, 1, 919–925. [Google Scholar] [CrossRef] [Green Version]
- Fang, A.; Li, K.; Li, H.; Guo, M.; He, J.; Shen, X.; Song, J. Low Habitual Dietary Calcium and Linear Growth from Adolescence to Young Adulthood: Results from the China Health and Nutrition Survey. Sci. Rep. 2017, 7, 9111. [Google Scholar] [CrossRef] [Green Version]
- Abrams, S.A.; Griffin, I.J.; Hawthorne, K.M.; Liang, L. Height and Height Z-Score Are Related to Calcium Absorption in Five- to Fifteen-Year-Old Girls. J. Clin. Endocrinol. Metab. 2005, 90, 5077–5081. [Google Scholar] [CrossRef] [PubMed] [Green Version]
- Grantham-McGregor, S.; Cheung, Y.B.; Cueto, S.; Glewwe, P.; Richter, L.; Strupp, B. Developmental potential in the first 5 years for children in developing countries. Lancet 2007, 369, 60–70. [Google Scholar] [CrossRef] [PubMed] [Green Version]
- Black, R.E.; Victora, C.G.; Walker, S.P.; Bhutta, Z.A.; Christian, P.; de Onis, M.; Ezzati, M.; Grantham-McGregor, S.; Katz, J.; Martorell, R.; et al. Maternal and child undernutrition and overweight in low-income and middle-income countries. Lancet 2013, 382, 427–451. [Google Scholar] [CrossRef] [PubMed]
- Adesogan, A.T.; Dahl, G.E. MILK Symposium Introduction: Dairy production in developing countries. J. Dairy Sci. 2020, 103, 9677–9680. [Google Scholar] [CrossRef]
- Alexy, U.; Remer, T.; Manz, F.; Neu, C.M.; Schoenau, E. Long-term protein intake and dietary potential renal acid load are associated with bone modeling and remodeling at the proximal radius in healthy children. Am. J. Clin. Nutr. 2005, 82, 1107–1114. [Google Scholar] [CrossRef] [Green Version]
- Moyer-Mileur, L.J.; Xie, B.; Ball, S.D.; Pratt, T. Bone mass and density response to a 12-month trial of calcium and vitamin D supplement in preadolescent girls. J. Musculoskelet. Neuronal Interact. 2003, 3, 63–70. [Google Scholar]


| Criteria | Description |
|---|---|
| Participants | Children aged between 7–12 years old |
| Intervention/Exposure | Different types of cow’s milk |
| Comparison | Standard vs Nutrient-enriched cow’s milk |
| Outcomes | Child’s growth using validated measurements and protocol |
| Study design | Randomised controlled trial (RCT), non-RCT, cohort, and cross-sectional |
| Concept 1 | Concept 2 | Concept 3 | ||
|---|---|---|---|---|
| (“Milk” [All fields] OR “Fresh Milk” [All fields] OR “Milk powder” [All fields] OR “Liquid milk”[All Fields]) | AND | (“Stunting” [All fields] OR “Growth”[All fields] OR “Stunted” [All Fields]) | AND | (“child”[MeSH Terms] OR “children” [MeSH Terms]) |
| Studies/Domains | Selection | Comparability | Outcome | ||||||
|---|---|---|---|---|---|---|---|---|---|
| Representativeness of the Sample | Sample Size | Non-Respondents | Ascertainment of Risk Exposure | Comparability | Assessment of Outcome | Statistical Test | Selection—Score+Comparability Score+Outcome | Quality | |
| Moschonis et al., 2018 [24] | * | * | * | ** | ** | * | * | 5 + 2 + 2 = 9 | Good |
| Guo et al., 2020 [26] | * | * | * | ** | * | * | * | 5 + 1 + 2 = 8 | Good |
| Wiley, 2005 [23] | ** | * | * | ** | ** | * | * | 5 + 2 + 3 | Good |
| Studies/Domains | Selection | Comparability | Outcome | |||||||
|---|---|---|---|---|---|---|---|---|---|---|
| Representativeness of the Exposed Cohort | Selection of the Non-Exposed Cohort | Ascertainment of Exposure | Demonstration that Outcome of Interest was not Present at the Start of the Study | Comparability | Assessment of Outcome | Was Follow-Up Long Enough for Outcomes to Occur | Adequacy of Follow-Up of Cohorts | Selection Score+Comparability Score+Outcome | Quality | |
| Hopkins et al., 2015 [25] | * | * | * | * | * | * | * | * | 4 + 1 + 3 = 8 | Good |
| Studies | Random Sequence Generation | Allocation Concealment | Blinding Of Participants and Personnel | Blinding of Outcome Assessment | Incomplete Outcome Data | Selective Reporting | Other Bias Due to Problems Not Covered Elsewhere in the Table | Quality Score—Good Quality/Fair Quality/Poor Quality |
|---|---|---|---|---|---|---|---|---|
| Zhu et al., 2006 [22] | High Risk | Low Risk | Low Risk | Low Risk | Low Risk | Low Risk | Unclear | Fair |
| Du et al., 2004 [21] | High Risk | Low Risk | Low Risk | Low Risk | Low Risk | Low Risk | Unclear | Fair |
| Kuriyan et al., 2016 [27] | Low Risk | Low Risk | Low Risk | Low Risk | Low Risk | Low Risk | Low Risk | Good |
| Zhu et al., 2005 [20] | High Risk | Low Risk | Low Risk | Low Risk | Low Risk | Low Risk | Unclear | Fair |
| Type of Milk | Design (Total Number of Studies by Design) | Positive Results (p < 0.05) | Negative Results (p < 0.05) | Non-Significant Results (p > 0.05) |
|---|---|---|---|---|
| Nutrient-enriched cow’s milk/Formula milk | Cross-Sectional (N = 2) Cohort (N = 1) Randomised Controlled Trial (N = 4) | 4 | 2 | 1 |
| Standard cow’s milk/Plain milk, and other dairy products | Cross-Sectional (N = 1) Cohort (N = 1) Randomised Controlled Trial (N = 0) | 2 | 0 | 0 |
Disclaimer/Publisher’s Note: The statements, opinions and data contained in all publications are solely those of the individual author(s) and contributor(s) and not of MDPI and/or the editor(s). MDPI and/or the editor(s) disclaim responsibility for any injury to people or property resulting from any ideas, methods, instructions or products referred to in the content. |
© 2023 by the authors. Licensee MDPI, Basel, Switzerland. This article is an open access article distributed under the terms and conditions of the Creative Commons Attribution (CC BY) license (https://creativecommons.org/licenses/by/4.0/).
Share and Cite
Mohd Isa, D.; Krishnamoorthy, R.; Abdul Majid, H. Standard vs. Nutrient-Enriched Cow’s Milk and Its Impacts on Child Growth: A Systematic Review and Meta-Analysis. Nutrients 2023, 15, 1124. https://doi.org/10.3390/nu15051124
Mohd Isa D, Krishnamoorthy R, Abdul Majid H. Standard vs. Nutrient-Enriched Cow’s Milk and Its Impacts on Child Growth: A Systematic Review and Meta-Analysis. Nutrients. 2023; 15(5):1124. https://doi.org/10.3390/nu15051124
Chicago/Turabian StyleMohd Isa, Darwish, Raanita Krishnamoorthy, and Hazreen Abdul Majid. 2023. "Standard vs. Nutrient-Enriched Cow’s Milk and Its Impacts on Child Growth: A Systematic Review and Meta-Analysis" Nutrients 15, no. 5: 1124. https://doi.org/10.3390/nu15051124