
Measuring the Rheological and Textural Properties of Thick Purees Used to Manage Patients with Swallowing Disorders


Abstract
:
1. Introduction
2. Materials and Methods
2.1. Materials
2.1.1. Texture-Modified Diets (TMDs)
2.1.2. Thick Purees Formulation
2.1.3. Thick Puree Composition
2.1.4. Participants
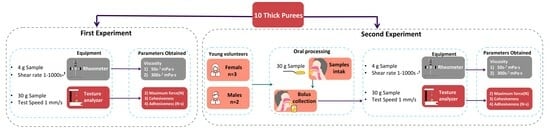
2.2. Study Design
2.3. Methodology
2.3.1. Rheological Properties
2.3.2. Textural Properties
2.3.3. Saliva and Oral-Processing Effect Calculation
- Viscosity decay was assessed according to the following formula:
- The shear thinning effect on the viscosity during pharyngeal flow decay in viscosity due to shear rate was assessed according to the following formula:
- Viscosity decay due to the combined effect of both shear thinning and the effect of oral processing decrease in the viscosity due to the shear rate was assessed according to the following formula:
- Maximum force cohesiveness and adhesiveness decay were assessed according to the following formula:
2.4. Data Management and Statistical Analysis
3. Results
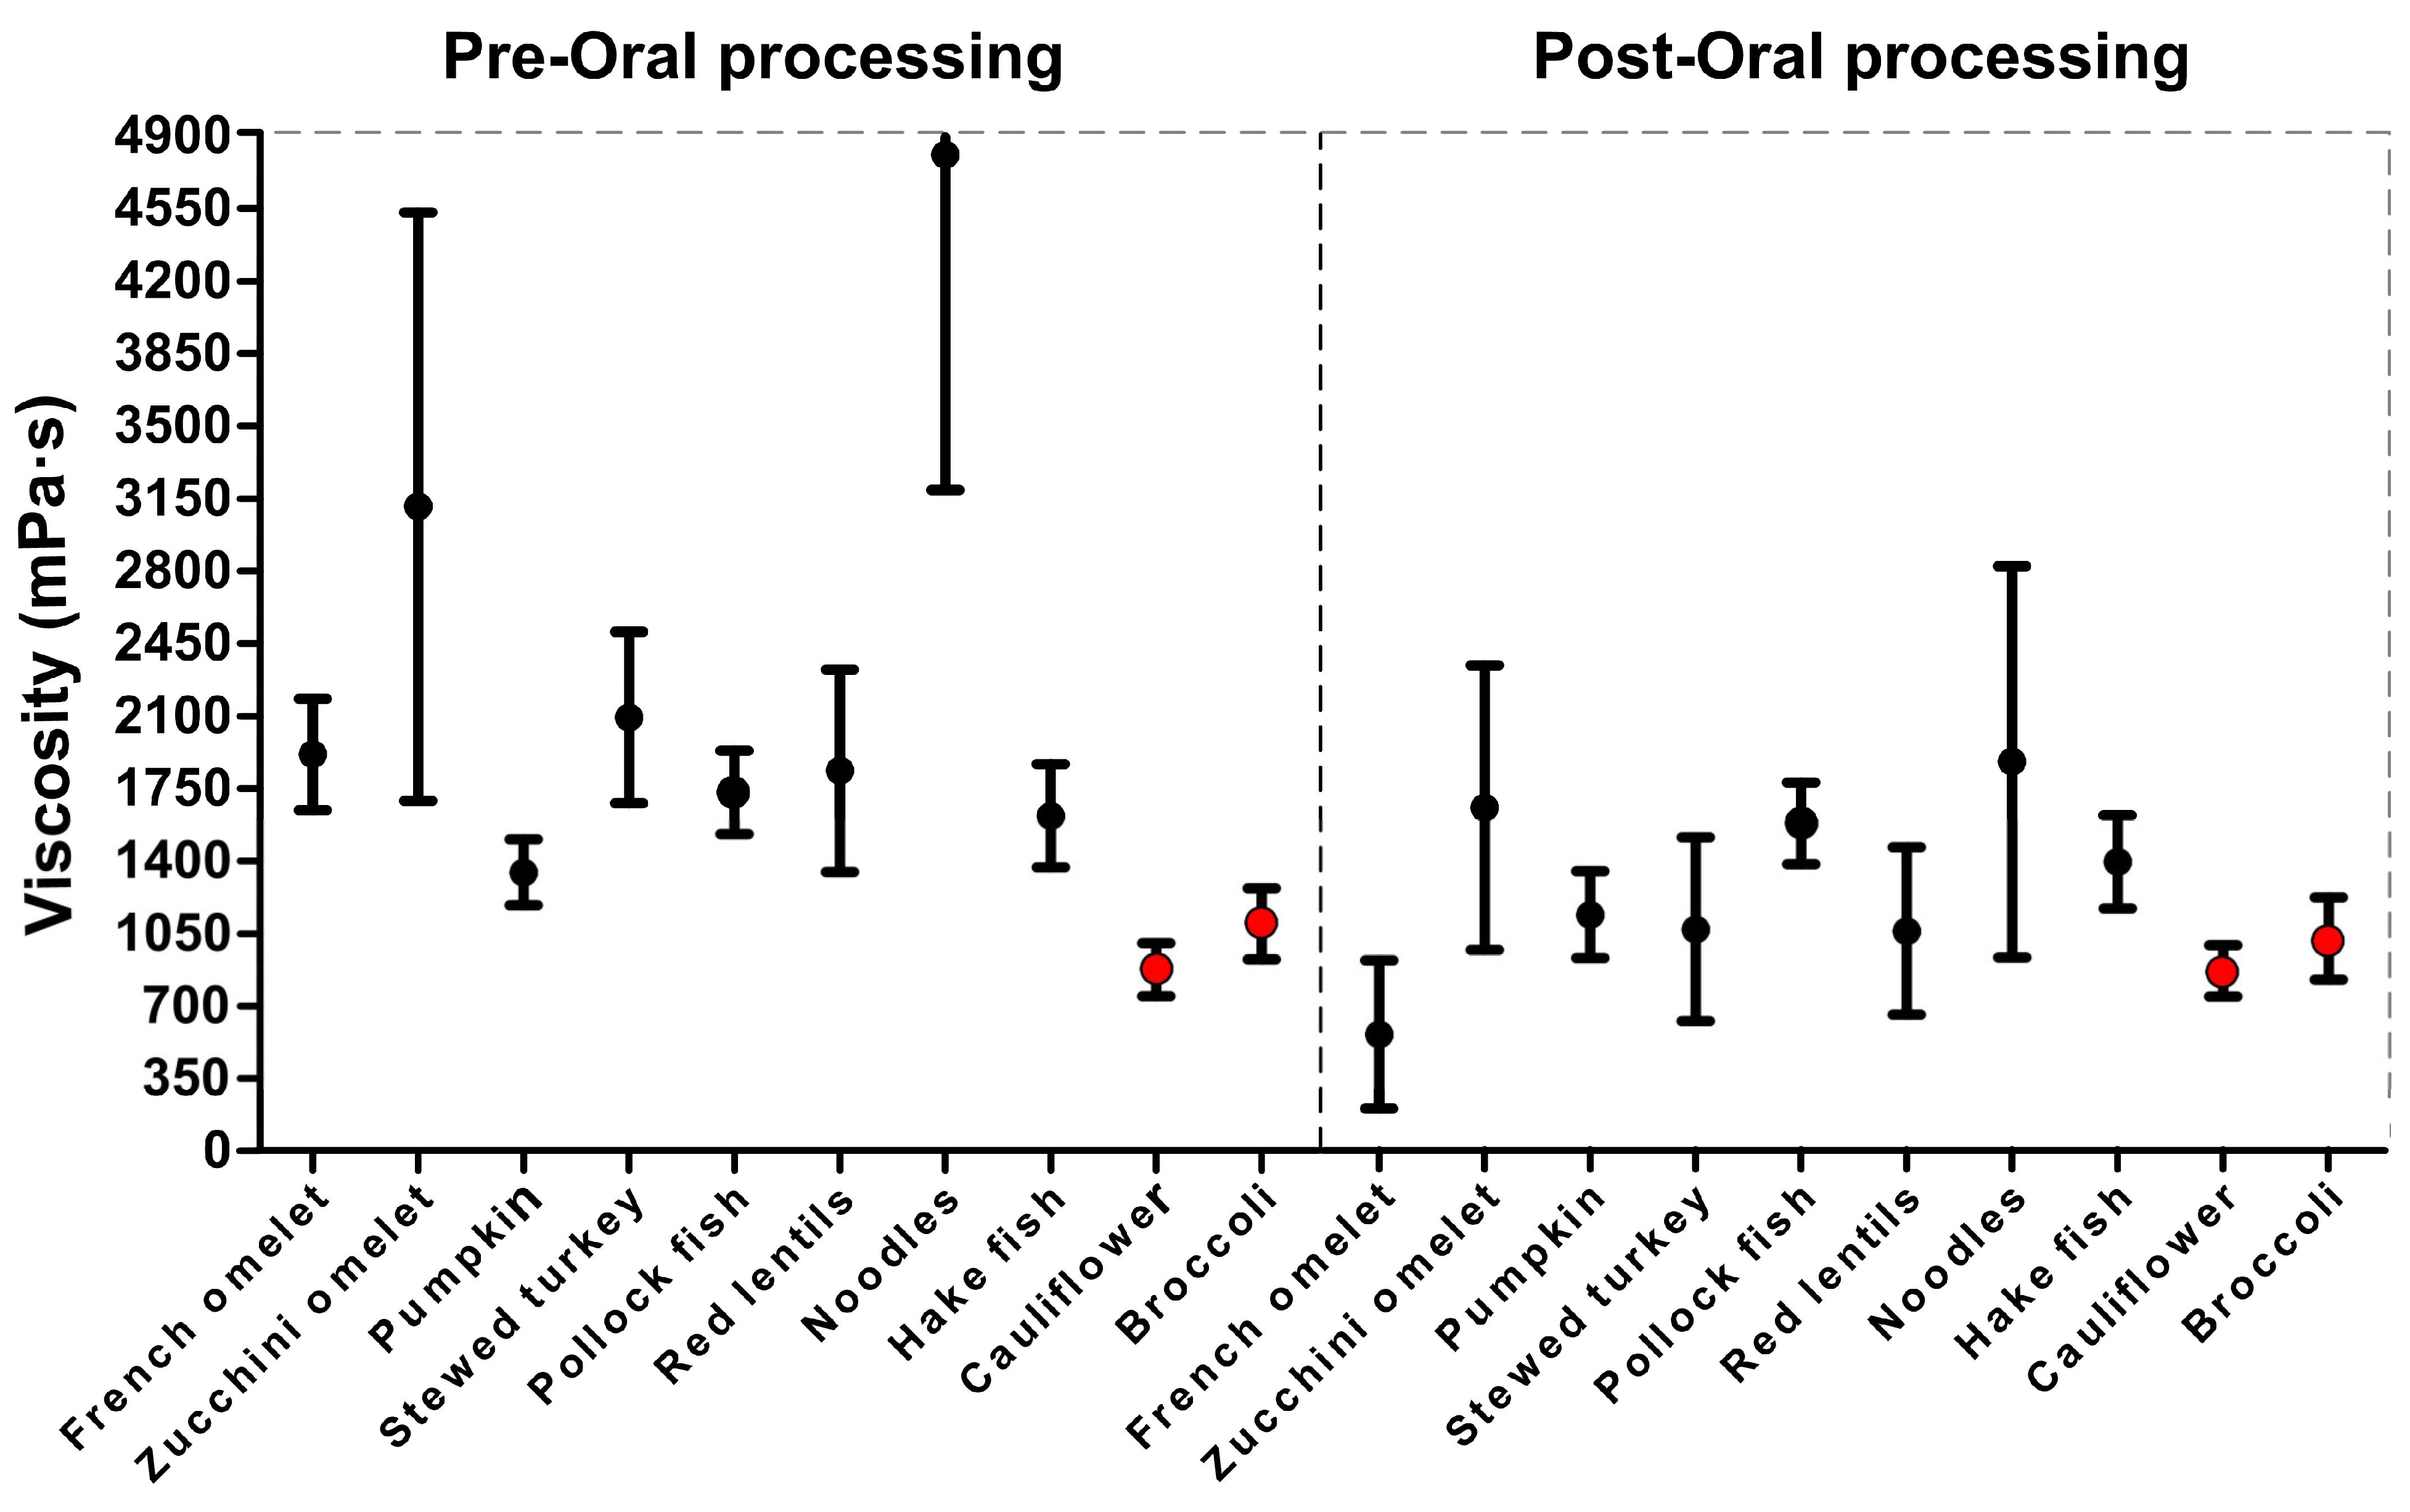
3.1. Shear Viscosity at 50 s−1
3.1.1. Pre-Oral Processing
3.1.2. Oral-Processing Effect
3.1.3. Ready-to-Swallow Bolus
3.1.4. Pre-Oral Shear Thinning and Combined Effect with Oral-Processing Effect
3.1.5. Effect of Oral Processing on Non-Newtonian Behavior
3.2. Textural Characteristics
3.2.1. Pre-Oral Processing
3.2.2. Oral-Processing Effect
3.2.3. Ready-to-Swallow Bolus
3.2.4. Textural Differences between Thick Purees Sensitive and Resistant to Oral Processing
3.3. Correlation Analysis
4. Discussion
5. Conclusions
Supplementary Materials
Author Contributions
Funding
Institutional Review Board Statement
Informed Consent Statement
Data Availability Statement
Acknowledgments
Conflicts of Interest
References
- Amarya, S.; Singh, K.; Sabharwal, M. Ageing Process and Physiological Changes. Gerontology. 2018. Available online: https://www.researchgate.net/publication/326215802_Ageing_Process_and_Physiological_Changes (accessed on 21 August 2023).
- Mazzonna, F.; Peracchi, F. Ageing, cognitive abilities and retirement. Eur. Econ. Rev. 2012, 56, 691–710. [Google Scholar] [CrossRef]
- Lin, L.C.; Wu, S.C.; Chen, H.S.; Wang, T.G.; Chen, M.Y. Prevalence of Impaired Swallowing in Institutionalized Older People in Taiwan. J. Am. Geriatr. Soc. 2002, 50, 1118–1123. [Google Scholar] [CrossRef]
- Liu, H.Y.; Chen, J.H.; Hsu, K.J.; Yao, C.T.; Chen, P.H.; Hsiao, S.Y. Decreased Tongue Pressure Associated with Aging, Chewing and Swallowing Difficulties of Community-Dwelling Older Adults in Taiwan. J. Pers. Med. 2021, 11, 653. [Google Scholar] [CrossRef]
- Tamine, K.; Ono, T.; Hori, K.; Kondoh, J.; Hamanaka, S.; Maeda, Y. Age-related Changes in Tongue Pressure during Swallowing. J. Dent. Res. 2010, 89, 1097–1101. [Google Scholar] [CrossRef]
- Durvasula, V.S.P.B.; O’Neill, A.C.; Richter, G.T. Oropharyngeal Dysphagia in Children: Mechanism, Source, and Management. Otolaryngol. Clin. N. Am. 2014, 47, 691–720. [Google Scholar] [CrossRef] [PubMed]
- Mioche, L.; Bourdiol, P.; Peyron, M.-A. Influence of age on mastication: Effects on eating behaviour. Nutr. Res. Rev. 2004, 17, 43–54. [Google Scholar] [CrossRef] [PubMed]
- Nazarko, L. Maintaining or improving nutrition and hydration in dysphagia. Indep. Nurse 2018, 2018, 17–20. [Google Scholar] [CrossRef]
- Vesey, S. Dysphagia and quality of life. Br. J. Community Nurs. 2013, 18 (Suppl. S5), S14–S19. [Google Scholar] [CrossRef]
- Thiyagalingam, S.; Kulinski, A.E.; Thorsteinsdottir, B.; Shindelar, K.L.; Takahashi, P.Y. Dysphagia in Older Adults. Mayo Clin. Proc. 2021, 96, 488–497. [Google Scholar] [CrossRef] [PubMed]
- Clavé, P.; Shaker, R. Dysphagia: Current reality and scope of the problem. Nat. Rev. Gastroenterol. Hepatol. 2015, 12, 259–270. [Google Scholar] [CrossRef]
- Dibello, V.; Zupo, R.; Sardone, R.; Lozupone, M.; Castellana, F.; Dibello, A.; Daniele, A.; De Pergola, G.; Bortone, I.; Lampignano, L.; et al. Oral frailty and its determinants in older age: A systematic review. Lancet Healthy Longev. 2021, 2, e507–e520. [Google Scholar] [CrossRef]
- Dias-da-Costa, J.S.; Galli, R.; Oliveira, E.A.D.; Backes, V.; Vial, E.A.; Canuto, R.; Souza, L.L.D.; Cremonese, C.; Olinto, M.T.A.; Pattussi, M.P.; et al. Prevalence of poor self-rated mastication and associated factors in Brazilian elderly. Cad. Saúde Pública 2010, 26, 79–88. [Google Scholar] [CrossRef] [PubMed]
- Murrieta, J.; Alvarado, E.; Valdez, M.; Orozco, L.; Meza, J.; Juárez, M.L. Prevalencia de trastornos temporomandibulares en un grupo de adultos mayores Mexicanos. J. Oral Res. 2016, 5, 13–18. [Google Scholar] [CrossRef]
- Bolivar-Prados, M.; Rofes, L.; Arreola, V.; Guida, S.; Nascimento, W.V.; Martin, A.; Vilardell, N.; Ortega Fernández, O.; Ripken, D.; Lansink, M.; et al. Effect of a gum-based thickener on the safety of swallowing in patients with poststroke oropharyngeal dysphagia. Neurogastroenterol. Motil. 2019, 31, e13695. [Google Scholar] [CrossRef] [PubMed]
- Newman, R.; Vilardell, N.; Clavé, P.; Speyer, R. Erratum to: Effect of Bolus Viscosity on the Safety and Efficacy of Swallowing and the Kinematics of the Swallow Response in Patients with Oropharyngeal Dysphagia: White Paper by the European Society for Swallowing Disorders (ESSD). Dysphagia 2016, 31, 719. [Google Scholar] [CrossRef]
- Ortega, O.; Bolívar-Prados, M.; Arreola, V.; Nascimento, W.V.; Tomsen, N.; Gallegos, C.; Brito-de La Fuente, E.; Clavé, P. Therapeutic Effect, Rheological Properties and α-Amylase Resistance of a New Mixed Starch and Xanthan Gum Thickener on Four Different Phenotypes of Patients with Oropharyngeal Dysphagia. Nutrients 2020, 12, 1873. [Google Scholar] [CrossRef]
- Brito-de la Fuente, E.; Ekberg, O.; Gallegos, C. Rheological Aspects of Swallowing and Dysphagia. Dysphagia Diagn. Treat. 2012, 493–506. [Google Scholar]
- Bolivar-Prados, M.; Tomsen, N.; Hayakawa, Y.; Kawakami, S.; Miyaji, K.; Kayashita, J.; Clavé, P. Proposal for a Standard Protocol to Assess the Rheological Behavior of Thickening Products for Oropharyngeal Dysphagia. Nutrients 2022, 14, 5028. [Google Scholar] [CrossRef]
- Bolivar-Prados, M.; Tomsen, N.; Arenas, C.; Ibáñez, L.; Clave, P. A bit thick: Hidden risks in thickening products’ labelling for dysphagia treatment. Food Hydrocoll. 2022, 123, 106960. [Google Scholar] [CrossRef]
- National Dysphagia Diet: Standardization for Optimal Care—National Dysphagia Diet Task Force, American Dietetic Association. 2002. Available online: https://books.google.com.pr/books?id=MZ5mSbGPOE4C&printsec=frontcover#v=onepage&q&f=false (accessed on 21 August 2023).
- Kayashita, J.; Fujishima, I.; Fujitani, J.; Hironaka, S.; Kojo, A.; Mizukami, M.; Senda, N.; Moriwaki, M.; Watanabe, E. The Japanese Dysphagia Diet of 2021 by the Japanese Society of Dysphagia Rehabilitation. Jpn. J. Compr. Rehabil. Sci. 2022, 13, 64–77. [Google Scholar] [CrossRef]
- Clinical Governance Board, Development Committees Panel. National Descriptors for Texture Modification in Adults. 2009. Available online: https://www.acquiredbraininjury-education.scot.nhs.uk/wp-content/uploads/National-Descriptors-Texture-Modification-Adults-2009.pdf (accessed on 21 August 2023).
- Lam, P.; Stanschus, S.; Zaman, R.; Cichero, J.A. The International Dysphagia Diet Standardisation Initiative (IDDSI) framework: The Kempen pilot. Br. J. Neurosci. Nurs. 2017, 13 (Suppl. S2), S18–S26. [Google Scholar] [CrossRef]
- Maksimenko, A.; Lyude, A.; Nishiumi, T. Texture-modified foods for the elderly and people with dysphagia: Insights from Japan on the current status of regulations and opportunities of the high pressure technology. IOP Conf. Ser. Earth Environ. Sci. 2020, 548, 022106. [Google Scholar] [CrossRef]
- Costa, A.; Carrión, S.; Puig-Pey, M.; Juárez, F.; Clavé, P. Triple Adaptation of the Mediterranean Diet: Design of A Meal Plan for Older People with Oropharyngeal Dysphagia Based on Home Cooking. Nutrients 2019, 11, 425. [Google Scholar] [CrossRef]
- Chen, J. Food oral processing—A review. Food Hydrocoll. 2009, 23, 1–25. [Google Scholar] [CrossRef]
- Boehm, M.W.; Yakubov, G.E.; Stokes, J.R.; Baier, S.K. The role of saliva in oral processing: Reconsidering the breakdown path paradigm. J. Texture Stud. 2020, 51, 67–77. [Google Scholar] [CrossRef] [PubMed]
- Chen, Y.; Capuano, E.; Stieger, M. Chew on it: Influence of oral processing behaviour on in vitro protein digestion of chicken and soya-based vegetarian chicken. Br. J. Nutr. 2020, 126, 1408–1419. [Google Scholar] [CrossRef] [PubMed]
- Friedman, H.H.; Whitney, J.F.; Szczesniak, A.S. The Texturometer—A new instrument for objective texture measurement. J. Food Sci. 1963, 28, 390–396. [Google Scholar] [CrossRef]
- Clavé, P.; De Kraa, M.; Arreola, V.; Girvent, M.; Farre, R.; Palomera, E.; Serra-Prat, M. The effect of bolus viscosity on swallowing function in neurogenic dysphagia. Aliment. Pharmacol. Ther. 2006, 24, 1385–1394. [Google Scholar] [CrossRef] [PubMed]
- Tokifuji, A.; Matsushima, Y.; Hachisuka, K.; Yoshioka, K. Texture, sensory and swallowing characteristics of high-pressure-heat-treated pork meat gel as a dysphagia diet. Meat Sci. 2013, 93, 843–848. [Google Scholar] [CrossRef] [PubMed]


| Texture/Consistency Check | Texture/Consistency Characteristics |
|---|---|
|
|
| Puree | Ingredients | Weight/Recipe (g) | Carbohydrates (g) | Proteins (g) | Kcal |
|---|---|---|---|---|---|
| French omelet | French omelet (86.2%), water (11.3%), thickener (1.4%), virgin olive oil (1.1%) | 100 | 0.29 | 7.17 | 156.56 |
| Zucchini omelet | Zucchini (44.6%), Ratatouille (8.9%), salt (0.2%), virgin olive oil (1.8%), diced potatoes (26.7%), water (17.8%), thickener (1.2%) | 100 | 0.39 | 2.90 | 103.62 |
| Pumpkin | Carrot (80.4%), Ratatouille (16.1%), salt (0.3%), virgin olive oil (3.2%), thickener (2%) | 100 | 0.21 | 1.18 | 101 |
| Stewed turkey | Sliced turkey breast (38.7%), salt (2.1%), virgin olive oil (8.82%), black pepper (0.8%), thickener (1.1%), water (32.5%), concentrated chicken broth without salt (14.8%), vegetable sauce (32.5%), diced potato, (22.3%), diced carrot (15.2%) | 100 | 0.5 | 13.41 | 151.15 |
| Pollock fish | Pollock fish (34.5%), salt (0.33%), olive oil (1.56%), black pepper (0.11%), thickener (0.22%), lemon sauce (62.28%) | 100 | - | 10.21 | 113.18 |
| Red lentils | Lentil (15.6%), Ratatouille (31.3%), concentrated chicken broth (3.9%), salt (0.1%), extra virgin oil (2%), diced potato (18.4%), diced carrot (7.8%), water (19.6%), ground cumin (0.2%), thickener (1.2%) | 100 | 12.57 | 6.93 | 134.76 |
| Noodles | Noodles nº2 (18.7%), olive oil (1.9%), salt (0.9%), Ratatouille base (9.3%), stock (55%), peeled shrimp (5.6%), garlic and parsley (1.9%), mussels (5.6), thickener (1.1%) | 100 | 13 | 4.9 | 141.81 |
| Hake fish | Hake fish (94.2%), salt (0.9%), olive oil (3.8%), black paper (0.4%) and thickener (0.7%) | 100 | - | 10.19 | 113.1 |
| Cauliflower | Cauliflower (44.6%), Ratatouille (8.9%), salt (0.2%), virgin oil (1.8%), diced potato (24.7%), water (17.8%) and thickener (2%) | 100 | 5.3 | 2.75 | 74.48 |
| Broccoli | Broccoli (44.6%), Ratatouille (8.9%), salt (0.2%), virgin oil (1.8%), diced potato (24.7%), water (17.8%) and thickener (2%) | 100 | 6 | 2.75 | 74.48 |
| Thick Puree | Viscosity (mPa·s) | % Decay Oral Processing 50 s−1 | p-Value * by Oral Processing Effect 50 s−1 | |
|---|---|---|---|---|
| Mean 50 s−1 (SD) Pre-Oral Processing | Mean 50 s−1 (SD) Post-Oral Processing | |||
| French omelet | 1915.42 c (268.95) | 555.73 e (356.50) | 70.99 | <0.0001 |
| Zucchini omelet | 3111.48 b (1420.37) | 1651.77 ab (687.51) | 46.69 | 0.017 |
| Pumpkin | 1345.68 def (159.69) | 1133.51 cd (209.5) | 15.77 | 0.009 |
| Stewed turkey | 2093.76 c (414.48) | 1063.52 cd (4341) | 49.20 | <0.0001 |
| Pollock fish | 1731.91 cd (201.66) | 1575.82 ab (197.0) | 9.01 | 0.04 |
| Red lentils | 1836.73 cd (488.62) | 1055.02 d (404.81) | 42.56 | 0.0001 |
| Noodles | 4809.85 a (1618.21) | 1872.71 a (944.2) | 61.07 | <0.0001 |
| Hake fish | 1626.72 cde (248.26) | 1389.90 bc (251.24) | 14.55 | 0.04 |
| Cauliflower | 875.97 f (128.24) | 862.91 de (122.75) | 1.49 | 0.96 |
| Broccoli | 1095.34 ef (171.63) | 1019.11 d (198.8) | 6.96 | 0.25 |
| Thick Puree | Viscosity (mPa·s) | p-Value * (Pre-Post Viscosity) | Pre-Oral Shear Thinning% | p-Value ** (Shear Thinning) | % Effect on the Viscosity of Oral Processing Shear Thinning | |
|---|---|---|---|---|---|---|
| Mean 300 s−1 (SD) Pre-Oral Processing | Mean 300 s−1 (SD) Post-Oral Processing | |||||
| French omelet | 518.48 c (126.89) | 133.23 e (73.25) | <0.0001 | 72.93 | 0.79 | 93.04 |
| Zucchini omelet | 704.11 b (323.05) | 388.96 ab (173.57) | 0.014 | 77.37 | 0.42 | 87.44 |
| Pumpkin | 305.20 ef (39.49) | 250.92 cd (46.96) | 0.006 | 77.32 | 0.47 | 81.35 |
| Stewed turkey | 483.60 cd (101.94) | 248.84 cd (86.70) | <0.0001 | 76.90 | 0.46 | 88.11 |
| Pollock fish | 354.04 de (31.60) | 341.09 b (44.82) | 0.031 | 79.55 | 0.02 | 79.87 |
| Red lentils | 464.22 cd (134.42) | 252.23 cd (77.67) | 0.0001 | 74.73 | 0.36 | 86.26 |
| Noodles | 1282.18 a (438.4) | 458.55 a (241.70) | <0.0001 | 73.34 | <0.0001 | 90.46 |
| Hake fish | 377.74 de (67.93) | 317.40 bc (55.98) | 0.014 | 76.77 | 0.32 | 80.48 |
| Cauliflower | 188.81 f (29.51) | 280.81 de (38.84) | 0.65 | 78.45 | 0.49 | 67.40 |
| Broccoli | 220.04 f (56.67) | 221.5 d (45.84) | 0.780 | 79.91 | 0.16 | 79.77 |
| Puree | Pre-Oral Processing | Post-Oral Processing | ||
|---|---|---|---|---|
| Flow Index (n) | Consistency Index | Flow Index (n) | Consistency Index | |
| (K; Pa⋅sn) | (K; Pa⋅sn) | |||
| French omelet | 0.27 | 4.53 | 0.31 | 3.98 |
| Zucchini omelet | 0.27 | 4.63 | 0.93 | 4.57 |
| Pumpkin | 0.28 | 4.31 | 0.29 | 4.23 |
| Stewed turkey | 0.25 | 4.53 | 0.25 | 4.31 |
| Pollock fish | 0.22 | 4.52 | 0.24 | 4.48 |
| Red lentils | 0.87 | 3.27 | 0.06 | 4.82 |
| Noodles | 0.29 | 4.78 | 0.29 | 4.39 |
| Hake fish | 0.23 | 4.51 | 0.2 | 4.53 |
| Cauliflower | 0.28 | 4.14 | 0.26 | 4.15 |
| Broccoli | 0.28 | 4.21 | 0.27 | 4.2 |
| Thick Puree | Maximum Force (N) Pre-Oral Processing | Maximum Force (N) Post-Oral Processing | p-Value * | % Decay by Oral Processing |
|---|---|---|---|---|
| Mean (SD) | Mean (SD) | |||
| French omelet | 0.74 b (0.24) | 0.47 b (0.13) | <0.0001 | 36.49 |
| Zucchini omelet | 1.2 a (0.85) | 0.85 a (0.52) | 0.25 | 29.17 |
| Pumpkin | 0.52 b (0.11) | 0.48 b (0.11) | 0.08 | 7.69 |
| Stewed turkey | 0.61 b (0.11) | 0.43 b (0.07) | 0.0001 | 29.51 |
| Pollock fish | 0.64 b (0.13) | 0.56 b (0.1) | 0.093 | 9.38 |
| Red lentils | 0.51 b (0.09) | 0.42 b (0.07) | 0.003 | 17.65 |
| Noodles | 0.73 b (0.31) | 0.52 b (0.11) | 0.018 | 28.77 |
| Hake fish | 0.47 b (0.03) | 0.44 b (0.05) | 0.036 | 6.38 |
| Cauliflower | 0.5 b (0.06) | 0.42 b (0.07) | 0.08 | 16 |
| Broccoli | 0.53 b (0.11) | 0.46 b (0.08) | 0.013 | 13.21 |
| Thick Puree | Cohesiveness Pre-Oral Processing | Cohesiveness Post-Oral Processing | p-Value * | % Decay by Oral Processing |
|---|---|---|---|---|
| Mean (SD) | Mean (SD) | |||
| French omelet | 0.78 ab (0.08) | 0.77 ab (0.05) | 0.3 | 1.28 |
| Zucchini omelet | 0.66 c (0.08) | 0.70 c (0.04) | 0.1 | −6.06 (increase) |
| Pumpkin | 0.76 ab (0.03) | 0.76 ab (0.04) | 0.46 | 2.63 |
| Stewed turkey | 0.76 ab (0.05) | 0.75 abc (0.01) | 0.34 | 1.32 |
| Pollock fish | 0.78 ab (0.05) | 0.74 abc (0.03) | 0.021 | 3.9 |
| Red lentils | 0.79 ab (0.03) | 0.76 ab (0.02) | 0.023 | 3.8 |
| Noodles | 0.73 bc (0.15) | 0.73 bc (0.09) | 0.74 | 0 |
| Hake fish | 0.82 a (0.03) | 0.78 ab (0.02) | 0.001 | 4.88 |
| Cauliflower | 0.81 ab (0.04) | 0.80 a (0.03) | 0.098 | 1.23 |
| Broccoli | 0.82 a (0.04) | 0.78 ab (0.03) | 0.003 | 2.44 |
| Thick Puree | Adhesiveness (N·s) Pre-Oral Processing | Adhesiveness (N·s) Post-Oral Processing | p-Value * | % Decay by Oral Processing |
|---|---|---|---|---|
| Mean (SD) | Mean (SD) | |||
| French omelet | 1.1 a (0.23) | 0.54 ab (0.21) | <0.0001 | 50.91 |
| Zucchini omelet | 0.83 ab (0.51) | 0.84 a (0.43) | 0.74 | −1.20 (increase) |
| Pumpkin | 0.74 b (0.21) ab | 0.61 ab (0.17) | 0.17 | 17.57 |
| Stewed turkey | 0.89 ab (0.027) | 0.46 b (0.26) | <0.0001 | 48.31 |
| Pollock fish | 0.96 ab (0.20) | 0.70 ab (0.23) | 0.002 | 25 |
| Red lentils | 0.79 ab (0.26) | 0.5 b (0.22) | 0.005 | 36.71 |
| Noodles | 0.94 ab (0.53) | 0.68 ab (0.38) | 0.23 | 27.66 |
| Hake fish | 0.76 ab (0.07) | 0.57 ab (0.13) | 0.0001 | 25 |
| Cauliflower | 0.77 ab (0.20) | 0.56 ab (0.28) | 0.067 | 27.27 |
| Broccoli | 0.9 ab (0.23) | 0.65 ab (0.25) | 0.013 | 21.11 |
| SI Parameters | Oral-Processing Sensitive | Oral-Processing Resistant | p-Values * |
|---|---|---|---|
| Mean (SD) | Mean (SD) | ||
| Viscosity (mPa·s) | 1287.24 (419.55) | 941.01 (110.45) | 0.001 |
| Maximum force (N) | 0.52 (0.14) | 0.48 (0.07) | 0.02 |
| Cohesiveness | 0.74 (0.02) | 0.77 (0.03) | 0.0001 |
| Adhesiveness (N·s) | 0.61 (0.12) | 0.64 (0.07) | 0.6 |
| SI Parameters | Viscosity Pre-Oral 300 s−1 | Maximum Force Pre-Oral | Cohesiveness Pre-Oral | Adhesiveness Pre-Oral |
|---|---|---|---|---|
| Viscosity pre-oral 50 s−1 (p-value) | 0.49 (<0.0001) | 0.13 (0.11) | −0.25 (0.001) | −0.04 (0.59) |
| Viscosity pre-oral at 300 s−1 (p-value) | 0.28 (0.0004) | −0.53 (<0.0001) | −0.09 (0.23) | |
| Maximum force pre-oral (p-value) | −0.54 (<0.0001) | 0.37 (<0.0001) | ||
| Cohesiveness pre-oral (p-value) | 0.29 (0.0003) |
| SI Parameters | Viscosity Post Oral 300 s−1 | Maximum Force Post-Oral | Cohesiveness Post-Oral | Adhesiveness Post-Oral |
|---|---|---|---|---|
| Viscosity post-oral 50 s−1 (p-value) | 0.47 (<0.0001) | 0.29 (0.0003) | −0.42 (<0.0001) | −0.20 (0.013) |
| Viscosity Post-oral at 300 s−1 (p-value) | 0.18 (0.14) | −0.50 (<0.0001) | −0.05 (0.65) | |
| Maximum force post-oral (p-value) | −0.50 (<0.0001) | 0.64 (<0.0001) | ||
| Cohesiveness post-oral (p-value) | −0.07 (0.34) |
Disclaimer/Publisher’s Note: The statements, opinions and data contained in all publications are solely those of the individual author(s) and contributor(s) and not of MDPI and/or the editor(s). MDPI and/or the editor(s) disclaim responsibility for any injury to people or property resulting from any ideas, methods, instructions or products referred to in the content. |
© 2023 by the authors. Licensee MDPI, Basel, Switzerland. This article is an open access article distributed under the terms and conditions of the Creative Commons Attribution (CC BY) license (https://creativecommons.org/licenses/by/4.0/).
Share and Cite
Ismael-Mohammed, K.; Bolivar-Prados, M.; Laguna, L.; Clavé, P. Measuring the Rheological and Textural Properties of Thick Purees Used to Manage Patients with Swallowing Disorders. Nutrients 2023, 15, 3767. https://doi.org/10.3390/nu15173767
Ismael-Mohammed K, Bolivar-Prados M, Laguna L, Clavé P. Measuring the Rheological and Textural Properties of Thick Purees Used to Manage Patients with Swallowing Disorders. Nutrients. 2023; 15(17):3767. https://doi.org/10.3390/nu15173767
Chicago/Turabian StyleIsmael-Mohammed, Kovan, Mireia Bolivar-Prados, Laura Laguna, and Pere Clavé. 2023. "Measuring the Rheological and Textural Properties of Thick Purees Used to Manage Patients with Swallowing Disorders" Nutrients 15, no. 17: 3767. https://doi.org/10.3390/nu15173767