
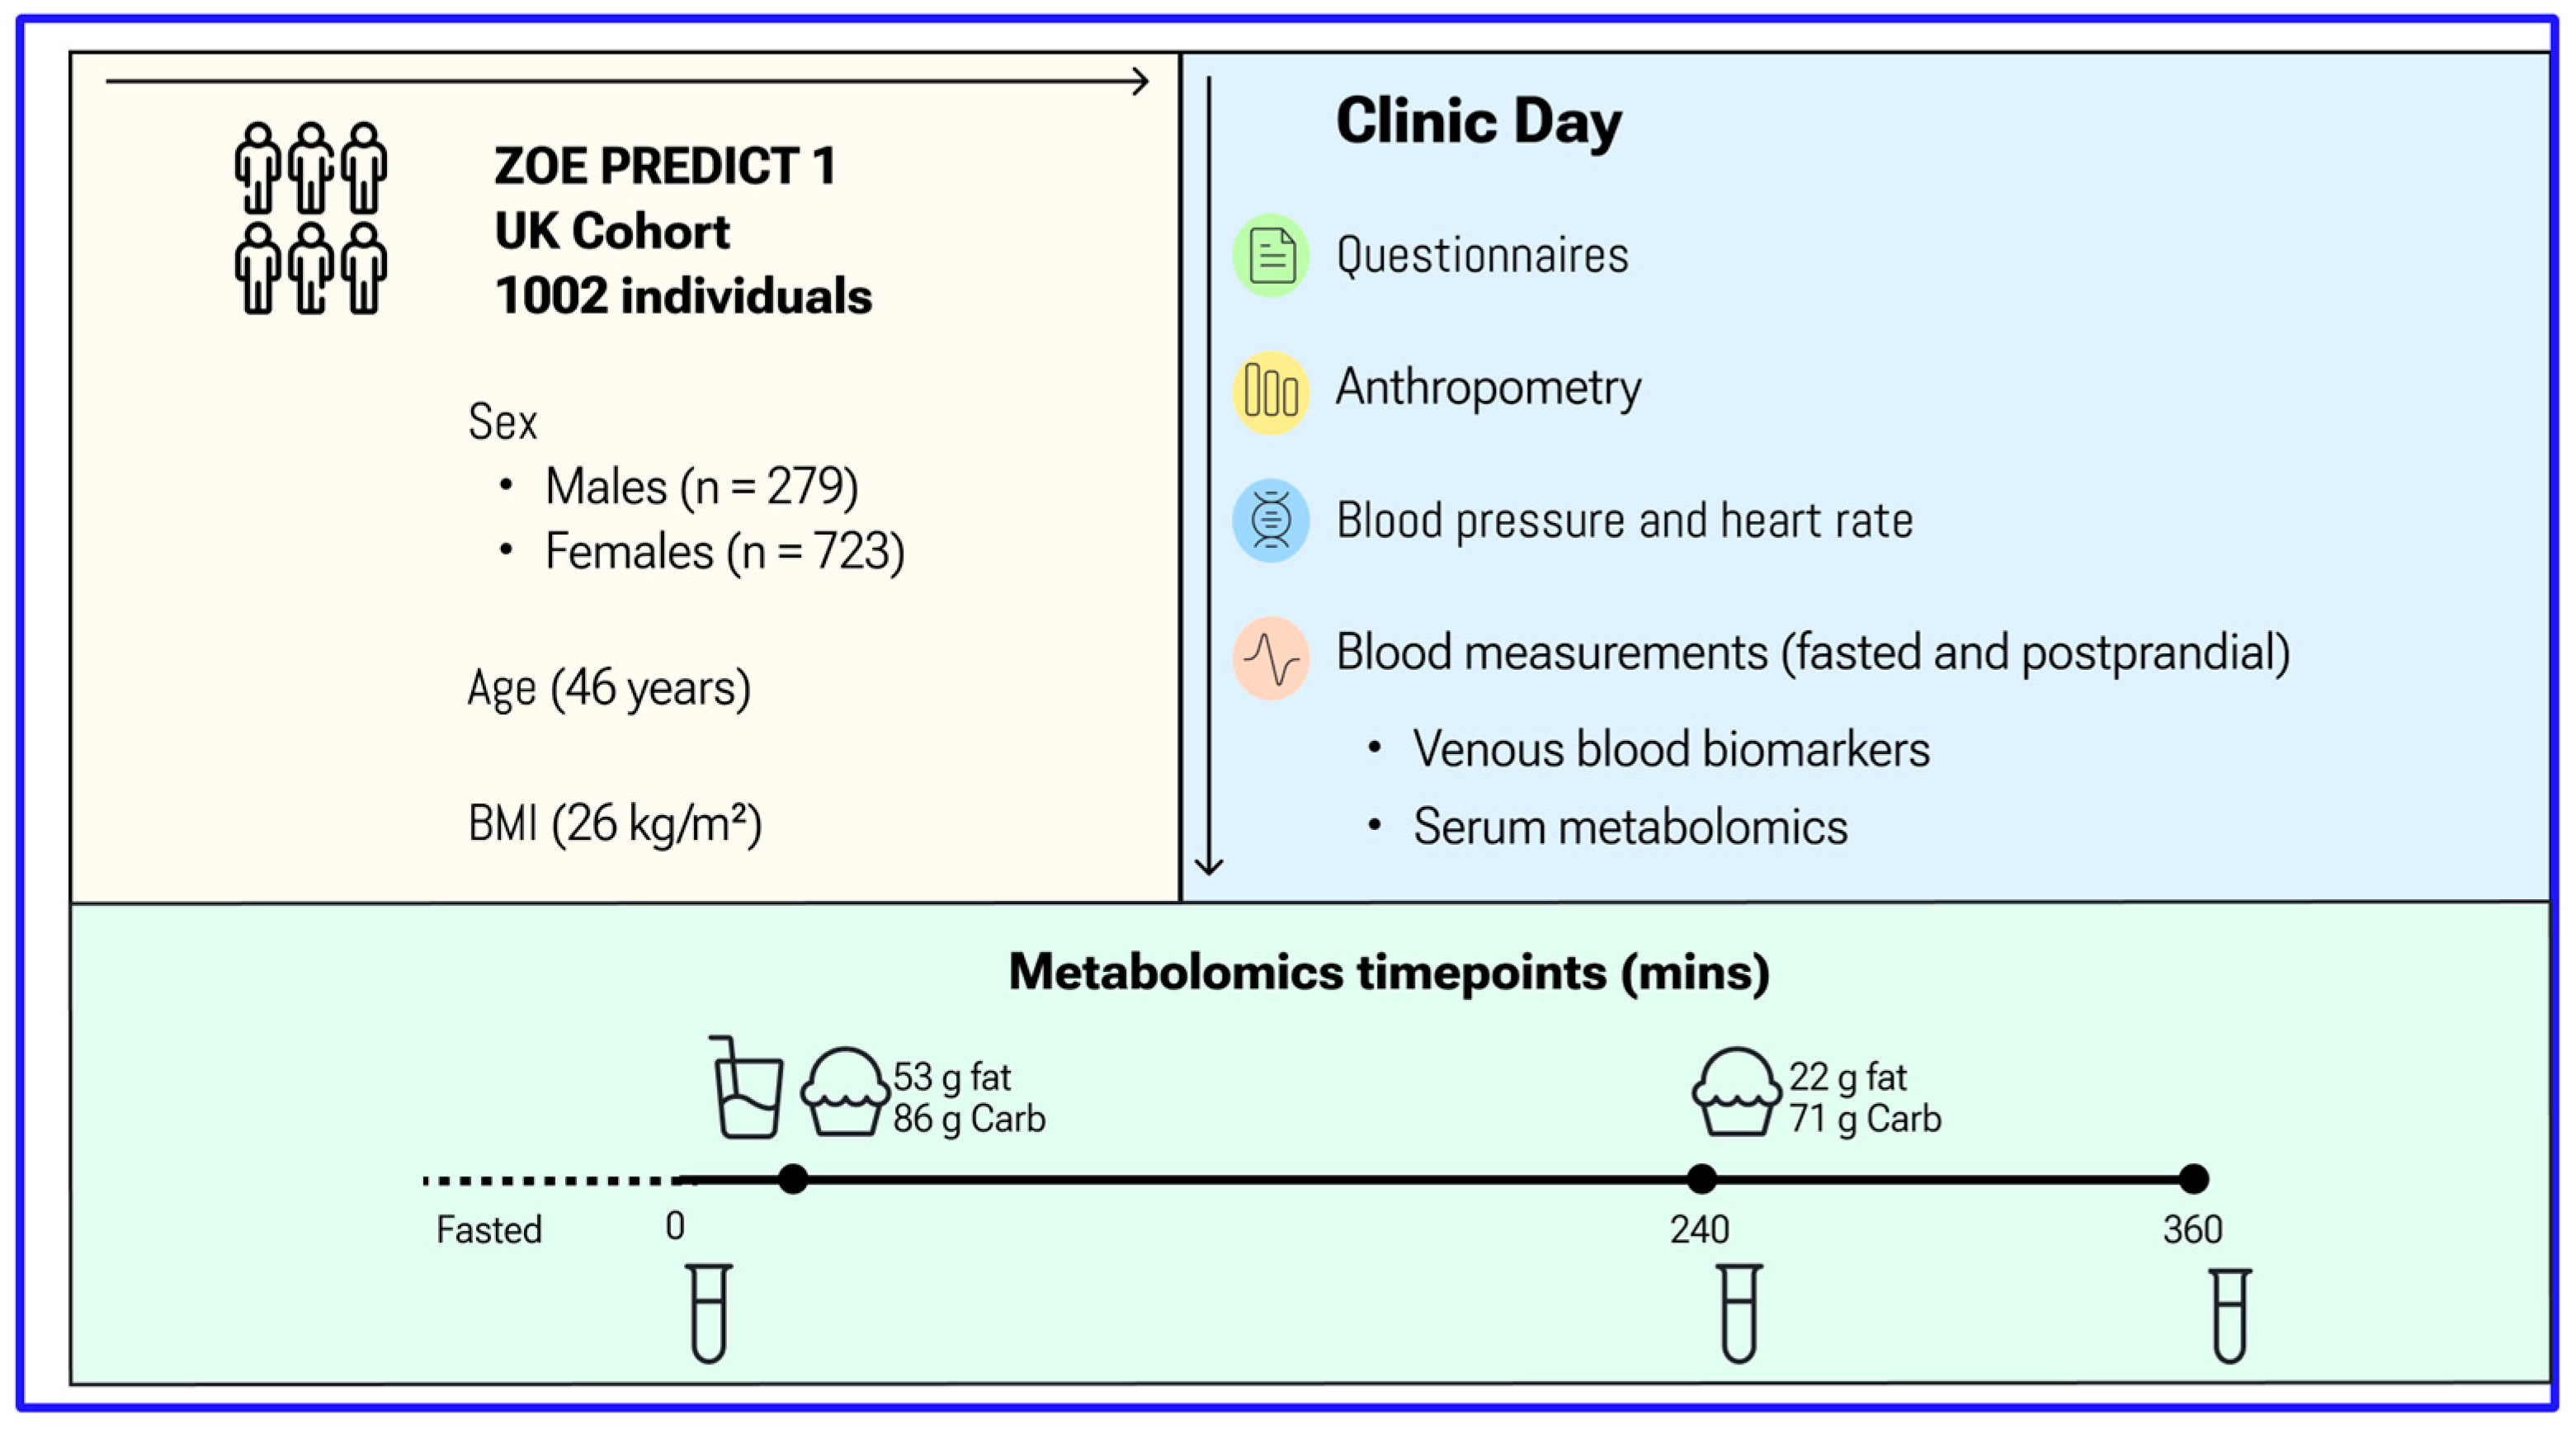
Characterisation of Fasting and Postprandial NMR Metabolites: Insights from the ZOE PREDICT 1 Study
 , ,
, ,
Abstract
:1. Introduction
2. Materials and Methods
3. Results
4. Discussion
Supplementary Materials
Author Contributions
Funding
Institutional Review Board Statement
Informed Consent Statement
Data Availability Statement
Conflicts of Interest
Abbreviations
| BCAA | branched-chain amino acids |
| C | cholesterol |
| CE | cholesterol ester |
| FC | free cholesterol |
| GlycA | glycoprotein acetyls |
| HDL | high-density lipoprotein |
| HOMA-IR | homeostatic model assessment for insulin resistance |
| IL-6 | interleukin-6 |
| LDL | low-density lipoprotein |
| ML | machine learning |
| MUFA | monounsaturated fatty acids |
| NMR | nuclear magnetic resonance spectroscopy |
| P | particles |
| PL | phospholipids |
| PUFA | polyunsaturated fatty acids |
| SFA | saturated fatty acids |
| TG | triacylglycerols |
| VLDL | very low-density lipoprotein |
| XXL | XL, L, M, S; extremely large, extra-large, large, medium, small |
References
- Deelen, J.; Kettunen, J.; Fischer, K.; van der Spek, A.; Trompet, S.; Kastenmüller, G.; Boyd, A.; Zierer, J.; van den Akker, E.B.; Ala-Korpela, M.; et al. A metabolic profile of all-cause mortality risk identified in an observational study of 44,168 individuals. Nat. Commun. 2019, 10, 3346. [Google Scholar] [CrossRef] [PubMed] [Green Version]
- Menni, C.; Fauman, E.; Erte, I.; Perry, J.R.; Kastenmüller, G.; Shin, S.Y.; Petersen, A.-K.; Hyde, C.; Psatha, M.; Ward, K.J.; et al. Biomarkers for type 2 diabetes and impaired fasting glucose using a nontargeted metabolomics approach. Diabetes 2013, 62, 4270–4276. [Google Scholar] [CrossRef] [PubMed] [Green Version]
- Menni, C.; Graham, D.; Kastenmüller, G.; Alharbi, N.H.; Alsanosi, S.M.; McBride, M.; Mangino, M.; Titcombe, P.; Shin, S.-Y.; Psatha, M.; et al. Metabolomic identification of a novel pathway of blood pressure regulation involving hexadecanedioate. Hypertension 2015, 66, 422–429. [Google Scholar] [CrossRef] [Green Version]
- Moayyeri, A.; Cheung, C.L.; Tan, K.C.; Morris, J.A.; Cerani, A.; Mohney, R.P.; Richards, J.B.; Hammond, C.; Spector, T.D.; Menni, C. Metabolomic Pathways to Osteoporosis in Middle-Aged Women: A Genome-Metabolome-Wide Mendelian Randomization Study. J. Bone Miner. Res. 2018, 33, 643–650. [Google Scholar] [CrossRef] [PubMed] [Green Version]
- Soininen, P.; Kangas, A.J.; Würtz, P.; Suna, T.; Ala-Korpela, M. Quantitative serum nuclear magnetic resonance metabolomics in cardiovascular epidemiology and genetics. Circ. Cardiovasc. Genet. 2015, 8, 192–206. [Google Scholar] [CrossRef] [PubMed] [Green Version]
- Ketema, E.B.; Kibret, K.T. Correlation of fasting and postprandial plasma glucose with HbA1c in assessing glycemic control; systematic review and meta-analysis. Arch. Public Health 2015, 73, 43. [Google Scholar] [CrossRef] [Green Version]
- Sciarrillo, C.M.; Koemel, N.A.; Keirns, B.H.; Banks, N.F.; Rogers, E.M.; Rosenkranz, S.K.; Kurti, S.P.; Jenkins, N.D.; Emerson, S.R. Who would benefit most from postprandial lipid screening? Clin. Nutr. 2021, 40, 4762–4771. [Google Scholar] [CrossRef]
- Kolovou, G.D.; Mikhailidis, D.P.; Kovar, J.; Lairon, D.; Nordestgaard, B.G.; Ooi, T.C.; Martínez, P.P.; Bilianou, H.; Anagnostopoulou, K.; Panotopoulos, G. Assessment and clinical relevance of non-fasting and postprandial triglycerides: An expert panel statement. Curr. Vasc. Pharmacol. 2011, 9, 258–270. [Google Scholar] [CrossRef]
- Blaak, E.E.; Antoine, J.M.; Benton, D.; Björck, I.; Bozzetto, L.; Brouns, F.; Diamant, M.; Dye, L.; Hulshof, T.; Holst, J.J.; et al. Impact of postprandial glycaemia on health and prevention of disease. Obes. Rev. 2021, 13, 923–984. [Google Scholar] [CrossRef] [Green Version]
- Berry, S.E.; Mills, C.E.; Harding, S.; Bruce, J.; Gray, R.; Bapir, M.; Le Roy, C.; Flottes, L.; Lim, D.; Hall, W. Lower postprandial lipemia after palmitic acid-rich fats with and without interesterification is associated with increased atherogenic lipoproteins versus a high MUFA oil (OR19-03-19). Curr. Dev. Nutr. 2019, 3, nzz046.OR19-03-19. [Google Scholar] [CrossRef] [Green Version]
- Berry, S.E.; Valdes, A.M.; Davies, R.; Al Khatib, H.; Delahanty, L.; Drew, D.A.; Chan, A.T.; Segata, N.; Franks, P.; Spector, T. Large inter-individual variation in postprandiallLipemia following a mixed meal in over 1000 twins and singletons from the UK and US: The PREDICT I study (OR19-06-19). Curr. Dev. Nutr. 2019, 3, nzz046.OR19-06-19. [Google Scholar] [CrossRef]
- Wildberg, C.; Masuch, A.; Budde, K.; Kastenmüller, G.; Artati, A.; Rathmann, W.; Adamski, J.; Kocher, T.; Völzke, H.; Nauck, M.; et al. Plasma metabolomics to identify and stratify patients with impaired glucose tolerance. J. Clin. Endocrinol. Metab. 2019, 104, 6357–6370. [Google Scholar] [CrossRef] [PubMed]
- Asnicar, A.; Berry, S.E.; Valdes, A.M.; Nguyen, L.H.; Piccinno, G.; Drew, D.A.; Leeming, E.; Gibson, R.; Le Roy, C.; Al Khatib, H.; et al. Microbiome connections with host metabolism and habitual diet from 1098 deeply phenotyped individuals. Nat. Med. 2021, 27, 321–332. [Google Scholar] [CrossRef]
- Berry, S.E.; Valdes, A.M.; Drew, D.A.; Asnicar, F.; Mazidi, M.; Wolf, J.; Capdevila, J.; Hadjigeorgiou, G.; Davies, R.; Al Khatib, H.; et al. Human postprandial responses to food and potential for precision nutrition. Nat. Med. 2020, 26, 964–973. [Google Scholar] [CrossRef]
- Berry, S.; Drew, D.A.; Linenberg, I.; Wolf, J.; Hadjigeorgiou, G.; Davies, R.; Khatib, H.A.; Hart, D.; Surdulescu, G.; Yarand, D.; et al. Personalised REsponses to DIetary Composition Trial (PREDICT): An intervention study to determine inter-individual differences in postprandial response to foods. Protoc. Exch. 2020. [Google Scholar] [CrossRef] [Green Version]
- Moayyeri, A.; Hammond, C.J.; Hart, D.J.; Spector, T.D. The UK Adult Twin Registry (TwinsUK Resource). Twin Res. Hum. Genet. 2013, 16, 144–149. [Google Scholar] [CrossRef] [PubMed] [Green Version]
- Mazidi, M.; Valdes, A.M.; Ordovas, J.M.; Hall, W.L.; Pujol, J.C.; Wolf, J.; Hadjigeorgiou, G.; Segata, N.; Sattar, N.; Koivula, R.; et al. Meal-induced inflammation: Postprandial insights from the Personalised REsponses to DIetary Composition Trial (PREDICT) study in 1000 participants. Am. J. Clin. Nutr. 2021, 114, 1028–1038. [Google Scholar] [CrossRef] [PubMed]
- Würtz, P.; Havulinna, A.S.; Soininen, P.; Tynkkynen, T.; Prieto-Merino, D.; Tillin, T.; Ghorbani, A.; Artati, A.; Wang, Q.; Tiainen, M.; et al. Metabolite profiling and cardiovascular event risk: A prospective study of 3 population based cohorts. Circulation 2015, 131, 774–785. [Google Scholar] [CrossRef] [Green Version]
- Mulligan, A.A.; Luben, R.N.; Bhaniani, A.; Parry-Smith, D.J.; O’Connor, L.; Khawaja, A.P.; Forouhi, N.G.; Khaw, K.T. A new tool for converting food frequency questionnaire data into nutrient and food group values: FETA research methods and availability. BMJ Open 2014, 4, e004503. [Google Scholar] [CrossRef] [Green Version]
- Krebs-Smith, S.M.; Pannucci, T.E.; Subar, A.F.; Kirkpatrick, S.I.; Lerman, J.L.; Tooze, J.A.; Wilson, M.M.; Reedy, J. Update of the Healthy Eating Index: HEI-2015. J. Acad. Nutr. Diet. 2018, 118, 1591–1602. [Google Scholar] [CrossRef] [Green Version]
- Sampson, J.N.; Boca, S.M.; Shu, X.O.; Stolzenberg-Solomon, R.Z.; Matthews, C.E.; Hsing, A.W.; Tan, Y.T.; Ji, B.-T.; Chow, W.-H.; Cai, Q.; et al. Metabolomics in epidemiology: Sources of variability in metabolite measurements and implications. Cancer Epidemiol. Biomark. Prev. 2013, 22, 631–640. [Google Scholar] [CrossRef] [Green Version]
- Floegel, A.; Drogan, D.; Wang-Sattler, R.; Prehn, C.; Illig, T.; Adamski, J.; Joost, H.-G.; Boeing, H.; Pischon, T. Reliability of serum metabolite concentrations over a 4-month period using a targeted metabolomic approach. PLoS ONE 2011, 6, e21103. [Google Scholar] [CrossRef] [PubMed]
- Benjamini, Y.; Hochberg, Y. Controlling the false discovery rate: A practical and powerful approach to multiple testing. J. Royal Stat. Soc. Ser. B Methodol. 1995, 57, 289–300. [Google Scholar] [CrossRef]
- Wallace, M.; Hashim, Y.Y.; Wingfield, M.; Culliton, M.; McAuliffe, F.; Gibney, M.J.; Brennan, L. Effects of menstrual cycle phase on metabolomic profiles in premenopausal women. Hum. Reprod. 2010, 25, 949–956. [Google Scholar] [CrossRef] [PubMed] [Green Version]
- Nicholson, G.; Rantalainen, M.; Maher, A.D.; Li, J.V.; Malmodin, D.; Ahmadi, K.R.; Faber, J.H.; Hallgrímsdóttir, I.B.; Barrett, A.; Toft, H.; et al. Human metabolic profiles are stably controlled by genetic and environmental variation. Mol. Syst. Biol. 2011, 7, 525. [Google Scholar] [CrossRef] [PubMed]
- Carayol, M.; Licaj, I.; Achaintre, D.; Sacerdote, C.; Vineis, P.; Key, T.J.; Moret, N.C.O.; Scalbert, A.; Rinaldi, S.; Ferrari, P. Reliability of serum metabolites over a two-year period: A targeted metabolomic approach in fasting and non-fasting samples from EPIC. PLoS ONE 2015, 10, e0135437. [Google Scholar] [CrossRef] [PubMed] [Green Version]
- Wojczynski, M.K.; Glasser, S.P.; Oberman, A.; Kabagambe, E.K.; Hopkins, P.N.; Tsai, M.Y.; Straka, R.J.; Ordovas, J.M.; Arnett, D.K. High-fat meal effect on LDL, HDL, and VLDL particle size and number in the Genetics of Lipid-Lowering drugs and diet network (GOLDN): An interventional study. Lipids Health Dis. 2011, 10, 181. [Google Scholar] [CrossRef] [Green Version]
- Hansson, P.; Holven, K.B.; Øyri, L.K.; Brekke, H.K.; Biong, A.S.; Gjevestad, G.O.; Raza, G.S.; Herzig, K.-H.; Thoresen, M.; Ulven, S.M. Meals with similar fat content from different dairy products induce different postprandial triglyceride responses in healthy adults: A randomized controlled cross-over trial. J. Nutr. 2019, 149, 422–431. [Google Scholar] [CrossRef] [Green Version]
- Parvaresh Rizi, E.; Baig, S.; Loh, T.P.; Toh, S.A.; Khoo, C.M.; Tai, E.S. Two-hour postprandial lipoprotein particle concentration differs between lean and obese individuals. Front. Physiol. 2019, 10, 856. [Google Scholar] [CrossRef] [Green Version]
- Farukhi, Z.M.; Demler, O.V.; Caulfield, M.P.; Kulkarni, K.; Wohlgemuth, J.; Cobble, M.; Luttmann-Gibson, H.; Li, C.; Nelson, J.R.; Cook, N.R.; et al. Comparison of nonfasting and fasting lipoprotein subfractions and size in 15,397 apparently healthy individuals: An analysis from the VITamin D and OmegA-3 TriaL. J. Clin. Lipidol. 2020, 14, 241–251. [Google Scholar] [CrossRef]
- Smy, L.; De Biase, I.; Genzen, J.R.; Yuzyuk, T. The nuclear magnetic resonance metabolic profile: Impact of fasting status. Clin. Biochem. 2021, 87, 85–92. [Google Scholar] [CrossRef]
- Shah, M.; Jaffery, M.; Adams-Huet, B.; Franklin, B.; Oliver, J.; Mitchell, J. Effect of meal composition on postprandial lipid concentrations and lipoprotein particle numbers: A randomized cross-over study. PLoS ONE 2017, 12, e0172732. [Google Scholar] [CrossRef] [PubMed] [Green Version]
- Xiao, Q.; Moore, S.C.; Boca, S.M.; Matthews, C.E.; Rothman, N.; Stolzenberg-Solomon, R.Z.; Sinha, R.; Cross, A.J.; Sampson, J.N. Sources of variability in metabolite measurements from urinary samples. PLoS ONE 2014, 9, e95749. [Google Scholar] [CrossRef] [PubMed]
- Secor, S.M. Specific dynamic action: A review of the postprandial metabolic response. J. Comp. Physiol. B 2009, 179, 1–56. [Google Scholar] [CrossRef]
- Chowdhury, E.A.; Richardson, J.D.; Tsintzas, K.; Thompson, D.; Betts, J.A. Carbohydrate-rich breakfast attenuates glycaemic, insulinaemic and ghrelin response to ad libitum lunch relative to morning fasting in lean adults. Br. J. Nutr. 2015, 114, 98–107. [Google Scholar] [CrossRef] [PubMed] [Green Version]
- Chowdhury, E.A.; Richardson, J.D.; Tsintzas, K.; Thompson, D.; Betts, J.A. Effect of extended morning fasting upon ad libitum lunch intake and associated metabolic and hormonal responses in obese adults. Int. J. Obes. 2016, 40, 305–311. [Google Scholar] [CrossRef] [PubMed] [Green Version]
- Burdge, G.C.; Jones, A.E.; Frye, S.M.; Goodson, L.; Wootton, S.A. Effect of meal sequence on postprandial lipid, glucose and insulin responses in young men. Eur. J. Clin. Nutr. 2003, 57, 1536–1544. [Google Scholar] [CrossRef] [PubMed]
- Sarwar, N.; Danesh, J.; Eiriksdottir, G.; Sigurdsson, G.; Wareham, N.; Bingham, S.; Boekholdt, S.M.; Khaw, K.-T.; Gudnason, V. Triglycerides and the risk of coronary heart disease: 10,158 incident cases among 262,525 participants in 29 Western prospective studies. Circulation 2007, 115, 450–458. [Google Scholar] [CrossRef] [PubMed]
- Johansen, M.Ø.; Nielsen, S.F.; Afzal, S.; Vedel-Krogh, S.; Smith, G.D.; Nordestgaard, B.G. Very low-density lipoprotein cholesterol may mediate a substantial component of the effect of obesity on myocardial infarction risk: The Copenhagen General Population Study. Clin. Chem. 2021, 67, 276–287. [Google Scholar] [CrossRef]
- Karpe, F.; Hellénius, M.L.; Hamsten, A. Differences in postprandial concentrations of very-low-density lipoprotein and chylomicron remnants between normotriglyceridemic and hypertriglyceridemic men with and without coronary heart disease. Metabolism 1999, 48, 301–307. [Google Scholar] [CrossRef]
- Mills, C.E.; Harding, S.V.; Bapir, M.; Mandalari, G.; Salt, L.J.; Gray, R.; Fielding, B.A.; Wilde, P.J.; Hall, W.L.; Berry, S.E. Palmitic acid–rich oils with and without interesterification lower postprandial lipemia and increase atherogenic lipoproteins compared with a MUFA-rich oil: A randomized controlled trial. Am. J. Clin. Nutr. 2021, 113, 1221–1231. [Google Scholar] [CrossRef] [PubMed]
- Krauss, R.M.; Remaley, A.T.; Chapman, M.J. Concerns regarding NMR lipoprotein analyses performed on the Nightingale heath platform-Focus on LDL subclasses. J. Clin. Lipidol. 2022, 16, 250–252. [Google Scholar] [CrossRef] [PubMed]
- Tikkanen, E.; Jägerroos, V.; Holmes, M.V.; Sattar, N.; Ala-Korpela, M.; Jousilahti, P.; Lundqvist, A.; Perola, M.; Salomaa, V.; Würtz, P. Metabolic biomarker discovery for risk of peripheral artery disease compared with coronary artery disease: Lipoprotein and metabolite profiling of 31,657 individuals from 5 prospective cohorts. J. Am. Heart Assoc. 2021, 10, e021995. [Google Scholar] [CrossRef] [PubMed]
- Julkunen, H.; Cichońska, A.; Tiainen, M.; Koskela, H.; Nybo, K.; Mäkelä, V.; Nokso-Koivisto, J.; Kristiansson, K.; Perola, M.; Salomaa, V.; et al. Atlas of plasma nuclear magnetic resonance biomarkers for health and disease in 118,461 individuals from the UK Biobank. Nat. Commun. 2023, 14, 604. [Google Scholar] [CrossRef]


| Fasting | 4 h | 6 h | Fasting-6 h | ||||||||
|---|---|---|---|---|---|---|---|---|---|---|---|
| Median | 25th | 75th | Median 1 | 25th | 75th | Median 1 | 25th | 75th | p-Value 2 | ICC (95% CI) | |
| Cholesterol | |||||||||||
| Clinical LDL Cholesterol (mmol/L) | 2.842 | 2.349 | 3.409 | 2.66 *** | 2.183 | 3.227 | 2.56 *** | 2.096 | 3.032 | 0.08 | 0.96 (0.95, 0.96) |
| Total Cholesterol (mmol/L) | 4.984 | 4.405 | 5.621 | 4.83 *** | 4.287 | 5.478 | 4.72 *** | 4.190 | 5.355 | 0.17 | 0.95 (0.95, 0.96) |
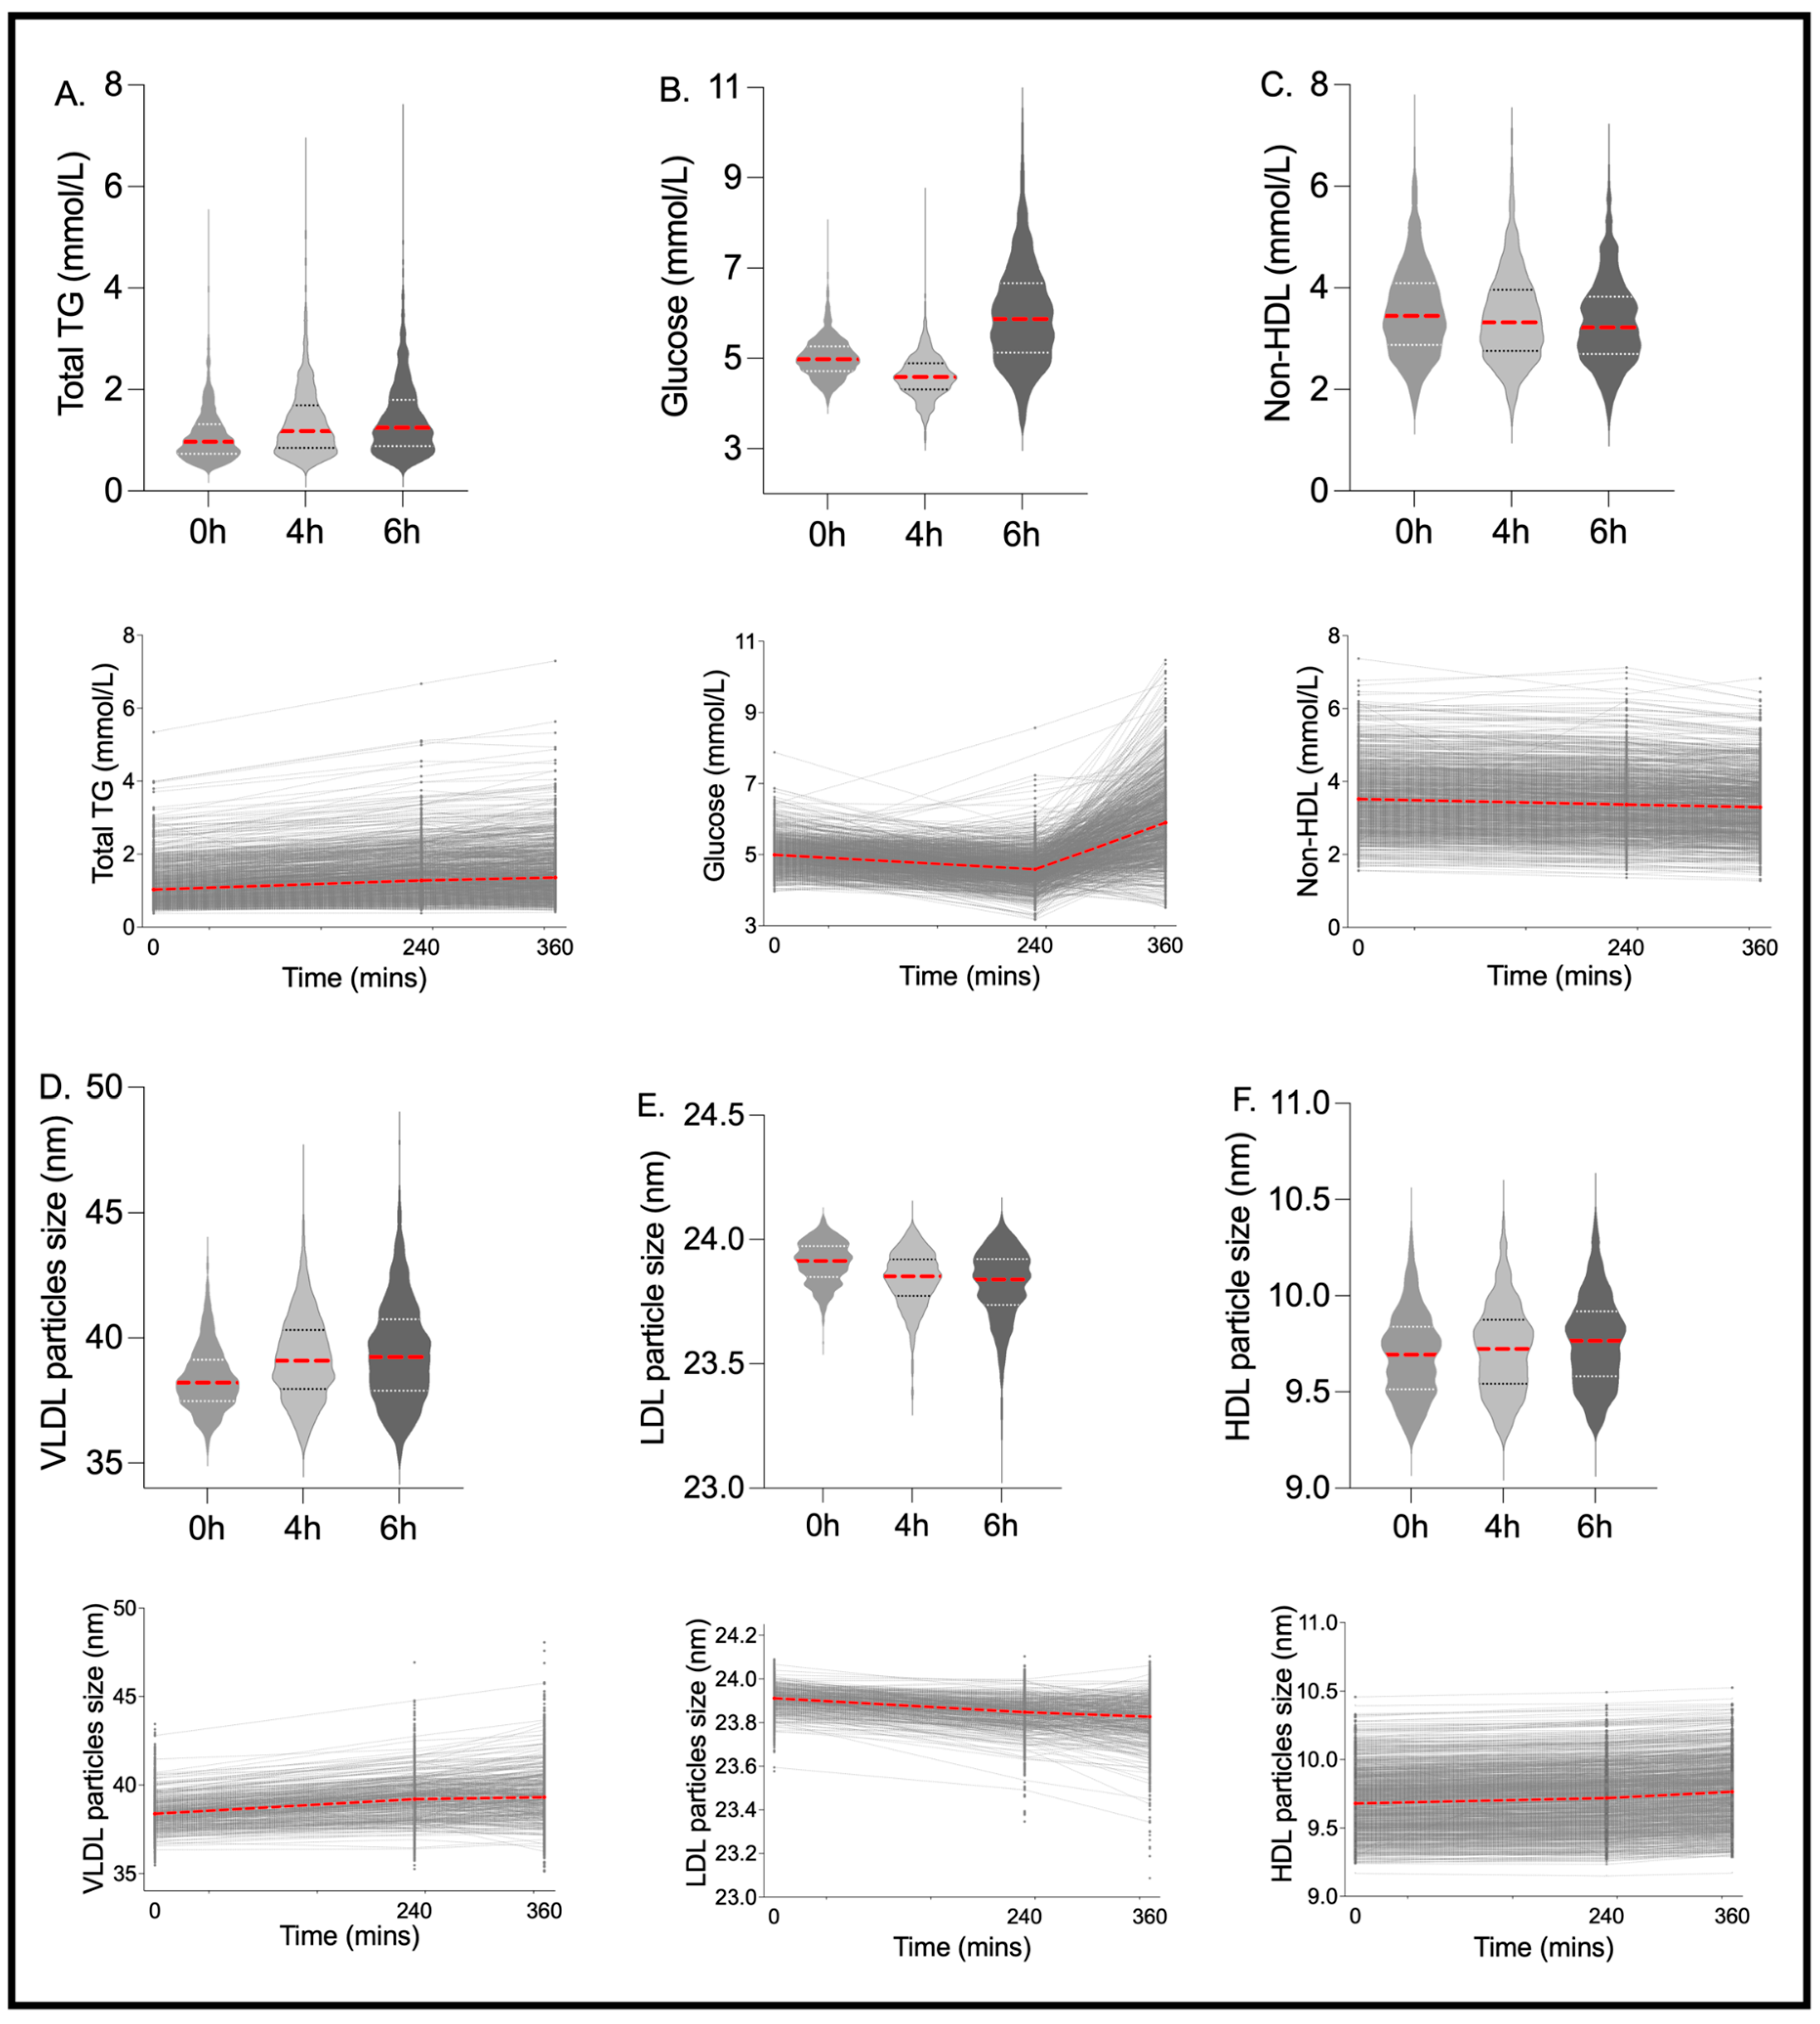
| Non-HDL Cholesterol (mmol/L) | 3.449 | 2.878 | 4.095 | 3.32 ** | 2.759 | 3.955 | 3.22 *** | 2.706 | 3.822 | 0.25 | 0.96 (0.96, 0.97) |
| Remnant Cholesterol (mmol/L) | 1.495 | 1.245 | 1.779 | 1.50 | 1.245 | 1.789 | 1.48 | 1.239 | 1.770 | 0.97 | 0.96 (0.96, 0.96) |
| VLDL Cholesterol (mmol/L) | 0.607 | 0.463 | 0.788 | 0.66 *** | 0.491 | 0.842 | 0.64 *** | 0.489 | 0.853 | 0.00 ** | 0.95 (0.94, 0.95) |
| LDL Cholesterol (mmol/L) | 1.945 | 1.622 | 2.317 | 1.83 *** | 1.512 | 2.174 | 1.75 *** | 1.458 | 2.060 | 0.03 * | 0.96 (0.95, 0.96) |
| HDL Cholesterol (mmol/L) | 1.506 | 1.284 | 1.743 | 1.46* | 1.247 | 1.696 | 1.46 ** | 1.248 | 1.673 | 0.32 | 0.96 (0.96, 0.97) |
| Triglycerides | |||||||||||
| Total Triglycerides (mmol/L) | 0.971 | 0.737 | 1.318 | 1.18 *** | 0.851 | 1.690 | 1.25 *** | 0.883 | 1.797 | 0.00 *** | 0.90 (0.89, 0.91) |
| Triglycerides in VLDL (mmol/L) | 0.647 | 0.442 | 0.948 | 0.84 *** | 0.545 | 1.299 | 0.89 *** | 0.564 | 1.394 | 0.00 *** | 0.89 (0.88, 0.90) |
| Triglycerides in LDL (mmol/L) | 0.134 | 0.115 | 0.156 | 0.14 * | 0.120 | 0.161 | 0.14 *** | 0.122 | 0.165 | 0.19 | 0.93 (0.92, 0.94) |
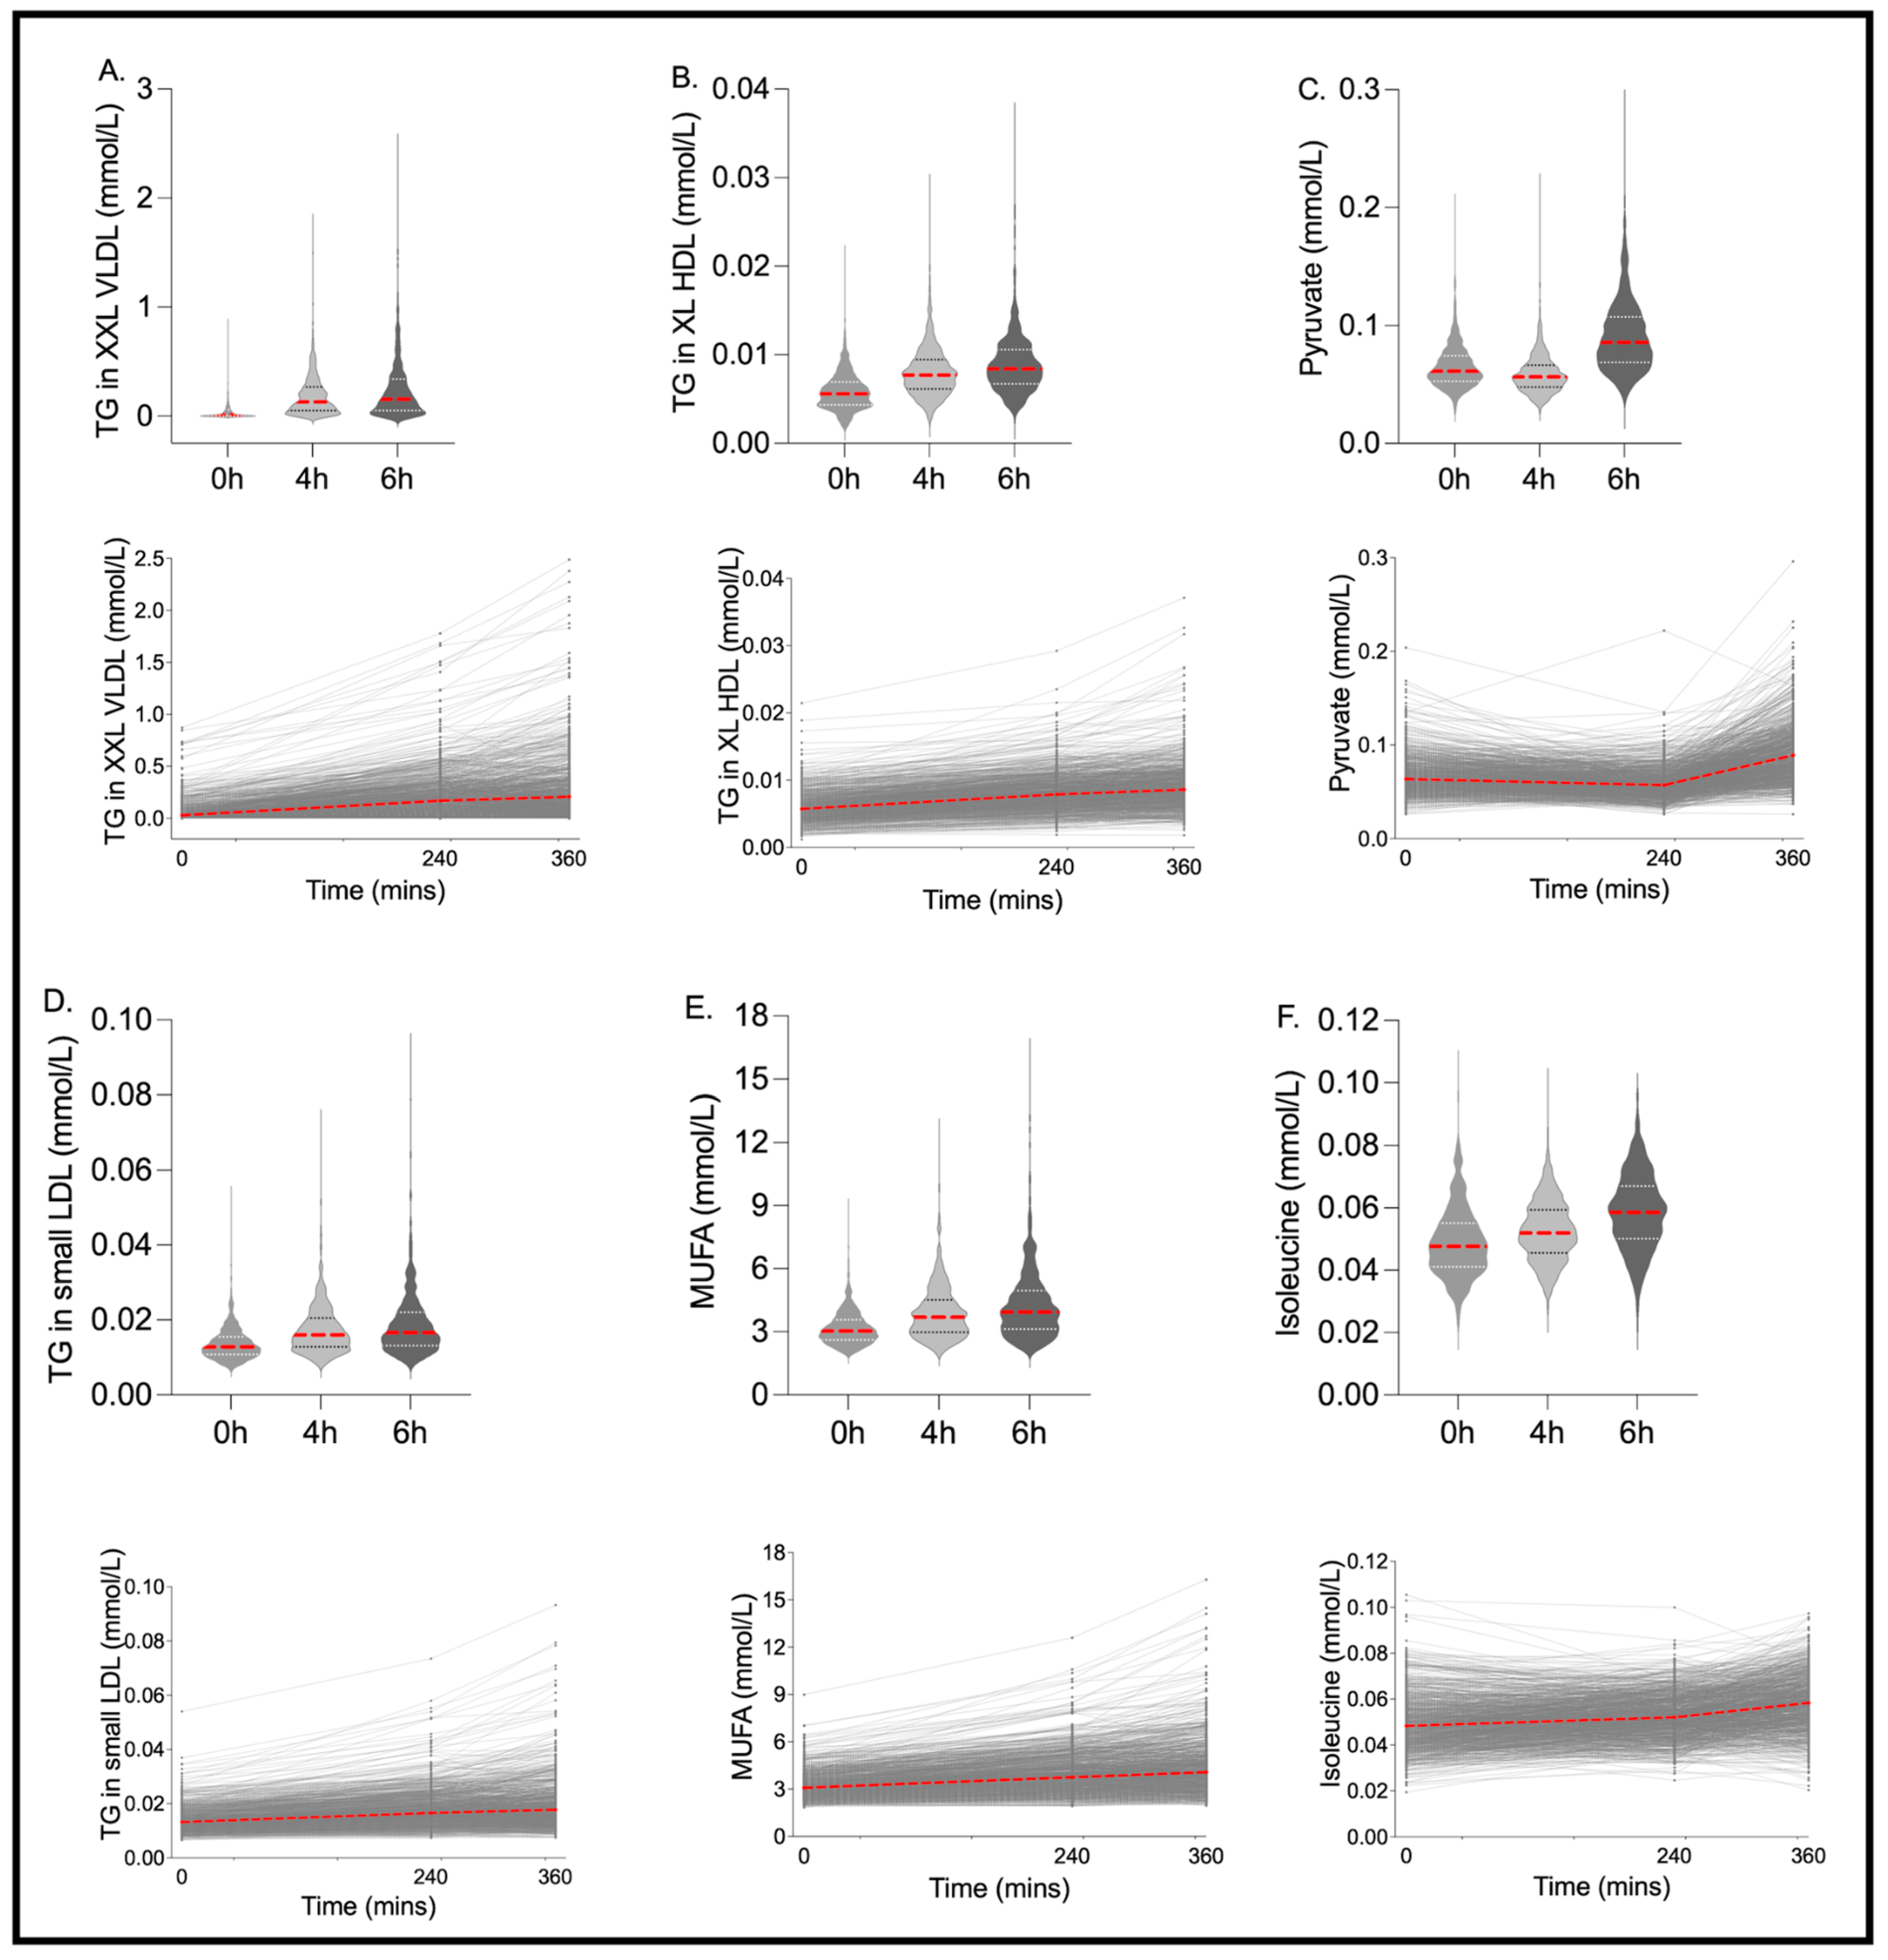
| Triglycerides in HDL (mmol/L) | 0.098 | 0.077 | 0.124 | 0.12 *** | 0.091 | 0.144 | 0.13 *** | 0.101 | 0.157 | 0.00 ** | 0.92 (0.92, 0.93) |
| Phospholipids | |||||||||||
| Total Phospholipids in Lipoprotein Particles (mmol/L) | 2.965 | 2.682 | 3.267 | 2.97 | 2.707 | 3.274 | 2.98 | 2.721 | 3.286 | 0.71 | 0.94 (0.94, 0.95) |
| Phospholipids in VLDL (mmol/L) | 0.373 | 0.276 | 0.496 | 0.43 *** | 0.307 | 0.580 | 0.44 *** | 0.306 | 0.601 | 0.00 *** | 0.93 (0.92, 0.93) |
| Phospholipids in LDL (mmol/L) | 0.668 | 0.568 | 0.778 | 0.63 *** | 0.541 | 0.737 | 0.61 *** | 0.519 | 0.707 | 0.09 | 0.96 (0.95, 0.96) |
| Phospholipids in HDL (mmol/L) | 1.579 | 1.372 | 1.794 | 1.58 | 1.385 | 1.794 | 1.60 | 1.417 | 1.816 | 0.19 | 0.96 (0.96, 0.96) |
| Total Lipids | |||||||||||
| Total Lipids in Lipoprotein Particles (mmol/L) | 9.060 | 8.039 | 10.142 | 9.08 | 8.086 | 10.283 | 9.11 | 8.012 | 10.281 | 0.07 | 0.94 (0.94, 0.95) |
| Total Lipids in VLDL (mmol/L) | 1.623 | 1.208 | 2.205 | 1.94 *** | 1.368 | 2.681 | 1.99 *** | 1.368 | 2.804 | 0.00 *** | 0.91 (0.90, 0.92) |
| Total Lipids in LDL (mmol/L) | 2.748 | 2.310 | 3.241 | 2.61 *** | 2.188 | 3.063 | 2.50 *** | 2.109 | 2.915 | 0.06 | 0.96 (0.95, 0.96) |
| Total Lipids in HDL (mmol/L) | 3.188 | 2.759 | 3.635 | 3.15 | 2.749 | 3.598 | 3.19 | 2.790 | 3.626 | 0.23 | 0.96 (0.96, 0.97) |
| Lipoprotein Particle Concentrations | |||||||||||
| Total Concentration of Lipoprotein Particles (mmol/L) | 0.018 | 0.017 | 0.020 | 0.02 *** | 0.016 | 0.019 | 0.02 *** | 0.016 | 0.019 | 0.00 ** | 0.92 (0.91, 0.92) |
| Concentration of VLDL Particles (mmol/L) | 0.000 | 0.000 | 0.000 | 0.00 ** | 0.000 | 0.000 | 0.00 ** | 0.000 | 0.000 | 0.43 | 0.96 (0.95, 0.96) |
| Concentration of LDL Particles (mmol/L) | 0.001 | 0.001 | 0.001 | 0.00 *** | 0.001 | 0.001 | 0.00 *** | 0.001 | 0.001 | 0.24 | 0.97 (0.96, 0.97) |
| Concentration of HDL Particles (mmol/L) | 0.016 | 0.015 | 0.018 | 0.02 *** | 0.015 | 0.017 | 0.02 *** | 0.014 | 0.017 | 0.00 ** | 0.92 (0.91, 0.93) |
| Lipoprotein Particle Sizes | |||||||||||
| Average Diameter for VLDL Particles (nm) | 38.22 | 37.47 | 39.13 | 39.08 *** | 37.96 | 40.32 | 39.23 *** | 37.894 | 40.732 | 0.00 *** | 0.83 (0.82, 0.85) |
| Average Diameter for LDL Particles (nm) | 23.92 | 23.85 | 23.97 | 23.85 *** | 23.77 | 23.92 | 23.84 *** | 23.738 | 23.922 | 0.00 *** | 0.53 (0.49, 0.56) |
| Average Diameter for HDL Particles (nm) | 9.694 | 9.515 | 9.838 | 9.72 ** | 9.543 | 9.875 | 9.77 *** | 9.582 | 9.918 | 0.11 | 0.98 (0.98, 0.98) |
| Other Lipids | |||||||||||
| Phosphoglycerides (mmol/L) | 2.528 | 2.299 | 2.771 | 2.54 | 2.311 | 2.787 | 2.57 ** | 2.351 | 2.824 | 0.57 | 0.93 (0.93, 0.94) |
| Ratio of Triglycerides to Phosphoglycerides | 0.382 | 0.300 | 0.510 | 0.47 *** | 0.354 | 0.641 | 0.49 *** | 0.359 | 0.689 | 0.00 *** | 0.90 (0.89, 0.91) |
| Total Choline’s (mmol/L) | 2.872 | 2.629 | 3.130 | 2.86 | 2.636 | 3.127 | 2.87 | 2.654 | 3.137 | 0.39 | 0.93 (0.92, 0.94) |
| Phosphatidylcholines (mmol/L) | 2.374 | 2.146 | 2.613 | 2.42 ** | 2.189 | 2.661 | 2.47 *** | 2.242 | 2.709 | 0.72 | 0.94 (0.94, 0.95) |
| Sphingomyelins (mmol/L) | 0.493 | 0.447 | 0.540 | 0.47 *** | 0.431 | 0.523 | 0.46 *** | 0.423 | 0.509 | 0.22 | 0.92 (0.92, 0.93) |
| Apolipoproteins | |||||||||||
| Apolipoprotein B (g/L) | 0.870 | 0.727 | 1.023 | 0.84 * | 0.712 | 0.994 | 0.83 *** | 0.697 | 0.977 | 0.43 | 0.97 (0.96, 0.97) |
| Apolipoprotein A1 (g/L) | 1.534 | 1.374 | 1.685 | 1.50 * | 1.362 | 1.669 | 1.50 * | 1.366 | 1.652 | 0.09 | 0.95 (0.94, 0.95) |
| Ratio of Apolipoprotein B to Apolipoprotein A1 | 0.565 | 0.455 | 0.691 | 0.55 | 0.453 | 0.687 | 0.54* | 0.446 | 0.675 | 0.43 | 0.96 (0.96, 0.97) |
| Fatty Acids | |||||||||||
| Total Fatty Acids (mmol/L) | 12.63 | 11.28 | 14.21 | 13.50 *** | 11.79 | 15.44 | 13.80 *** | 11.903 | 15.852 | 0.00 *** | 0.84 (0.82, 0.85) |
| Omega-3 Fatty Acids (mmol/L) | 0.536 | 0.425 | 0.661 | 0.57 ** | 0.447 | 0.685 | 0.57 ** | 0.450 | 0.685 | 0.64 | 0.96 (0.95, 0.96) |
| Omega-6 Fatty Acids (mmol/L) | 5.094 | 4.660 | 5.555 | 5.29 *** | 4.805 | 5.837 | 5.35 *** | 4.835 | 5.956 | 0.00 *** | 0.81 (0.79, 0.83) |
| MUFA (mmol/L) | 3.035 | 2.610 | 3.569 | 3.69 *** | 2.985 | 4.517 | 3.95 *** | 3.132 | 4.948 | 0.00 *** | 0.74 (0.72, 0.76) |
| SFA (mmol/L) | 3.915 | 3.494 | 4.480 | 3.90 | 3.447 | 4.492 | 3.87 | 3.383 | 4.453 | 0.09 | 0.93 (0.93, 0.94) |
| Amino Acids | |||||||||||
| Alanine (mmol/L) | 0.324 | 0.289 | 0.363 | 0.35 *** | 0.317 | 0.389 | 0.39 *** | 0.340 | 0.440 | 0.00 *** | 0.64 (0.61, 0.66) |
| Glutamine (mmol/L) | 0.726 | 0.675 | 0.772 | 0.70 *** | 0.651 | 0.747 | 0.70 *** | 0.653 | 0.754 | 0.38 | 0.78 (0.76, 0.80) |
| Glycine (mmol/L) | 0.251 | 0.219 | 0.300 | 0.23 *** | 0.199 | 0.272 | 0.23 *** | 0.191 | 0.272 | 0.99 | 0.92 (0.91, 0.93) |
| Histidine (mmol/L) | 0.077 | 0.071 | 0.082 | 0.08 *** | 0.069 | 0.080 | 0.07 *** | 0.068 | 0.079 | 0.73 | 0.61 (0.58, 0.64) |
| Branched-Chain Amino Acids | |||||||||||
| Total BCAA (mmol/L) | 0.375 | 0.335 | 0.424 | 0.37 * | 0.336 | 0.410 | 0.38 | 0.337 | 0.427 | 0.52 | 0.72 (0.70, 0.75) |
| Isoleucine (mmol/L) | 0.048 | 0.041 | 0.055 | 0.05 *** | 0.046 | 0.059 | 0.06 *** | 0.050 | 0.067 | 0.00 ** | 0.51 (0.47, 0.54) |
| Leucine (mmol/L) | 0.110 | 0.097 | 0.125 | 0.10 *** | 0.093 | 0.116 | 0.10 *** | 0.089 | 0.120 | 0.55 | 0.66 (0.63, 0.69) |
| Valine (mmol/L) | 0.218 | 0.196 | 0.244 | 0.21 ** | 0.196 | 0.235 | 0.22 | 0.198 | 0.242 | 0.00 ** | 0.81 (0.79, 0.83) |
| Aromatic Amino Acids | |||||||||||
| Phenylalanine (mmol/L) | 0.062 | 0.056 | 0.068 | 0.06 * | 0.056 | 0.067 | 0.07 *** | 0.060 | 0.072 | 0.95 | 0.60 (0.57, 0.63) |
| Tyrosine (mmol/L) | 0.055 | 0.049 | 0.063 | 0.05 ** | 0.048 | 0.061 | 0.05* | 0.048 | 0.061 | 0.52 | 0.68 (0.65, 0.71) |
| Glycolysis-Related Metabolites | |||||||||||
| Glucose (mmol/L) | 4.981 | 4.721 | 5.269 | 4.59 *** | 4.312 | 4.892 | 5.87 *** | 5.127 | 6.665 | 0.00 *** | 0.08 (0.04, 0.12) |
| Lactate (mmol/L) | 1.830 | 1.619 | 2.096 | 1.66 *** | 1.491 | 1.843 | 1.95 *** | 1.687 | 2.286 | 0.00 *** | 0.31 (0.27, 0.35) |
| Pyruvate (mmol/L) | 0.061 | 0.053 | 0.074 | 0.06 *** | 0.048 | 0.066 | 0.09 *** | 0.069 | 0.107 | 0.00 *** | 0.20 (0.17, 0.24) |
| Citrate (mmol/L) | 0.064 | 0.057 | 0.072 | 0.06 *** | 0.051 | 0.064 | 0.06 | 0.058 | 0.071 | 0.00 ** | 0.55 (0.52, 0.59) |
| Glycerol (mmol/L) | 0.105 | 0.086 | 0.129 | 0.10 *** | 0.076 | 0.124 | 0.10 *** | 0.082 | 0.123 | 0.07 | 0.56 (0.53, 0.59) |
| Ketone Bodies | |||||||||||
| Β-Hydroxybutyrate (mmol/L) | 0.113 | 0.054 | 0.221 | 0.07 *** | 0.032 | 0.121 | 0.01 *** | 0.004 | 0.028 | 0.00 *** | 0.22 (0.18, 0.26) |
| Acetate (mmol/L) | 0.028 | 0.021 | 0.038 | 0.02 *** | 0.015 | 0.028 | 0.02 *** | 0.012 | 0.024 | 0.00 *** | 0.34 (0.30, 0.38) |
| Acetoacetate (mmol/L) | 0.054 | 0.031 | 0.094 | 0.05 ** | 0.031 | 0.078 | 0.03 *** | 0.019 | 0.036 | 0.00 *** | 0.26 (0.22, 0.31) |
| Acetone (mmol/L) | 0.023 | 0.017 | 0.035 | 0.02 *** | 0.015 | 0.025 | 0.01 *** | 0.012 | 0.018 | 0.00 *** | 0.53 (0.50, 0.57) |
| Fluid Balance | |||||||||||
| Creatinine (mmol/L) | 71.800 | 64.967 | 81.013 | 65.51 *** | 59.092 | 73.864 | 65.57 *** | 59.065 | 74.096 | 0.18 | 0.79 (0.76, 0.80) |
| Albumin (g/L) | 41.887 | 39.853 | 44.043 | 40.86 *** | 39.140 | 42.835 | 39.87 *** | 38.045 | 41.614 | 0.00 ** | 0.76 (0.74, 0.79) |
| Inflammation | |||||||||||
| Glycoprotein Acetyls (mmol/L) | 0.845 | 0.779 | 0.917 | 0.83 *** | 0.754 | 0.899 | 0.81 *** | 0.742 | 0.883 | 0.79 | 0.93 (0.92, 0.93) |
| Lipoprotein Subclass Concentration | |||||||||||
| Extremely Large VLDL Particles (mmol/L) | 2.42 × 10⁻⁷ | 2.11 × 10⁻⁸ | 8.19 × 10⁻⁷ | 1.43 × 10⁻⁶ *** | 5.32 × 10⁻⁷ | 2.97 × 10⁻⁶ | 1.67 × 10⁻⁶ *** | 5.84 × 10⁻⁷ | 3.68 × 10⁻⁶ | 0.00 *** | 0.67 (0.64, 0.70) |
| Very Large VLDL Particles (mmol/L) | 2.12 × 10⁻⁶ | 1.12 × 10⁻⁶ | 3.58 × 10⁻⁶ | 2.93 × 10⁻⁶ *** | 1.54 × 10⁻⁶ | 5.12 × 10⁻⁶ | 3.24 × 10⁻⁶ *** | 1.55 × 10⁻⁶ | 5.66 × 10⁻⁶ | 0.00 *** | 0.89 (0.88, 0.90) |
| Large VLDL Particles (mmol/L) | 7.53 × 10⁻⁶ | 4.74 × 10⁻⁶ | 1.17 × 10⁻⁵ | 9.03 × 10⁻⁶ *** | 5.35 × 10⁻⁶ | 1.47 × 10⁻⁵ | 9.68 × 10⁻⁶ *** | 5.61 × 10⁻⁶ | 1.54 × 10⁻⁵ | 0.00 *** | 0.92 (0.92, 0.93) |
| Medium VLDL Particles (mmol/L) | 3.26 × 10⁻⁵ | 2.45 × 10⁻⁵ | 4.25 × 10⁻⁵ | 3.49 × 10⁻⁵ ** | 2.57 × 10⁻⁵ | 4.58 × 10⁻⁵ | 3.45 × 10⁻⁵ ** | 2.53 × 10⁻⁵ | 4.56 × 10⁻⁵ | 0.02 * | 0.95 (0.94, 0.95) |
| Small VLDL Particles (mmol/L) | 3.43 × 10⁻⁵ | 2.65 × 10⁻⁵ | 4.42 × 10⁻⁵ | 3.48 × 10⁻⁵ | 2.71 × 10⁻⁵ | 4.45 × 10⁻⁵ | 3.41 × 10⁻⁵ | 2.68 × 10⁻⁵ | 4.31 × 10⁻⁵ | 0.00 ** | 0.93 (0.92, 0.94) |
| Very Small VLDL Particles (mmol/L) | 4.72 × 10⁻⁵ | 4.00 × 10⁻⁵ | 5.55 × 10⁻⁵ | 4.68 × 10⁻⁵ | 4.00 × 10⁻⁵ | 5.43 × 10⁻⁵ | 4.66 × 10⁻⁵ | 4.03 × 10⁻⁵ | 5.41 × 10⁻⁵ | 0.11 | 0.94 (0.93, 0.95) |
| IDL Particles (mmol/L) | 3.07 × 10⁻⁴ | 2.67 × 10⁻⁴ | 3.50 × 10⁻⁴ | 3.09 × 10⁻⁴ | 2.65 × 10⁻⁴ | 3.51 × 10⁻⁴ | 3.08 × 10⁻⁴ | 2.67 × 10⁻⁴ | 3.53 × 10⁻⁴ | 0.81 | 0.94 (0.94, 0.95) |
| Large LDL Particles (mmol/L) | 7.65 × 10⁻⁴ | 6.40 × 10⁻⁴ | 9.12 × 10⁻⁴ | 7.24 × 10⁻⁴ *** | 6.07 × 10⁻⁴ | 8.61 × 10⁻⁴ | 6.96 × 10⁻⁴ *** | 5.88 × 10⁻⁴ | 8.16 × 10⁻⁴ | 0.00 ** | 0.95 (0.95, 0.96) |
| Medium LDL Particles (mmol/L) | 3.09 × 10⁻⁴ | 2.50 × 10⁻⁴ | 3.72 × 10⁻⁴ | 2.95 × 10⁻⁴ *** | 2.38 × 10⁻⁴ | 3.57 × 10⁻⁴ | 2.92 × 10⁻⁴ *** | 2.32 × 10⁻⁴ | 3.55 × 10⁻⁴ | 0.86 | 0.95 (0.94, 0.95) |
| Small LDL Particles (mmol/L) | 1.80 × 10⁻⁴ | 1.54 × 10⁻⁴ | 2.08 × 10⁻⁴ | 1.85 × 10⁻⁴ ** | 1.56 × 10⁻⁴ | 2.15 × 10⁻⁴ | 1.81 × 10⁻⁴ | 1.52 × 10⁻⁴ | 2.17 × 10⁻⁴ | 0.00 *** | 0.89 (0.88, 0.90) |
| Very Large HDL Particles (mmol/L) | 2.51 × 10⁻⁴ | 1.86 × 10⁻⁴ | 3.29 × 10⁻⁴ | 2.68 × 10⁻⁴ *** | 2.01 × 10⁻⁴ | 3.46 × 10⁻⁴ | 2.83 × 10⁻⁴ *** | 2.15 × 10⁻⁴ | 3.69 × 10⁻⁴ | 0.32 | 0.98 (0.98, 0.98) |
| Large HDL Particles (mmol/L) | 1.70 × 10⁻³ | 1.10 × 10⁻³ | 2.29 × 10⁻³ | 1.74 × 10⁻³ | 1.14 × 10⁻³ | 2.35 × 10⁻³ | 1.80 × 10⁻³ ** | 1.19 × 10⁻³ | 2.42 × 10⁻³ | 0.79 | 0.98 (0.98, 0.98) |
| Medium HDL Particles (mmol/L) | 4.12 × 10⁻³ | 3.51 × 10⁻³ | 4.68 × 10⁻³ | 3.99 × 10⁻³ * | 3.47 × 10⁻³ | 4.61 × 10⁻³ | 3.99 × 10⁻³ * | 3.49 × 10⁻³ | 4.54 × 10⁻³ | 0.02 * | 0.95 (0.94, 0.95) |
| Small HDL Particles (mmol/L) | 1.03 × 10⁻² | 9.46 × 10⁻³ | 1.13 × 10⁻² | 9.92 × 10⁻³ *** | 9.03 × 10⁻³ | 1.08 × 10⁻² | 9.56 × 10⁻³ *** | 8.65 × 10⁻³ | 1.03 × 10⁻² | 0.24 | 0.91 (0.90, 0.92) |
Disclaimer/Publisher’s Note: The statements, opinions and data contained in all publications are solely those of the individual author(s) and contributor(s) and not of MDPI and/or the editor(s). MDPI and/or the editor(s) disclaim responsibility for any injury to people or property resulting from any ideas, methods, instructions or products referred to in the content. |
© 2023 by the authors. Licensee MDPI, Basel, Switzerland. This article is an open access article distributed under the terms and conditions of the Creative Commons Attribution (CC BY) license (https://creativecommons.org/licenses/by/4.0/).
Share and Cite
Bermingham, K.M.; Mazidi, M.; Franks, P.W.; Maher, T.; Valdes, A.M.; Linenberg, I.; Wolf, J.; Hadjigeorgiou, G.; Spector, T.D.; Menni, C.; et al. Characterisation of Fasting and Postprandial NMR Metabolites: Insights from the ZOE PREDICT 1 Study. Nutrients 2023, 15, 2638. https://doi.org/10.3390/nu15112638
Bermingham KM, Mazidi M, Franks PW, Maher T, Valdes AM, Linenberg I, Wolf J, Hadjigeorgiou G, Spector TD, Menni C, et al. Characterisation of Fasting and Postprandial NMR Metabolites: Insights from the ZOE PREDICT 1 Study. Nutrients. 2023; 15(11):2638. https://doi.org/10.3390/nu15112638
Chicago/Turabian StyleBermingham, Kate M., Mohsen Mazidi, Paul W. Franks, Tyler Maher, Ana M. Valdes, Inbar Linenberg, Jonathan Wolf, George Hadjigeorgiou, Tim D. Spector, Cristina Menni, and et al. 2023. "Characterisation of Fasting and Postprandial NMR Metabolites: Insights from the ZOE PREDICT 1 Study" Nutrients 15, no. 11: 2638. https://doi.org/10.3390/nu15112638