Article

Midlife Life’s Simple 7, Psychosocial Health, and Physical Frailty, Hospital Frailty, and Comprehensive Frailty 10 Years Later

1
Department of Epidemiology, School of Public Health, Cheeloo College of Medicine, Shandong University, Jinan 250012, China
2
Centre for Health Management and Policy Research, School of Public Health, Cheeloo College of Medicine, Shandong University, Jinan 250012, China
3
National Health Commission Key Lab of Health Economics and Policy Research, Shandong University, Jinan 250012, China
*
Author to whom correspondence should be addressed.
Nutrients 2023, 15(10), 2412; https://doi.org/10.3390/nu15102412
Submission received: 15 April 2023 / Revised: 16 May 2023 / Accepted: 18 May 2023 / Published: 22 May 2023
(This article belongs to the Special Issue Nutrition and Lifestyle Interventions for Frailty and Sarcopenia)

Abstract

:
This study aims to examine the associations between midlife Life’s Simple 7 (LS7) status, psychosocial health (social isolation and loneliness), and late-life multidimensional frailty indicators, and to investigate their synergistic effect on frailty. We used cohort data from the UK Biobank. Frailty was assessed using physical frailty phenotype, hospital frailty risk score, and frailty index. Cox proportional-hazards models were used to estimate the hazard ratios (HRs) and 95% confidence intervals (CIs) on the association between the LS7 score, psychosocial health, and frailty. For the association of LS7 with physical and comprehensive frailty, 39,047 individuals were included. After a median follow-up of 9.0 years, 1329 (3.4%) people were identified with physical frailty, and 5699 (14.6%) with comprehensive frailty. For the association of LS7 with hospital frailty, 366,570 people were included. After a median follow-up of 12.0 years, 18,737 (5.1%) people were identified with hospital frailty. Compared to people with a poor LS7 score, those with an intermediate (physical frailty: 0.64, 0.54–0.77; hospital frailty: 0.60, 0.58–0.62; and comprehensive frailty: 0.77, 0.69–0.86) and optimal LS7 score (physical frailty: 0.31, 0.25–0.39; hospital frailty: 0.39, 0.37–0.41; and comprehensive frailty: 0.62, 0.55–0.69) were associated with a lower risk of frailty. Poor psychosocial health was associated with an increased risk of frailty. People who had a poor psychosocial status and poor LS7 score had the highest risk of frailty. A better LS7 score in midlife was associated with a reduced risk of physical, hospital, and comprehensive frailty. There was a synergistic effect of psychosocial status and LS7 on frailty.

1. Introduction

Frailty, a complex age-related clinical condition, is characterized by a decline in physiological capacity across multiple organ systems, with a resultant increased vulnerability to stressors [1,2]. Frailty has been associated with an increased risk for poor health outcomes including falls, incident disability, hospitalization, and mortality [3]. Several metrics have been developed to define and assess frailty in various domains, such as the frailty index (FI) for comprehensive frailty, frailty phenotype (FP) for physical frailty, and hospital frailty risk scores (HFRS) [1]. Although frailty prevalence greatly varies across studies (range of 4–59%) [4], due to the lack of standardized concepts or measures, all older adults are at risk of developing frailty. There will be 1.5 billion people aged 65 or older by 2050 [5], which means more people might live with frailty. Given the poor health outcomes related to frailty, it is imperative that we identify modifiable risk factors to delay or prevent the development of frailty.
Ageing, the psychosocial environment, and morbidity conditions act together to drive the development of frailty [1]. Among them, cardiovascular health (CVH) status is closely related to frailty. The American Heart Association (AHA) has introduced Life’s Simple 7 (LS7) metrics to assess and promote CVH. The LS7 includes four modifiable lifestyle behaviors (not smoking, healthy weight, eating healthy, and being physically active) and three biometric measures (blood pressure, cholesterol, and blood sugar) [6]. The existing few studies on LS7 and frailty have focused on the association with FP (i.e., physical frailty) [7,8]. These two studies reported that a higher LS7 score in midlife/the elderly was associated with a reduced risk of physical frailty. However, no study has examined the relationship between LS7 in midlife and FI (comprehensive frailty) or HFRS (hospital frailty) in later life.
Besides the use of the LS7 as metrics for CVH, psychosocial environment factors (e.g., social isolation and loneliness) may also influence the development of frailty. Evidence on the association between social isolation, loneliness, and frailty has been inconsistent [9,10,11]. Moreover, there might be a synergistic effect of psychosocial factors and LS7 on frailty. Thus, based on the bio-psycho-social medical model, we aimed to examine the associations between midlife LS7 status, psychosocial health (social isolation and loneliness), and late-life multidimensional frailty indicators (physical frailty, hospital frailty, and comprehensive frailty), and to investigate their synergistic effect on frailty.

2. Materials and Methods

2.1. Study Design and Participants

The UK Biobank is a large population-based prospective cohort study that recruited over 500,000 participants aged 40–69 years between 2006 and 2010 [12]. Participants attended 1 of 22 assessment centers across England, Wales, and Scotland, where they completed the touchscreen questionnaire, underwent physiological measurement, and provided biological samples at a baseline assessment visit. Participants gave informed consent for data linkage to national hospital inpatient admissions, cancer registrations, and death registrations. UK Biobank received ethical approval from the UK National Health Service’s National Research Ethics Service (ref 11/NW/0382).
In this study, a prospective design was adopted based on participants with no frailty at baseline. For assessment of physical frailty (using FP) and comprehensive frailty (using FI), participants were followed up from baseline (2006–2010) to Visit 2 (2014–2019). As only part of population at baseline was selected for a follow-up in the UK Biobank, 39,047 individuals were finally included in the association with FP and FI. For hospital frailty (using HFRS) assessment, all people who had health data linkage to primary care or hospital admission records in 2021 were included; 366,570 people were finally included in the association with hospital frailty. This research was conducted under UK Biobank application number 68369.

2.2. Exposure

Based on AHA recommendations, the LS7 score (range 0–14) was a sum of 7 metrics; each metric was scored 0 (poor), 1 (intermediate), and 2 (optimal) [6]. A higher score indicated a more optimal CVH. The overall LS7 score was categorized as poor (0 to 5), intermediate (6 to 9), and optimal (10 to 14) as suggested in previous research [13]. The LS7 include four modifiable lifestyle behaviors and three biometric measures. We thus also calculated a lifestyle score (including smoking status, body mass index (BMI), physical activity, and diet) ranging from 0 to 8, and a biometric score (including blood pressure, cholesterol, and glycemic status) ranging from 0 to 6 [14]. The lifestyle score was also categorized as poor (0–2), intermediate (3–5), and optimal (6–8), and the biometric score was categorized as poor (0–1), intermediate (2–3), and optimal (4–6). The UK Biobank fields used in the construction of the LS7 score were shown in Table S1. Definitions of each component of LS7 were summarized in Table S2 [13].
Psychosocial health status was measured by social isolation and loneliness. Social isolation was derived from three questions and each question was scored 0–1 (Table S3). Social isolation status was categorized as ‘with’ (scored 2 or 3) and ‘without’ (scored 0 or 1) [15]. Loneliness was a binary variable, with 0 indicating no feeling of loneliness, and 1 indicating feeling loneliness. The overall psychosocial health status was a sum of social isolation score and loneliness score, and was divided into ‘good’ (not isolated and lonely) and ‘poor’ (isolated, lonely, or both).

2.3. Outcome

We used three frailty measures of FP, HFRS, and FI to assess physical frailty, hospital frailty, and comprehensive frailty, respectively.
We used the FP metrics derived by Fried et al. and ever validated by UK Biobank data [16]. FP was defined using five clinical features: unintentional weight loss, exhaustion, low physical activity, slow walking speed, and low grip strength (weakness). Participants were classified as frail if they presented three or more features, pre-frail if they presented one or two features, and robust if they had none of the features [17]. The detailed definitions of each clinical feature of FP were shown in Table S4.
The FI metrics, which had previously been validated using baseline data of UK Biobank [18], included a cumulative count of 48 self-reported health conditions [19]. FI was derived from the total number of conditions presented in an individual divided by the total possible count. It was a value between 0 and 1, and a higher value indicated a greater degree of frailty. Participants were classified as being robust (<0.08), pre-frail (0.08–0.25), or frail (≥0.25) [20]. The detailed items and scoring of FI were described in Table S5.
The HFRS was computed based on the International Classification of Diseases 10th Revision (ICD-10) codes from hospital records. HFRS had also been validated from UK Biobank data [21]. Each of the 109 frailty-related ICD-10 codes was assigned a weight ranging from 0.1 to 7.1, depending on the strength of the association with frailty (Table S6). The HFRS was calculated by summing all the weighted codes, and categorized into low (<5), intermediate (5–15), and high (>15) risk of frailty [22].
We constructed a binary variable for frailty, with robust (low) and pre-frail (intermediate) representing “no frailty”, and frail (high) representing “frailty”. Individuals classified as “no frailty” were used as the reference group.

2.4. Covariates

We included the following factors in all analyses as covariates: age, sex, race/ethnicity, education, income level, and alcohol status. Race/ethnicity was categorized as white and non-white. Years of education was categorized as ≤10, 11–12, and >12 years. Income level was divided into four categories: level 1 (Less than £18,000), level 2 (£18,000 to £30,999), level 3 (£31,000 to £51,999), and level 4 (greater than 52,000). Alcohol status was categorized as never drinking, previous drinking, and current drinking. In the association with FP, since no illness factors were contained, we also included the following additional variables: diabetes status, family history of cardiovascular disease (CVD), stroke status, hypertension status, and CVD status. These variables were dichotomized as present or absent based on self-report at baseline.

2.5. Statistical Analysis

Baseline characteristics were presented as means and standard deviation (SD) for continuous variables and as percentages (%) for categorical variables. Normality was tested by using Shapiro–Wilk, P–P plots, and Q–Q plots. Differences between groups were compared by using ANOVA (continuous variables) or chi-square test (categorical variables). Cox proportional-hazards regression models were used to estimate the hazard ratios (HR) and 95% confidence intervals (CI) between LS7 score (‘poor’ as the reference group) and psychosocial health (‘good’ as the reference group) and frailty. Each component of LS7 and psychosocial health factor with frailty was also analyzed. For participants who experienced frailty, follow-up time was calculated as their age when frailty was observed minus baseline age; for participants who were not experiencing frailty, follow-up time was defined as their age at the last follow-up (censored date: January 2021 for HFRS, and January 2019 for FI and FP) minus baseline age. All analyses were adjusted for age at the last follow-up, sex, years of education, race/ethnicity, income level, and alcohol status. In the association with FP, diabetes status, family history of CVD, stroke status, hypertension status, and CVD status were further adjusted.
We also analyzed the synergistic effects of LS7 and psychosocial health on different frailty dimensions. To quantify dose–response relationships, we used restricted cubic spline models to test the non linear associations between LS7 score and frailty. All analyses were performed in SAS 9.4 and R (v4.2.1).

3. Results

3.1. Characteristics of the Study Participants

The characteristics of 39,047 participants for the assessment of physical frailty and comprehensive frailty were shown in Table 1. The mean baseline age was 64.0 (SD 7.6) years, and 19,909 (51.0%) participants were females. During follow-up, 1864 (4.8%) participants had a poor LS7 score, 24,926 (63.8%) had an intermediate LS7 score, and 12,257 (31.4%) had an optimal LS7 score. Only 731 (1.9%) had a poor psychosocial health status. Compared with individuals with a poor or intermediate LS7 score, those with an optimal LS7 score were more likely to be female, younger, white, have a higher education level, have a higher income level, and never alcohol intake. After a median follow-up of 9.0 years, FP identified 1329 (3.4%) people with physical frailty, and FI identified 5699 (14.6%) with comprehensive frailty. The characteristics of 366,570 participants for the assessment of hospital frailty were shown in Table S7. After a median follow-up of 12.0 years, 18,737 (5.1%) people were identified with hospital frailty.

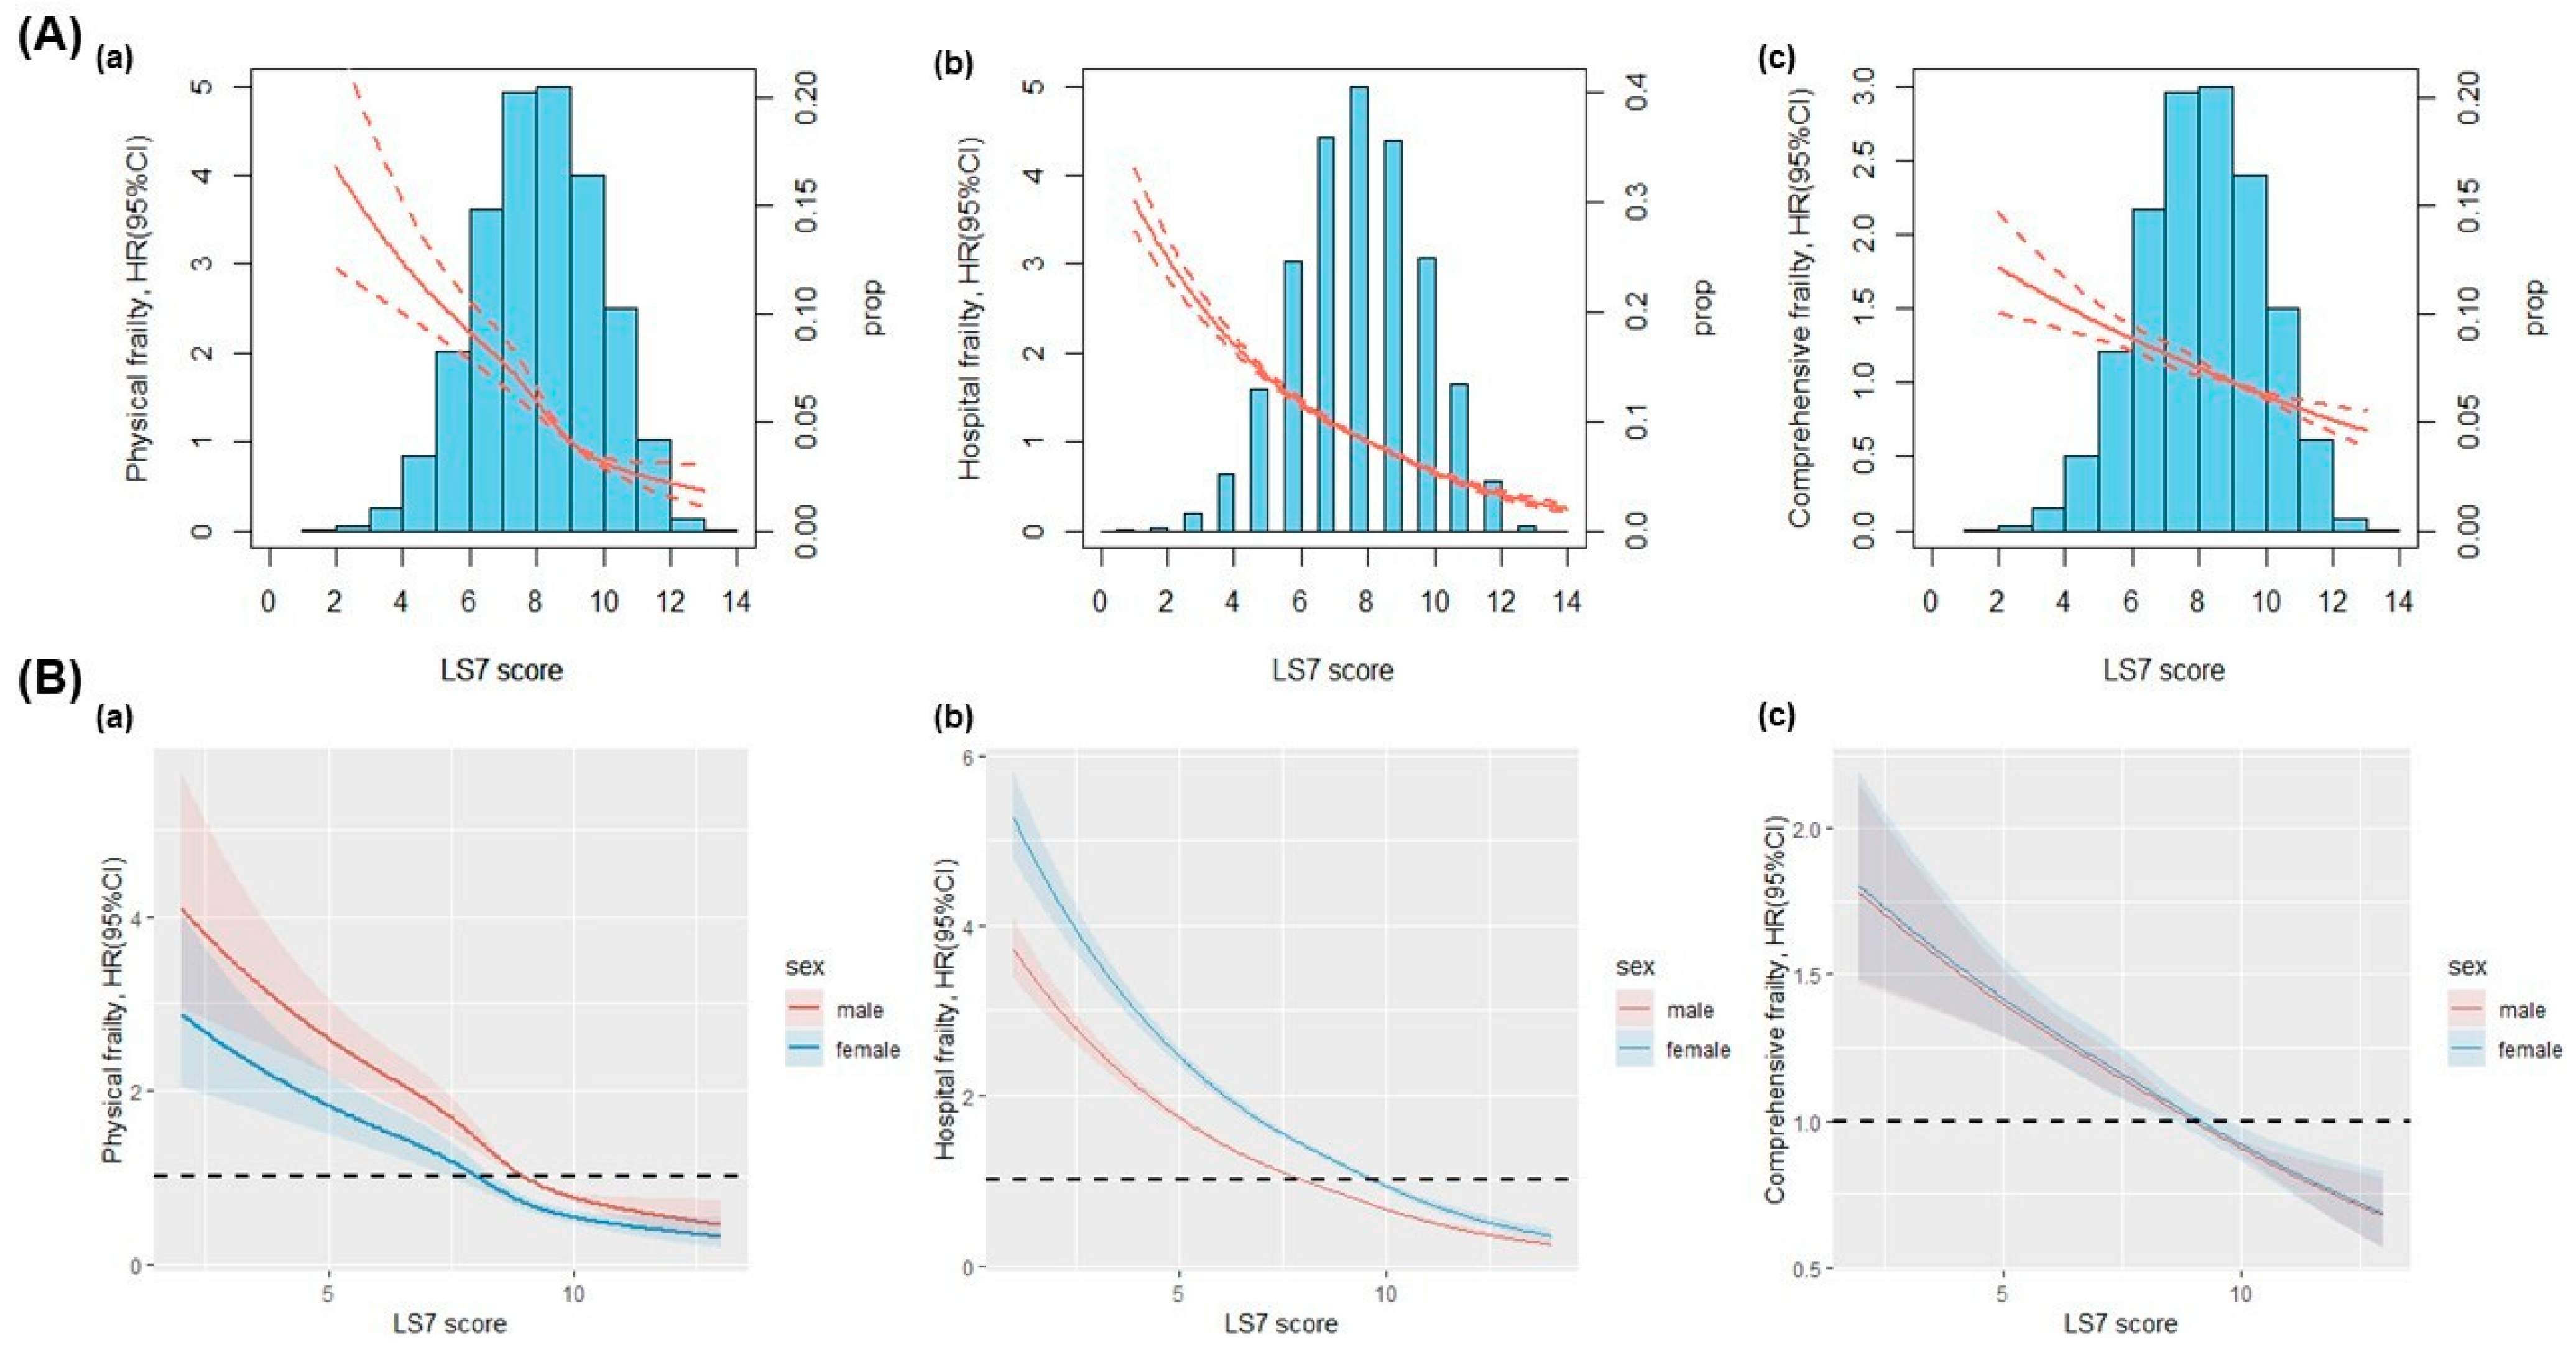
3.2. LS7 Score and Physical Frailty, Hospital Frailty, and Comprehensive Frailty

Compared to people with a poor LS7 score, those with an intermediate (physical frailty: HR 0.64, 95%CI 0.54–0.77; comprehensive frailty: 0.77, 0.69–0.86) and optimal LS7 score (physical frailty: 0.31, 0.25–0.39; comprehensive frailty: 0.62, 0.55–0.69) were associated with a lower risk of frailty (Table 2). When the relationship between LS7 score and hospital frailty were analyzed, an intermediate and optimal LS7 score was related to a 40% (0.60, 0.58–0.62) and 60% (0.39, 0.37–0.41) lower risk of hospital frailty, respectively (Table 3). When the associations between lifestyle score, biometric score of LS7, and frailty were analyzed, a higher lifestyle score was linked to a lower risk of physical frailty, comprehensive frailty, and hospital frailty. Specifically, compared with poor BMI, moderate and optimal BMIs were all associated with a lower risk of physical frailty, comprehensive frailty, and hospital frailty. Moreover, an optimal diet was associated with a decreased risk of frailty, with HRs (95%CI) of 0.74 (0.56, 0.98), 0.83 (0.73, 0.95), and 0.69 (0.62, 0.78), respectively (Table 2 and Table 3). No association was found between biometric score and physical frailty or comprehensive frailty, while a higher biometric score was associated with a lower risk of hospital frailty (Table 2 and Table 3).
Dose–response relationship analyses showed a clear negative association between LS7 score and risk of physical frailty, comprehensive frailty, and hospital frailty (i.e., higher LS7 score was related to lower risk of frailty), with a non-linear relationship (p < 0.05) for physical frailty and hospital frailty [Figure 1A(a,b)], and a linear relationship (p > 0.05) for comprehensive frailty [Figure 1A(c)]. After the dose–response relationship was stratified by sex, we observed a sex difference in the association with physical frailty [Figure 1B(a)] and hospital frailty [Figure 1B(b)]. In the association with physical frailty, a lower LS7 score was linked to a higher risk of frailty in males than in females, while, in the association with hospital frailty, a lower LS7 score was linked to a higher risk of frailty in females than in males. There was no sex difference in the association with comprehensive frailty [Figure 1B(c)].

3.3. Psychosocial Health and Physical Frailty, Hospital Frailty, and Comprehensive Frailty

Poor psychosocial health was associated with an increased risk of frailty; the HRs (95%CI) was 1.87 (1.44–2.43) for physical frailty, 1.46 (1.24–1.71) for comprehensive frailty, and 1.53 (1.44–1.62) for hospital frailty (shown in Table 2 and Table 3). There was a sex difference in the association between social isolation and physical frailty, and the link was only observed in males.

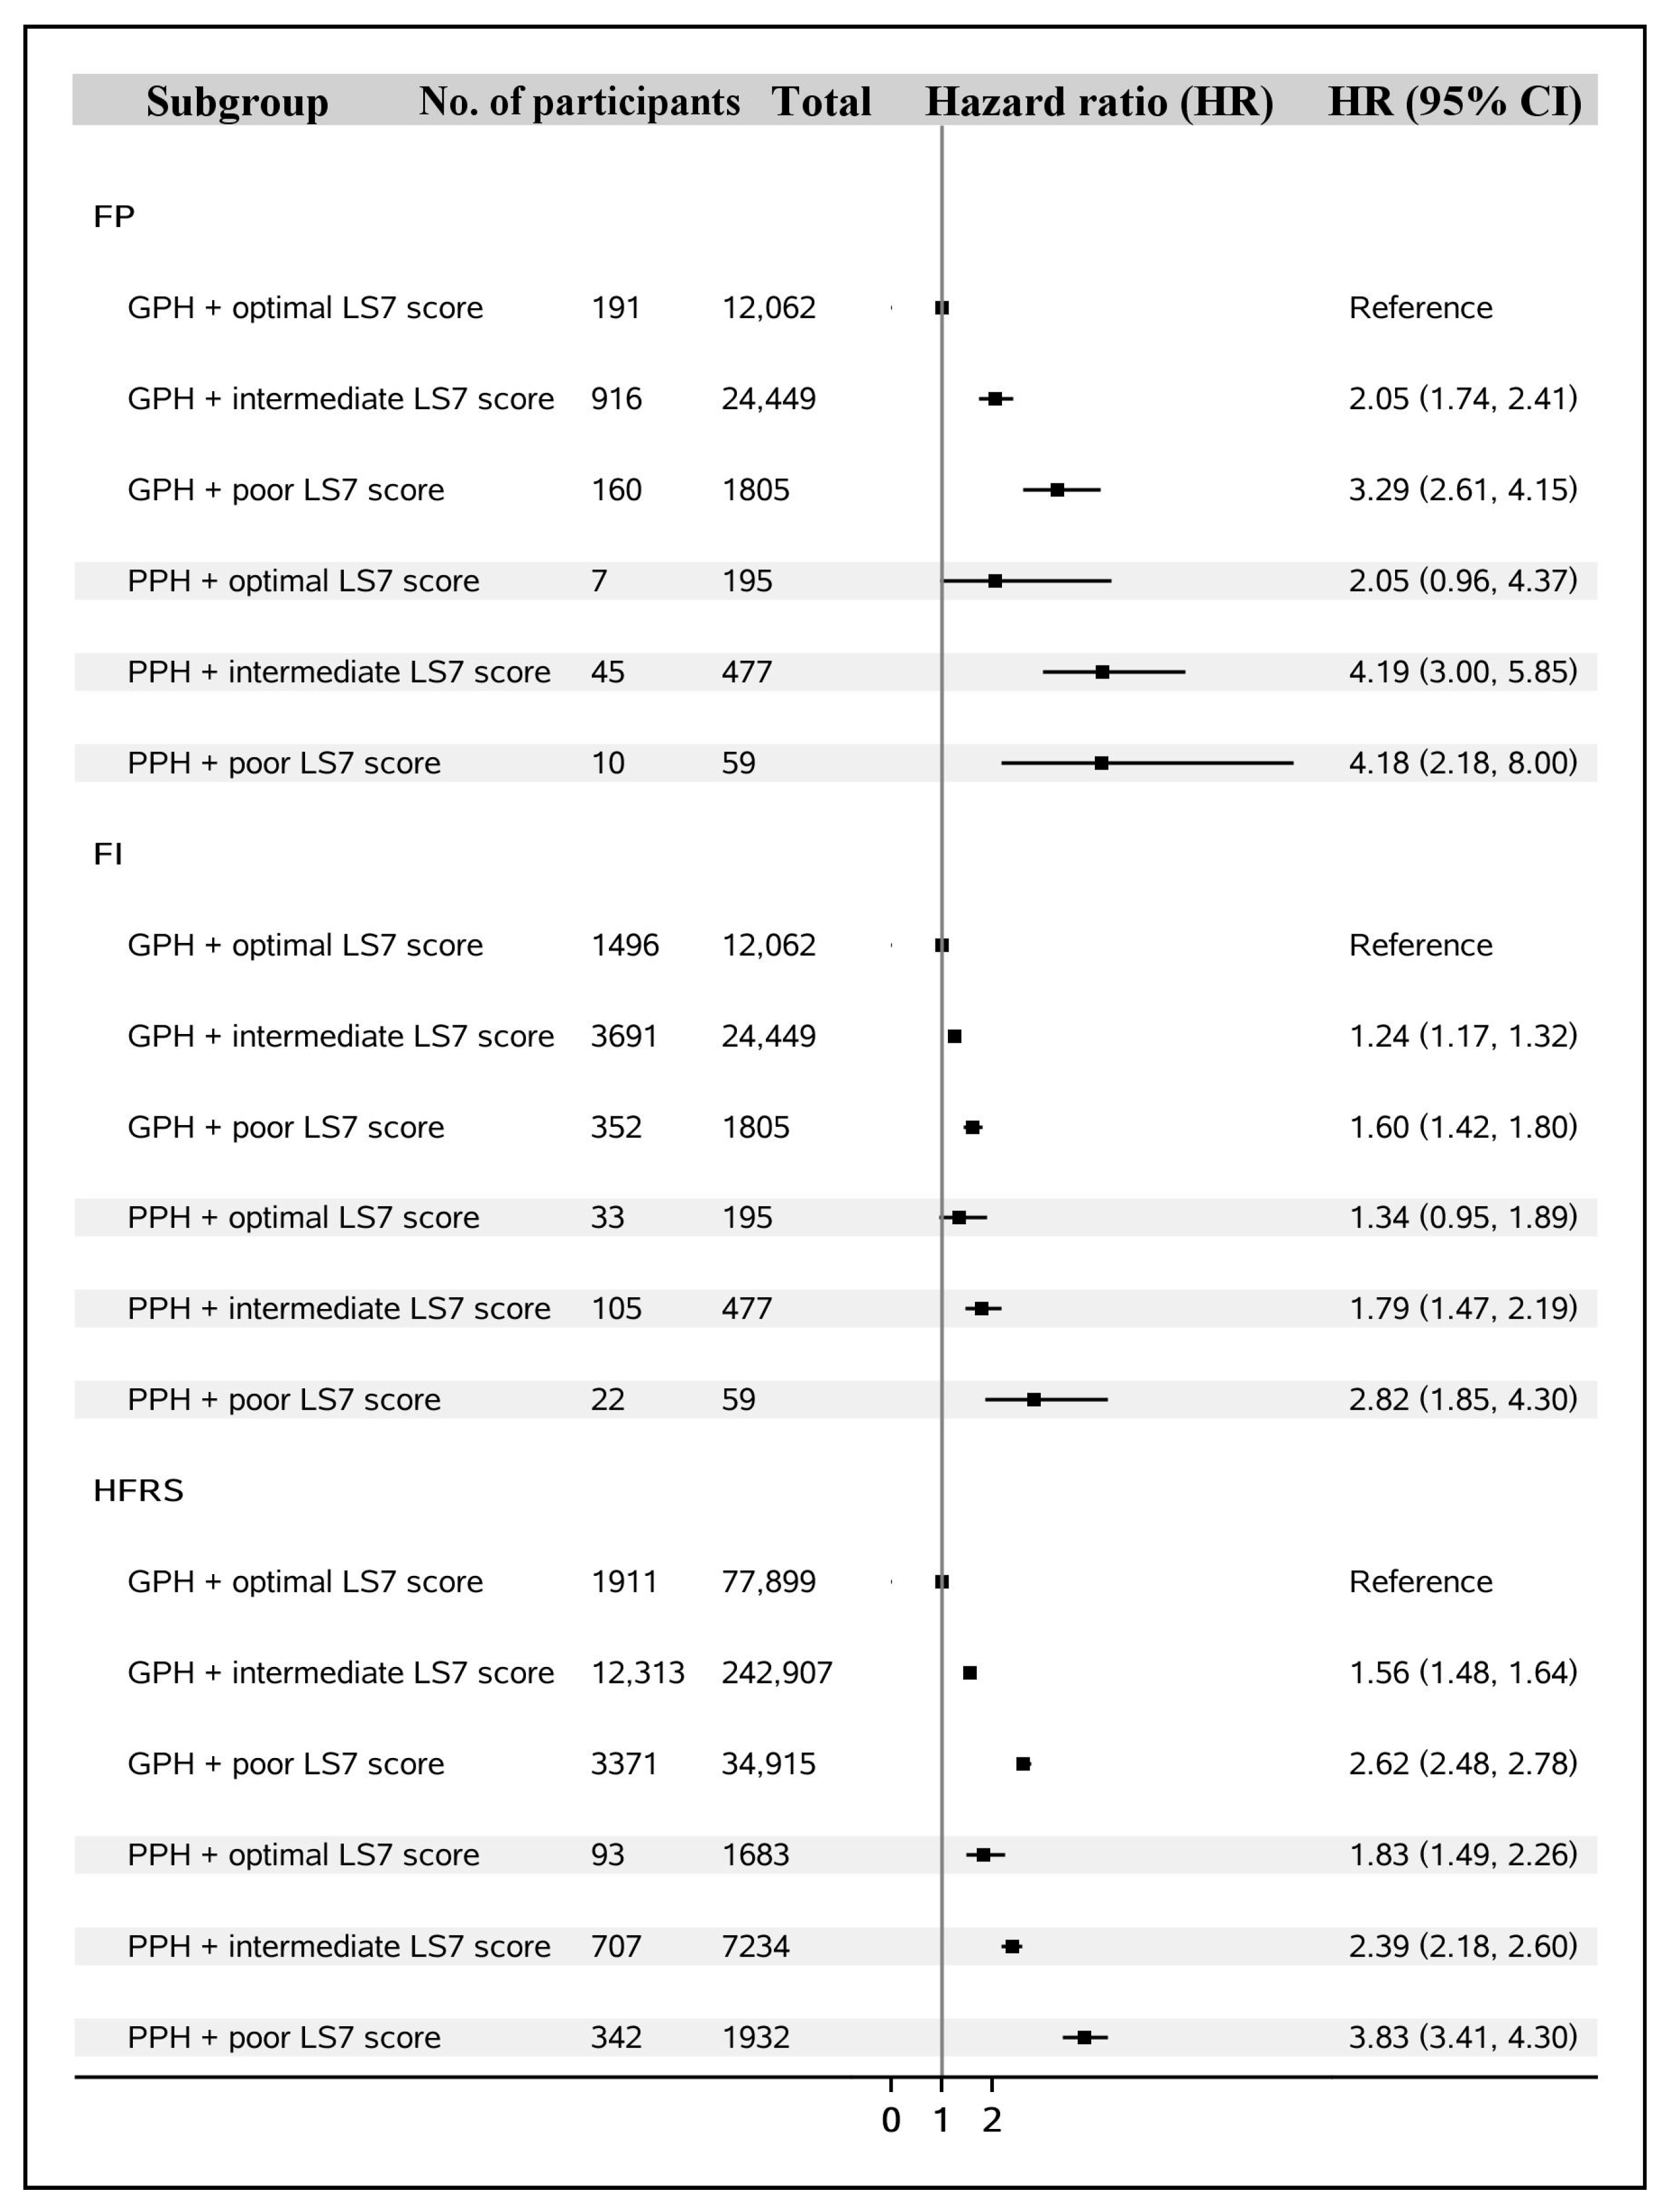
3.4. Synergistic Interactions between LS7 Score and Psychosocial Health Status on Risk of Frailty

We observed synergistic effects of LS7 and psychosocial health on frailty (shown in Figure 2). People who had a poor psychosocial status and poor LS7 score had the highest risk of frailty (physical frailty: HR = 4.18, 95% CI = 2.18–8.00; comprehensive frailty: HR = 2.82, 95% CI = 1.85–4.30; and hospital frailty: HR = 3.83, 95% CI = 3.41–4.30).

4. Discussion

In this large population-based prospective cohort study, using three domains of frailty (physical, hospital, and comprehensive), our findings showed that both a better midlife LS7 score and good psychosocial health status were associated with a lower risk of frailty over a 10-year follow-up period. A dose–response relationship was also observed between the LS7 score and frailty, and there was a sex difference between them. We also found a synergistic interaction of LS7 and psychosocial health on frailty. Individuals who had poor psychosocial health and a poor LS7 score were associated with the highest risk of frailty.

4.1. LS7 Score and Physical Frailty, Hospital Frailty, and Comprehensive Frailty

Our study extended the limited evidence to date on the association between LS7 and frailty risk. The prospective Nutrition and Cardiovascular Risk in Spain (ENRICA) Study [7] with elderly adults found that a higher LS7 score was associated with a reduced risk of frailty. However, the ENRICA study was conducted in older adults (≥60 years) and only considered the link to physical frailty. In line with Palta’s findings [8], we also observed that a higher LS7 score (i.e., better CVH) in midlife was associated with a lower risk of physical frailty in late life. To the best of our knowledge, no studies have explored the association of LS7 with hospital frailty and comprehensive frailty; our findings demonstrated evidence linking LS7 with hospital frailty and comprehensive frailty.
Consistent with Palta’s findings [8], we found that an optimal BMI and diet were associated with a lower risk of physical frailty. As a complement, we expanded this relationship to comprehensive frailty and hospital frailty. We also found no association between the biometric score of LS7 and physical frailty and comprehensive frailty, congruent with the ENRICA study [7]. Moreover, Boreskie et al. and Ramsay et al. also found no association between physical frailty or comprehensive frailty and biometric score, such as low-density lipoprotein (LDL) [23] and hypertension [24]. However, the biometric score was associated with hospital frailty in our study. One possible explanation is that both high blood pressure and high LDL are two of the most common chronic diseases and are also major risk factors for multiple conditions, leading to multimorbidity [25,26]. Multimorbidity prevalence reaches 55–98% in people older than 65 years [27]. A bidirectional causal relationship between frailty and multimorbidity is presumable [28]. Frailty may predispose persons to the development of multiple chronic diseases, but frailty may also stem from the coexistence of multiple diseases.
Whether there was a sex difference in the association between LS7 and frailty remains unclear. A previous study did not observe a sex difference in the association between LS7 and physical frailty [8]. We observed that a lower LS7 score increased the risk of physical frailty more in males than in females, while a lower LS7 score increased hospital frailty risk more in females than in males. By using physical frailty, Nina Mielke et al. also found that, with unfavorable risk factors, men worsened more often, and those who were already frail died more often than women [29]. Moreover, in men and women over 65 years, studies have found women had a higher overall prevalence of multimorbidity than men [30,31]. These may explain why a lower LS7 score predicted physical frailty better in males, and predicted hospital frailty better in females.

4.2. Psychosocial Health and Physical Frailty, Hospital Frailty, and Comprehensive Frailty

Additionally, previous studies yielded inconsistent findings on the association between psychosocial health and frailty. The English Longitudinal Study of Ageing (ELSA) study found no association between social isolation and physical frailty and comprehensive frailty over time [32]. However, this study was subjected to a small sample size and short follow-up period. Another cohort study supported that higher levels of loneliness and social isolation were significantly associated with the risk of worsening physical frailty or pre-frailty in healthy people [10]. Consistent with Jarach’s study, our findings showed that both social isolation and loneliness increased the risk of physical, hospital, and comprehensive frailty.
In addition, in line with the findings of the ELSA study [9], males with social isolation had an increased risk of physical frailty, while no such association was observed in females. One possible explanation is that social isolation (e.g., lack of contact with friends or family) implies less physical activities, and males usually have more physical activity than females [33]. Thus, the reduced physical activities had a greater influence in males than in females.

4.3. Synergistic Interactions between LS7 Score and Psychosocial Health Status on Risk of Frailty

Frailty represents a multidimensional state of depleted physiologic and psychosocial reserve [34]. Thus, psychosocial factors might be a concomitant of frailty and may predict the future risk of frailty. We found poor psychosocial factors of social isolation and loneliness in midlife both increased the risk of physical, hospital, and comprehensive frailty, indicating that frailty might be caused not only by physical problems, but also by psychological problems. There was also a synergistic effect of LS7 and psychosocial health on frailty. Our findings imply the necessity to pay attention to risk factors of frailty from a holistic health perspective, i.e., from biological, psychological, and social dimensions, to surveillance and follow-up of the risk factors.

4.4. Strength and Limitations

The UK Biobank is a large, prospective, general population cohort with data available on a wide range of potential confounders and health outcomes. As a result, our analyses could broadly analyze the relationship between LS7 score (including lifestyle score and biometric score), psychosocial status, and multi-dimensions of frailty, i.e., physical, hospital, and comprehensive frailty. Frailty represents a multidimensional state of depleted physiologic and psychosocial reserve and clinical vulnerability. Thus, the risk factors of frailty might be also multi-dimensional. We considered the risk factors of frailty based on the bio-psycho-social medical model, and demonstrated a synergistic interaction between the physiological and psycho-social on frailty. Furthermore, the frailty metrics of FP, HFRS, and FI we used in this study have been validated, which enhances the reliability of our findings.
Several limitations need to be acknowledged when interpreting our findings. First, the UK Biobank is not a nationally representative sample, with generally healthier behaviors [35], and less socioeconomically deprived [36] participants than the UK average. Consequently, findings might not be generalizable to other ethnicities or populations. Second, although we adjusted for major confounding factors, residual confounding from unknown or unmeasured factors remains a possibility, such as sleep health [37]. Third, only association and not causation should be inferred because of the observational study design. However, the prospective cohort design provided support for a causal association.

5. Conclusions

Based on a bio-psycho-social medical model, we explored the relationships between LS7, psychosocial factors, and multidomain frailties. Our findings showed that a better LS7 score in midlife was associated with a 70%, 60%, and 40% reduced risk of physical frailty, hospital frailty, and comprehensive frailty over 10 years later, respectively. The psychosocial factors of social isolation and loneliness also increased the risk of frailty. There was a synergistic effect of psychosocial status and LS7 on frailty. Individuals who had poor psychosocial health and a poor LS7 score were associated with the highest risk of frailty. Follow-up and surveillance of the LS7 score and psychosocial status is useful for assessing the future risk of frailty, identifying high-risk groups, and developing potential interventions. The present study emphasized the significant role of CVH and psychosocial factors in midlife on multiple frailty dimensions in later life, suggesting maintaining an ideal CVH and psychosocial conditions in early life may help to prevent or delay frailty in later life. Future studies are needed to explore the underlying reasons for the sex difference in the association of CVH with physical frailty and hospital frailty.

Supplementary Materials

The following supporting information can be downloaded at: https://www.mdpi.com/article/10.3390/nu15102412/s1, Table S1: UK biobank fields used in the construction of the Life’s Simple 7 score; Table S2: Definition of individual components of the Life’s Simple 7 score in the UK Biobank; Table S3: Definition and UK Biobank fields of the psychosocial health status factors; Table S4: The five frailty criteria for construction of the physical frailty phenotype; Table S5: The frailty items and scoring for construction of the frailty index; Table S6: The ICD-10 codes and assigned weights used to construct the Hospital Frailty Risk Score; Table S7: Baseline characteristics of Hospital Frailty Risk Score. References [38,39,40] are cited in the Supplementary Materials.

Author Contributions

Conceptualization, D.Z. and Q.W.; methodology, Q.W. and C.Z.; software, Q.W.; validation, Q.W., C.Z., C.D. and J.Z.; writing—original draft preparation, Q.W.; writing—review and editing, Q.W., C.Z., C.D., J.Z., Z.X., H.S., C.F. and W.H.; supervision, D.Z.; funding acquisition, D.Z. All authors have read and agreed to the published version of the manuscript.

Funding

This research was funded by the National Natural Science Foundation of China (82273702), Science Fund Program for Excellent Young Scholars of Shandong Provence (Overseas) (2022HWYQ-030), Taishan Scholars Project Special Fund (tsqnz20221103), and the Qilu Young Scholar (Tier-1) program (202099000066).

Institutional Review Board Statement

Not applicable.

Informed Consent Statement

Not applicable.

Data Availability Statement

Researchers can apply to use the UK Biobank resource (https://www.ukbiobank.ac.uk/, accessed on 16 August 2022) and access the data used in this study.

Acknowledgments

This research has been conducted using the UK Biobank resource (application number 68369). The authors are grateful to UK Biobank participants.

Conflicts of Interest

All authors declare no conflict of interest.

References

  1. Dent, E.; Martin, F.C.; Bergman, H.; Woo, J.; Romero-Ortuno, R.; Walston, J.D. Management of frailty: Opportunities, challenges, and future directions. Lancet 2019, 394, 1376–1386. [Google Scholar] [CrossRef] [PubMed]
  2. Hoogendijk, E.O.; Afilalo, J.; Ensrud, K.E.; Kowal, P.; Onder, G.; Fried, L.P. Frailty: Implications for clinical practice and public health. Lancet 2019, 394, 1365–1375. [Google Scholar] [CrossRef] [PubMed]
  3. Peng, Y.; Zhong, G.C.; Zhou, X.; Guan, L.; Zhou, L. Frailty and risks of all-cause and cause-specific death in community-dwelling adults: A systematic review and meta-analysis. BMC Geriatr. 2022, 22, 725. [Google Scholar] [CrossRef]
  4. Collard, R.M.; Boter, H.; Schoevers, R.A.; Oude Voshaar, R.C. Prevalence of frailty in community-dwelling older persons: A systematic review. J. Am. Geriatr. Soc. 2012, 60, 1487–1492. [Google Scholar] [CrossRef]
  5. United Nations. Our World Is Growing Older: UN DESA Releases New Report on Ageing. Available online: https://www.un.org/development/desa/en/news/population/our-world-is-growing-older.html (accessed on 25 January 2023).
  6. Lloyd-Jones, D.M.; Hong, Y.; Labarthe, D.; Mozaffarian, D.; Appel, L.J.; Van Horn, L.; Greenlund, K.; Daniels, S.; Nichol, G.; Tomaselli, G.F.; et al. Defining and setting national goals for cardiovascular health promotion and disease reduction: The American Heart Association’s strategic Impact Goal through 2020 and beyond. Circulation 2010, 121, 586–613. [Google Scholar] [CrossRef] [PubMed]
  7. Graciani, A.; Garcia-Esquinas, E.; Lopez-Garcia, E.; Banegas, J.R.; Rodriguez-Artalejo, F. Ideal Cardiovascular Health and Risk of Frailty in Older Adults. Circ. Cardiovasc. Qual. Outcomes 2016, 9, 239–245. [Google Scholar] [CrossRef]
  8. Palta, P.; Griswold, M.; Ranadive, R.; Bandeen-Roche, K.; Folsom, A.R.; Petruski-Ivleva, N.; Burgard, S.; Kucharska-Newton, A.; Windham, B.G. Midlife Cardiovascular Health and Robust Versus Frail Late-Life Status: The Atherosclerosis Risk in Communities Study. J. Gerontol. A Biol. Sci. Med. Sci. 2022, 77, 1222–1229. [Google Scholar] [CrossRef]
  9. Gale, C.R.; Westbury, L.; Cooper, C. Social isolation and loneliness as risk factors for the progression of frailty: The English Longitudinal Study of Ageing. Age Ageing 2018, 47, 392–397. [Google Scholar] [CrossRef]
  10. Jarach, C.M.; Tettamanti, M.; Nobili, A.; D’Avanzo, B. Social isolation and loneliness as related to progression and reversion of frailty in the Survey of Health Aging Retirement in Europe (SHARE). Age Ageing 2021, 50, 258–262. [Google Scholar] [CrossRef]
  11. Mehrabi, F.; Beland, F. Effects of social isolation, loneliness and frailty on health outcomes and their possible mediators and moderators in community-dwelling older adults: A scoping review. Arch. Gerontol. Geriatr. 2020, 90, 104119. [Google Scholar] [CrossRef]
  12. Bycroft, C.; Freeman, C.; Petkova, D.; Band, G.; Elliott, L.T.; Sharp, K.; Motyer, A.; Vukcevic, D.; Delaneau, O.; O’Connell, J.; et al. The UK Biobank resource with deep phenotyping and genomic data. Nature 2018, 562, 203–209. [Google Scholar] [CrossRef] [PubMed]
  13. Sabia, S.; Fayosse, A.; Dumurgier, J.; Schnitzler, A.; Empana, J.P.; Ebmeier, K.P.; Dugravot, A.; Kivimaki, M.; Singh-Manoux, A. Association of ideal cardiovascular health at age 50 with incidence of dementia: 25 year follow-up of Whitehall II cohort study. BMJ 2019, 366, l4414. [Google Scholar] [CrossRef] [PubMed]
  14. Malik, R.; Georgakis, M.K.; Neitzel, J.; Rannikmae, K.; Ewers, M.; Seshadri, S.; Sudlow, C.L.M.; Dichgans, M. Midlife vascular risk factors and risk of incident dementia: Longitudinal cohort and Mendelian randomization analyses in the UK Biobank. Alzheimers Dement. 2021, 17, 1422–1431. [Google Scholar] [CrossRef]
  15. Elovainio, M.; Hakulinen, C.; Pulkki-Raback, L.; Virtanen, M.; Josefsson, K.; Jokela, M.; Vahtera, J.; Kivimaki, M. Contribution of risk factors to excess mortality in isolated and lonely individuals: An analysis of data from the UK Biobank cohort study. Lancet Public. Health 2017, 2, e260–e266. [Google Scholar] [CrossRef] [PubMed]
  16. Hanlon, P.; Nicholl, B.I.; Jani, B.D.; Lee, D.; McQueenie, R.; Mair, F.S. Frailty and pre-frailty in middle-aged and older adults and its association with multimorbidity and mortality: A prospective analysis of 493 737 UK Biobank participants. Lancet Public Health 2018, 3, e323–e332. [Google Scholar] [CrossRef] [PubMed]
  17. Petermann-Rocha, F.; Lyall, D.M.; Gray, S.R.; Esteban-Cornejo, I.; Quinn, T.J.; Ho, F.K.; Pell, J.P.; Celis-Morales, C. Associations between physical frailty and dementia incidence: A prospective study from UK Biobank. Lancet Healthy Longev. 2020, 1, e58–e68. [Google Scholar] [CrossRef] [PubMed]
  18. Williams, D.M.; Jylhava, J.; Pedersen, N.L.; Hagg, S. A Frailty Index for UK Biobank Participants. J. Gerontol. A Biol. Sci. Med. Sci. 2019, 74, 582–587. [Google Scholar] [CrossRef] [PubMed]
  19. Rockwood, K.; Mitnitski, A. Frailty in relation to the accumulation of deficits. J. Gerontol. A Biol. Sci. Med. Sci. 2007, 62, 722–727. [Google Scholar] [CrossRef]
  20. Mutz, J.; Choudhury, U.; Zhao, J.; Dregan, A. Frailty in individuals with depression, bipolar disorder and anxiety disorders: Longitudinal analyses of all-cause mortality. BMC Med. 2022, 20, 274. [Google Scholar] [CrossRef]
  21. Mak, J.K.L.; Kuja-Halkola, R.; Wang, Y.; Hagg, S.; Jylhava, J. Frailty and comorbidity in predicting community COVID-19 mortality in the U.K. Biobank: The effect of sampling. J. Am. Geriatr. Soc. 2021, 69, 1128–1139. [Google Scholar] [CrossRef]
  22. Gilbert, T.; Neuburger, J.; Kraindler, J.; Keeble, E.; Smith, P.; Ariti, C.; Arora, S.; Street, A.; Parker, S.; Roberts, H.C.; et al. Development and validation of a Hospital Frailty Risk Score focusing on older people in acute care settings using electronic hospital records: An observational study. Lancet 2018, 391, 1775–1782. [Google Scholar] [CrossRef] [PubMed]
  23. Boreskie, K.F.; Rose, A.V.; Hay, J.L.; Kehler, D.S.; Costa, E.C.; Moffatt, T.L.; Arora, R.C.; Duhamel, T.A. Frailty status and cardiovascular disease risk profile in middle-aged and older females. Exp. Gerontol. 2020, 140, 111061. [Google Scholar] [CrossRef] [PubMed]
  24. Ramsay, S.E.; Arianayagam, D.S.; Whincup, P.H.; Lennon, L.T.; Cryer, J.; Papacosta, A.O.; Iliffe, S.; Wannamethee, S.G. Cardiovascular risk profile and frailty in a population-based study of older British men. Heart 2015, 101, 616–622. [Google Scholar] [CrossRef] [PubMed]
  25. Bowling, C.B.; Sloane, R.; Pieper, C.; Luciano, A.; Davis, B.R.; Simpson, L.M.; Einhorn, P.T.; Oparil, S.; Muntner, P. Association of Sustained Blood Pressure Control with Multimorbidity Progression Among Older Adults. J. Am. Geriatr. Soc. 2020, 68, 2059–2066. [Google Scholar] [CrossRef]
  26. Tajik, B.; Voutilainen, A.; Kauhanen, J.; Mazidi, M.; Lip, G.Y.H.; Tuomainen, T.P.; Isanejad, M. Lipid profile, lipid ratios, apolipoproteins, and risk of cardiometabolic multimorbidity in men: The Kuopio Ischaemic Heart Disease Risk Factor Study. Lipids 2022, 57, 141–149. [Google Scholar] [CrossRef]
  27. Vetrano, D.L.; Palmer, K.; Marengoni, A.; Marzetti, E.; Lattanzio, F.; Roller-Wirnsberger, R.; Lopez Samaniego, L.; Rodriguez-Manas, L.; Bernabei, R.; Onder, G.; et al. Frailty and Multimorbidity: A Systematic Review and Meta-analysis. J. Gerontol. A Biol. Sci. Med. Sci. 2019, 74, 659–666. [Google Scholar] [CrossRef]
  28. Fried, L.P.; Ferrucci, L.; Darer, J.; Williamson, J.D.; Anderson, G. Untangling the concepts of disability, frailty, and comorbidity: Implications for improved targeting and care. J. Gerontol. A Biol. Sci. Med. Sci. 2004, 59, 255–263. [Google Scholar] [CrossRef]
  29. Mielke, N.; Schneider, A.; Huscher, D.; Ebert, N.; Schaeffner, E. Gender differences in frailty transition and its prediction in community-dwelling old adults. Sci. Rep. 2022, 12, 7341. [Google Scholar] [CrossRef]
  30. Abad-Diez, J.M.; Calderon-Larranaga, A.; Poncel-Falco, A.; Poblador-Plou, B.; Calderon-Meza, J.M.; Sicras-Mainar, A.; Clerencia-Sierra, M.; Prados-Torres, A. Age and gender differences in the prevalence and patterns of multimorbidity in the older population. BMC Geriatr. 2014, 14, 75. [Google Scholar] [CrossRef]
  31. Salive, M.E. Multimorbidity in older adults. Epidemiol. Rev. 2013, 35, 75–83. [Google Scholar] [CrossRef]
  32. Ding, Y.Y.; Kuha, J.; Murphy, M. Multidimensional predictors of physical frailty in older people: Identifying how and for whom they exert their effects. Biogerontology 2017, 18, 237–252. [Google Scholar] [CrossRef] [PubMed]
  33. Uno, C.; Okada, K.; Matsushita, E.; Satake, S.; Kuzuya, M. Friendship-related social isolation is a potential risk factor for the transition from robust to prefrailty among healthy older adults: A 1-year follow-up study. Eur. Geriatr. Med. 2021, 12, 285–293. [Google Scholar] [CrossRef]
  34. De Biasio, J.C.; Mittel, A.M.; Mueller, A.L.; Ferrante, L.E.; Kim, D.H.; Shaefi, S. Frailty in Critical Care Medicine: A Review. Anesth. Analg. 2020, 130, 1462–1473. [Google Scholar] [CrossRef] [PubMed]
  35. Batty, G.D.; Gale, C.R.; Kivimaki, M.; Deary, I.J.; Bell, S. Comparison of risk factor associations in UK Biobank against representative, general population based studies with conventional response rates: Prospective cohort study and individual participant meta-analysis. BMJ 2020, 368, m131. [Google Scholar] [CrossRef] [PubMed]
  36. Fry, A.; Littlejohns, T.J.; Sudlow, C.; Doherty, N.; Adamska, L.; Sprosen, T.; Collins, R.; Allen, N.E. Comparison of Sociodemographic and Health-Related Characteristics of UK Biobank Participants With Those of the General Population. Am. J. Epidemiol. 2017, 186, 1026–1034. [Google Scholar] [CrossRef]
  37. Lloyd-Jones, D.M.; Allen, N.B.; Anderson, C.A.M.; Black, T.; Brewer, L.C.; Foraker, R.E.; Grandner, M.A.; Lavretsky, H.; Perak, A.M.; Sharma, G.; et al. Life’s Essential 8: Updating and Enhancing the American Heart Association’s Construct of Cardiovascular Health: A Presidential Advisory From the American Heart Association. Circulation 2022, 146, e18–e43. [Google Scholar] [CrossRef]
  38. Mozaffarian, D. Dietary and Policy Priorities for Cardiovascular Disease, Diabetes, and Obesity: A Comprehensive Review. Circulation 2016, 133, 187–225. [Google Scholar] [CrossRef]
  39. Said, M.A.; Verweij, N.; van der Harst, P. Associations of Combined Genetic and Lifestyle Risks With Incident Cardiovascular Disease and Diabetes in the UK Biobank Study. JAMA Cardiol. 2018, 3, 693–702. [Google Scholar] [CrossRef]
  40. Fried, L.P.; Tangen, C.M.; Walston, J.; Newman, A.B.; Hirsch, C.; Gottdiener, J.; Seeman, T.; Tracy, R.; Kop, W.J.; Burke, G.; et al. Frailty in older adults: Evidence for a phenotype. J. Gerontol. A Biol. Sci. Med. Sci. 2001, 56, M146–M156. [Google Scholar] [CrossRef]
Figure 1. Risk for incident frailty (physical frailty (a), hospital frailty (b), and comprehensive frailty (c)) according to LS7 (LS7 score (A), and sex-specific of LS7 score (B)) using restricted cubic spline functions in Cox proportional-hazards regression models. The blue bars (histogram) represent the proportion of distribution of each LS7 score. Dotted lines represent the 95% confidence intervals. All models were adjusted for sex, age, race, education, income, alcohol status, diabetes status, and psychosocial health. Physical frailty was additionally adjusted for family history of CVD, stroke status, hypertension status, and CVD status.
Nutrients 15 02412 g001
Figure 2. The synergistic effects of LS7 and psychosocial health on frailty. Abbreviations: GPH: good psychosocial health; PPH: poor psychosocial health; HRs: hazard ratios; FP: physical frailty phenotype; FI: frailty index; HFRS: hospital frailty risk score; 95% CI: 95% confidence interval.
Nutrients 15 02412 g002
Table 1. Baseline characteristics of 39,047 participants for assessment of physical frailty and comprehensive frailty, n (%).
CharacteristicsNLS7 ScorePsychosocial Health
Poor
(0–5)
Intermediate
(6–9)
Optimal
(10–14)
p *GoodPoorp *
No. of participants39,047186424,92612,257 38,316731
Age (years, mean ± SD) 64.0 ± 7.665.6 ± 6.965.1 ± 7.361.7 ± 7.6<0.00164.1 ± 7.662.0 ± 7.50.506
Sex <0.001 0.105
   Male19,1381206 (64.7)13,495 (54.1)4437 (36.2) 18,758 (49.0)380 (52.0)
   Female19,909658 (35.3)11,431 (45.9)7820 (63.8) 19,558 (51.0)351 (48.0)
Race/ethnicity 0.693
   White37,9841809 (97.1)24,259 (97.3)11,916 (97.2) 37,295 (97.3)689 (94.2)<0.001
   Non-white106355 (2.9)667 (2.7)341 (2.8) 1021 (2.7)42 (5.8)
Education level (years) <0.001 0.011
   ≤1013,759839 (45.0)9382 (37.7)3538 (28.9) 13,470 (35.1)289 (39.5)
   11–125197259 (13.9)3270 (13.1)1668 (13.6) 5091 (13.3)106 (14.5)
   >1220,091766 (41.1)12,274 (49.2)7051 (57.5) 19,755 (51.6)336 (46.0)
Income level (£) <0.001 <0.001
   Less than 18,0002928187 (10.0)1940 (7.8)801 (6.5) 2792 (7.2)136 (18.6)
   18,000 to 30,9997465421 (22.6)5045 (20.2)1999 (16.3) 7267 (19.0)198 (27.1)
   31,000 to 51,99911,715606 (32.5)7671 (30.8)3438 (28.1) 11,492 (30.0)223 (30.5)
   Greater than 52,00016,939650 (34.9)10,270 (41.2)6019 (49.1) 16,765 (43.8)174 (23.8)
Alcohol status <0.001 <0.001
   Never90527 (1.5)530 (2.1)348 (2.8) 887 (2.3)18 (2.5)
   Previous82156 (3.0)532 (2.1)233 (1.9) 791 (2.1)30 (4.1)
   Current37,3211781 (95.5)23,864 (95.8)11,676 (95.3) 36,638 (95.6)683 (93.4)
Physical Frailty Phenotype<0.001 <0.001
   Non-frail15,833502 (26.9)9575 (38.4)5756 (47.0) 15,617 (40.8)216 (29.6)
   Pre-frail21,8851192 (64.0)14,390 (57.7)6303 (51.4) 21,432 (55.9)453 (62.0)
   Frail1329170 (9.1)961 (3.9)198 (1.6) 1267 (3.3)62 (8.4)
Frailty Index <0.001 <0.001
   Robust10,235300 (16.1)6090 (24.4)3845 (31.4) 10,144 (26.4)91 (12.4)
   Pre-frail23,1131190 (63.8)15,040 (60.4)6883 (56.2) 22,633 (59.1)480 (65.7)
   Frail5699374 (20.1)3796 (15.2)1529 (12.4) 5539 (14.5)160 (21.9)
Abbreviations: N, number of participants; SD, standard deviation. * Calculated by using the t-test or chi-square test.
Table 2. Hazard ratios (HRs) and 95%CIs for physical frailty and comprehensive frailty by LS7 score and psychosocial health factors.
Physical FrailtyComprehensive Frailty
Events/NAll ParticipantsWomenMenEvents/NAll ParticipantsWomenMen
LS7 score (lifestyle score + biometric score)
 Poor170/18641.001.001.00374/18641.001.001.00
 Intermediate961/24,9260.64 (0.54, 0.77) *0.64 (0.49, 0.83) *0.65 (0.51, 0.82) *3796/24,9260.77 (0.69, 0.86) *0.81 (0.68, 0.96) *0.75 (0.66, 0.86) *
 Optimal198/12,2570.31 (0.25, 0.39) *0.30 (0.22, 0.42) *0.31 (0.22, 0.44) *1529/12,2570.62 (0.55, 0.69) *0.63 (0.52, 0.75) *0.62 (0.53, 0.72) *
Lifestyle score
  Poor112/12531.001.001.00252/12531.001.001.00
  Intermediate1069/27,1620.57 (0.47, 0.70) *0.59 (0.44, 0.80) *0.55 (0.42, 0.72) *4097/27,1620.78 (0.69, 0.89) *0.87 (0.70, 1.08)0.73 (0.62, 0.85) *
  Optimal148/10,6320.23 (0.18, 0.30) *0.26 (0.18, 0.37) *0.19 (0.13, 0.29) *1350/10,6320.65 (0.56, 0.74) *0.72 (0.58, 0.90) *0.60 (0.51, 0.72) *
  Smoking status
   Poor126/24521.001.001.00381/24521.001.001.00
   Intermediate503/13,0490.80 (0.65, 0.97) *0.62 (0.47, 0.82) *0.99 (0.74, 1.32)2083/13,0491.09 (0.97, 1.21)1.14 (0.96, 1.35)1.04 (0.90, 1.20)
   Optimal700/23,5460.73 (0.60, 0.88) *0.65 (0.50, 0.84) *0.79 (0.59, 1.06)3235/23,5460.97 (0.87, 1.08)1.03 (0.87, 1.22)0.91 (0.79, 1.05)
  BMI
   Poor591/73061.001.001.001317/73061.001.001.00
   Intermediate495/16,5770.47 (0.42, 0.54) *0.46 (0.39, 0.55) *0.48 (0.40, 0.58) *2395/16,5770.83 (0.77, 0.89) *0.77 (0.70, 0.86) *0.88 (0.80, 0.97) *
   Optimal243/15,1640.26 (0.22, 0.31) *0.24 (0.19, 0.29) *0.31 (0.24, 0.41) *1987/15,1640.75 (0.69, 0.81) *0.70 (0.63, 0.77) *0.82 (0.73, 0.91) *
  Diet
   Poor125/33991.001.001.00514/33991.001.001.00
   Intermediate1118/33,0800.89 (0.74, 1.07)0.90 (0.69, 1.18)0.86 (0.66, 1.12)4808/33,0800.91 (0.83, 0.99) *0.94 (0.82, 1.08)0.88 (0.78, 0.99) *
   Optimal86/25680.74 (0.56, 0.98) *0.68 (0.45, 1.04)0.76 (0.52, 1.10)377/25680.83 (0.73, 0.95) *0.90 (0.73, 1.10)0.79 (0.66, 0.94) *
  Physical activity
   Poor222/35721.001.001.00618/35721.001.001.00
   Intermediate1038/31,6690.70 (0.61, 0.81) *0.77 (0.63, 0.95) *0.64 (0.52, 0.80) *4559/31,6690.90 (0.83, 0.98) *0.91 (0.80, 1.02)0.89 (0.79, 1.00)
   Optimal69/38060.43 (0.33, 0.57) *0.50 (0.34, 0.74) *0.39 (0.27, 0.58) *522/38060.90 (0.80, 1.02)0.89 (0.75, 1.07)0.91 (0.77, 1.06)
Biometric score
  Poor53/6981.001.001.00125/6981.001.001.00
  Intermediate606/14,5710.95 (0.71, 1.28)0.99 (0.63, 1.54)0.95 (0.64, 1.41)2259/14,5710.91 (0.76, 1.09)0.88 (0.66, 1.17)0.95 (0.75, 1.20)
  Optimal670/23,7780.89 (0.66, 1.21)0.87 (0.55, 1.38)0.92 (0.61, 1.38)3315/23,7780.84 (0.70, 1.01)0.79 (0.60, 1.04)0.89 (0.71, 1.13)
  Blood pressure
   Poor365/91431.001.001.001385/91431.001.001.00
   Intermediate802/23,5551.03 (0.91, 1.18)0.91 (0.76, 1.09)1.16 (0.97, 1.40)3481/23,5551.02 (0.96, 1.09)0.98 (0.89, 1.07)1.07 (0.98, 1.16)
   Optimal162/63491.18 (0.96, 1.45)1.04 (0.81, 1.34)1.27 (0.85, 1.89)833/63490.98 (0.89, 1.07)0.95 (0.85, 1.07)0.94 (0.80, 1.11)
  Cholesterol levels (LDL)
   Poor325/93631.001.001.001358/93631.001.001.00
   Intermediate737/18,0681.07 (0.93, 1.22)0.97 (0.81, 1.16)1.19 (0.96, 1.47)2855/18,0681.07 (1.00, 1.14)1.04 (0.94, 1.14)1.09 (0.99, 1.20)
   Optimal267/11,6160.91 (0.77, 1.07)0.92 (0.74, 1.13)0.83 (0.63, 1.11)1486/11,6160.94 (0.87, 1.01)0.92 (0.83, 1.02)0.93 (0.83, 1.04)
  Glycemic status (HbA1c)
   Poor86/7801.001.001.00175/7801.001.001.00
   Intermediate255/43560.97 (0.74, 1.27)1.05 (0.68, 1.62)0.94 (0.67, 1.34)770/43560.84 (0.71, 0.99) *0.90 (0.68, 1.19)0.82 (0.67, 1.01)
   Optimal988/33,9110.85 (0.64, 1.14)1.06 (0.67, 1.69)0.70 (0.48, 1.02)4754/33,9110.72 (0.62, 0.84) *0.78 (0.60, 1.02)0.70 (0.58, 0.85) *
Psychosocial health status (social isolation + loneliness)
 Good1267/38,3161.001.001.005539/38,3161.001.001.00
 Poor62/7311.87 (1.44, 2.43) *1.47 (1.01, 2.15) *2.43 (1.68, 3.50) *160/7311.46 (1.24, 1.71) *1.32 (1.04, 1.67) *1.59 (1.28, 1.97) *
Social isolation
  No1182/36,1931.001.001.005192/36,1931.001.001.00
  Yes147/28541.29 (1.08, 1.54) *1.10 (0.85, 1.43)1.48 (1.16, 1.89) *507/28541.19 (1.09, 1.31) *1.27 (1.11, 1.45) *1.13 (0.99, 1.28)
Loneliness
  No1013/33,6281.001.001.004771/33,6281.001.001.00
  Yes316/54191.67 (1.46, 1.90) *1.68 (1.42, 1.99) *1.65 (1.34, 2.00) *928/54191.20 (1.11, 1.28) *1.18 (1.07, 1.30) *1.23 (1.11, 1.38) *
All models were adjusted for age, race, education, income, alcohol status, psychosocial health (for LS7 score, and its composition), the lifestyle score (for biometric score), biometric score (for lifestyle score), and LS7 score (for psychosocial health, and its composition). Physical frailty was additionally adjusted for diabetes status, family history of CVD, stroke status, hypertension status, and CVD status. Abbreviations: BMI, body mass index; HbA1c, glycated hemoglobin A1c; LDL, low-density lipoprotein. * p < 0.05.
Table 3. Hazard ratios (HRs) and 95%CIs for hospital frailty according to LS7 levels and psychosocial health factors a.
Events/NAll ParticipantsWomenMen
LS7 score (lifestyle score + biometric score)
 Poor3713/36,8471.001.001.00
 Intermediate13,020/250,1410.60 (0.58, 0.62) *0.59 (0.55, 0.62) *0.60 (0.58, 0.63) *
 Optimal2004/79,5820.39 (0.37, 0.41) *0.35 (0.32, 0.38) *0.43 (0.40, 0.46) *
Lifestyle score
  Poor2884/31,9071.001.001.00
  Intermediate13,900/270,8790.64 (0.62, 0.67) *0.61 (0.57, 0.65) *0.66 (0.63, 0.70) *
  Optimal1953/63,7840.43 (0.41, 0.46) *0.42 (0.38, 0.45) *0.45 (0.41, 0.49) *
  Smoking status
   Poor2971/36,9871.001.001.00
   Intermediate7993/129,0520.76 (0.73, 0.80) *0.70 (0.66, 0.75) *0.82 (0.77, 0.87) *
   Optimal7823/200,5310.58 (0.56, 0.61) *0.55 (0.52, 0.59) *0.61 (0.58, 0.65) *
  BMI
   Poor6794/88,6951.001.001.00
   Intermediate7159/154,7430.75 (0.72, 0.78) *0.74 (0.70, 0.78) *0.76 (0.73, 0.80) *
   Optimal4784/123,1320.77 (0.74, 0.80) *0.71 (0.67, 0.75) *0.84 (0.79, 0.89) *
  Diet
   Poor5735/110,6201.001.001.00
   Intermediate12,712/249,8190.94 (0.91, 0.97) *0.97 (0.92, 1.02)0.92 (0.88, 0.96) *
   Optimal290/61310.69 (0.62, 0.78) *0.81 (0.68, 0.98) *0.62 (0.53, 0.72) *
  Physical activity
   Poor2952/38,5061.001.001.00
   Intermediate13,445/284,3830.76 (0.73, 0.79) *0.73 (0.69, 0.78) *0.78 (0.74, 0.82) *
   Optimal2340/43,6810.78 (0.73, 0.82) *0.81 (0.74, 0.88) *0.76 (0.71, 0.82) *
Biometric score
  Poor1139/10,1261.001.001.00
  Intermediate9357/150,3710.65 (0.61, 0.69) *0.62 (0.57, 0.68) *0.67 (0.61, 0.72) *
  Optimal8241/206,0730.55 (0.52, 0.59) *0.50 (0.46, 0.55) *0.59 (0.55, 0.65) *
  Blood pressure
   Poor6221/97,8631.001.001.00
   Intermediate11,163/217,4990.93 (0.90, 0.96) *0.89 (0.85, 0.93) *0.95 (0.91, 0.99) *
   Optimal1353/51,2080.74 (0.70, 0.79) *0.65 (0.60, 0.70) *0.92 (0.84, 1.01)
  Cholesterol levels (LDL)
   Poor3538/89,3531.001.001.00
   Intermediate11,043/171,9761.42 (1.36, 1.47) *1.32 (1.26, 1.39) *1.55 (1.46, 1.64) *
   Optimal4156/105,2411.32 (1.26, 1.38) *1.16 (1.08, 1.23) *1.51 (1.41, 1.61) *
  Glycemic status (HbA1c)
   Poor2395/14,8671.001.001.00
   Intermediate4262/53,5090.59 (0.56, 0.62) *0.56 (0.51, 0.60) *0.62 (0.58, 0.66) *
   Optimal12,080/298,1940.42 (0.40, 0.44) *0.41 (0.38, 0.44) *0.43 (0.40, 0.45) *
Psychosocial health (social isolation + loneliness)
 Good17,595/355,7211.001.001.00
 Poor1142/10,8491.53 (1.44, 1.62) *1.52 (1.39, 1.66) *1.54 (1.41, 1.68) *
Social isolation
  No16,046/334,2321.001.001.00
  Yes2691/32,3381.36 (1.31, 1.42) *1.36 (1.28, 1.45) *1.37 (1.29, 1.45) *
Loneliness
  No14,082/301,2191.001.001.00
  Yes4655/65,3511.40 (1.35, 1.45) *1.36 (1.30, 1.43) *1.45 (1.38, 1.52) *
a Adjusted for sex, age, race, education, income, alcohol status, psychosocial health (for LS7 score, lifestyle score, biometric score, and its composition), the lifestyle score (for biometric score), biometric score (for lifestyle score), and LS7 score (for social isolation, loneliness, and psychosocial health). * p < 0.05.
Disclaimer/Publisher’s Note: The statements, opinions and data contained in all publications are solely those of the individual author(s) and contributor(s) and not of MDPI and/or the editor(s). MDPI and/or the editor(s) disclaim responsibility for any injury to people or property resulting from any ideas, methods, instructions or products referred to in the content.

