
Different Dietary Ratios of Camelina Oil to Sandeel Oil Influence the Capacity to Synthesise and Deposit EPA and DHA in Zucker Fa/Fa Rats
 ,
,
Abstract
:1. Introduction
2. Materials and Methods
2.1. Animals, Diets, and Feeding Trial
2.2. Analyses in Serum and Plasma
2.3. Extraction of Total Lipids
2.4. Analyses of Fatty Acid Composition in Diets and Blood Cells
2.5. Analyses of Fat Content and Fatty Acid Composition in Liver and Heart
2.6. Analyses of Gene Expression
2.7. Statistics
3. Results
3.1. Fat, Energy, and Fatty Acid Composition of the Diets
3.2. Biometric Data
3.3. Plasma and Serum Parameters
3.4. Fat Content in the Liver and Heart
3.5. Fatty Acid Composition
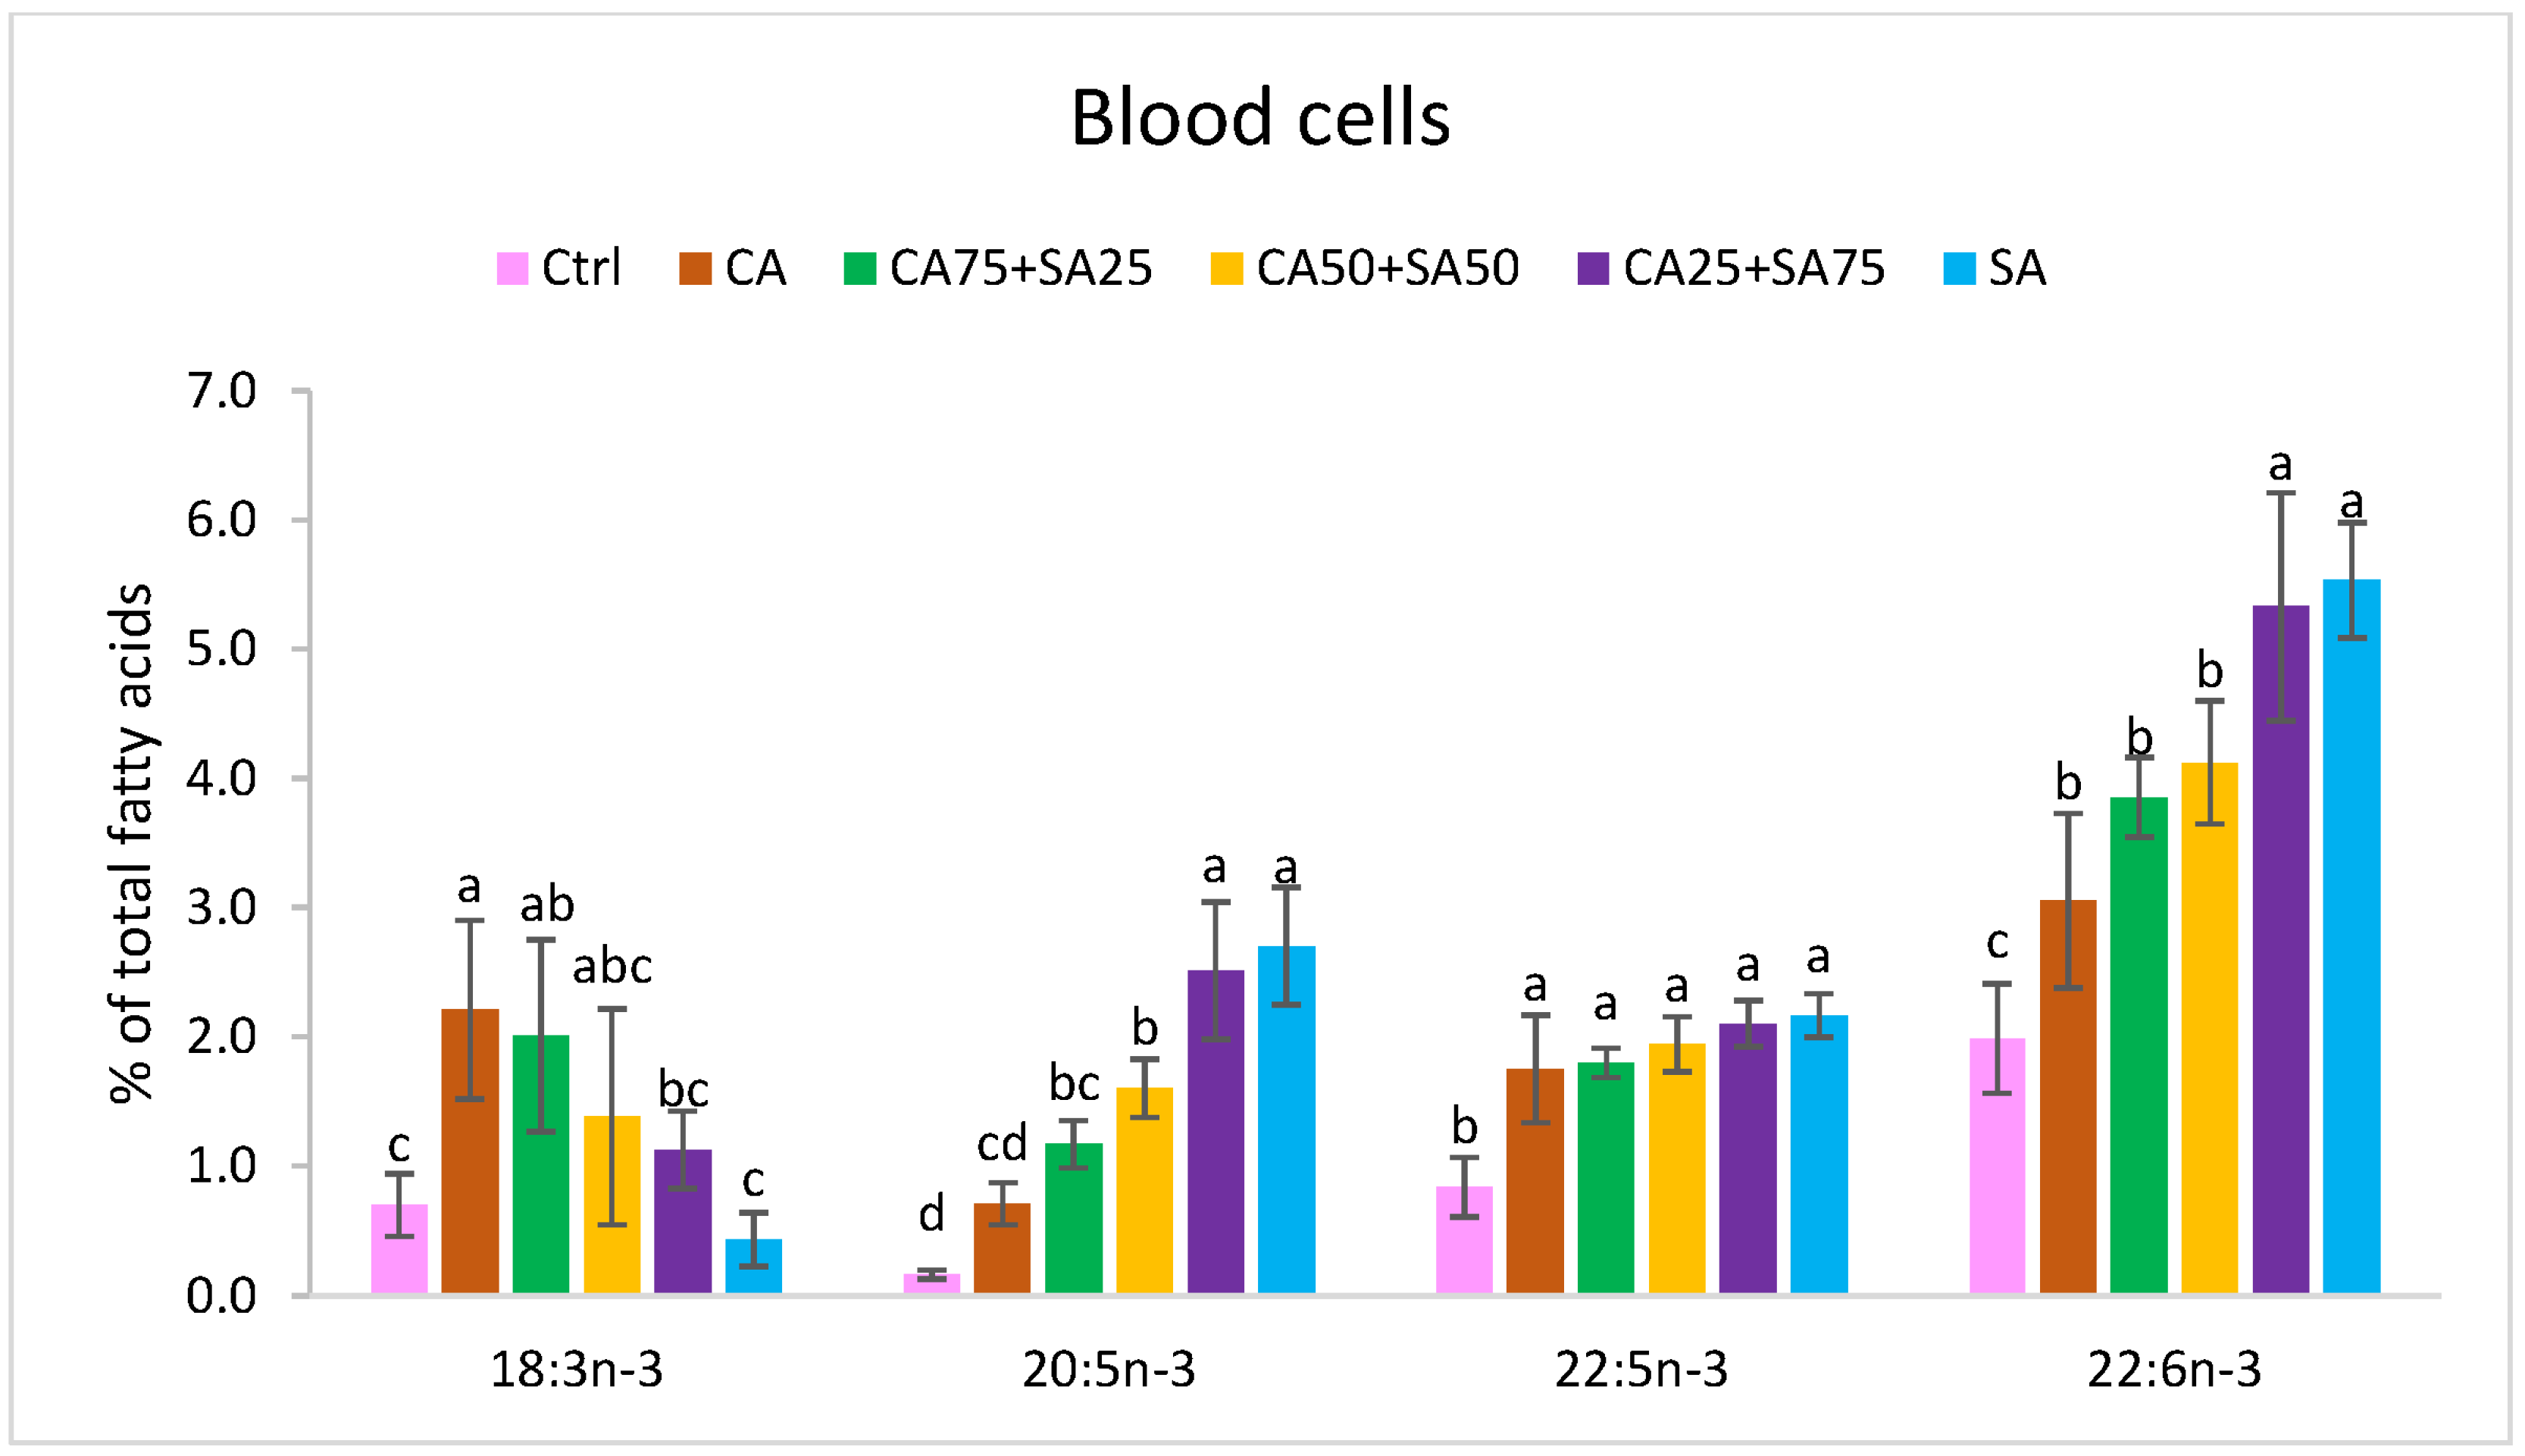
3.5.1. Blood Cells
3.5.2. Liver
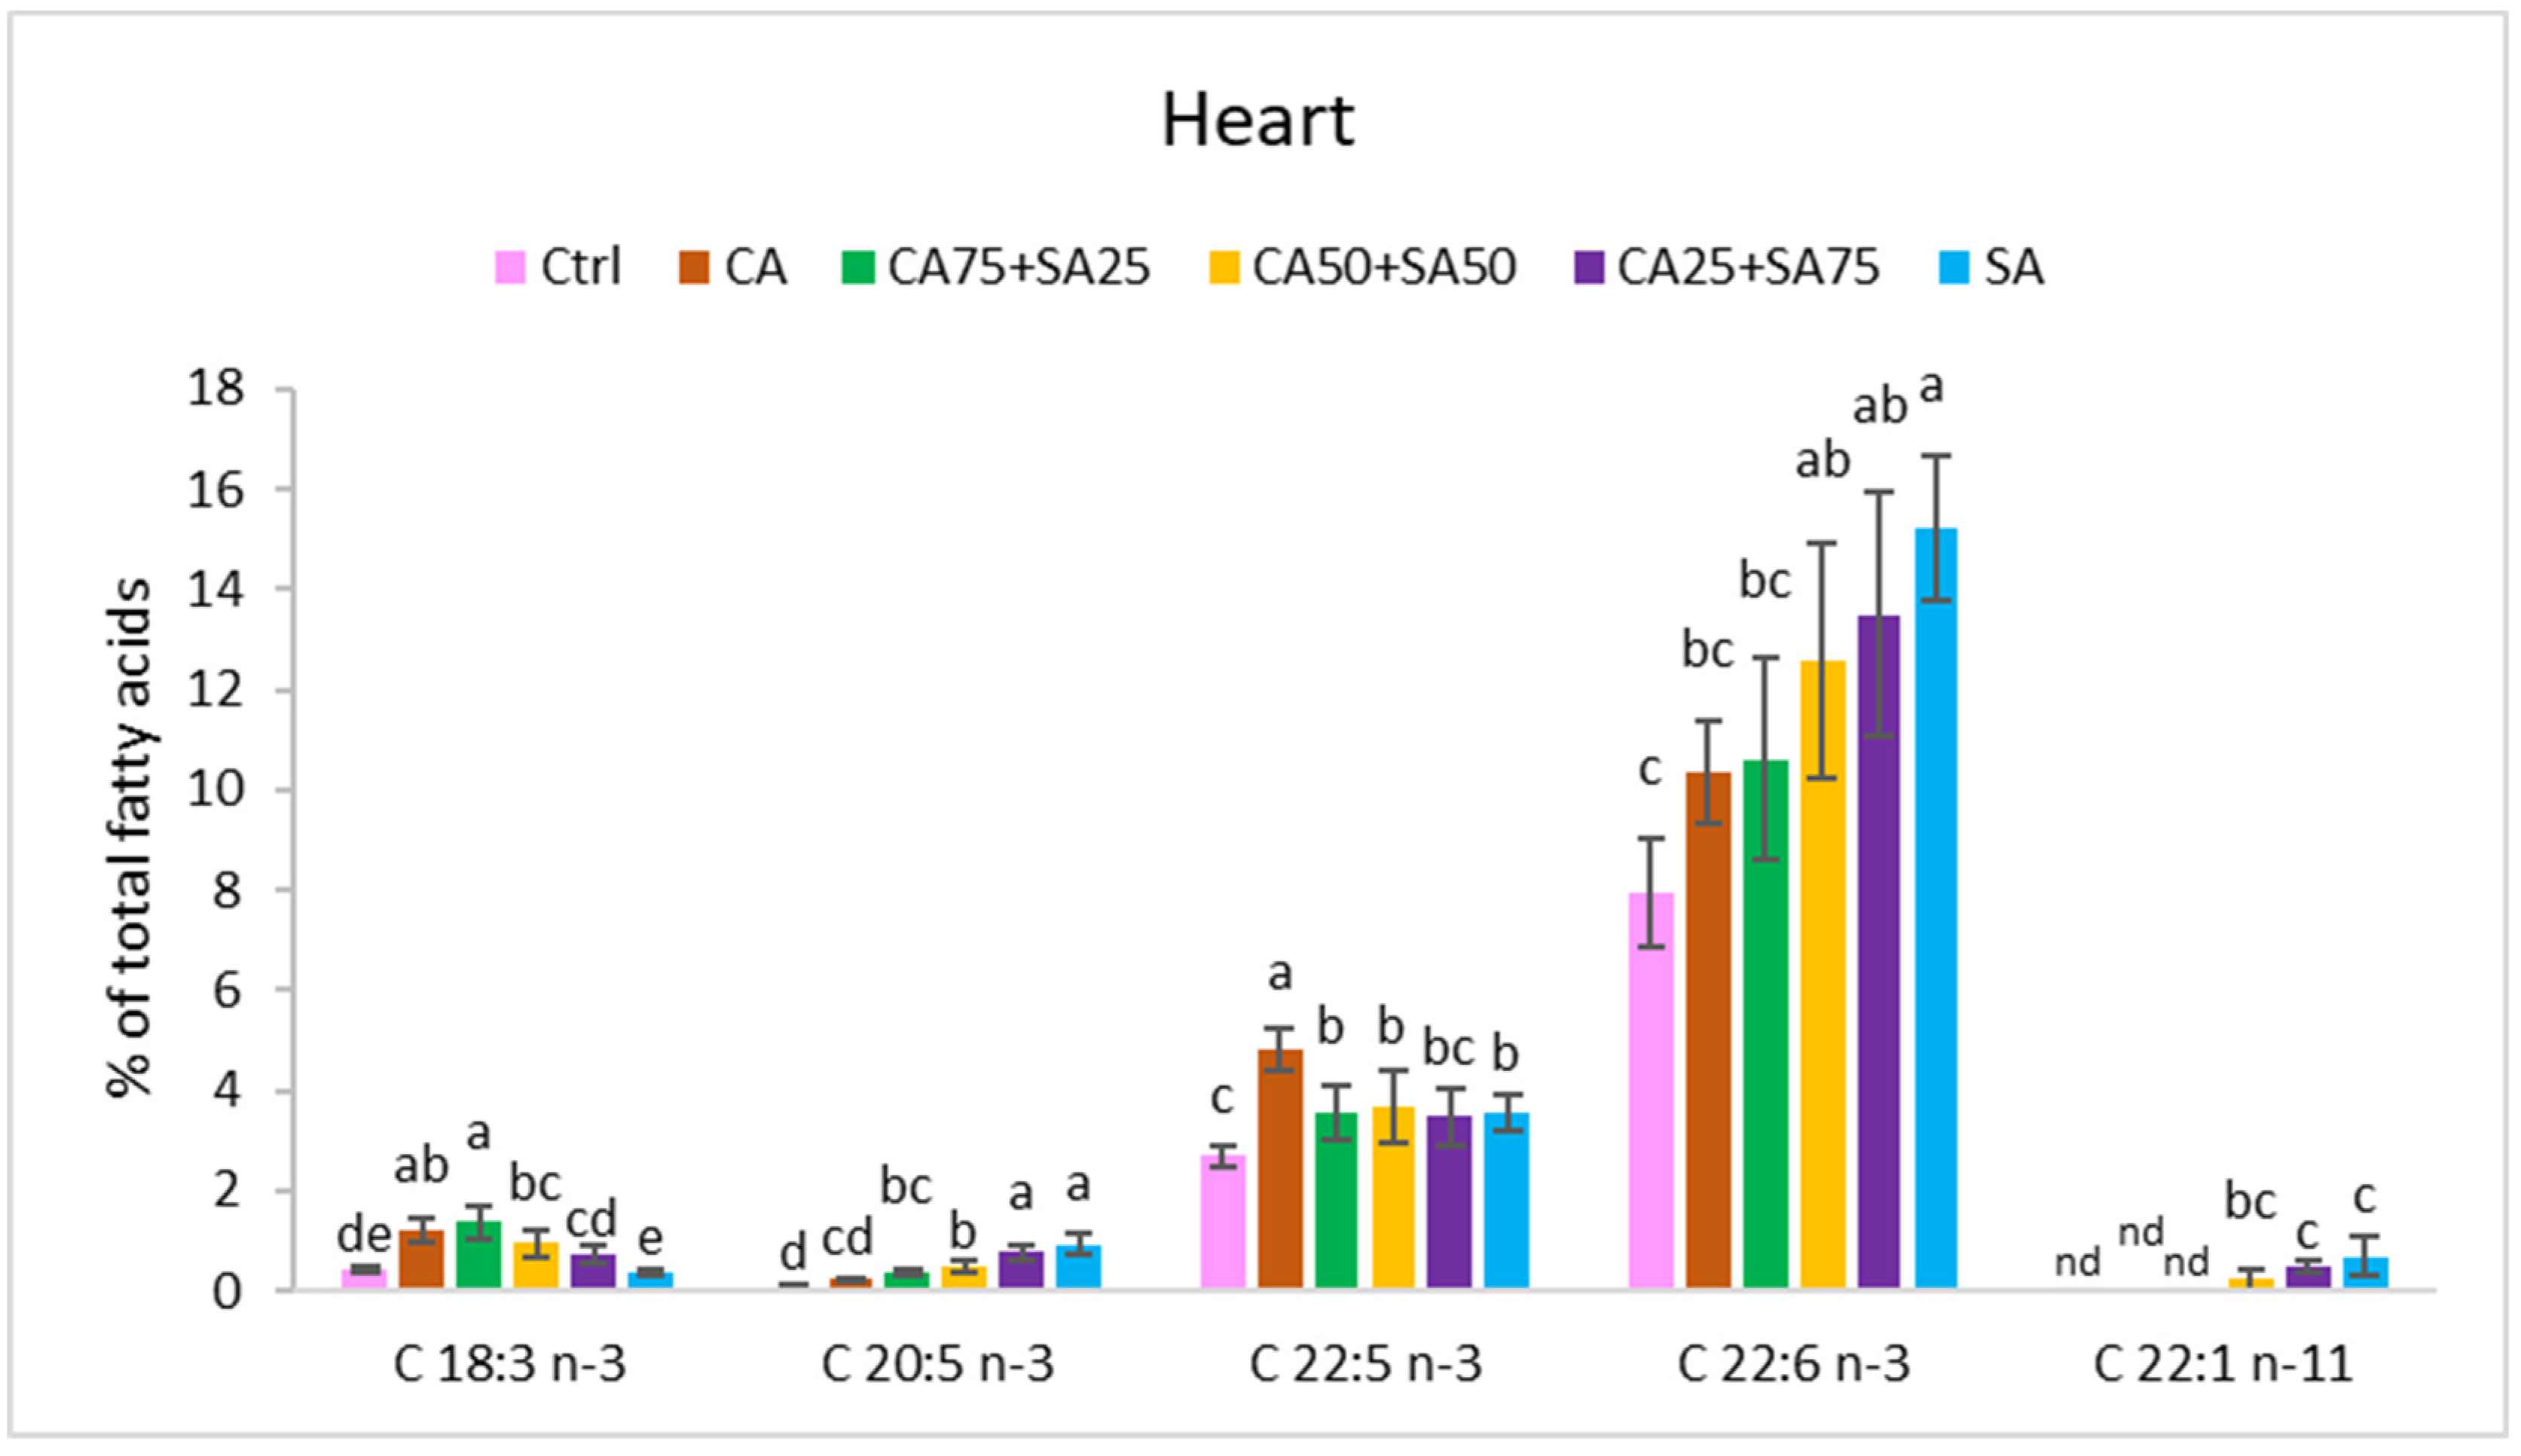
3.5.3. Heart
3.6. Gene Expression of Enzymes of the n-3 Fatty Acid Pathway in the Liver
4. Discussion
5. Conclusions
Supplementary Materials
Author Contributions
Funding
Institutional Review Board Statement
Informed Consent Statement
Data Availability Statement
Acknowledgments
Conflicts of Interest
References
- Das, U. Biological significance of essential fatty acids. J.-Assoc. Physicians India 2006, 54, 309. [Google Scholar] [PubMed]
- Calder, P.C. Very long chain omega-3 (n-3) fatty acids and human health. Eur. J. Lipid Sci. Technol. 2014, 116, 1280–1300. [Google Scholar] [CrossRef]
- Schwab, U.; Lauritzen, L.; Tholstrup, T.; Haldorsson, T.I.; Riserus, U.; Uusitupa, M.; Becker, W. Effect of the amount and type of dietary fat on cardiometabolic risk factors and risk of developing type 2 diabetes, cardiovascular diseases, and cancer: A systematic review. Food Nutr. Res. 2014, 58, 25145. [Google Scholar] [CrossRef] [PubMed]
- Domenichiello, A.F.; Chen, C.T.; Trepanier, M.-O.; Stavro, P.M.; Bazinet, R.P. Whole body synthesis rates of DHA from α-linolenic acid are greater than brain DHA accretion and uptake rates in adult rats. J. Lipid Res. 2014, 55, 62–74. [Google Scholar] [CrossRef]
- Huang, T.; Yu, X.; Shou, T.; Wahlqvist, M.L.; Li, D. Associations of plasma phospholipid fatty acids with plasma homocysteine in Chinese vegetarians. Br. J. Nutr. 2013, 109, 1688–1694. [Google Scholar] [CrossRef]
- Burdge, G.C.; Jones, A.E.; Wootton, S.A. Eicosapentaenoic and docosapentaenoic acids are the principal products of α-linolenic acid metabolism in young men. Br. J. Nutr. 2002, 88, 355–363. [Google Scholar] [CrossRef]
- Burdge, G.C.; Wootton, S.A. Conversion of α-linolenic acid to eicosapentaenoic, docosapentaenoic and docosahexaenoic acids in young women. Br. J. Nutr. 2002, 88, 411–420. [Google Scholar] [CrossRef]
- Sprecher, H. Metabolism of highly unsaturated n-3 and n-6 fatty acids. Biochim. Biophys. Acta 2000, 1486, 219–231. [Google Scholar] [CrossRef]
- Zhang, J.Y.; Kothapalli, K.S.; Brenna, J.T. Desaturase and elongase limiting endogenous long chain polyunsaturated fatty acid biosynthesis. Curr. Opin. Clin. Nutr. Metab. Care 2016, 19, 103. [Google Scholar] [CrossRef]
- Wang, Y.; Botolin, D.; Christian, B.; Busik, J.; Xu, J.; Jump, D.B. Tissue-specific, nutritional, and developmental regulation of rat fatty acid elongases. J. Lipid Res. 2005, 46, 706–715. [Google Scholar] [CrossRef]
- Hastings, N.; Agaba, M.K.; Tocher, D.R.; Zheng, X.; Dickson, C.A.; Dick, J.R.; Teale, A.J. Molecular cloning and functional characterization of fatty acyl desaturase and elongase cDNAs involved in the production of eicosapentaenoic and docosahexaenoic acids from α-linolenic acid in Atlantic salmon (Salmo salar). Mar. Biotechnol. 2004, 6, 463–474. [Google Scholar] [CrossRef]
- Monroig, Ó.; Zheng, X.; Morais, S.; Leaver, M.J.; Taggart, J.B.; Tocher, D.R. Multiple genes for functional∆ 6 fatty acyl desaturases (Fad) in Atlantic salmon (Salmo salar L.): Gene and cDNA characterization, functional expression, tissue distribution and nutritional regulation. Biochim. Biophys. Acta 2010, 1801, 1072–1081. [Google Scholar] [CrossRef]
- Cho, H.P.; Nakamura, M.; Clarke, S.D. Cloning, expression, and fatty acid regulation of the human Δ-5 desaturase. J. Biol. Chem. 1999, 274, 37335–37339. [Google Scholar] [CrossRef]
- Cho, H.P.; Nakamura, M.T.; Clarke, S.D. Cloning, expression, and nutritional regulation of the mammalian Δ-6 desaturase. J. Biol. Chem. 1999, 274, 471–477. [Google Scholar] [CrossRef]
- Jakobsson, A.; Westerberg, R.; Jacobsson, A. Fatty acid elongases in mammals: Their regulation and roles in metabolism. Prog. Lipid Res. 2006, 45, 237–249. [Google Scholar] [CrossRef]
- Marquardt, A.; Stöhr, H.; White, K.; Weber, B.H. cDNA cloning, genomic structure, and chromosomal localization of three members of the human fatty acid desaturase family. Genomics 2000, 66, 175–183. [Google Scholar] [CrossRef]
- Burdge, G.C.; Calder, P.C. Conversion of alpha-linolenic acid to longer-chain polyunsaturated fatty acids in human adults. Reprod. Nutr. Dev. 2005, 45, 581–597. [Google Scholar] [CrossRef]
- Torstensen, B.E.; Bell, J.G.; Rosenlund, G.; Henderson, R.J.; Graff, I.E.; Tocher, D.R.; Lie, O.; Sargent, J.R. Tailoring of Atlantic salmon (Salmo salar L.) flesh lipid composition and sensory quality by replacing fish oil with a vegetable oil blend. J. Agric. Food Chem. 2005, 53, 10166–10178. [Google Scholar] [CrossRef]
- Berge, G.M.; Østbye, T.-K.; Kjær, M.; Sonesson, A.; Mørkøre, T.; Ruyter, B. Betydningen av Genetisk Bakgrunn og Ulike Nivåer Av Omega-3-Fettsyrer I fôr I Tidlige Livsfaser for Fiskehelse, Fettsyresammensetning Og Muskelkvalitet ved Slaktestørrelse; FHF-Prosjekt 900770–Delrapport 2; Nofima: Tromsø, Norway, 2015. [Google Scholar]
- Østbye, T.-K.K.; Berge, G.M.; Sonesson, A.K.; Krasnov, A.; Ruyter, B. Kan Forlenget Opphold I Ferskvann, Før Overføring til Saltvann, Påvirke Laksens Kapasitet til å Omdanne 18: 3 n-3 til EPA og DHA? FHF-Prosjekt 900770–Delrapport 3; Nofima: Tromsø, Norway, 2015. [Google Scholar]
- Ruyter, B.; Østbye, T.-K.K.; Kjær, M.A.; Sonesson, A.K.; Mørkøre, T.; Berge, G.M. Kan Nivå av EPA og DHA I fôr I Tidlige Livsfaser Påvirke Laksens Helse Og Sammensetning I Seinere Livsfaser? FHF-Prosjekt 900770–Delrapport 1; Nofima: Tromsø, Norway, 2015. [Google Scholar]
- Rosenlund, G.; Obach, A.; Sandberg, M.G.; Standal, H.; Tveit, K. Effect of alternative lipid sources on long-term growth performance and quality of Atlantic salmon (Salmo salar L.). Aquacult. Res. 2001, 32, 323–328. [Google Scholar] [CrossRef]
- Bell, J.G.; Henderson, R.J.; Tocher, D.R.; McGhee, F.; Dick, J.R.; Porter, A.; Smullen, R.P.; Sargent, J.R. Substituting fish oil with crude palm oil in the diet of Atlantic salmon (Salmo salar) affects muscle fatty acid composition and hepatic fatty acid metabolism. J. Nutr. 2002, 132, 222–230. [Google Scholar] [CrossRef]
- Bačová, B.; Seč, P.; Čertik, M.; Tribulova, N. Intake of n-3 polyunsaturated fatty acids increases omega-3 index in aged male and female spontaneously hypertensive rats. Int. Sch. Res. Not. 2013, 2013, 209360. [Google Scholar] [CrossRef] [PubMed]
- Domenichiello, A.F.; Kitson, A.P.; Metherel, A.H.; Chen, C.T.; Hopperton, K.E.; Stavro, P.M.; Bazinet, R.P. Whole-body docosahexaenoic acid synthesis-secretion rates in rats are constant across a large range of dietary α-linolenic acid intakes. J. Nutr. 2017, 147, 37–44. [Google Scholar] [CrossRef] [PubMed]
- Czyż, K.; Sokoła-Wysoczańska, E.; Bodkowski, R.; Cholewińska, P.; Wyrostek, A. Dietary Omega-3 Source Effect on the Fatty Acid Profile of Intramuscular and Perimuscular Fat—Preliminary Study on a Rat Model. Nutrients 2020, 12, 3382. [Google Scholar] [CrossRef] [PubMed]
- Gibson, R.; Neumann, M.; Lien, E.; Boyd, K.; Tu, W.-C. Docosahexaenoic acid synthesis from alpha-linolenic acid is inhibited by diets high in polyunsaturated fatty acids. Prostaglandins Leukot. Essent. Fat. Acids 2013, 88, 139–146. [Google Scholar] [CrossRef] [PubMed]
- Domenichiello, A.F.; Kitson, A.P.; Chen, C.T.; Trépanier, M.-O.; Stavro, P.M.; Bazinet, R.P. The effect of linoleic acid on the whole body synthesis rates of polyunsaturated fatty acids from α-linolenic acid and linoleic acid in free-living rats. J. Nutr. Biochem. 2016, 30, 167–176. [Google Scholar] [CrossRef]
- Thomassen, M.S.; Rein, D.; Berge, G.M.; Østbye, T.-K.; Ruyter, B. High dietary EPA does not inhibit∆ 5 and∆ 6 desaturases in Atlantic salmon (Salmo salar L.) fed rapeseed oil diets. Aquaculture 2012, 360, 78–85. [Google Scholar] [CrossRef]
- Pawlosky, R.J.; Hibbeln, J.R.; Lin, Y.; Goodson, S.; Riggs, P.; Sebring, N.; Brown, G.L.; Salem, N. Effects of beef-and fish-based diets on the kinetics of n − 3 fatty acid metabolism in human subjects. Am. J. Clin. Nutr. 2003, 77, 565–572. [Google Scholar] [CrossRef]
- Emken, E.; Adlof, R.; Duval, S.; Nelson, G. Effect of dietary docosahexaenoic acid on desaturation and uptake in vivo of isotope-labeled oleic, linoleic, and linolenic acids by male subjects. Lipids 1999, 34, 785–791. [Google Scholar] [CrossRef]
- Bou, M.; Berge, G.M.; Baeverfjord, G.; Sigholt, T.; Østbye, T.-K.; Romarheim, O.H.; Hatlen, B.; Leeuwis, R.; Venegas, C.; Ruyter, B. Requirements of n-3 very long-chain PUFA in Atlantic salmon (Salmo salar L): Effects of different dietary levels of EPA and DHA on fish performance and tissue composition and integrity. Br. J. Nutr. 2017, 117, 30–47. [Google Scholar] [CrossRef]
- Bou, M.; Berge, G.M.; Baeverfjord, G.; Sigholt, T.; Østbye, T.-K.; Ruyter, B. Low levels of very-long-chain n-3 PUFA in Atlantic salmon (Salmo salar) diet reduce fish robustness under challenging conditions in sea cages. J. Nutr. Sci. 2017, 6, e32. [Google Scholar] [CrossRef]
- Ruyter, B.; Thomassen, M.S. Metabolism of n-3 and n-6 fatty acids in Atlantic salmon liver: Stimulation by essential fatty acid deficiency. Lipids 1999, 34, 1167–1176. [Google Scholar] [CrossRef]
- Appelqvist, L.-Å. Composition of seeds of cruciferous oil crops. J. Am. Oil Chem. Soc. 1971, 48, 851–859. [Google Scholar] [CrossRef]
- Zubr, J. Oil-seed crop: Camelina sativa. Ind. Crops Prod. 1997, 6, 113–119. [Google Scholar] [CrossRef]
- Hatt, G. Landbrug i Danmarks Oldtid. Utdvalget for Folkeoplysnings Fremme; Geografisk Tidsskrift: København, Denmark, 1937. [Google Scholar]
- Hrastar, R.; Abramovič, H.; Košir, I.J. In situ quality evaluation of Camelina sativa landrace. Eur. J. Lipid Sci. Technol. 2012, 114, 343–351. [Google Scholar] [CrossRef]
- Turchini, G.M.; Ng, W.-K.; Tocher, D.R. Fish Oil Replacement and Alternative Lipid Sources in Aquaculture Feeds; CRC Press: Boca Raton, FL, USA, 2010. [Google Scholar] [CrossRef]
- Østbye, T.-K.K.; Berge, G.M.; Nilsson, A.; Romarheim, O.H.; Bou, M.; Ruyter, B. The long-chain monounsaturated cetoleic acid improves the efficiency of the n-3 fatty acid metabolic pathway in Atlantic salmon and human HepG2 cells. Br. J. Nutr. 2019, 122, 755–768. [Google Scholar] [CrossRef]
- Reeves, P.G.; Nielsen, F.H.; Fahey, G.C., Jr. AIN-93 purified diets for laboratory rodents: Final report of the American Institute of Nutrition ad hoc writing committee on the reformulation of the AIN-76A rodent diet. J. Nutr. 1993, 123, 1939–1951. [Google Scholar] [CrossRef]
- Folch, J.; Lees, M.; Sloane Stanley, G. A simple method for the isolation and purification of total lipides from animal tissues. J. Biol. Chem. 1957, 226, 497–509. [Google Scholar] [CrossRef]
- Christie, W. Lipid Analysis, 3rd ed.; Oily Press: Bridgewater, UK, 2003. [Google Scholar]
- Ghioni, C.; Bell, J.; Sargent, J. Polyunsaturated fatty acids in neutral lipids and phospholipids of some freshwater insects. Comp. Biochem. Physiol. Part B Biochem. Mol. Biol. 1996, 114, 161–170. [Google Scholar] [CrossRef]
- Mason, M.E.; Eager, M.E.; Waller, G.R. A Procedure for the Simultaneous Quantitative Determination of Glycerol and Fatty Acid Contents of Fats and Oils. Anal. Chem. 1964, 36, 587–590. [Google Scholar] [CrossRef]
- Hoshi, M.; Williams, M.; Kishimoto, Y. Esterification of fatty acids at room temperature by chloroform-methanolic HCl–cupric acetate. J. Lipid Res. 1973, 14, 599–601. [Google Scholar] [CrossRef]
- Xie, F.; Xiao, P.; Chen, D.; Xu, L.; Zhang, B. miRDeepFinder: A miRNA analysis tool for deep sequencing of plant small RNAs. Plant Mol. Biol. 2012, 80, 75–84. [Google Scholar] [CrossRef] [PubMed]
- Pfaffl, M.W. Quantification strategies in real-time PCR. In A–Z of Quantitative PCR; Bustin, S.A., Ed.; International University Line: La Jolla, CA, USA, 2004; pp. 87–120. [Google Scholar]
- WHO. Plant-Based Diets and Their Impact on Health, Sustainability and the Environment: A Review of the Evidence: WHO European Office for the Prevention and Control of Noncommunicable Diseases; WHO: Geneva, Switzerland, 2021; Document number: WHO/EURO:2021-4007-43766-61591. [Google Scholar]
- Hong, L.; Zahradka, P.; Cordero-Monroy, L.; Wright, B.; Taylor, C.G. Dietary docosahexaenoic acid (DHA) and eicosapentaenoic acid (EPA) operate by different mechanisms to modulate hepatic steatosis and hyperinsulemia in fa/fa Zucker rats. Nutrients 2019, 11, 917. [Google Scholar] [CrossRef] [PubMed]
- Blanchard, H.; Pédrono, F.; Boulier-Monthéan, N.; Catheline, D.; Rioux, V.; Legrand, P. Comparative effects of well-balanced diets enriched in α-linolenic or linoleic acids on LC-PUFA metabolism in rat tissues. Prostaglandins Leukot. Essent. Fat. Acids 2013, 88, 383–389. [Google Scholar] [CrossRef]
- Goyens, P.L.; Spilker, M.E.; Zock, P.L.; Katan, M.B.; Mensink, R.P. Conversion of α-linolenic acid in humans is influenced by the absolute amounts of α-linolenic acid and linoleic acid in the diet and not by their ratio. Am. J. Clin. Nutr. 2006, 84, 44–53. [Google Scholar] [CrossRef] [PubMed]
- Igarashi, M.; DeMar, J.C.; Ma, K.; Chang, L.; Bell, J.M.; Rapoport, S.I. Upregulated liver conversion of α-linolenic acid to docosahexaenoic acid in rats on a 15 week n-3 PUFA-deficient diets. J. Lipid Res. 2007, 48, 152–164. [Google Scholar] [CrossRef]
- Tu, W.-C.; Cook-Johnson, R.; James, M.; Mühlhäusler, B.; Gibson, R. Omega-3 long chain fatty acid synthesis is regulated more by substrate levels than gene expression. Prostaglandins Leukot. Essent. Fat. Acids 2010, 83, 61–68. [Google Scholar] [CrossRef]
- Jump, D.B.; Clarke, S.D. Regulation of gene expression by dietary fat. Annu. Rev. Nutr. 1999, 19, 63–90. [Google Scholar] [CrossRef]
- Tang, C.; Cho, H.P.; Nakamura, M.T.; Clarke, S.D. Regulation of human Δ-6 desaturase gene transcription: Identification of a functional direct repeat-1 element. J. Lipid Res. 2003, 44, 686–695. [Google Scholar] [CrossRef]
- Xu, J.; Nakamura, M.T.; Cho, H.P.; Clarke, S.D. Sterol regulatory element binding protein-1 expression is suppressed by dietary polyunsaturated fatty acids: A mechanism for the coordinate suppression of lipogenic genes by polyunsaturated fats. J. Biol. Chem. 1999, 274, 23577–23583. [Google Scholar] [CrossRef]
- Yamazaki, K.; Fujikawa, M.; Hamazaki, T.; Yano, S.; Shono, T. Comparison of the conversion rates of α-linolenic acid (18:3 (n − 3)) and stearidonic acid (18:4 (n − 3)) to longer polyunsaturated fatty acids in rats. Biochim. Biophys. Acta 1992, 1123, 18–26. [Google Scholar] [CrossRef]
- Kramer, J.; Sauer, F.; Wolynetz, M.; Farnworth, E.; Johnston, K. Effects of dietary saturated fat on erucic acid induced myocardial lipidosis in rats. Lipids 1992, 27, 619–623. [Google Scholar] [CrossRef]


| Ctrl | CA | CA75 + FO25 | CA50 + SA50 | CA25 + SA75 | SA | |
|---|---|---|---|---|---|---|
| Soybean Oil 1 | 120 | 50 | 50 | 50 | 50 | 50 |
| Sandeel Oil 2 | - | - | 17.5 | 35 | 52.5 | 70 |
| Camelina Oil 3 | - | 70 | 52.5 | 35 | 17.5 | - |
| Casein protein 4 | 232 | 232 | 232 | 232 | 232 | 232 |
| Corn starch 5 | 446 | 446 | 446 | 446 | 446 | 446 |
| Sucrose 5 | 90 | 90 | 90 | 90 | 90 | 90 |
| Cellulose 5 | 50 | 50 | 50 | 50 | 50 | 50 |
| Tert-butylhydroquinone 5 | 0.014 | 0.014 | 0.014 | 0.014 | 0.014 | 0.014 |
| Mineral Mix (AIN-93MX) 5 | 35 | 35 | 35 | 35 | 35 | 35 |
| Vitamin Mix (AIN-93VX) 5 | 10 | 10 | 10 | 10 | 10 | 10 |
| L-Methionine 5 | 1.6 | 1.6 | 1.6 | 1.6 | 1.6 | 1.6 |
| L-Cystine 5 | 3 | 3 | 3 | 3 | 3 | 3 |
| Choline Bitartrate 6 | 2.5 | 2.5 | 2.5 | 2.5 | 2.5 | 2.5 |
| Growth and Maintenance Supplement 7 | 10 | 10 | 10 | 10 | 10 | 10 |
| Energy content (kJ/g diet) | 19.8 | 19.5 | 19.8 | 19.8 | 19.8 | 19.8 |
| Total fat (g/100 g diet) | 11.3 | 11 | 10.7 | 11.2 | 10.8 | 11.3 |
| Ctrl | CA | CA75 + SA25 | CA50 + SA50 | CA25 + SA75 | SA | |
|---|---|---|---|---|---|---|
| C14:0 | 0.1 | 0.1 | 0.9 | 1.8 | 2.8 | 3.7 |
| C16:0 | 11.1 | 8.1 | 9.1 | 10.3 | 11.5 | 12.6 |
| C18:0 | 4.1 | 3.4 | 3.2 | 3.1 | 2.9 | 2.8 |
| C20:0 | 0.4 | 0.7 | 0.6 | 0.5 | 0.4 | 0.3 |
| Σ SFA | 15.7 | 12.2 | 13.9 | 15.6 | 17.5 | 19.3 |
| C16:1 n-7 | 0.1 | 0.1 | 1.0 | 1.9 | 3.0 | 3.8 |
| C18:1 n-9 | 19.8 | 17.5 | 16.3 | 15.1 | 13.5 | 12.4 |
| C18:1 n-7 | 1.5 | 1.2 | 1.3 | 1.4 | 1.5 | 1.6 |
| C20:1 n-9 | 0.3 | 6.0 | 6.1 | 5.9 | 6.0 | 5.7 |
| C22:1 n-11 | 0.0 | 0.0 | 2.1 | 4.2 | 6.7 | 8.7 |
| C22:1 n-9 | 0.0 | 0.7 | 0.7 | 0.7 | 0.7 | 0.7 |
| Σ MUFA | 21.7 | 25.6 | 27.4 | 29.1 | 31.4 | 32.9 |
| C18:2 n-6 | 55.0 | 34.2 | 31.6 | 29.5 | 26.4 | 24.8 |
| Σ n-6 PUFA | 55.0 | 34.2 | 31.6 | 29.5 | 26.4 | 24.8 |
| C18:3 n-3 | 6.9 | 25.3 | 20.3 | 15.0 | 9.3 | 3.7 |
| C18:4 n-3 | 0.0 | 0.0 | 0.7 | 1.2 | 2.0 | 2.5 |
| C20:5 n-3 | 0.0 | 0.0 | 1.5 | 2.9 | 4.7 | 6.0 |
| C21:5 n-3 | 0.0 | 0.0 | 0.1 | 0.2 | 0.3 | 0.4 |
| C22:5 n-3 | 0.0 | 0.0 | 0.1 | 0.2 | 0.4 | 0.5 |
| C22:6 n-3 | 0.0 | 0.0 | 1.3 | 2.5 | 4.1 | 5.3 |
| Σ n-3 PUFA | 6.9 | 25.3 | 23.9 | 22.1 | 20.7 | 18.3 |
| n-6/n-3 | 8.0 | 1.4 | 1.3 | 1.3 | 1.3 | 1.4 |
| Dietary Fatty Acids | ||||||
|---|---|---|---|---|---|---|
| 18:3n-3 | 20:5n-3 | 22:5n-3 | 22:6n-3 | 22:1n-11 | ||
| Blood | 18:3n-3 | 0.796 (<0.0001) | - | - | - | - |
| 20:5n-3 | 0.932 (<0.0001) | 0.931 (<0.0001) | 0.932 (<0.0001) | 0.931 (<0.0001) | ||
| 22:5n-3 | - | 0.686 (<0.0001) | 0.687 (<0.0001) | 0.686 (<0.0001) | 0.684 (<0.0001) | |
| 22:6n-3 | - | 0.883 (<0.0001) | 0.882 (<0.0001) | 0.883 (<0.0001) | 0.882 (<0.0001) | |
| Liver | 18:3n-3 | 0.931 (<0.0001) | - | - | - | |
| 20:3n-3 | 0.777 (<0.0001) | - | - | - | ||
| 20:5n-3 | - | 0.799 (<0.0001) | 0.800 (<0.0001) | 0.801 (<0.0001) | 0.801 (<0.0001) | |
| 22:5n-3 | - | 0.623 (<0.0001) | 0.626 (<0.0001) | 0.625 (<0.0001) | 0.626 (<0.0001) | |
| 22:6n-3 | - | - | - | - | - | |
| Heart | 18:3n-3 | 0.838 (<0.0001) | - | - | - | - |
| 20:3n-3 | 0.611 (<0.0001) | - | - | - | - | |
| 20:5n-3 | - | 0.920 (<0.0001) | 0.918 (<0.0001) | 0.920 (<0.0001) | 0.920 (<0.0001) | |
| 22:5n-3 | 0.613 (<0.0001) | - | - | - | - | |
| 22:6n-3 | - | 0.785 (<0.0001) | 0.787 (<0.0001) | 0.786 (<0.0001) | 0.786 (<0.0001) | |
Disclaimer/Publisher’s Note: The statements, opinions and data contained in all publications are solely those of the individual author(s) and contributor(s) and not of MDPI and/or the editor(s). MDPI and/or the editor(s) disclaim responsibility for any injury to people or property resulting from any ideas, methods, instructions or products referred to in the content. |
© 2023 by the authors. Licensee MDPI, Basel, Switzerland. This article is an open access article distributed under the terms and conditions of the Creative Commons Attribution (CC BY) license (https://creativecommons.org/licenses/by/4.0/).
Share and Cite
Østbye, T.-K.K.; Gudbrandsen, O.A.; Drotningsvik, A.; Ruyter, B.; Berge, G.M.; Vogt, G.; Nilsson, A. Different Dietary Ratios of Camelina Oil to Sandeel Oil Influence the Capacity to Synthesise and Deposit EPA and DHA in Zucker Fa/Fa Rats. Nutrients 2023, 15, 2344. https://doi.org/10.3390/nu15102344
Østbye T-KK, Gudbrandsen OA, Drotningsvik A, Ruyter B, Berge GM, Vogt G, Nilsson A. Different Dietary Ratios of Camelina Oil to Sandeel Oil Influence the Capacity to Synthesise and Deposit EPA and DHA in Zucker Fa/Fa Rats. Nutrients. 2023; 15(10):2344. https://doi.org/10.3390/nu15102344
Chicago/Turabian StyleØstbye, Tone-Kari Knutsdatter, Oddrun Anita Gudbrandsen, Aslaug Drotningsvik, Bente Ruyter, Gerd Marit Berge, Gjermund Vogt, and Astrid Nilsson. 2023. "Different Dietary Ratios of Camelina Oil to Sandeel Oil Influence the Capacity to Synthesise and Deposit EPA and DHA in Zucker Fa/Fa Rats" Nutrients 15, no. 10: 2344. https://doi.org/10.3390/nu15102344