
Body Fat-Reducing Effects of Whey Protein Diet in Male Mice
 , ,
, ,
Abstract
:1. Introduction
- 1
- Glucose metabolism effectWhey protein improvement of insulin resistance by inhibiting the secretion of serotonin in peripheral tissues and fibroblast growth factor 21 in liver tissue [6].
- 2
- Muscle protein synthesis effectWhey protein promotion of muscle synthesis by activating the mammalian target of rapamycin (mTOR), a metabolic pathway required for muscle synthesis [7].
- 3
- Anti-inflammatory effect
- 4
- Antioxidant effectWhey protein exhibition of antioxidant activities in vitro [10].
- 5
- Lipid metabolism effectWhey protein promotes triglyceride degradation and inhibits fatty acid synthesis in mice by affecting transcription factors involved in lipid metabolism [11].
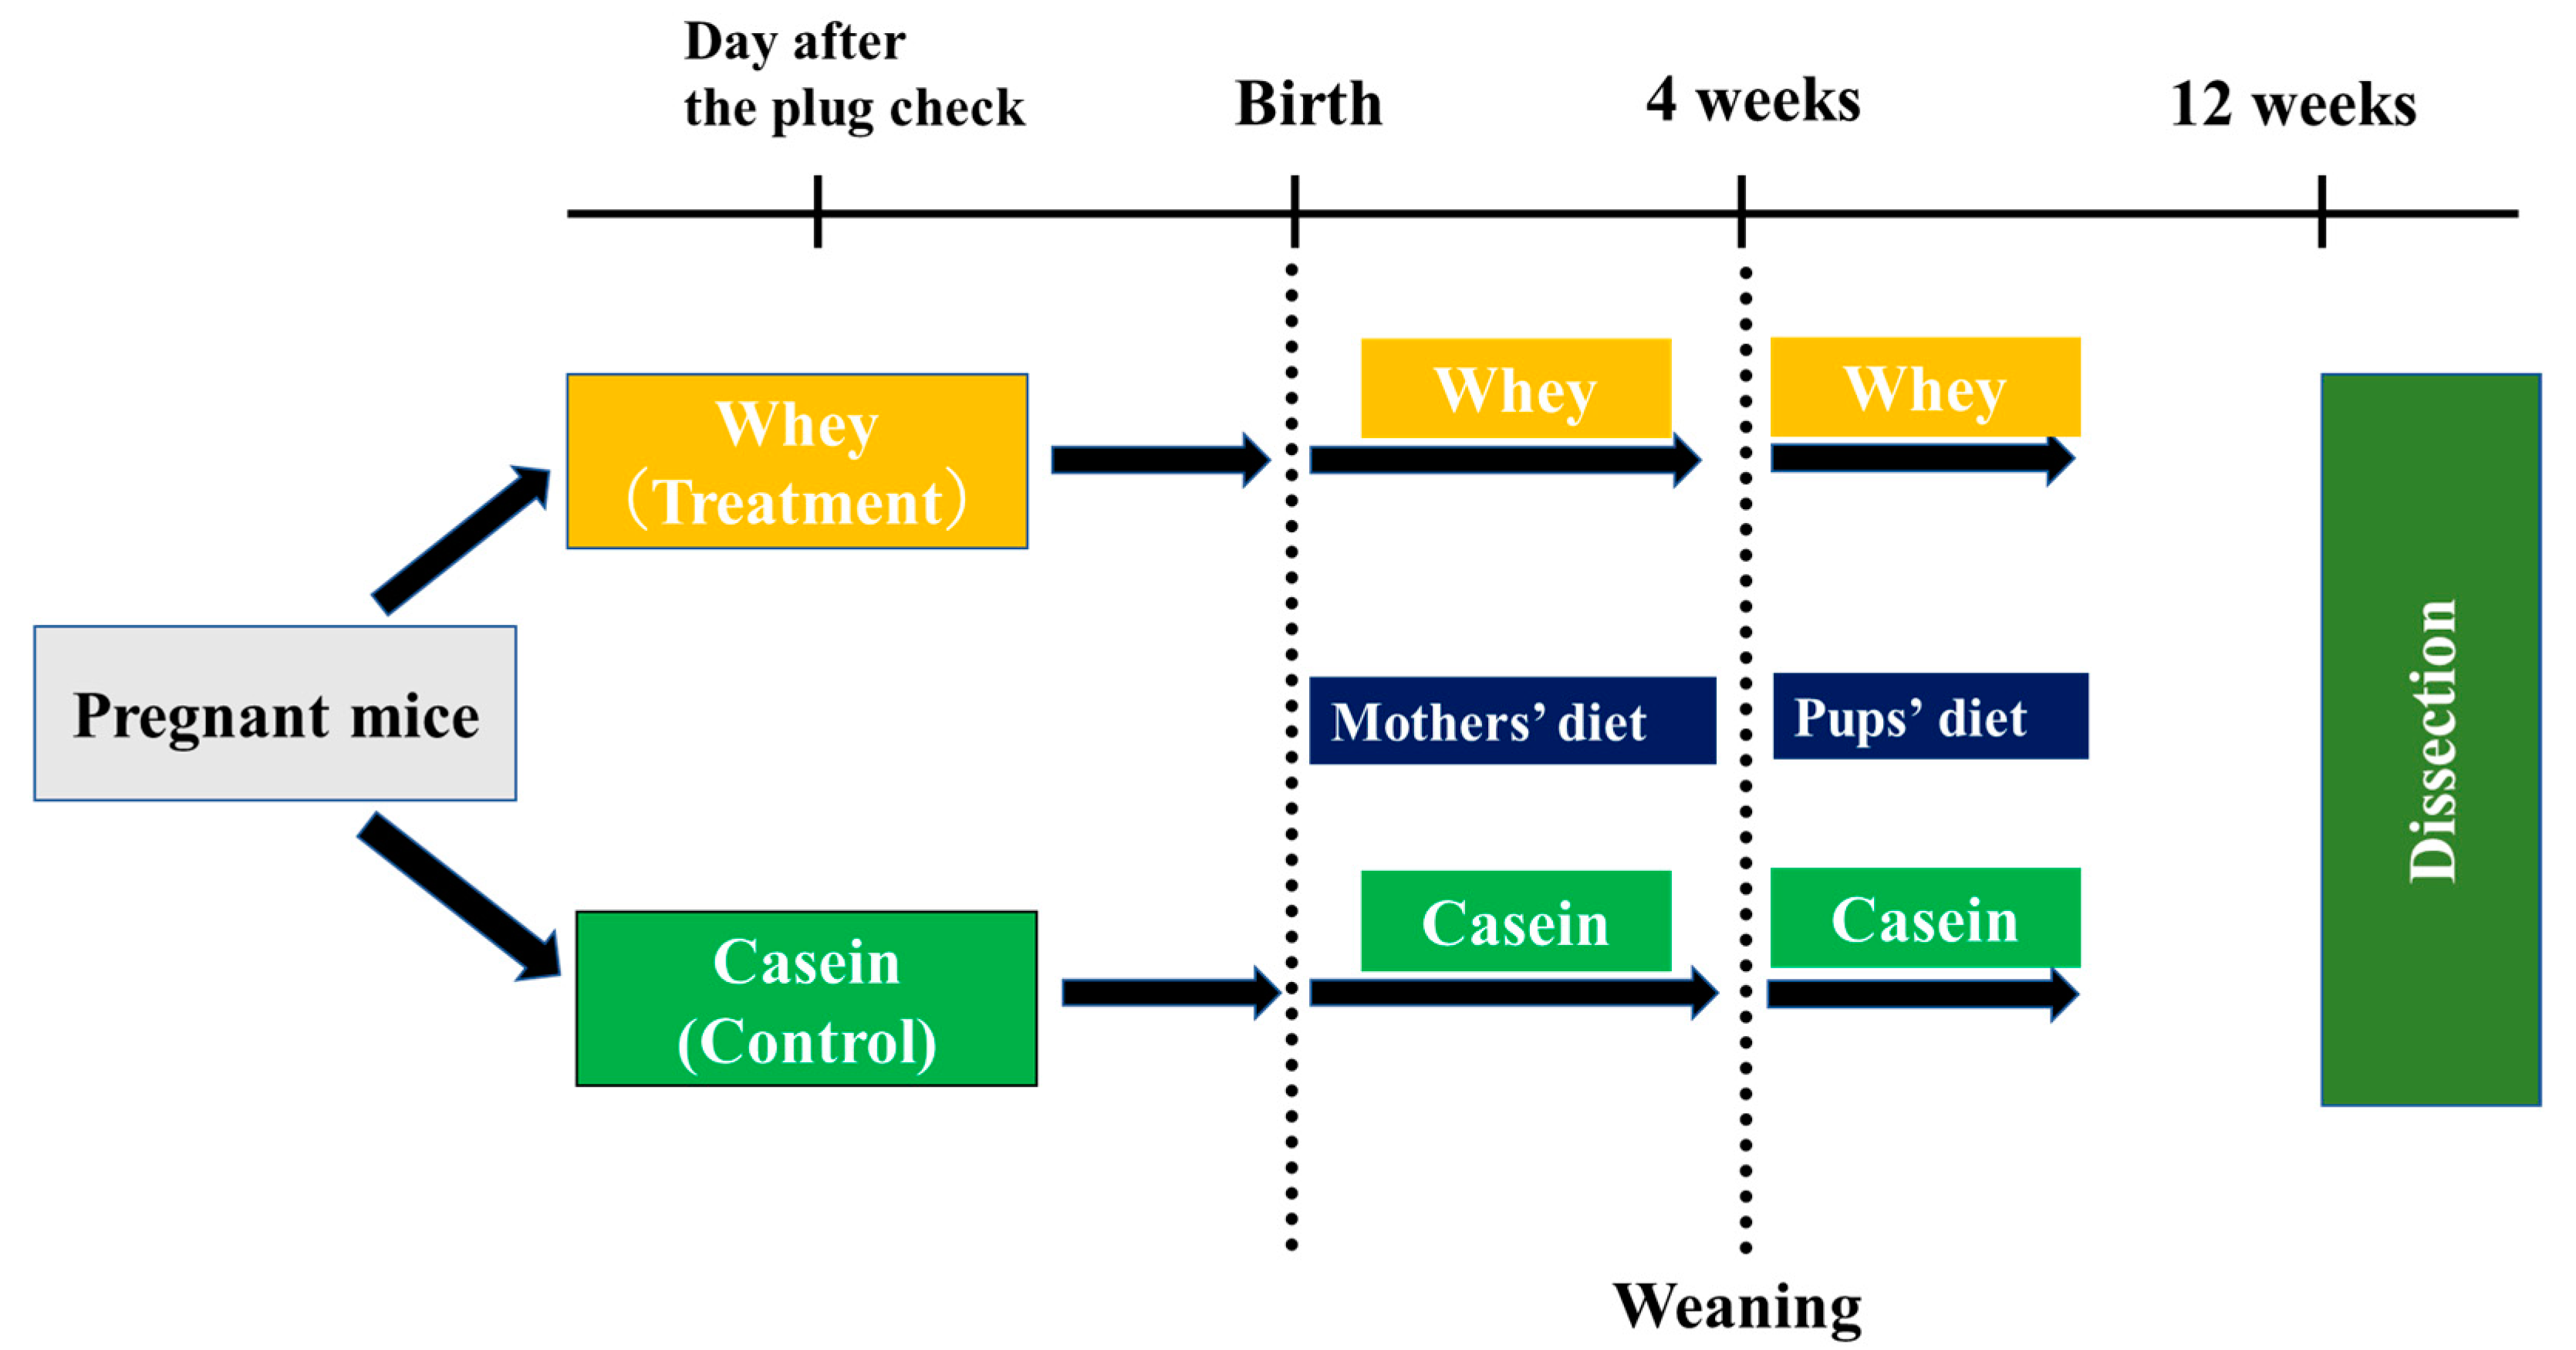
2. Materials and Methods
2.1. Experimental Animals
2.2. Rearing Conditions
2.3. Body Weight
2.4. Blood Glucose, Serum Insulin, and Insulin Resistance (HOMA-IR)
2.5. Body Composition and Fat Weight
2.6. Serum Lipoprotein Fractionation
2.7. Gene Expression Analysis of Liver Tissue
2.8. Metabolomic Analysis of Adipose Tissue
2.9. Serum and Urine Creatinine
2.10. Statistical Analysis
3. Results
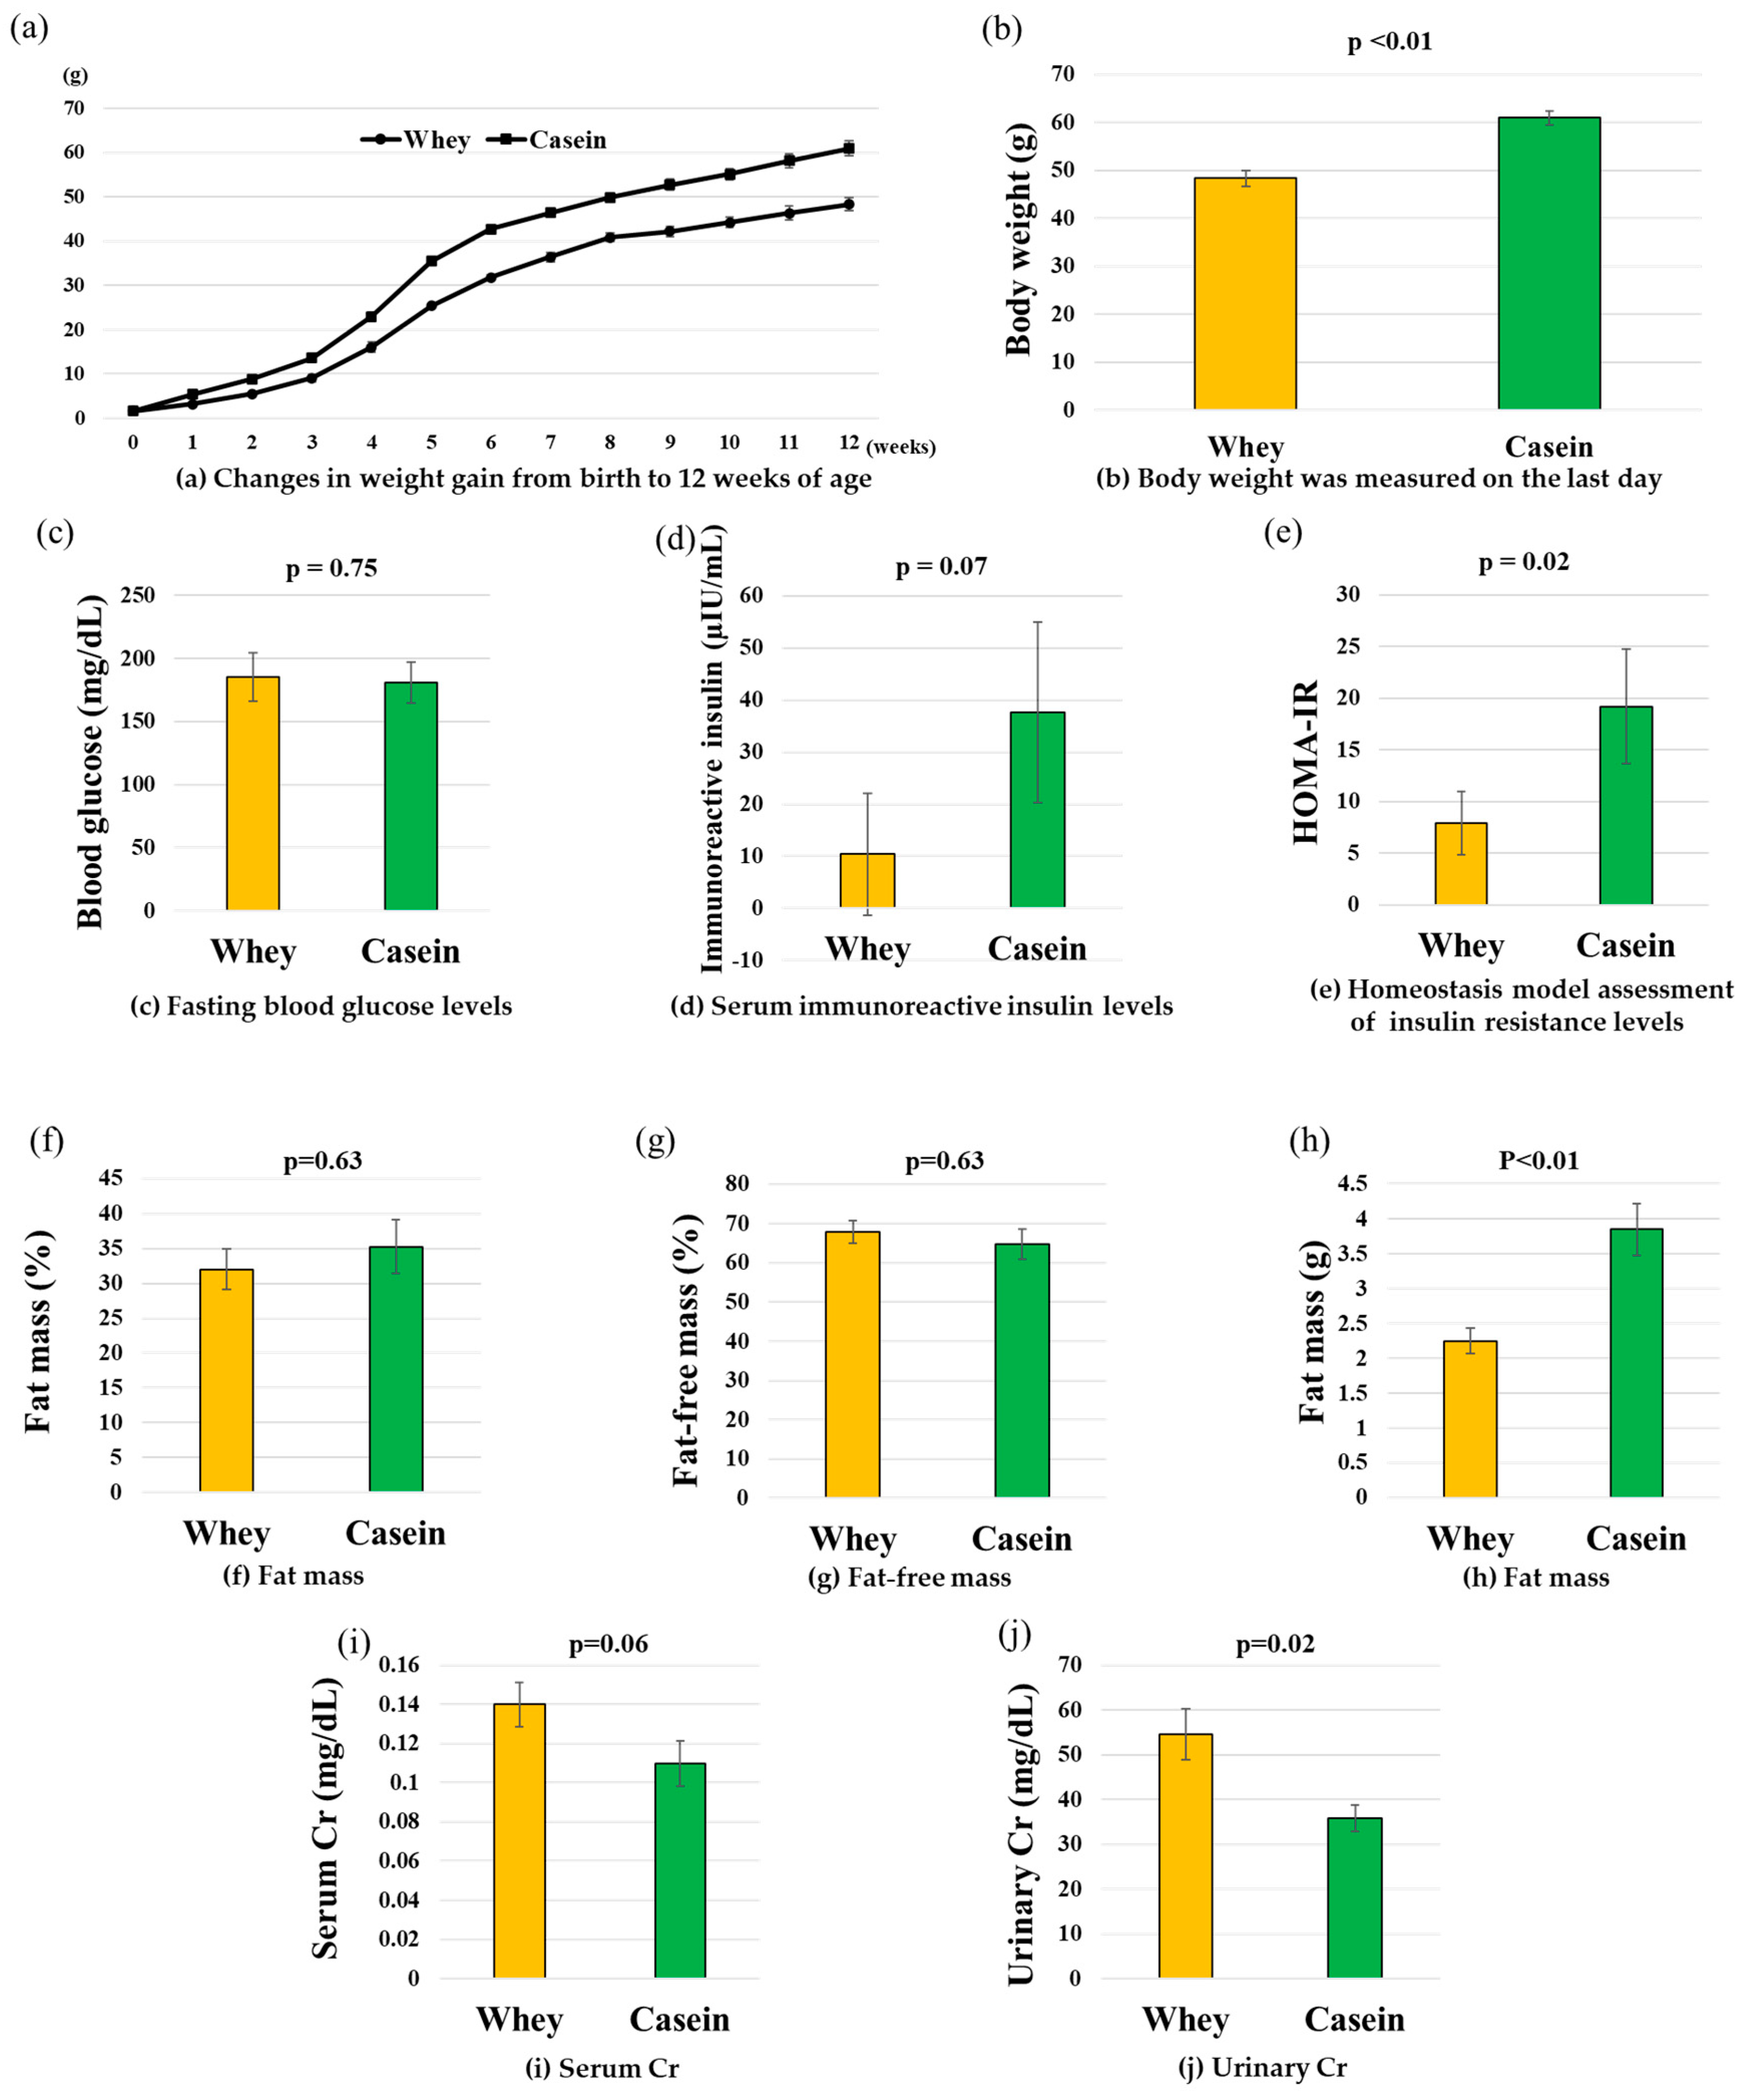
3.1. Body Weight History
3.2. Blood Glucose, IRI, and HOMA-IR
3.3. Fat Weight and Body Composition
3.4. Serum and Urine Creatinine
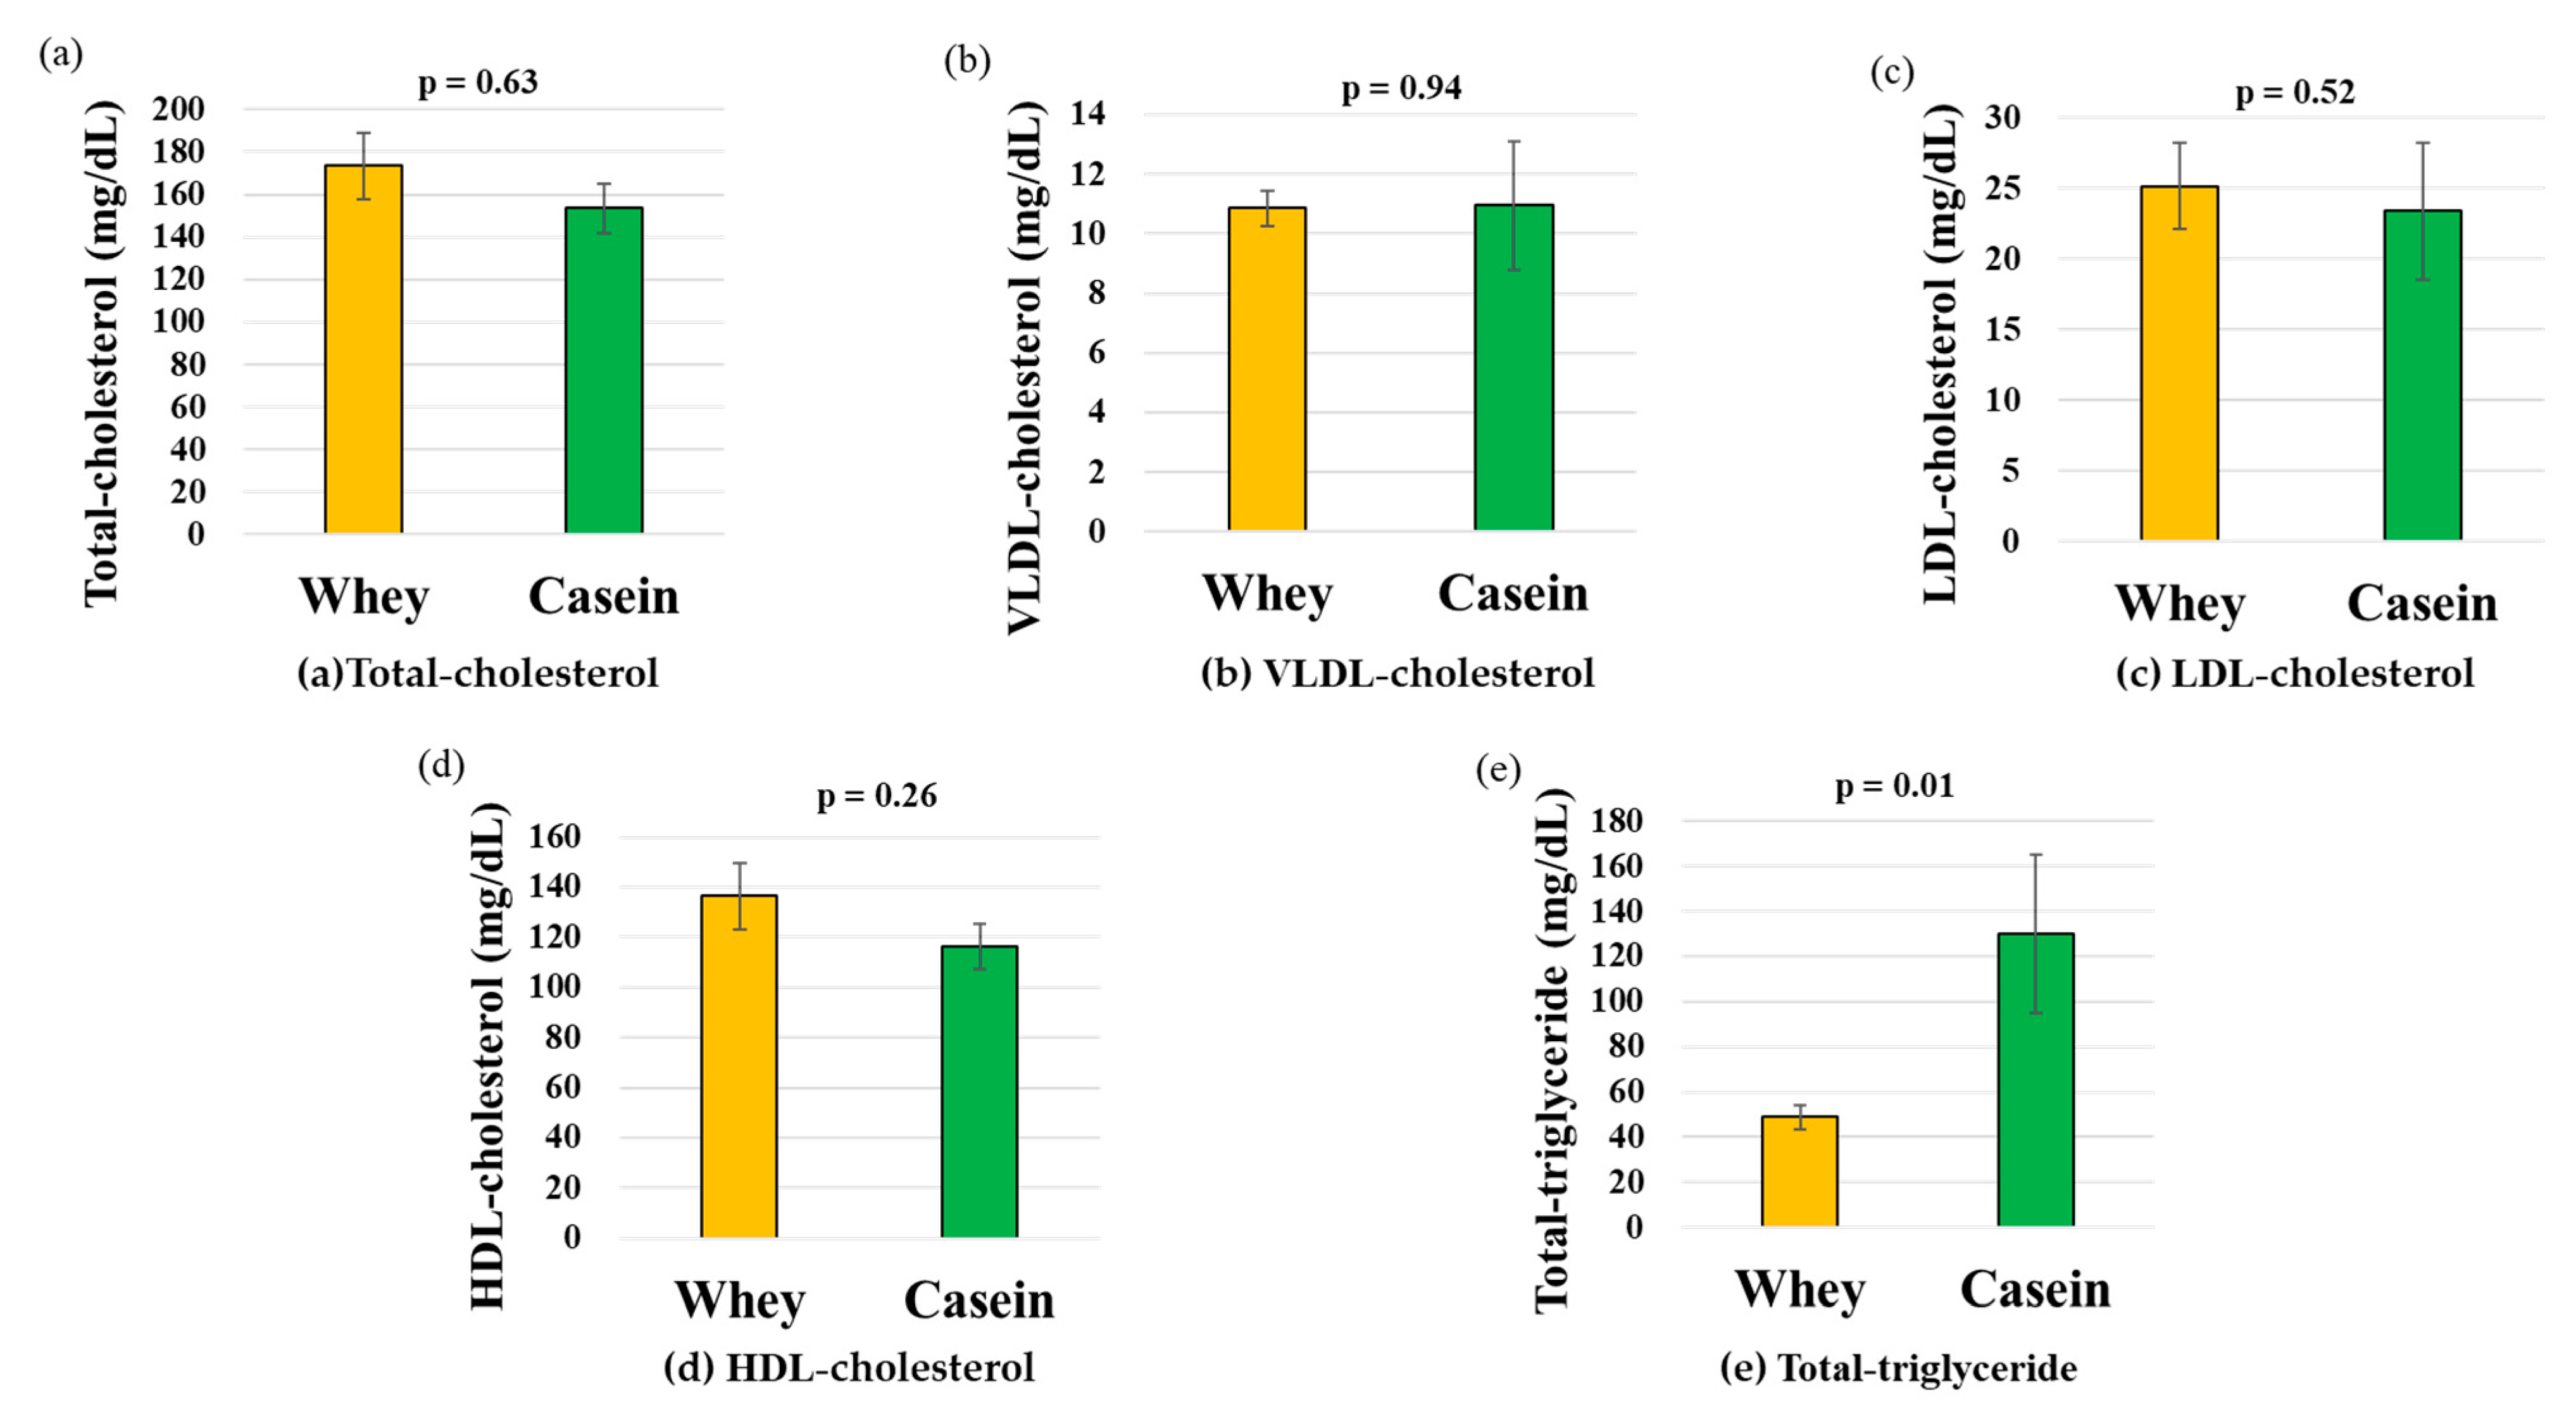
3.5. Serum Lipoprotein Fractions
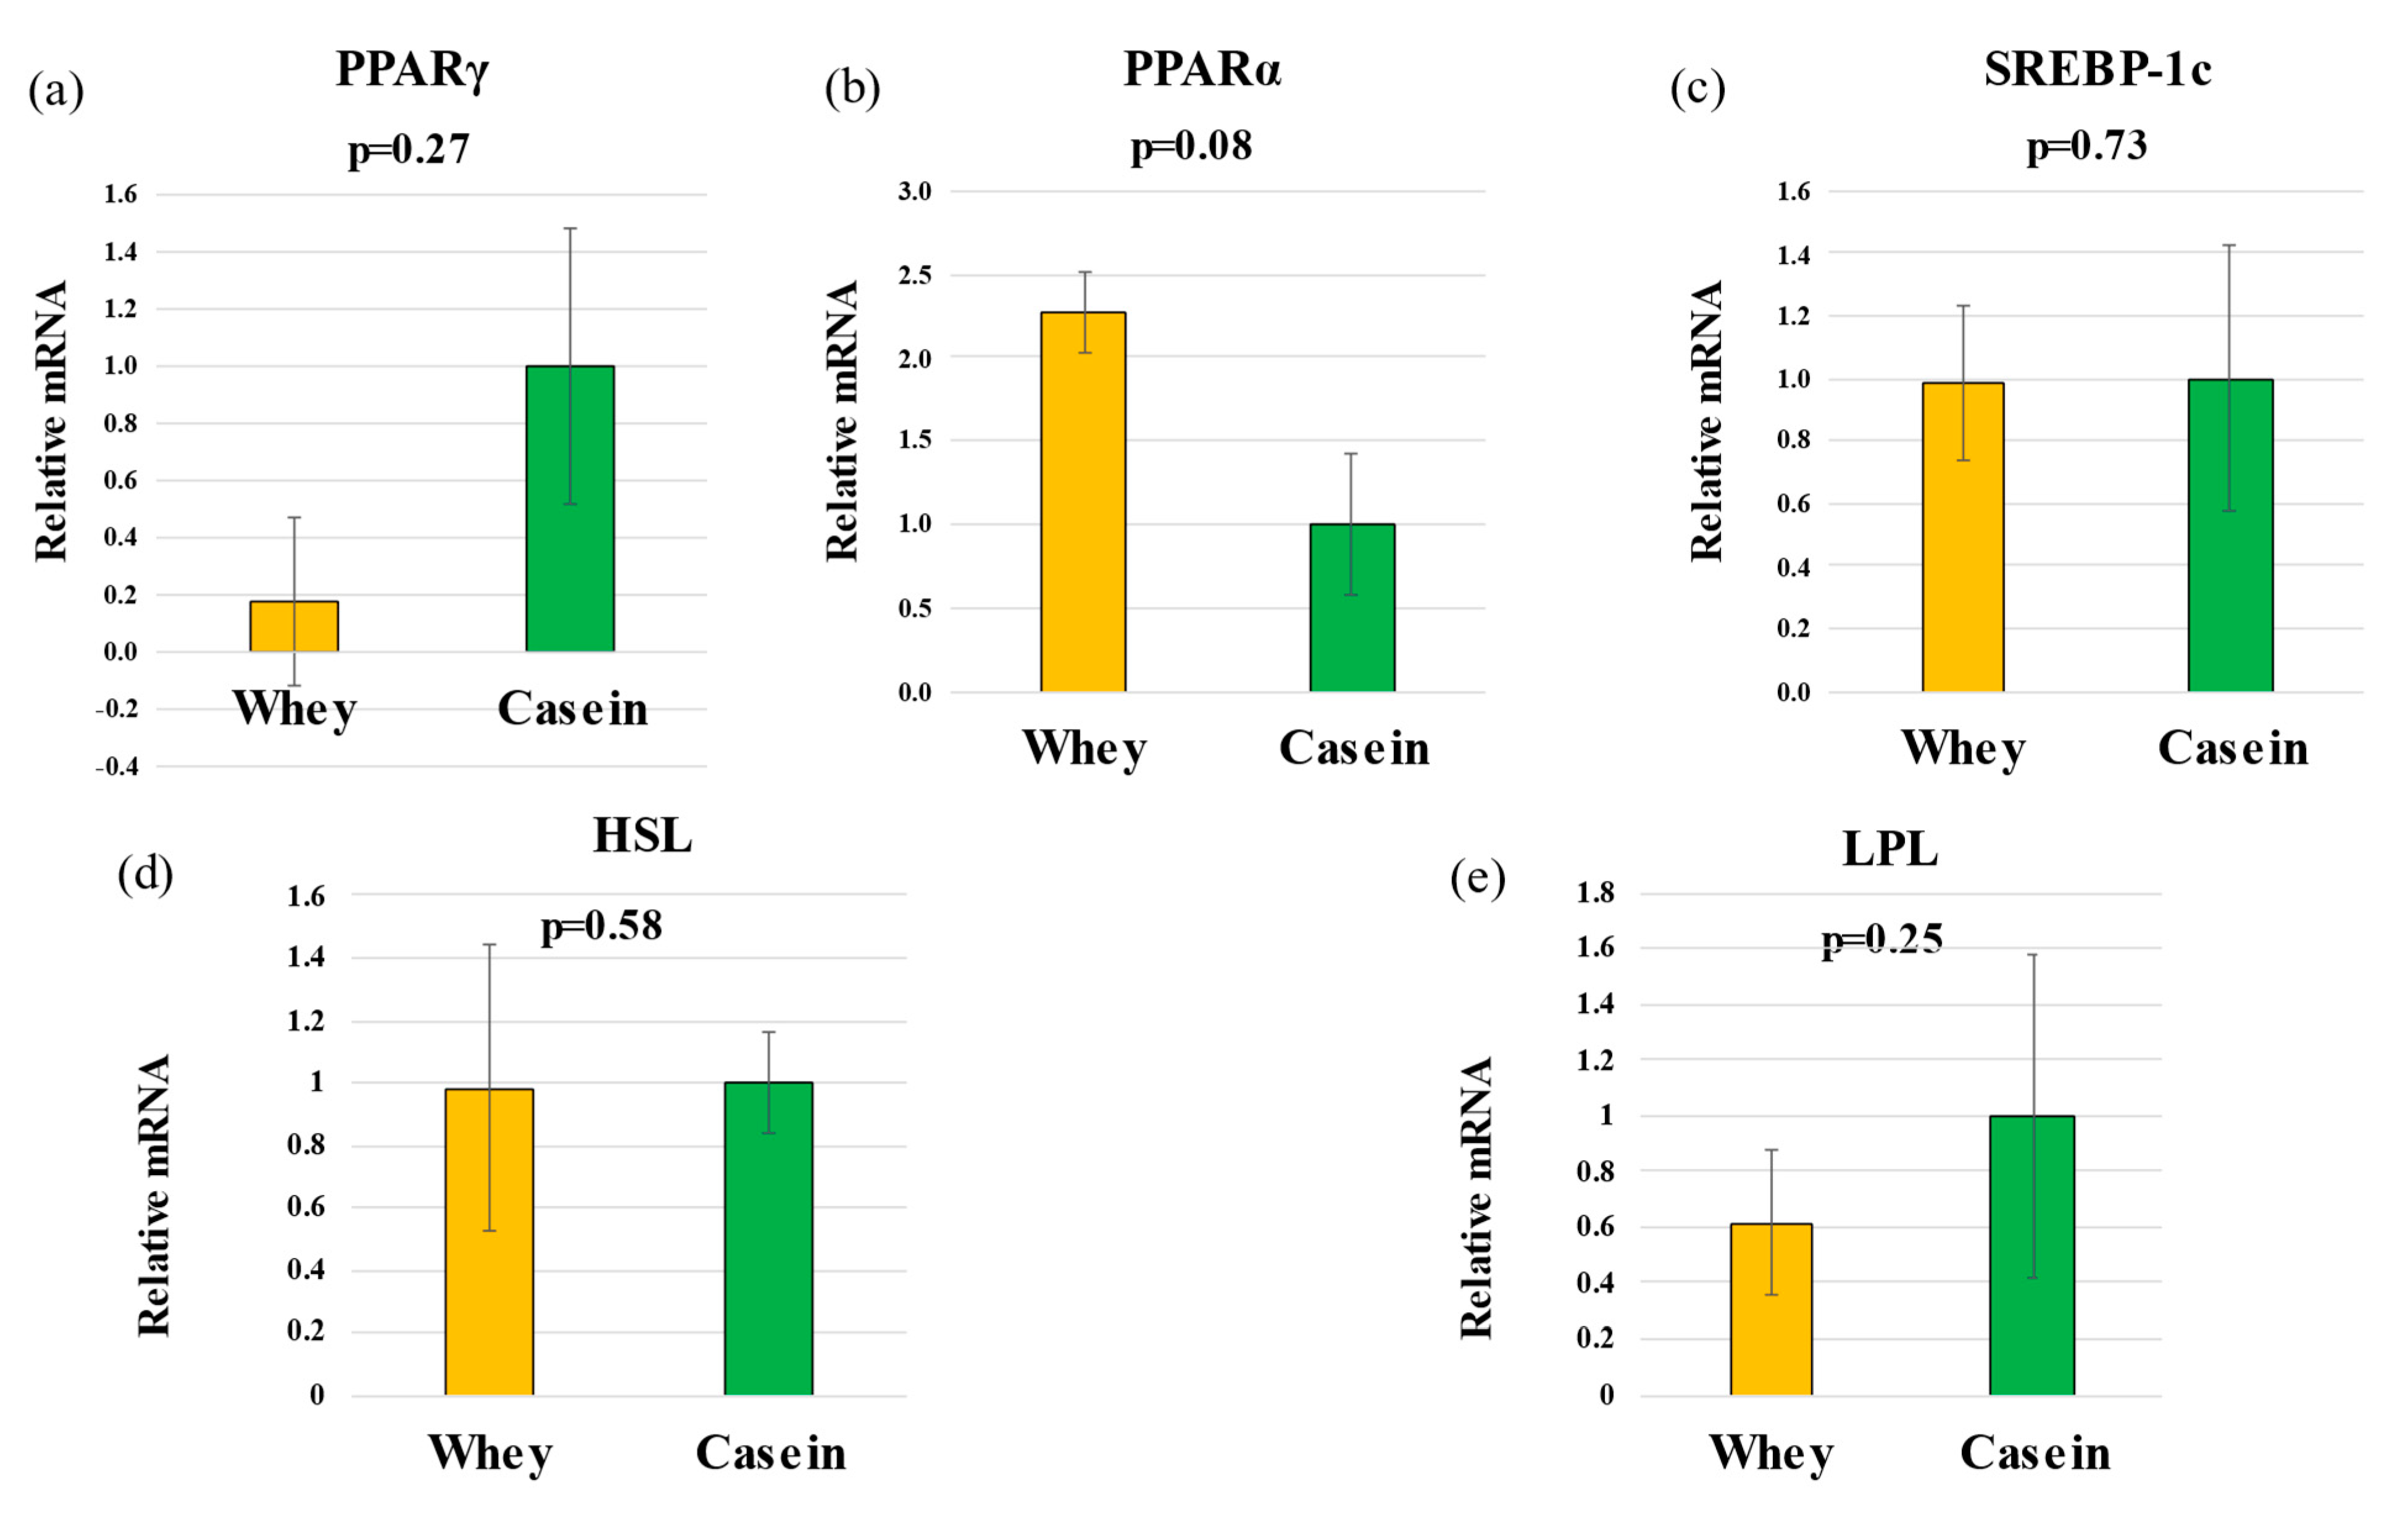
3.6. Hepatic Gene Expression
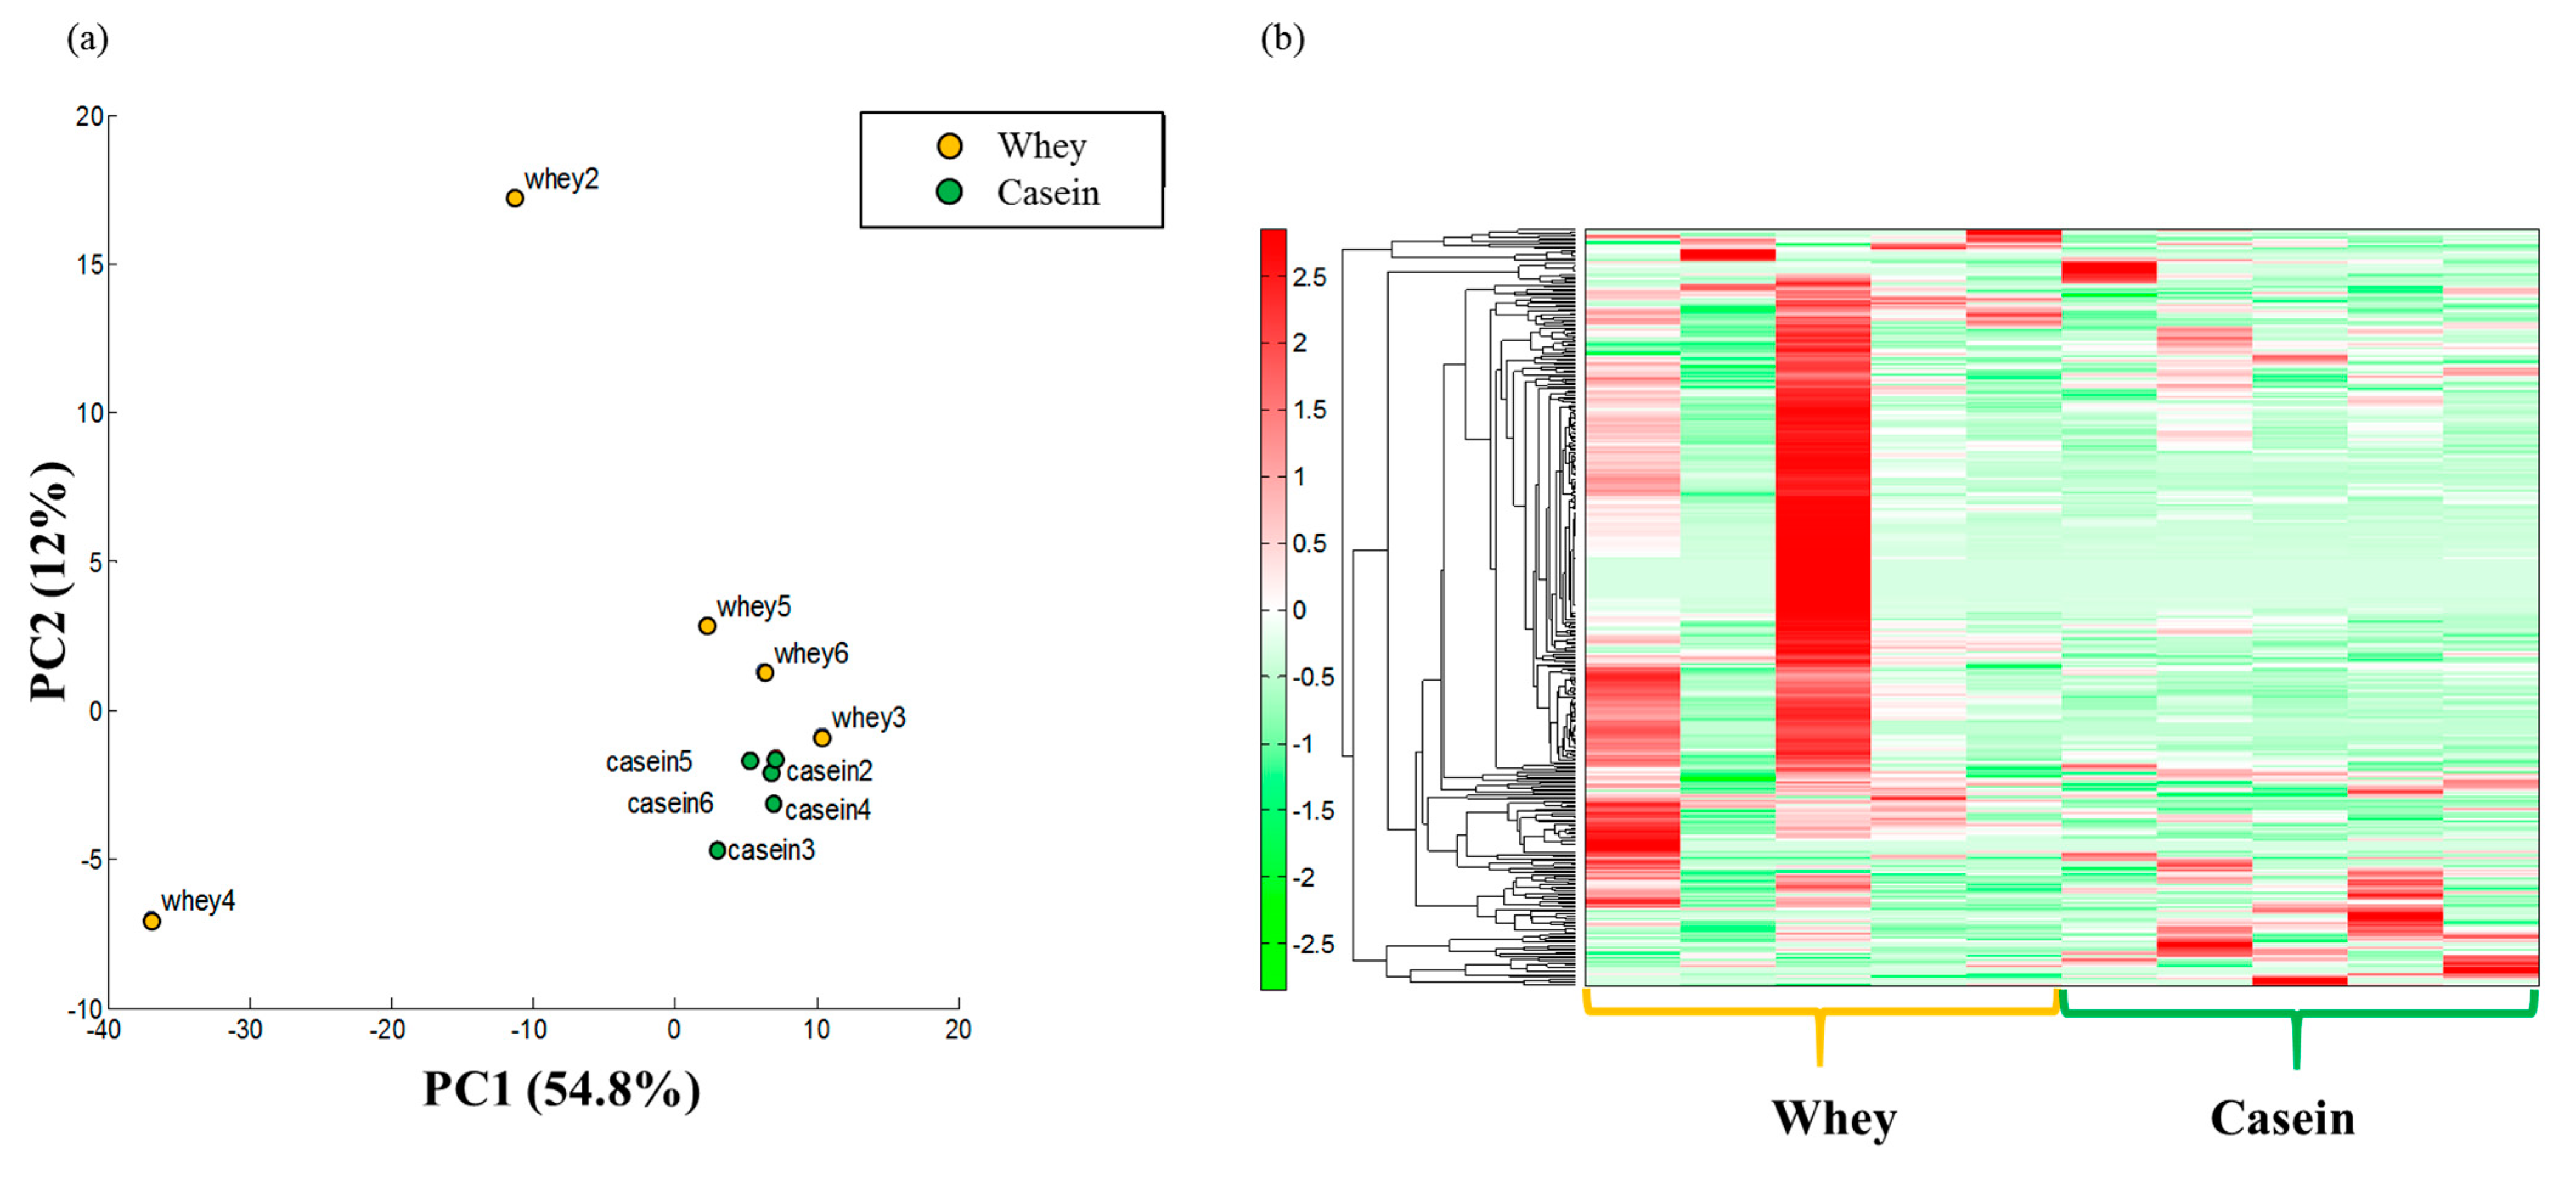
3.7. Adipose Metabolism
4. Discussion
4.1. Lipid Metabolism
4.2. Glucose Metabolism
4.3. Improvement Myogenic Insulin Resistance
4.4. Myo-Inositol Phosphates
4.5. Infant and Oxidative Stress
4.6. Comparison of the Antioxidant and Anti-Inflammatory Effects of Breast Milk and Formula
5. Future Directions
6. Conclusions
Supplementary Materials
Author Contributions
Funding
Institutional Review Board Statement
Informed Consent Statement
Data Availability Statement
Acknowledgments
Conflicts of Interest
References
- Ministry of Health, Labor and Welfare in Japan Vital Statistics in Japan in 2017. Available online: https://www.mhlw.go.jp/toukei/list/81-1.html (accessed on 7 June 2022). (In Japanese).
- Gluckman, P.D.; Hanson, M.A. Living with the past: Evolution, development, and patterns of disease. Science 2004, 305, 1733–1736. [Google Scholar] [CrossRef]
- Uauy, R.; Kain, J.; Corvalan, C. How can the Developmental Origins of Health and Disease (DOHaD) hypothesis contribute to improving health in developing countries? Am. J. Clin. Nutr. 2011, 94, 1759–1764. [Google Scholar] [CrossRef]
- Kunz, C.; Lonnerdal, B.O. Re-evaluation of the whey protein/casein ratio of human milk. Acta Paediatr. 1992, 81, 107–112. [Google Scholar] [CrossRef]
- Marshall, K. Therapeutic applications of whey protein. Altern. Med. Rev. 2004, 9, 136–156. [Google Scholar]
- Nonogaki, K.; Kaji, T. Whey protein isolate inhibits hepatic FGF21 production, which precedes weight gain, hyperinsulinemia and hyperglycemia in mice fed a high-fat diet. Sci. Rep. 2020, 10, 15784. [Google Scholar] [CrossRef]
- Bodine, S.C.; Stitt, T.N.; Gonzalez, M.; Kline, W.O.; Stover, G.L.; Bauerlein, R.; Zlotchenko, E.; Scrimgeour, A.; Lawrence, J.C.; Glass, D.J.; et al. Akt/mTOR pathway is a crucial regulator of skeletal muscle hypertrophy and can prevent muscle atrophy in vivo. Nat. Cell Biol. 2001, 3, 1014–1019. [Google Scholar] [CrossRef]
- Kume, H.; Okazaki, H.; Sasaki, H. Hepatoprotective Effects of Whey Protein on D-Galactosamine-Induced Hepatitis and Liver Fibrosis in Rats. Biosci. Biotechnol. Biochem. 2006, 70, 1281–1285. [Google Scholar] [CrossRef]
- Sugawara, K.; Takahashi, H.; Sugawara, T.; Yamada, K.; Yanagida, S.; Homma, M.; Dairiki, K.; Sasaki, H.; Kawagoshi, A.; Satake, M.; et al. Effect of Anti-Inflammatory Supplementation with Whey Peptide and Exercise Therapy in Patients with COPD. Respir. Med. 2012, 106, 1526–1534. [Google Scholar] [CrossRef]
- Bayram, T.; Pekmez, M.; Arda, N.; Yalçin, A.S. Antioxidant activity of whey protein fractions isolated by gel exclusion chromatography and protease treatment. Talanta 2008, 75, 705–709. [Google Scholar] [CrossRef]
- Sasaki, H. Whey Protein Intake Modulates Lipid Metabolism by Transcriptionally Affecting PPARs and SREBP1c and Their Downstream Enzymes in Mice. Food Nutr. Sci. 2019, 10, 1045–1055. [Google Scholar] [CrossRef]
- Kuwabara, R.; Urakami, T.; Yoshida, K.; Morioka, I. Case of type 2 diabetes possibly caused by excessive accumulation of visceral fat in a child born small-for-gestational age. J. Diabetes Investig. 2020, 11, 1366–1369. [Google Scholar] [CrossRef] [PubMed]
- Nagano, N.; Kaneko, C.; Ohashi, S.; Seya, M.; Takigawa, I.; Masunaga, K.; Morioka, I. Non-obese type 2 diabetes with a history of being an extremely preterm small-for-gestational-age infant without early adiposity rebound. Int. J. Environ. Res. Public Health 2022, 19, 8560. [Google Scholar] [CrossRef] [PubMed]
- Moore, T.A.; Ahmad, I.M.; Zimmerman, M.C. Oxidative Stress and Preterm Birth: An Integrative Review. Biol. Res. Nurs. 2018, 20, 497–512. [Google Scholar] [CrossRef] [PubMed]
- Kander, M.C.; Cui, Y.; Liu, Z. Gender difference in oxidative stress: A new look at the mechanisms for cardiovascular diseases. J. Cell Mol. Med. 2017, 21, 1024–1032. [Google Scholar] [CrossRef] [PubMed]
- Huebschmann, A.G.; Huxley, R.R.; Kohrt, W.M.; Zeitler, P.; Regensteiner, J.G.; Reusch, J.E.B. Sex differences in the burden of type 2 diabetes and cardiovascular risk across the life course. Diabetologia 2019, 62, 1761–1772. [Google Scholar] [CrossRef]
- Hashemilar, M.; Khalili, M.; Rezaeimanesh, N.; Sadeghi Hokmabadi, E.; Rasulzade, S.; Shamshirgaran, S.M.; Taheraghdam, A.; Farhoudi, M.; Shaafi, S.; Shakouri, S.K.; et al. Effect of Whey Protein Supplementation on Inflammatory and Antioxidant Markers, and Clinical Prognosis in Acute Ischemic Stroke (TNS Trial): A Randomized, Double Blind, Controlled, Clinical Trial. Adv. Pharm. Bull. 2020, 10, 135–140. [Google Scholar] [CrossRef]
- Lien, E.L. Comparison of AIN-76A and AIN-93G diets: A 13-week study in rats. Food Chem. Toxicol. 2001, 39, 385–392. [Google Scholar] [CrossRef]
- Matthews, D.R.; Hosker, J.P.; Rudenski, A.S.; Naylor, B.A.; Treacher, D.F.; Turner, R.C. Homeostasis model assessment: Insulin resistance and beta-cell function from fasting plasma glucose and insulin concentrations in man. Diabetologia 1985, 28, 412–419. [Google Scholar] [CrossRef]
- Lukaski, H.C.; Johnson, P.E.; Bolonchuk, W.W.; Lykken, G.I. Assessment of fat free mass using bioelectrical impedance measurements of the human body. Am. J. Clin. Nutr. 1985, 41, 810–817. [Google Scholar] [CrossRef]
- Okazaki, M.; Yamashita, S. Recent advances in analytical methods on lipoprotein subclasses: Calculation of particle numbers from lipid levels by gel permeation HPLC using “Spherical Particle Model”. J. Oleo Sci. 2016, 65, 265–282. [Google Scholar] [CrossRef]
- Usui, S.; Hara, Y.; Hosaki, S.; Okazaki, M. A new on-line dual enzymatic method for simultaneous quantification of cholesterol and triglycerides in lipoproteins by HPLC. J. Lipid Res. 2002, 43, 805–814. [Google Scholar] [CrossRef]
- Okazaki, M.; Usui, S.; Ishigami, M.; Sakai, N.; Nakamura, T.; Matsuzawa, Y.; Yamashita, S. Identification of unique lipoprotein subclasses for visceral obesity by component analysis of cholesterol profile in high-performance liquid chromatography. Arterioscler. Thromb. Vasc. Biol. 2005, 25, 578–584. [Google Scholar] [CrossRef]
- Ohashi, Y.; Hirayama, A.; Ishikawa, T.; Nakamura, S.; Shimizu, K.; Ueno, Y.; Tomita, M.; Soga, T. Depiction of metabolome changes in histidine-starved Escherichia coli by CE-TOFMS. Mol. Biosyst. 2008, 4, 135–147. [Google Scholar] [CrossRef] [PubMed]
- Ooga, T.; Sato, H.; Nagashima, A.; Sasaki, K.; Tomita, M.; Soga, T.; Ohashi, Y. Metabolomic anatomy of an animal model revealing homeostatic imbalances in dyslipidaemia. Mol. Biosyst. 2011, 7, 1217–1223. [Google Scholar] [CrossRef] [PubMed]
- Sugimoto, M.; Wong, D.T.; Hirayama, A.; Soga, T.; Tomita, M. Capillary electrophoresis mass spectrometry-based saliva metabolomics identified oral, breast and pancreatic cancer-specific profiles. Metabolomics 2010, 6, 78–95. [Google Scholar] [CrossRef] [PubMed]
- Yamamoto, H.; Fujimori, T.; Sato, H.; Ishikawa, G.; Kami, K.; Ohashi, Y. Statistical hypothesis testing of factor loading in principal component analysis and its application to metabolite set enrichment analysis. BMC Bioinform. 2014, 15, 51. [Google Scholar] [CrossRef] [PubMed]
- Berger, J.; Leibowitz, M.D.; Doebber, T.W.; Elbrecht, A.; Zhang, B.; Zhou, G.; Biswas, C.; Cullinan, C.A.; Hayes, N.S.; Li, Y.; et al. Novel Peroxisome Proliferator-activated Receptor (PPAR)γ and PPARδ Ligands Produce Distinct Biological Effects. J. Biol. Chem. 1999, 274, 6718–6725. [Google Scholar] [CrossRef]
- Takeuchi, K.; Yokouchi, C.; Goto, H.; Umehara, K.; Yamada, H.; Ishii, Y. Alleviation of fatty liver in a rat model by enhancing N1-methylnicotinamide bioavailability through aldehyde oxidase inhibition. Biochem. Biophys. Res. Commun. 2018, 507, 203–210. [Google Scholar] [CrossRef]
- Suganami, T.; Ogawa, Y. Adipose tissue macrophages: Their role in adipose tissue remodeling. J. Leukoc. Biol. 2010, 88, 33–39. [Google Scholar] [CrossRef]
- Furukawa, S.; Fujita, T.; Shimabukuro, M.; Iwaki, M.; Yamada, Y.; Nakajima, Y.; Nakayama, O.; Makishima, M.; Matsuda, M.; Shimomura, I. Increased oxidative stress in obesity and its impact on metabolic syndrome. J. Clin. Investig. 2004, 114, 1752–1761. [Google Scholar] [CrossRef]
- Nomiyama, T.; Igarashi, Y.; Taka, H.; Mineki, R.; Uchida, T.; Ogihara, T.; Choi, J.B.; Uchino, H.; Tanaka, Y.; Maegawa, H.; et al. Reduction of insulin-stimulated glucose uptake by peroxynitrite is concurrent with tyrosine nitration of insulin receptor substrate-1. Biochem. Biophys. Res. Commun. 2004, 320, 639–647. [Google Scholar] [CrossRef]
- Bounous, G.; Gold, P. The biological activity of undenatured dietary whey proteins: Role of glutathione. Clin. Investig. Med. 1991, 14, 296–309. [Google Scholar]
- Franco, R.; Cidlowski, J.A. Apoptosis and glutathione: Beyond an antioxidant. Cell Death Differ. 2009, 16, 1303–1314. [Google Scholar] [CrossRef] [PubMed]
- Prokopidis, K.; Mazidi, M.; Sankaranarayanan, R.; Tajik, B.; McArdle, A.; Isanejad, M. Effects of whey and soy protein supplementation on inflammatory cytokines in older adults: A systematic review and meta-analysis. Br. J. Nutr. 2023, 129, 759–770. [Google Scholar] [CrossRef] [PubMed]
- Beauchamp, H.; Ghosh, S.; Dysart, M.W.; Kanaan, G.N.; Chu, A.; Blais, A.; Rajamanickam, K.; Tsai, E.C.; Patti, M.E.; Harper, M.E. Low birth weight is associated with adiposity, impaired skeletal muscle energetics and weight loss resistance in mice. Int. J. Obes. 2015, 39, 702–711. [Google Scholar] [CrossRef]
- Juha, J.H.; Christopher, M.L.; Jeffrey, R.S. Effect of protein/essential amino acids and resistance training on skeletal muscle hypertrophy: A case for whey protein. Nutr. Metab. 2010, 7, 51. [Google Scholar]
- Andersen, D.B.; Holub, B.J. The Relative Response of Hepatic Lipids in the Rat to Graded Levels of Dietary Myo-Inositol and Other Lipotropes. J. Nutr. 1980, 110, 496–504. [Google Scholar] [CrossRef]
- Croze, L.M.; Vella, E.R.; Pillon, N.J.; Soula, H.A.; Hadji, L.; Guichardant, M.; Soulage, C.O. Chronic treatment with myo-inositol reduces white adipose tissue accretion and improves insulin sensitivity in female mice. J. Nutr. Biochem. 2013, 24, 457–466. [Google Scholar] [CrossRef]
- Matsubasa, T.; Uchino, T.; Karashima, S.; Kondo, Y.; Maruyama, K.; Tanimura, M.; Endo, F. Oxidative stress in very low birth weight infants as measured by urinary 8-OHdG. Free Radic. Res. 2002, 36, 189–193. [Google Scholar] [CrossRef]
- Gupta, P.; Narang, M.; Banerjee, B.D.; Basu, S. Oxidative stress in term small for gestational age neonates born to undernourished mothers: A case control study. BMC Pediatr. 2004, 4, 14. [Google Scholar] [CrossRef]
- Sánchez, C.; Franco, L.; Regal, P.; Lamas, A.; Cepeda, A.; Fente, C. Breast Milk: A source of functional compounds with potential application in nutrition and therapy. Nutrients 2021, 13, 1026. [Google Scholar] [CrossRef] [PubMed]
- Aycicek, A.; Erel, O.; Kocyigit, A.; Selek, S.; Demirkol, M.R. Breast milk provides better antioxidant power than does formula. Nutrition 2006, 22, 616–619. [Google Scholar] [CrossRef] [PubMed]
- Walker, A. Breast milk as the gold standard for protective nutrients. J. Pediatr. 2010, 156 (Suppl. S2), S3–S7. [Google Scholar] [CrossRef] [PubMed]
- Corrochano, A.R.; Buckin, V.; Kelly, P.M.; Giblin, L. Invited review: Whey proteins as antioxidants and promoters of cellular antioxidant pathways. J. Dairy Sci. 2018, 101, 4747–4761. [Google Scholar] [CrossRef]


| (a) Antioxidant Markers | |||
| Comparative Analysis | |||
| Group Whey vs. Casein | |||
| Category | Compound name | Ratio | p-value |
| Antioxidant | Ascorbic acid | 1.1 | 0.775 |
| Carnosine | 22 | 0.323 | |
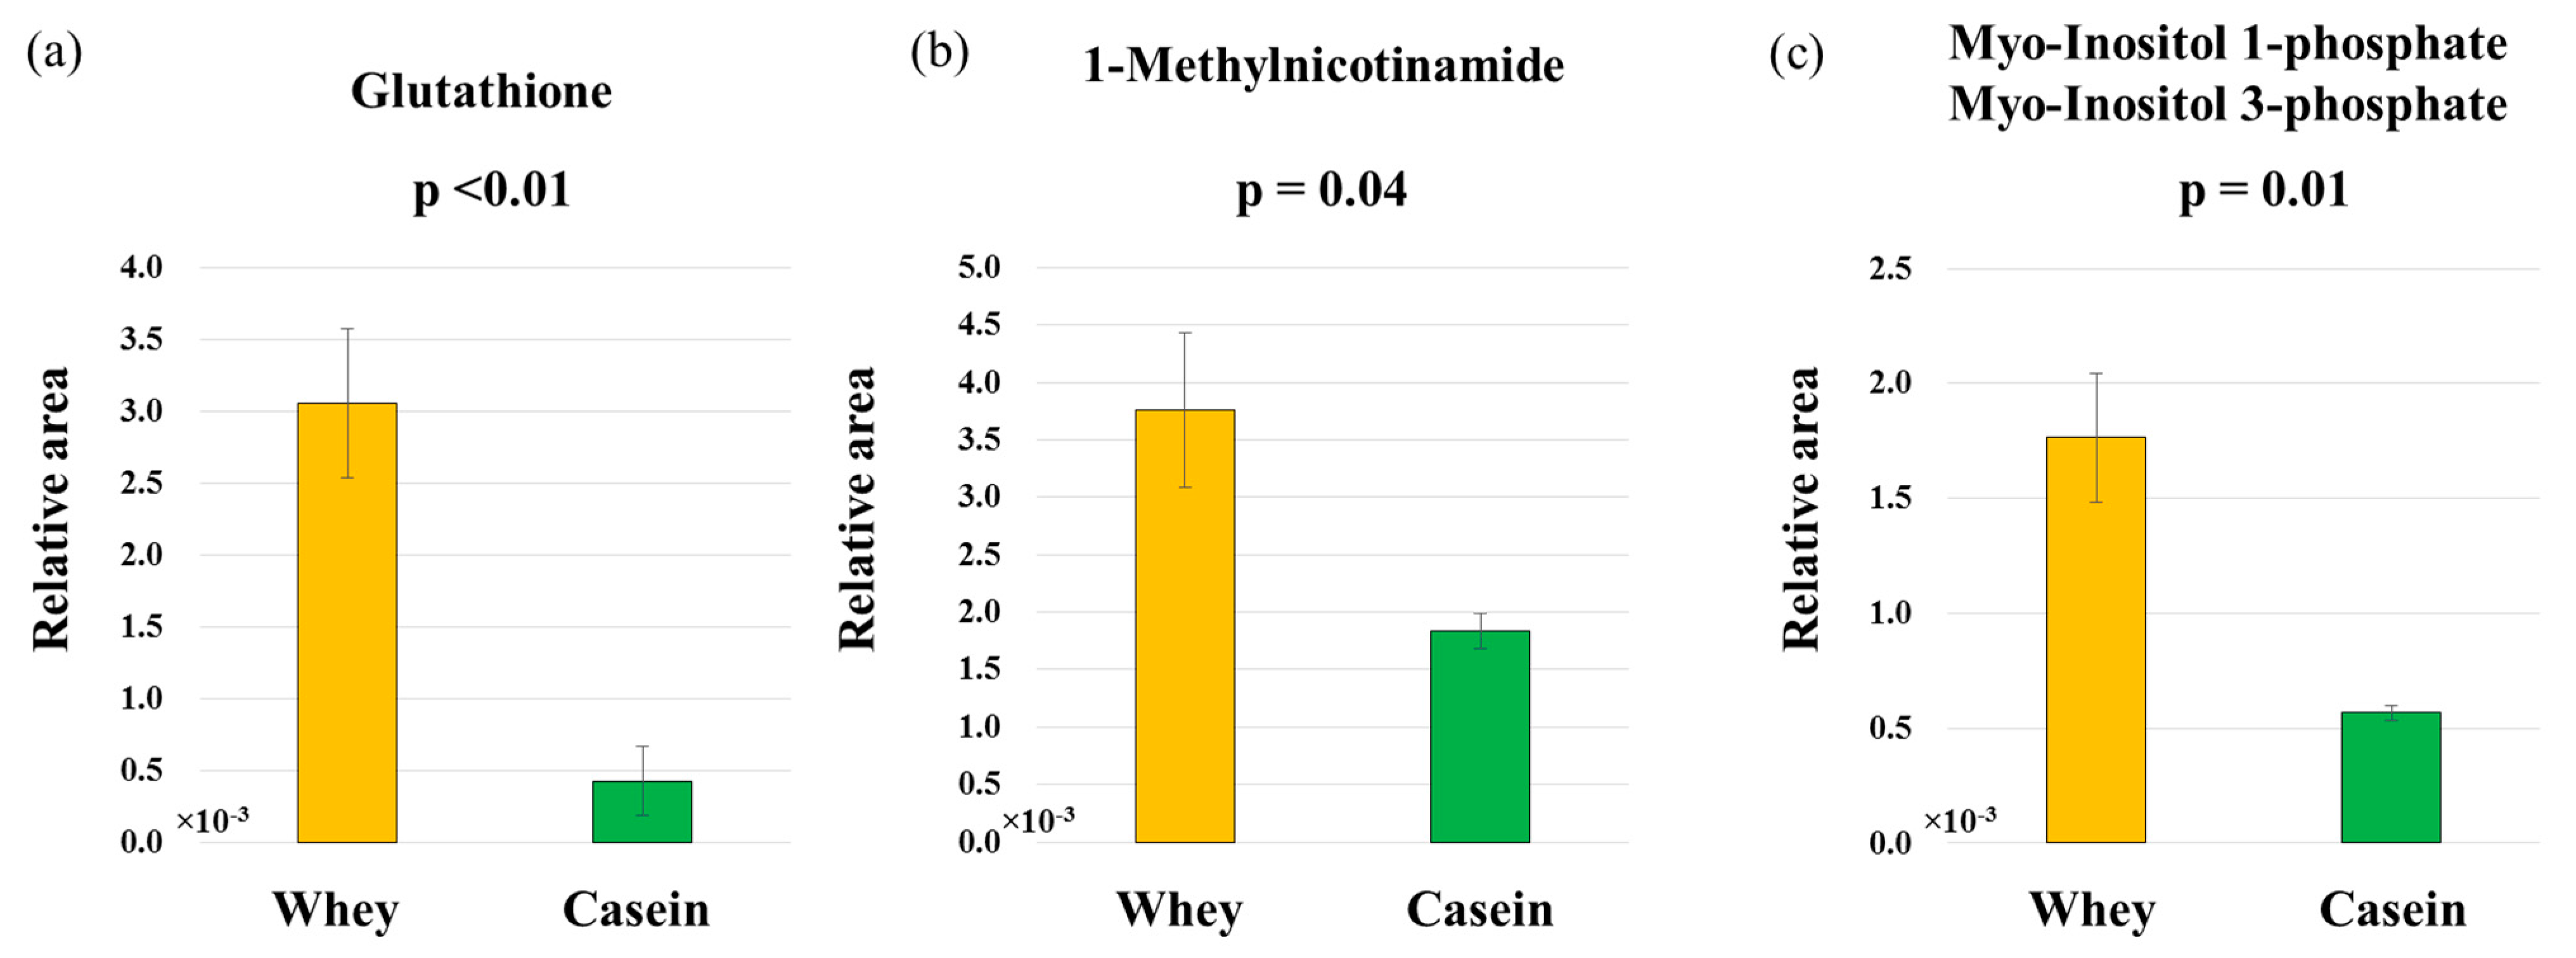
| Glutathione | 7.1 | 0.004 | |
| Hypotaurine | 29 | 0.286 | |
| Tartaric acid | 0.6 | 0.458 | |
| (b) Anti-inflammatory markers | |||
| Comparative Analysis | |||
| Group Whey vs. Casein | |||
| Category | Compound name | Ratio | p-value |
| Anti-inflammatory | 1-Methylnicotinamide | 2.0 | 0.044 |
| Histidine | 1.6 | 0.243 | |
| (c) Glucose metabolism markers | |||
| Comparative Analysis | |||
| Group Whey vs. Casein | |||
| Category | Compound name | Ratio | p-value |
| Glucose metabolism | myo-Inositol phosphates | 3.1 | 0.013 |
Disclaimer/Publisher’s Note: The statements, opinions and data contained in all publications are solely those of the individual author(s) and contributor(s) and not of MDPI and/or the editor(s). MDPI and/or the editor(s) disclaim responsibility for any injury to people or property resulting from any ideas, methods, instructions or products referred to in the content. |
© 2023 by the authors. Licensee MDPI, Basel, Switzerland. This article is an open access article distributed under the terms and conditions of the Creative Commons Attribution (CC BY) license (https://creativecommons.org/licenses/by/4.0/).
Share and Cite
Nakazaki, K.; Nagano, N.; Katayama, D.; Shimizu, S.; Matsuda, K.; Tokunaga, W.; Aoki, R.; Fuwa, K.; Morioka, I. Body Fat-Reducing Effects of Whey Protein Diet in Male Mice. Nutrients 2023, 15, 2263. https://doi.org/10.3390/nu15102263
Nakazaki K, Nagano N, Katayama D, Shimizu S, Matsuda K, Tokunaga W, Aoki R, Fuwa K, Morioka I. Body Fat-Reducing Effects of Whey Protein Diet in Male Mice. Nutrients. 2023; 15(10):2263. https://doi.org/10.3390/nu15102263
Chicago/Turabian StyleNakazaki, Kimitaka, Nobuhiko Nagano, Daichi Katayama, Shoichi Shimizu, Kengo Matsuda, Wataru Tokunaga, Ryoji Aoki, Kazumasa Fuwa, and Ichiro Morioka. 2023. "Body Fat-Reducing Effects of Whey Protein Diet in Male Mice" Nutrients 15, no. 10: 2263. https://doi.org/10.3390/nu15102263