
Nutrition Patterns and Their Gender Differences among Rheumatoid Arthritis Patients: A Descriptive Study

Abstract
:1. Introduction
2. Materials and Methods
2.1. Study Design and Patients
2.2. Anthropometric Measurements
2.3. Disease Activity
2.4. Biochemical Analysis
2.5. Dietary Intake Analysis
2.6. Nutritional Education
2.7. Statistical Analysis
3. Results
3.1. Patient Characteristics
3.2. Dietary Intake
3.3. Micronutrient Intake
3.4. Nutrition Patterns
3.5. Nutritional Education
3.6. Correlations between Anthropometric, Biochemical Parameters and Nutrition Intake
4. Discussion
5. Conclusions
Supplementary Materials
Author Contributions
Funding
Institutional Review Board Statement
Informed Consent Statement
Data Availability Statement
Acknowledgments
Conflicts of Interest
References
- Smolen, J.S.; Aletaha, D.; Barton, A.; Burmester, G.R.; Emery, P.; Firestein, G.S.; Kavanaugh, A.; McInnes, I.B.; Solomon, D.H.; Strand, V.; et al. Rheumatoid arthritis. Nat. Rev. Dis. Prim. 2018, 4, 18001. [Google Scholar] [CrossRef] [PubMed]
- Hense, S.; Luque Ramos, A.; Callhoff, J.; Albrecht, K.; Zink, A.; Hoffmann, F. Prävalenz der rheumatoiden Arthritis in Deutschland auf Basis von Kassendaten. Z. Für Rheumatol. 2016, 75, 819–827. [Google Scholar] [CrossRef] [PubMed]
- Catrina, A.; Krishnamurthy, A.; Rethi, B. Current view on the pathogenic role of anti-citrullinated protein antibodies in rheumatoid arthritis. RMD Open 2021, 7, e001228. [Google Scholar] [CrossRef] [PubMed]
- Derksen, V.; Huizinga, T.W.J.; van der Woude, D. The role of autoantibodies in the pathophysiology of rheumatoid arthritis. Semin. Immunopathol. 2017, 39, 437–446. [Google Scholar] [CrossRef] [PubMed] [Green Version]
- Kurowska, W.; Kuca-Warnawin, E.H.; Radzikowska, A.; Maśliński, W. The role of anti-citrullinated protein antibodies (ACPA) in the pathogenesis of rheumatoid arthritis. Cent. Eur. J. Immunol. 2017, 42, 390–398. [Google Scholar] [CrossRef] [PubMed]
- Wegner, N.; Lundberg, K.; Kinloch, A.; Fisher, B.; Malmström, V.; Feldmann, M.; Venables, P.J. Autoimmunity to specific citrullinated proteins gives the first clues to the etiology of rheumatoid arthritis. Immunol. Rev. 2010, 233, 34–54. [Google Scholar] [CrossRef]
- Alpízar-Rodríguez, D.; Finckh, A.; Gilbert, B. The Role of Nutritional Factors and Intestinal Microbiota in Rheumatoid Arthritis Development. Nutrients 2020, 13, 96. [Google Scholar] [CrossRef]
- Imamura, F.; Micha, R.; Khatibzadeh, S.; Fahimi, S.; Shi, P.; Powles, J.; Mozaffarian, D.; Nutrition, G.B.o.D.; Group, C.D.E. Dietary quality among men and women in 187 countries in 1990 and 2010: A systematic assessment. Lancet Glob. Health 2015, 3, e132–e142. [Google Scholar] [CrossRef] [Green Version]
- Monteiro, C.A.; Moubarac, J.C.; Cannon, G.; Ng, S.W.; Popkin, B. Ultra-processed products are becoming dominant in the global food system. Obes. Rev. 2013, 14, 21–28. [Google Scholar] [CrossRef]
- Cutolo, M.; Nikiphorou, E. Don’t neglect nutrition in rheumatoid arthritis! RMD Open 2018, 4, e000591. [Google Scholar] [CrossRef]
- Jagpal, A.; Navarro-Millán, I. Cardiovascular co-morbidity in patients with rheumatoid arthritis: A narrative review of risk factors, cardiovascular risk assessment and treatment. BMC Rheumatol. 2018, 2, 10. [Google Scholar] [CrossRef] [PubMed] [Green Version]
- Basile, M.S.; Ciurleo, R.; Bramanti, A.; Petralia, M.C.; Fagone, P.; Nicoletti, F.; Cavalli, E. Cognitive Decline in Rheumatoid Arthritis: Insight into the Molecular Pathogenetic Mechanisms. Int. J. Mol. Sci. 2021, 22, 1185. [Google Scholar] [CrossRef] [PubMed]
- Hugon, J. Rheumatoid arthritis and cognitive decline. Jt. Bone Spine 2022, 89, 105346. [Google Scholar] [CrossRef] [PubMed]
- Sangha, P.S.; Thakur, M.; Akhtar, Z.; Ramani, S.; Gyamfi, R.S. The Link Between Rheumatoid Arthritis and Dementia: A Review. Cureus 2020, 12, e7855. [Google Scholar] [CrossRef] [PubMed]
- Aviña-Zubieta, J.; Choi, H.; Sadatsafavi, M. Risk of Cardiovascular Mortality in Patients with Rheumatoid Arthritis: A Meta-Analysis of Observational Studies. Arthritis Rheumatol. 2008, 59, 1690–1697. [Google Scholar] [CrossRef] [PubMed]
- Gabriel, S.E. Cardiovascular morbidity and mortality in rheumatoid arthritis. Am. J. Med. 2008, 121, S9–S14. [Google Scholar] [CrossRef] [PubMed] [Green Version]
- Gioia, C.; Lucchino, B.; Tarsitano, M.G.; Iannuccelli, C.; Di Franco, M. Dietary Habits and Nutrition in Rheumatoid Arthritis: Can Diet Influence Disease Development and Clinical Manifestations? Nutrients 2020, 12, 1456. [Google Scholar] [CrossRef]
- Cassotta, M.; Forbes-Hernandez, T.Y.; Cianciosi, D.; Elexpuru Zabaleta, M.; Sumalla Cano, S.; Dominguez, I.; Bullon, B.; Regolo, L.; Alvarez-Suarez, J.M.; Giampieri, F.; et al. Nutrition and Rheumatoid Arthritis in the ‘Omics’ Era. Nutrients 2021, 13, 763. [Google Scholar] [CrossRef]
- Schneider, M.; Baseler, G.; Funken, O.; Heberger, S.; Kiltz, U.; Klose, P.; Krüger, K.; Langhorst, J.; Mau, W.; Oltman, R. Management der frühen rheumatoiden Arthritis. Z. Für Rheumatol. 2020, 79, 1–38. [Google Scholar] [CrossRef]
- Deutsche Gesellschaft für Ernährung (DGE); Österreichische Gesellschaft für Ernährung (ÖGE); Schweizerische Gesellschaft für Ernährung (SGE). D-A-CH-Referenzwerte für die Nährstoffzufuhr; Neuer Umschau Buchverlag: Bonn, Germany, 2018. [Google Scholar]
- Gromnica-Ihle, E. Rheuma ist heute gut behandelbar! In Rheuma Ist behandelbar: Ratgeber für Betroffene; Springer: Berlin/Heidelberg, Germany, 2018; pp. 31–74. [Google Scholar]
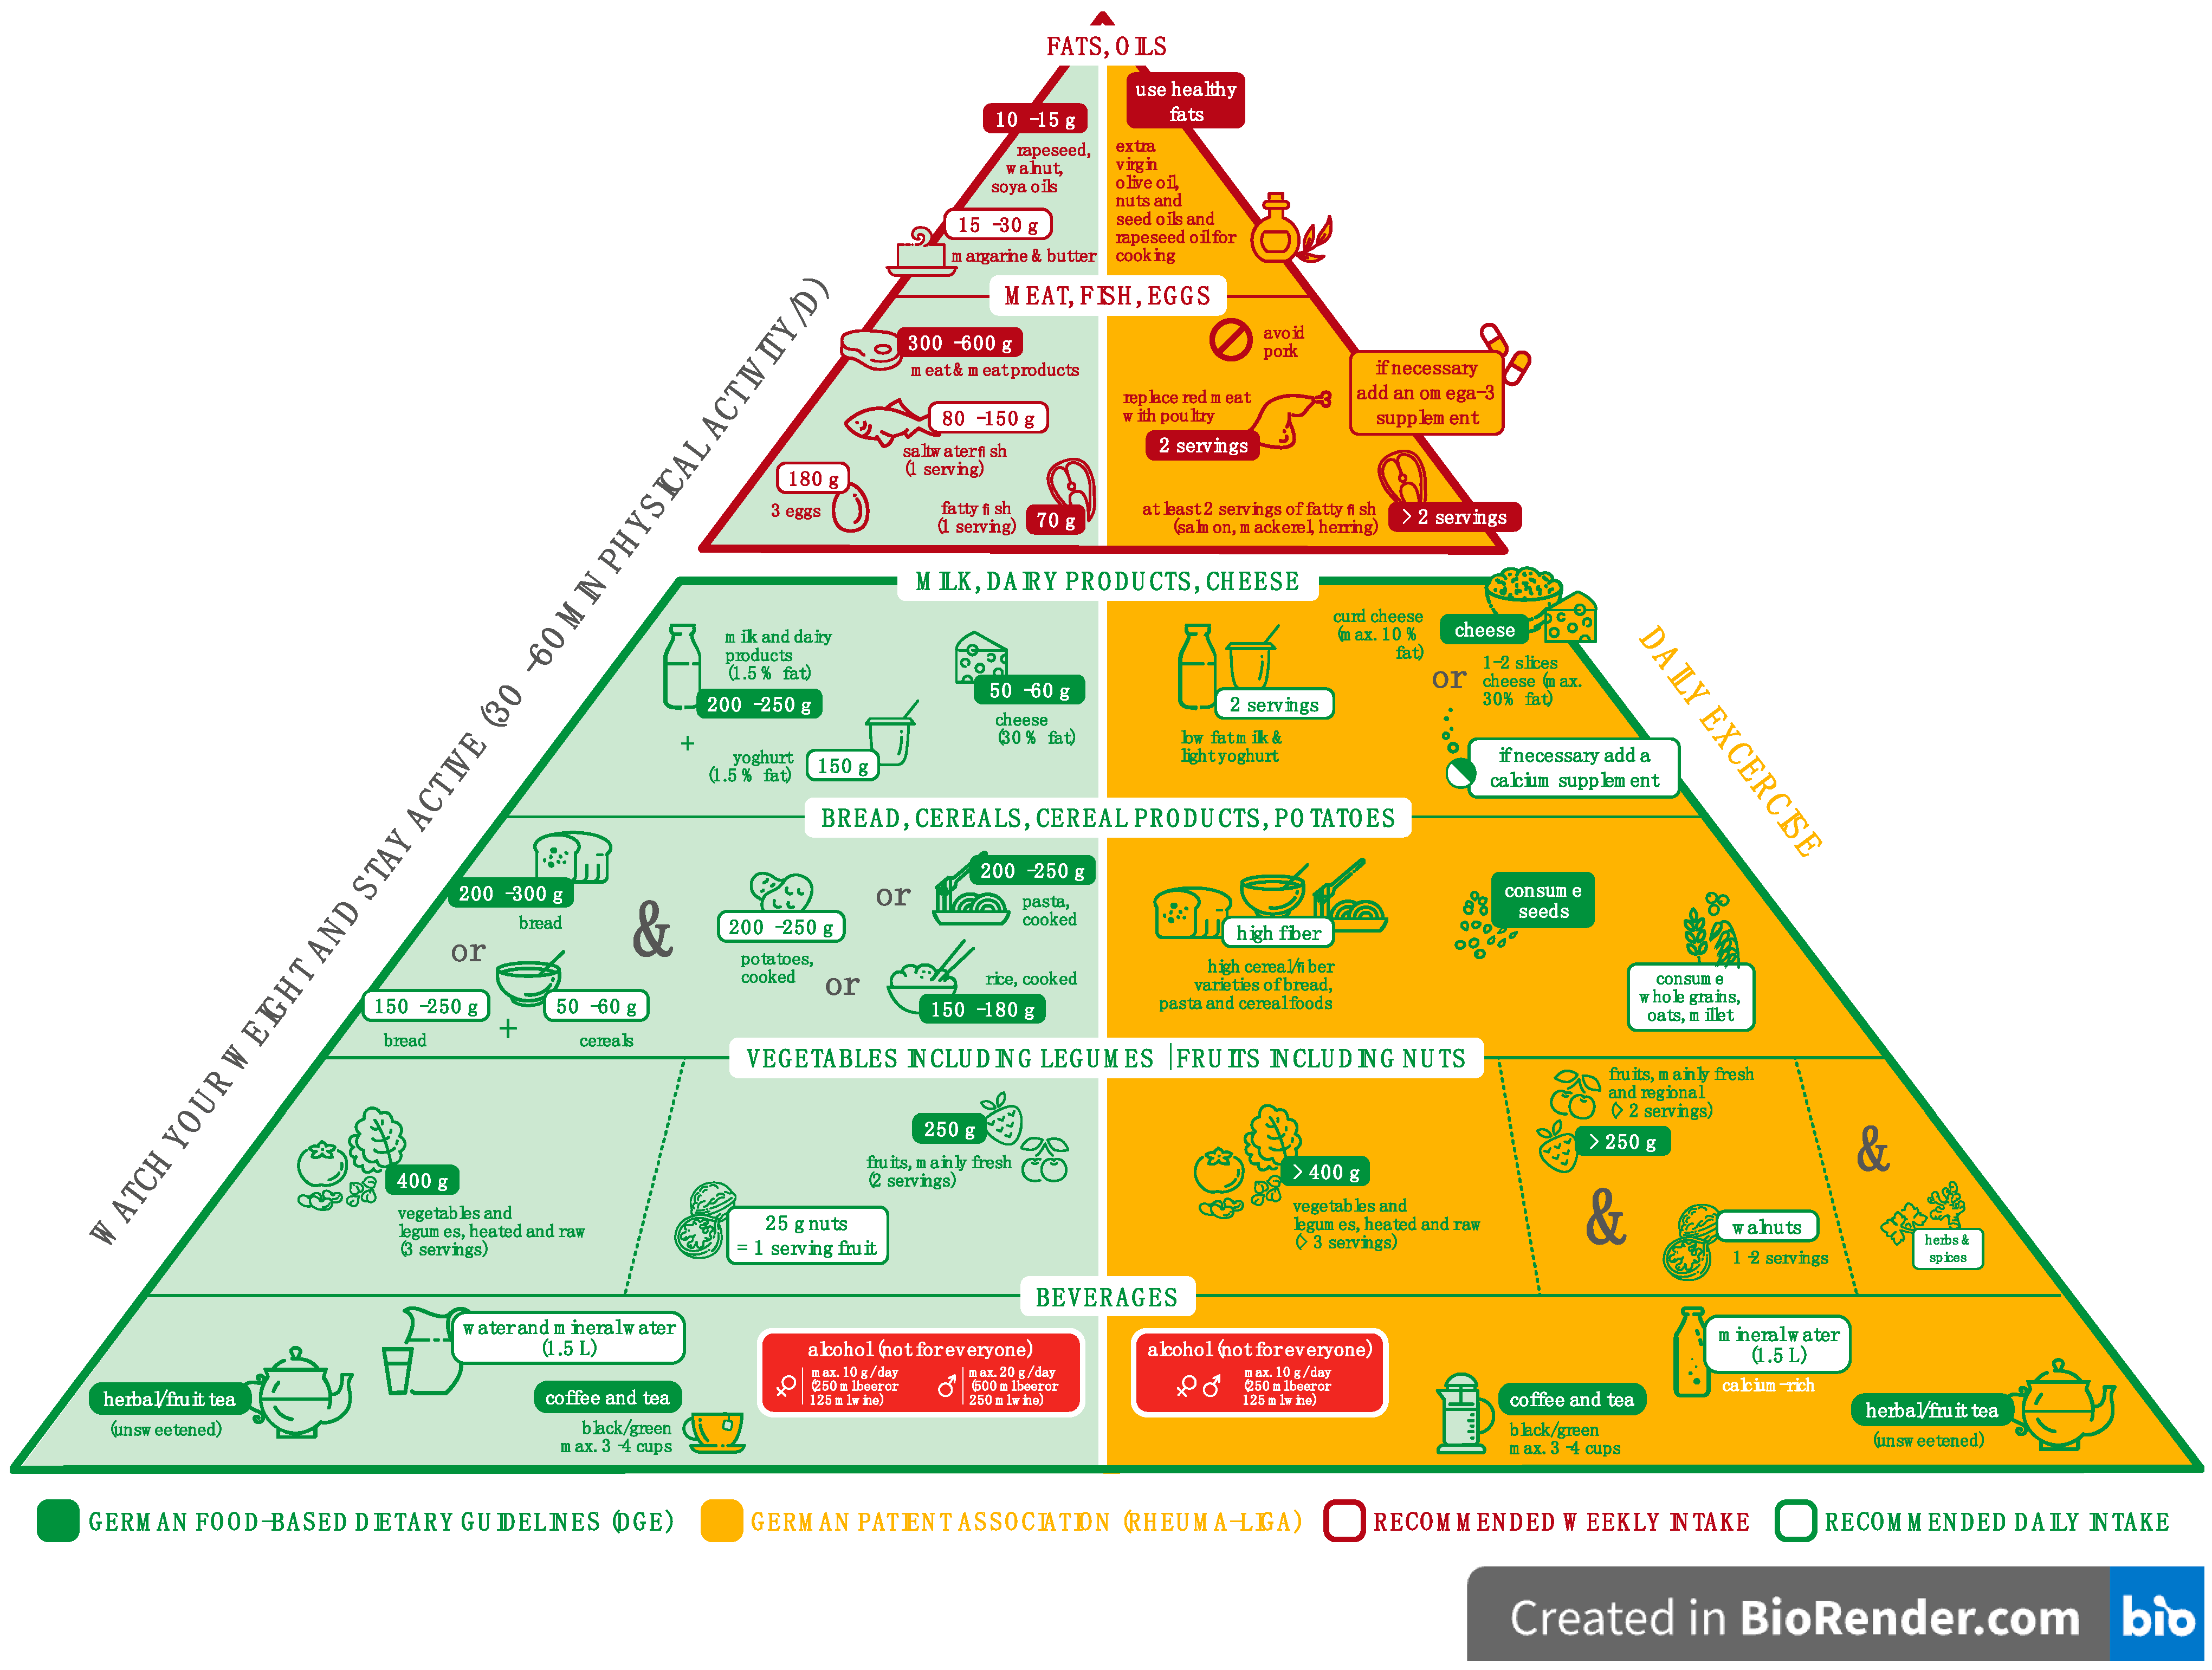
- Rondanelli, M.; Perdoni, F.; Peroni, G.; Caporali, R.; Gasparri, C.; Riva, A.; Petrangolini, G.; Faliva, M.A.; Infantino, V.; Naso, M.; et al. Ideal food pyramid for patients with rheumatoid arthritis: A narrative review. Clin. Nutr. 2021, 40, 661–689. [Google Scholar] [CrossRef]
- Philippou, E.; Nikiphorou, E. Are we really what we eat? Nutrition and its role in the onset of rheumatoid arthritis. Autoimmun. Rev. 2018, 17, 1074–1077. [Google Scholar] [CrossRef] [PubMed] [Green Version]
- Martinsson, K.; Dürholz, K.; Schett, G.; Zaiss, M.M.; Kastbom, A. Higher serum levels of short-chain fatty acids are associated with non-progression to arthritis in individuals at increased risk of RA. Ann. Rheum. Dis. 2022, 81, 445–447. [Google Scholar] [CrossRef] [PubMed]
- Lucas, S.; Omata, Y.; Hofmann, J.; Böttcher, M.; Iljazovic, A.; Sarter, K.; Albrecht, O.; Schulz, O.; Krishnacoumar, B.; Krönke, G.; et al. Short-chain fatty acids regulate systemic bone mass and protect from pathological bone loss. Nat. Commun. 2018, 9, 55. [Google Scholar] [CrossRef] [Green Version]
- Dürholz, K.; Hofmann, J.; Iljazovic, A.; Häger, J.; Lucas, S.; Sarter, K.; Strowig, T.; Bang, H.; Rech, J.; Schett, G.; et al. Dietary Short-Term Fiber Interventions in Arthritis Patients Increase Systemic SCFA Levels and Regulate Inflammation. Nutrients 2020, 12, 3207. [Google Scholar] [CrossRef] [PubMed]
- de Vos, W.M.; Tilg, H.; Van Hul, M.; Cani, P.D. Gut microbiome and health: Mechanistic insights. Gut 2022, 71, 1020–1032. [Google Scholar] [CrossRef] [PubMed]
- Häger, J.; Bang, H.; Hagen, M.; Frech, M.; Träger, P.; Sokolova, M.V.; Steffen, U.; Tascilar, K.; Sarter, K.; Schett, G.; et al. The Role of Dietary Fiber in Rheumatoid Arthritis Patients: A Feasibility Study. Nutrients 2019, 11, 2392. [Google Scholar] [CrossRef] [Green Version]
- Aletaha, D.; Neogi, T.; Silman, A.J.; Funovits, J.; Felson, D.T.; Bingham III, C.O.; Birnbaum, N.S.; Burmester, G.R.; Bykerk, V.P.; Cohen, M.D. 2010 rheumatoid arthritis classification criteria: An American College of Rheumatology/European League against Rheumatism collaborative initiative. Arthritis Rheum. 2010, 62, 2569–2581. [Google Scholar] [CrossRef]
- WHO. Waist Circumference and Waist-Hip Ratio: Report of a WHO Expert Consultation; WHO: Geneva, Switzerland, 2011. [Google Scholar]
- Deurenberg, P.; Yap, M. The assessment of obesity: Methods for measuring body fat and global prevalence of obesity. Baillieres Best. Pr. Res. Clin. Endocrinol. Metab. 1999, 13, 1–11. [Google Scholar] [CrossRef]
- Slama, I.B.; Allali, F.; Lakhdar, T.; El Kabbaj, S.; Medrare, L.; Ngeuleu, A.; Rkain, H.; Hajjaj-Hassouni, N. Reliability and validity of CDAI and SDAI indices in comparison to DAS-28 index in Moroccan patients with rheumatoid arthritis. BMC Musculoskelet. Disord. 2015, 16, 268. [Google Scholar] [CrossRef] [Green Version]
- Friedewald, W.T.; Levy, R.I.; Fredrickson, D.S. Estimation of the concentration of low-density lipoprotein cholesterol in plasma, without use of the preparative ultracentrifuge. Clin. Chem. 1972, 18, 499–502. [Google Scholar] [CrossRef]
- Sun, C.J.; McCudden, C.; Brisson, D.; Shaw, J.; Gaudet, D.; Ooi, T.C. Calculated Non-HDL Cholesterol Includes Cholesterol in Larger Triglyceride-Rich Lipoproteins in Hypertriglyceridemia. J. Endocr. Soc. 2020, 4, bvz010. [Google Scholar] [CrossRef] [PubMed] [Green Version]
- Lührmann, P.; Herbert, B.; Gaster, C.; Neuhäuser-Berthold, M. Validation of a self-administered 3-day estimated dietary record for use in the elderly. Eur. J. Nutr. 1999, 38, 235–240. [Google Scholar] [CrossRef] [PubMed]
- Panel on Dietetic products, Nutrition and Allergies. Scientific Opinion on the safety of caffeine. EFSA J. 2015, 13, 4102. [Google Scholar]
- Turesson Wadell, A.; Bärebring, L.; Hulander, E.; Gjertsson, I.; Lindqvist, H.M.; Winkvist, A. Inadequate Dietary Nutrient Intake in Patients With Rheumatoid Arthritis in Southwestern Sweden: A Cross-Sectional Study. Front. Nutr. 2022, 9, 915064. [Google Scholar] [CrossRef] [PubMed]
- Berube, L.T.; Kiely, M.; Yazici, Y.; Woolf, K. Diet quality of individuals with rheumatoid arthritis using the Healthy Eating Index (HEI)-2010. Nutr. Health 2017, 23, 17–24. [Google Scholar] [CrossRef]
- Hejazi, J.; Mohtadinia, J.; Kolahi, S.; Bakhtiyari, M.; Delpisheh, A. Nutritional status of Iranian women with rheumatoid arthritis: An assessment of dietary intake and disease activity. Womens Health 2011, 7, 599–605. [Google Scholar] [CrossRef]
- Naseri, H.; Zarrin, R.; Ayremlou, P.; Aghdashi, M.A.; Seyedmardani, S. Evaluating the relationship between dietary intake with inflammatory factors, lipid profile and clinical symptoms in patients with rheumatoid arthritis. Clin. Nutr. ESPEN 2020, 40, 138–143. [Google Scholar] [CrossRef]
- Matsunaga, M.; Lim, E.; Davis, J.; Chen, J.J. Dietary Quality Associated with Self-Reported Diabetes, Osteoarthritis, and Rheumatoid Arthritis among Younger and Older US Adults: A Cross-Sectional Study Using NHANES 2011-2016. Nutrients 2021, 13, 545. [Google Scholar] [CrossRef]
- Hayashi, H.; Satoi, K.; Sato-Mito, N.; Kaburagi, T.; Yoshino, H.; Higaki, M.; Nishimoto, K.; Sato, K. Nutritional status in relation to adipokines and oxidative stress is associated with disease activity in patients with rheumatoid arthritis. Nutrition 2012, 28, 1109–1114. [Google Scholar] [CrossRef]
- Adam, O.; Beringer, C.; Kless, T.; Lemmen, C.; Adam, A.; Wiseman, M.; Adam, P.; Klimmek, R.; Forth, W. Anti-inflammatory effects of a low arachidonic acid diet and fish oil in patients with rheumatoid arthritis. Rheumatol. Int. 2003, 23, 27–36. [Google Scholar] [CrossRef]
- Ascione, S.; Barde, F.; Artaud, F.; Nguyen, Y.; Macdonald, C.; Mariette, X.; Boutron-Ruault, M.C.; Salliot, C.; Seror, R. Association between beverage consumption and risk of rheumatoid arthritis: A prospective study from the French E3N Cohort. Rheumatology 2022. [Google Scholar] [CrossRef] [PubMed]
- Andersson, J.; Gustafsson, K.; Fjellström, C.; Sidenvall, B.; Nydahl, M. Five-day food intake in elderly female outpatients with Parkinson’s disease, rheumatoid arthritis or stroke. J. Nutr. Health Aging 2004, 8, 414–421. [Google Scholar] [PubMed]
- Bel-Serrat, S.; Julián-Almárcegui, C.; González-Gross, M.; Mouratidou, T.; Börnhorst, C.; Grammatikaki, E.; Kersting, M.; Cuenca-García, M.; Gottrand, F.; Molnár, D.; et al. Correlates of dietary energy misreporting among European adolescents: The Healthy Lifestyle in Europe by Nutrition in Adolescence (HELENA) study. Br. J. Nutr. 2016, 115, 1439–1452. [Google Scholar] [CrossRef] [PubMed] [Green Version]
- Jones, L.; Ness, A.; Emmett, P. Misreporting of Energy Intake From Food Records Completed by Adolescents: Associations With Sex, Body Image, Nutrient, and Food Group Intake. Front. Nutr. 2021, 8, 749007. [Google Scholar] [CrossRef]
- Macdiarmid, J.; Blundell, J. Assessing dietary intake: Who, what and why of under-reporting. Nutr. Res. Rev. 1998, 11, 231–253. [Google Scholar] [CrossRef] [Green Version]
- Bandini, L.G.; Schoeller, D.A.; Cyr, H.N.; Dietz, W.H. Validity of reported energy intake in obese and nonobese adolescents. Am. J. Clin. Nutr. 1990, 52, 421–425. [Google Scholar] [CrossRef] [PubMed]
- Prentice, A.; Davies, H.; Black, A.; Ashford, J.; Coward, W.; Murgatroyd, P.; Goldberg, G.; Sawyer, M.; Whitehead, R. Unexpectedly low levels of energy expenditure in healthy women. Lancet 1985, 325, 1419–1422. [Google Scholar] [CrossRef] [PubMed]
- Schoeller, D.A. How accurate is self-reported dietary energy intake? Nutr. Rev. 1990, 48, 373–379. [Google Scholar] [CrossRef]
- Lührmann, P.M.; Herbert, B.M.; Neuhäuser-Berthold, M. Underreporting of energy intake in an elderly German population. Nutrition 2001, 17, 912–916. [Google Scholar] [CrossRef]
- Kremer, J.M.; Bigaouette, J. Nutrient intake of patients with rheumatoid arthritis is deficient in pyridoxine, zinc, copper, and magnesium. J. Rheumatol. 1996, 23, 990–994. [Google Scholar]
- Arablou, T.; Aryaeian, N.; Djalali, M.; Shahram, F.; Rasouli, L. Association between dietary intake of some antioxidant micronutrients with some inflammatory and antioxidant markers in active Rheumatoid Arthritis patients. Int. J. Vitam. Nutr. Res. 2019, 89, 238–245. [Google Scholar] [CrossRef] [PubMed]
- Comee, L.; Taylor, C.A.; Nahikian-Nelms, M.; Ganesan, L.P.; Krok-Schoen, J.L. Dietary patterns and nutrient intake of individuals with rheumatoid arthritis and osteoarthritis in the United States. Nutrition 2019, 67, 110533. [Google Scholar] [CrossRef] [PubMed]
- Xiong, R.G.; Zhou, D.D.; Wu, S.X.; Huang, S.Y.; Saimaiti, A.; Yang, Z.J.; Shang, A.; Zhao, C.N.; Gan, R.Y.; Li, H.B. Health Benefits and Side Effects of Short-Chain Fatty Acids. Foods 2022, 11, 2863. [Google Scholar] [CrossRef] [PubMed]
- Goodson, N.J.; Wiles, N.J.; Lunt, M.; Barrett, E.M.; Silman, A.J.; Symmons, D.P. Mortality in early inflammatory polyarthritis: Cardiovascular mortality is increased in seropositive patients. Arthritis Rheum. 2002, 46, 2010–2019. [Google Scholar] [CrossRef]
- Soliman, G.A. Dietary fiber, atherosclerosis, and cardiovascular disease. Nutrients 2019, 11, 1155. [Google Scholar] [CrossRef] [PubMed] [Green Version]
- Stephen, A.M.; Champ, M.M.; Cloran, S.J.; Fleith, M.; van Lieshout, L.; Mejborn, H.; Burley, V.J. Dietary fibre in Europe: Current state of knowledge on definitions, sources, recommendations, intakes and relationships to health. Nutr. Res. Rev. 2017, 30, 149–190. [Google Scholar] [CrossRef] [Green Version]
- Gómez-Vaquero, C.; Nolla, J.M.; Fiter, J.; Ramon, J.M.; Concustell, R.; Valverde, J.; Roig-Escofet, D. Nutritional status in patients with rheumatoid arthritis. Jt. Bone Spine 2001, 68, 403–409. [Google Scholar] [CrossRef]
- Naranjo, A.; Sokka, T.; Descalzo, M.A.; Calvo-Alén, J.; Hørslev-Petersen, K.; Luukkainen, R.K.; Combe, B.; Burmester, G.R.; Devlin, J.; Ferraccioli, G. Cardiovascular disease in patients with rheumatoid arthritis: Results from the QUEST-RA study. Arthritis Res. Ther. 2008, 10, R30. [Google Scholar] [CrossRef] [Green Version]
- Wolfe, F.; Michaud, K. Effect of body mass index on mortality and clinical status in rheumatoid arthritis. Arthritis Care Res. 2012, 64, 1471–1479. [Google Scholar] [CrossRef]
- Semb, A.G.; Ikdahl, E.; Wibetoe, G.; Crowson, C.; Rollefstad, S. Atherosclerotic cardiovascular disease prevention in rheumatoid arthritis. Nat. Rev. Rheumatol. 2020, 16, 361–379. [Google Scholar] [CrossRef]
- Elkan, A.-C.; Håkansson, N.; Frostegård, J.; Cederholm, T.; Hafström, I. Rheumatoid cachexia is associated with dyslipidemia and low levels of atheroprotective natural antibodies against phosphorylcholine but not with dietary fat in patients with rheumatoid arthritis: A cross-sectional study. Arthritis Res. Ther. 2009, 11, R37. [Google Scholar] [CrossRef] [Green Version]
- Brunner, F.J.; Waldeyer, C.; Ojeda, F.; Salomaa, V.; Kee, F.; Sans, S.; Thorand, B.; Giampaoli, S.; Brambilla, P.; Tunstall-Pedoe, H. Application of non-HDL cholesterol for population-based cardiovascular risk stratification: Results from the Multinational Cardiovascular Risk Consortium. Lancet 2019, 394, 2173–2183. [Google Scholar] [CrossRef] [PubMed]
- Liao, K.P.; Liu, J.; Lu, B.; Solomon, D.H.; Kim, S.C. Association between lipid levels and major adverse cardiovascular events in rheumatoid arthritis compared to non–rheumatoid arthritis patients. Arthritis Rheumatol. 2015, 67, 2004–2010. [Google Scholar] [CrossRef] [PubMed] [Green Version]
- Wibetoe, G.; Ikdahl, E.; Rollefstad, S.; Olsen, I.C.; Bergsmark, K.; Kvien, T.K.; Salberg, A.; Soldal, D.M.; Bakland, G.; Lexberg, Å. Cardiovascular disease risk profiles in inflammatory joint disease entities. Arthritis Res. Ther. 2017, 19, 153. [Google Scholar] [CrossRef] [PubMed] [Green Version]
- O’Driscoll, N.; Kennedy, N.; Anjum, S.; Fraser, A.; Hannigan, A. Comparing cardiovascular risk factors, disease and treatment in participants with rheumatoid arthritis and without arthritis in a population based study. Ir Med J. 2017, 110, 562. [Google Scholar]
- Members, A.T.F.; Perk, J.; De Backer, G.; Gohlke, H.; Graham, I.; Reiner, Ž.; Verschuren, M.; Albus, C.; Benlian, P.; Boysen, G. European Guidelines on cardiovascular disease prevention in clinical practice (version 2012) The Fifth Joint Task Force of the European Society of Cardiology and Other Societies on Cardiovascular Disease Prevention in Clinical Practice (constituted by representatives of nine societies and by invited experts) Developed with the special contribution of the European Association for Cardiovascular Prevention & Rehabilitation (EACPR). Eur. Heart J. 2012, 33, 1635–1701. [Google Scholar]
- Castro-Barquero, S.; Ruiz-León, A.M.; Sierra-Pérez, M.; Estruch, R.; Casas, R. Dietary strategies for metabolic syndrome: A comprehensive review. Nutrients 2020, 12, 2983. [Google Scholar] [CrossRef]
- Heuer, T.; Krems, C.; Moon, K.; Brombach, C.; Hoffmann, I. Food consumption of adults in Germany: Results of the German National Nutrition Survey II based on diet history interviews. Br. J. Nutr. 2015, 113, 1603–1614. [Google Scholar] [CrossRef]
- Krems, C.; Walter, C.; Heuer, T.; Hoffmann, I. Nationale Verzehrsstudie II—Lebensmittelverzehr und Naehrstoffzufuhr auf Basis von 24h-Recalls. Max Rubner-Inst. 2013, 7, 1–12. [Google Scholar]
- Koch, F.; Heuer, T.; Krems, C.; Claupein, E. Meat consumers and non-meat consumers in Germany: A characterisation based on results of the German National Nutrition Survey II. J. Nutr. Sci. 2019, 8, e21. [Google Scholar] [CrossRef] [Green Version]
- Garner, S.; Fenton, T.; Martin, L.; Creaser, C.; Johns, C.; Barnabe, C. Personalized diet and exercise recommendations in early rheumatoid arthritis: A feasibility trial. Musculoskelet. Care 2018, 16, 167–172. [Google Scholar] [CrossRef] [PubMed]
- Silvers, I.J.; Hovell, M.F.; Weisman, M.H.; Mueller, M.R. Assessing physician/patient perceptions in rheumatoid arthritis. A vital component in patient education. Arthritis Rheum. Off. J. Am. Coll. Rheumatol. 1985, 28, 300–307. [Google Scholar] [CrossRef]
- Ndosi, M.; Ferguson, R.; Backhouse, M.R.; Bearne, L.; Ainsworth, P.; Roach, A.; Dennison, E.; Cherry, L. National variation in the composition of rheumatology multidisciplinary teams: A cross-sectional study. Rheumatol. Int. 2017, 37, 1453–1459. [Google Scholar] [CrossRef] [PubMed] [Green Version]
- Grotle, M.; Klokkerud, M.; Kjeken, I.; Bremander, A.; Hagel, S.; Strömbeck, B.; Hørslev-Petersen, K.; Meesters, J.; Vliet Vlieland, T.P.; Hagen, K.B. What’s in the black box of arthritis rehabilitation?: A comparison of rehabilitation practice for patients with inflammatory arthritis in Northern Europe. J. Rehabil. Med. 2013, 45, 458–466. [Google Scholar] [CrossRef] [PubMed] [Green Version]
- Ngo, S.T.; Steyn, F.J.; McCombe, P.A. Gender differences in autoimmune disease. Front. Neuroendocrinol. 2014, 35, 347–369. [Google Scholar] [CrossRef]


| Variable | Unit | Female (n = 41) | Male (n = 20) |
|---|---|---|---|
| Demographic data | |||
| n | % | 67 | 33 |
| Age * | years | 65 (58–71) | 57 (53.3–61.5) |
| 63.88 ± 10.81 | 58 ± 9.53 | ||
| RA-specific data | |||
| Disease duration * | years | 3 (1.0–10) | 0.8 (0.5–3.6) |
| 7.97 ± 10.95 | 4.94 ± 10.40 | ||
| SDAI * | units | 11.9 (6.1–20.1) | 10.2 (7.1–15.1) |
| 13.64 ± 9.47 | 11.04 ± 5.71 | ||
| CRP * | mg/dL | 0.2 (0.1–0.4) | 0.2 (0.1–0.5) |
| 0.5 ± 0.9 | 0.4 ± 0.5 | ||
| Rheumatoid Factor IgM positive | n (%) | 15 (37) | 6 (30) |
| Anti-CCP-IgG antibody positive | n (%) | 13 (32) | 4 (20) |
| Anti-rheumatic treatment | |||
| Methotrexate | n (%) | 14 (34) | 5 (25) |
| Other conventional (cs)-DMARDs | n (%) | 6 (15) | 1 (5) |
| Targeted synthesized (ts)-DMARDs | n (%) | 2 (5) | 1 (5) |
| Biologicals | n (%) | 9 (22) | 4 (20) |
| Glucocorticoids | n (%) | 10 (24) | 6 (30) |
| Variable | Unit | Female (n = 41) | Male (n= 20) |
|---|---|---|---|
| BMI * | kg/m2 | 25.7 (22.6–30.81) | 27.8 (25.7–30.3) |
| 26.98 ± 5.62 | 28.12 ± 3.39 | ||
| <18.5 | n (%) | 0 | 0 |
| 18.5–24.99 | n (%) | 19 (46) | 4 (20) |
| 25–29.99 | n (%) | 9 (22) | 10 (50) |
| 30–34.99 | n (%) | 8 (20) | 5 (25) |
| 35–39.99 | n (%) | 5 (12) | 1 (5) |
| WHR * | W/H | 0.9 (0.8–0.9) | 1 (0.9–1) |
| 0.9 ± 0.1 | 1 ± 0.0 | ||
| above normal values 1 | n (%) | 26 (63) | 13 (65) |
| Waist circumference * | cm | 94.5 (86.8–103.2) | 105 (100–112.8) |
| 97.2 ± 14 | 106.4 ± 8.8 | ||
| above normal values 2 | n (%) | 38 (93) | 19 (95) |
| Biochemical data | |||
| Total cholesterol * | mmol/L | 6.08 (5.22–6.39) | 5.34 (4.7–6.6) |
| 5.9 ± 1.1 | 5.5 ± 1.2 | ||
| above normal values 3 | n (%) | 31 (76) | 12 (60) |
| Fasting triglycerides * | mmol/L | 1.28 (1.03–2.0) | 1.37 (1.09–2.19) |
| 3.4 ± 1.6 | 3.9 ± 1.9 | ||
| above normal values 4 | n (%) | 7 (17) | 5 (25) |
| HDL-cholesterol * | mmol/L | 1.76 (1.47–2.15) | 1.33 (1.21–1.63) |
| 1.8 ± 0.4 | 1.5 ± 0.4 | ||
| above normal values 5 | n (%) | 7 (17) | 11 (55) |
| LDL-cholesterol * | mmol/L | 3.36 (2.72–3.9) | 3.09 (2.61–4.32) |
| 3.4 ± 1 | 3.3 ± 1.1 | ||
| above normal values 6 | n (%) | 20 (49) | 9 (45) |
| Non-HDL-cholesterol * | mmol/L | 4.19 (3.41–4.73) | 3.96 (3.25–5.0) |
| 4.1 ± 1.1 | 4.1 ± 1.2 | ||
| above normal values 7 | n (%) | 31 (76) | 13 (65) |
| Macronutrient | Unit | Indexes | Female (n = 41) | Male (n = 20) | Recommendations * | p-Value |
|---|---|---|---|---|---|---|
| Women/Men | ||||||
| Energy | kcal/day | Median (IQR) | 1557 (1193–1806) | 1493 (1350–1932) | 25–51 years: 1800/2300 1 | 0.46 |
| Mean ± SD | 1492 ± 417 | 1685 ± 588 | 51–65 years: 1700/2200 1 | |||
| % of norm | 86.1 | 77.6 | >65 years: 1700/2100 1 | |||
| Carbohydrate | g/day | Median (IQR) | 160 (128.1–189.8) | 182.7 (150.8–205.3) | >50% Energy 2 | 0.12 |
| Mean ± SD | 158.5 ± 49.6 | 189.5 ± 69 | ||||
| % of norm | 73.2 | 68.9 | ||||
| Of which sugar | g/day | Median (IQR) | 27 (17.9–36.7) | 28.3 (17.9–39) | max. 10% Energy 3 | 0.88 |
| Mean ± SD | 30.8 ± 16.7 | 30.1 ± 17.9 | ||||
| % of norm | 71.1 | 54.7 | ||||
| Protein | g/day | Median (IQR) | 54.5 (46.8–65.2) | 63.9 (47.7–75.5) | 25–51 years: 0.8 g/kg BW 4 | 0.07 |
| Mean ± SD | 53.5 ± 16.3 | 63.7 ± 18.4 | 51–65 years: 0.8 g/kg BW 4 | |||
| % of norm | 114.5 | 116.2 | >65 years: 1.0 g/kg BW 4 | |||
| Fat | g/day | Median (IQR) | 63.6 (46.6–78.0) | 56.5 (41.2–77.2) | 30% Energy 5 | 0.64 |
| Mean ± SD | 62.9 ± 21.9 | 63 ± 32.1 | ||||
| % of norm | 109 | 86 | ||||
| SFA | g/day | Median (IQR) | 27.2 (18.4–34.3) | 24.2 (17.1–32.1) | max. 10% Energy 5 | 0.47 |
| Mean ± SD | 26.9 ± 9.9 | 26.1 ± 15.2 | ||||
| % of norm | 140 | 107 | ||||
| MUFA | g/day | Median (IQR) | 20.7 (14–25.7) | 18.1 (12.4–25.8) | 7–10% Energy 5 | 0.49 |
| Mean ± SD | 20.5 ± 8 | 19.3 ± 9.5 | ||||
| % of norm | 125 | 93 | ||||
| PUFA | g/day | Median (IQR) | 8.3 (5.5–11) | 8.3 (5.4–11.6) | 0.86 | |
| Mean ± SD | 9.2 ± 5.5 | 9.8 ± 6.1 | ||||
| LA | g/day | Median (IQR) | 6.2 (4.38–8.48) | 6.2 (4.5–9.1) | 2.5% Energy 5 | 0.98 |
| Mean ± SD | 7.3 ± 4.1 | 7.6 ± 5.5 | ||||
| % of norm | 152 | 124 | ||||
| ALA | g/day | Median (IQR) | 0.8 (0.7–1.2) | 0.8 (0.5–1) | 0.5% Energy 5 | 0.45 |
| Mean ± SD | 1.2 ± 1.3 | 0.9 ± 0.6 | ||||
| % of norm | 125 | 74 | ||||
| AA | mg/day | Median (IQR) | 100 (70–140) | 80 (48–120) | 0.27 | |
| Mean ± SD | 127 ± 109 | 97 ± 76 | ||||
| EPA | mg/day | Median (IQR) | 0 (0–100) | 0 (0–100) | 0.84 | |
| Mean ± SD | 101 ± 199 | 159 ± 314 | ||||
| DHA | mg/day | Median (IQR) | 100 (0–300) | 100 (0–200) | 0.72 | |
| Mean ± SD | 171 ± 233 | 246 ± 426 |
| Others | Unit | Indexes | Female (n = 41) | Male (n = 20) | Recommendations | p-Value |
|---|---|---|---|---|---|---|
| Women/Men | ||||||
| Fiber | g/day | Median (IQR) | 15.3 (11.2–19.6) | 15.6 (10.8–21) | ≥30 1 | 0.8 |
| Mean ± SD | 15.9 ± 7.1 | 16.7 ± 7.2 | ||||
| % of norm | 53 | 55.5 | ||||
| Insoluble fiber | g/day | Median (IQR) | 10.8 (7.5–13.41) | 9.8 (7.5–13.8) | 0.88 | |
| Min.–Max. | 10.8 ± 5.1 | 11.1 ± 4.8 | ||||
| Soluble fiber | g/day | Median (IQR) | 4.9 (3.8–6.7) | 5.2 (3.5–7.3) | 0.65 | |
| Mean ± SD | 5.1 ± 2.2 | 5.5 ± 2.5 | ||||
| Cholesterol | mg/day | Median (IQR) | 232.7 (154.2–333.9) | 205.4 (163.9–245.2) | 300 2 | 0.29 |
| Mean ± SD | 249.7 ± 125.5 | 206.2 ± 92.5 | ||||
| % of norm | 83.2 | 68.7 | ||||
| Alcohol | g/day | Median (IQR) | 0.1 (0–5.9) | 1.2 (0–8.3) | 10/20 3 | 0.31 |
| Mean ± SD | 4.4 ± 8.9 | 8.4 ± 14.6 | ||||
| % of norm | 44 | 42 | ||||
| Salt | g/day | Median (IQR) | 5 (4–5.8) | 4 (2.7–5.2) | 6 4 | 0.06 |
| Mean ± SD | 4.1 ± 1.6 | 4.9 ± 1.4 | ||||
| % of norm | 68.3 | 81.7 | ||||
| Caffeine | mg/day | Median (IQR) | 300 (124–600) | 460 (335–802) | 400 5 | 0.04 * |
| Mean ± SD | 397 ± 337.9 | 638.7 ± 493.6 | ||||
| % of norm | 99.3 | 159.7 |
| Micronutrient | Unit | Indexes | Female (n = 41) | Male (n = 20) | Recommendations * | p-Value |
|---|---|---|---|---|---|---|
| Women/Men | ||||||
| Vitamin A | µg RE/day | Median (IQR) | 900 (600–1300) | 600 (400–900) | 25–51 years: 700/850 1 | 0.07 |
| Mean ± SD | 1091.2 ± 834.6 | 786.7 ± 554.5 | 51–65 years: 700/850 1 | |||
| % of norm | 155.9 | 94.4 | >65 years: 700/800 1 | |||
| Vitamin D | µg/day | Median (IQR) | 1.6 (1.1–2.6) | 1.5 (0.8–2.6) | 20 2 | 0.58 |
| Mean ± SD | 2.8 ± 4.8 | 3.5 ± 5.5 | ||||
| % of norm | 14 | 17.5 | ||||
| Vitamin E | mg α-TE/day | Median (IQR) | 8 (5.6–11.9) | 6.8 (5.2–9.0) | 25–51 years: 12/14 3 | 0.27 |
| Mean ± SD | 9 ± 4.6 | 8.2 ± 5.9 | 51–65 years: 12/13 3 | |||
| % of norm | 76.9 | 63.1 | >65 years: 11/12 3 | |||
| Vitamin K | µg/day | Median (IQR) | 55.5 (35.9–100.9) | 43.3 (30.7–52.3) | 25–51 years: 60/70 4 >51 years: 65/80 4 | 0.06 |
| Mean ± SD | 113.6 ± 291.8 | 43.6 ± 16.2 | ||||
| % of norm | 181.8 | 58.1 | ||||
| Vitamin B6 | mg/day | Median (IQR) | 1 (0.8–1.2) | 1.2 (0.8–1.4) | 1.4/1.6 5 | 0.2 |
| Mean ± SD | 1 ± 0.4 | 1.2 ± 0.4 | ||||
| % of norm | 71.4 | 75 | ||||
| Folate | µg/day | Median (IQR) | 171.9 (122.8–205.8) | 140.1 (111.4–202) | 300 6 | 0.54 |
| Mean ± SD | 169.3 ± 68.8 | 159.4 ± 63.3 | ||||
| % of norm | 56.4 | 53.1 | ||||
| Sodium | mg/day | Median (IQR) | 1769.1 (1207.3–2214.9) | 2214.6 (1733.1–2585.7) | 1500 7 | 0.04 * |
| Mean ± SD | 1803.8 ± 698.6 | 2195.3 ± 675.8 | ||||
| % of norm | 120.3 | 146.4 | ||||
| Calcium | mg/day | Median (IQR) | 625 (456–779) | 524 (419–736) | 1000 8 | 0.35 |
| Mean ± SD | 625.1 ± 234.9 | 589.7 ± 303. 7 | ||||
| % of norm | 62.5 | 59 | ||||
| Magnesium | mg/day | Median (IQR) | 241.6 (179.1–303.3) | 269.8 (227.5–285.1) | 300/350 9 | 0.22 |
| Mean ± SD | 243.4 ± 81.4 | 268.7 ± 66.1 | ||||
| % of norm | 81.1 | 76.8 | ||||
| Iron | mg/day | Median (IQR) | 8.5 (7–11.4) | 9.2 (7.9–11.1) | 25–51 years: 15/10 10 >51 years: 10 10 | 0.58 |
| Mean ± SD | 9 ± 3.2 | 9.6 ± 3 | ||||
| % of norm | 72 | 96 | ||||
| Zinc | mg/day | Median (IQR) | 7 (5.4–9.3) | 7.4 (4.6–9) | 8/14 11 | 0.9 |
| Mean ± SD | 7.2 ± 2.5 | 7.3 ± 3 | ||||
| % of norm | 90 | 52.1 | ||||
| Copper | mg/day | Median (IQR) | 1.4 (1.2–1.7) | 1.6 (1.3–1.9) | 1.0–1.5 12 | 0.22 |
| Mean ± SD | 1.5 ± 0.5 | 1.6 ± 0.5 | ||||
| % of norm | 120 | 128 |
| Food Group | Unit | Indexes | Female (n = 41) | Male (n = 20) | Guidelines * | p-Value |
|---|---|---|---|---|---|---|
| Bread | g/day | Median (IQR) | 106.7 (75.7–146.7) | 174.8 (83.3–203.4) | 150–300 | 0.02 * |
| Mean ± SD | 111.1 ± 50.7 | 162.6 ± 85.9 | ||||
| % of norm | 49.4 | 72.3 | ||||
| Cereals | g/day | Median (IQR) | 23.3 (0–33.3) | 33.3 (0–45.8) | 50–60 | 0.5 |
| Mean ± SD | 31.9 ± 43.1 | 31.7 ± 29.7 | ||||
| % of norm | 58 | 57.7 | ||||
| Potatoes, rice, pasta, total | g/day | Median (IQR) | 50 (26.7–93.3) | 33.3 (0–95.0) | 150–250 | 0.61 |
| Mean ± SD | 64.05 ± 53.9 | 66.3 ± 81.6 | ||||
| % of norm | 32 | 33.2 | ||||
| Vegetables, mushrooms and pulses | g/day | Median (IQR) | 127.4 (60–225.3) | 109.2 (66.7–185.8) | 400 | 0.84 |
| Mean ± SD | 151.86 ± 119.3 | 132 ± 91.3 | ||||
| % of norm | 38 | 33 | ||||
| Fruits and fruit products (without juice) | g/day | Median (IQR) | 130 (86.7–236.7) | 163.4 (65–203.2) | 250 | 0.98 |
| Mean ± SD | 210.6 ± 278.7 | 192.7 ± 241.5 | ||||
| % of norm | 84.2 | 77.1 | ||||
| Nuts (g/day) | g/day | Median (IQR) | 0 (0–6.7) | 0 (0–0) | 0.12 | |
| Mean ± SD | 6 ± 10.4 | 1.8 ± 4 | ||||
| Milk and dairy products | g/day | Median (IQR) | 56.7 (11.7–101.7) | 53.4 (0–80) | 200–250 | 0.82 |
| Mean ± SD | 71.3 ± 70.3 | 81.5 ± 103.2 | ||||
| % of norm | 31.7 | 36.2 | ||||
| Cheese | g/day | Median (IQR) | 26.7 (13.3–40) | 8.4 (0–47.1) | 50–60 | 0.22 |
| Min.–Max. | 30.8 ± 24.1 | 26.6 ± 33.4 | ||||
| % of norm | 56 | 48.4 | ||||
| Meat, meat products, sausages | g/week | Median (IQR) | 466.9 (233.1–700) | 577.5 (367.3–743.8) | 300–600 | 0.17 |
| Mean ± SD | 471.3 ± 318.2 | 578.4 ± 283.8 | ||||
| % of norm | 104.7 | 128.5 | ||||
| Fish, fish products, seafood | g/week | Median (IQR) | 0 (0–163.1) | 0 (0–326.7) | 150–220 | 0.58 |
| Mean ± SD | 97.2 ± 168.5 | 225.8 ± 367.4 | ||||
| % of norm | 52.6 | 122.1 | ||||
| Eggs | g/week | Median (IQR) | 46.9 (0–140) | 0 (0–140) | 180 | 0.3 |
| Mean ± SD | 114.1 ± 144.9 | 84 ± 131.7 | ||||
| % of norm | 63.4 | 46.7 | ||||
| Butter, margarine and oils | g/day | Median (IQR) | 6.7 (0.7–11.7) | 3 (0–6.2) | 25–45 | 0.01 * |
| Mean ± SD | 11.2 ± 14.1 | 6.3 ± 9.6 | ||||
| % of norm | 32 | 18 | ||||
| Non-alcoholic beverages, total | ml/day | Median (IQR) | 1805 (1333.4–2123.3) | 1795.8 (1518.8–2283.3) | 1500 | 0.83 |
| Mean ± SD | 1768.6 ± 573.1 | 1820.9 ± 613.5 | ||||
| % of norm | 117.9 | 121.4 | ||||
| Confectionary, total | g/day | Median (IQR) | 10 (5–36.7) | 15 (5.8–37.7) | 0.64 | |
| Mean ± SD | 23.3 ± 29.3 | 26.3 ± 30.5 | ||||
| Pastries, total | g/day | Median (IQR) | 66.7 (0–100) | 62.9 ± 16.4 | 0.63 | |
| Mean ± SD | 64.8 ± 62.5 | 62.9 ± 73.3 |
Disclaimer/Publisher’s Note: The statements, opinions and data contained in all publications are solely those of the individual author(s) and contributor(s) and not of MDPI and/or the editor(s). MDPI and/or the editor(s) disclaim responsibility for any injury to people or property resulting from any ideas, methods, instructions or products referred to in the content. |
© 2022 by the authors. Licensee MDPI, Basel, Switzerland. This article is an open access article distributed under the terms and conditions of the Creative Commons Attribution (CC BY) license (https://creativecommons.org/licenses/by/4.0/).
Share and Cite
Heidt, C.; Kämmerer, U.; Marquardt, T.; Reuss-Borst, M. Nutrition Patterns and Their Gender Differences among Rheumatoid Arthritis Patients: A Descriptive Study. Nutrients 2023, 15, 95. https://doi.org/10.3390/nu15010095
Heidt C, Kämmerer U, Marquardt T, Reuss-Borst M. Nutrition Patterns and Their Gender Differences among Rheumatoid Arthritis Patients: A Descriptive Study. Nutrients. 2023; 15(1):95. https://doi.org/10.3390/nu15010095
Chicago/Turabian StyleHeidt, Christina, Ulrike Kämmerer, Thorsten Marquardt, and Monika Reuss-Borst. 2023. "Nutrition Patterns and Their Gender Differences among Rheumatoid Arthritis Patients: A Descriptive Study" Nutrients 15, no. 1: 95. https://doi.org/10.3390/nu15010095