
Simvastatin Improves Microcirculatory Function in Nonalcoholic Fatty Liver Disease and Downregulates Oxidative and ALE-RAGE Stress

 , , and
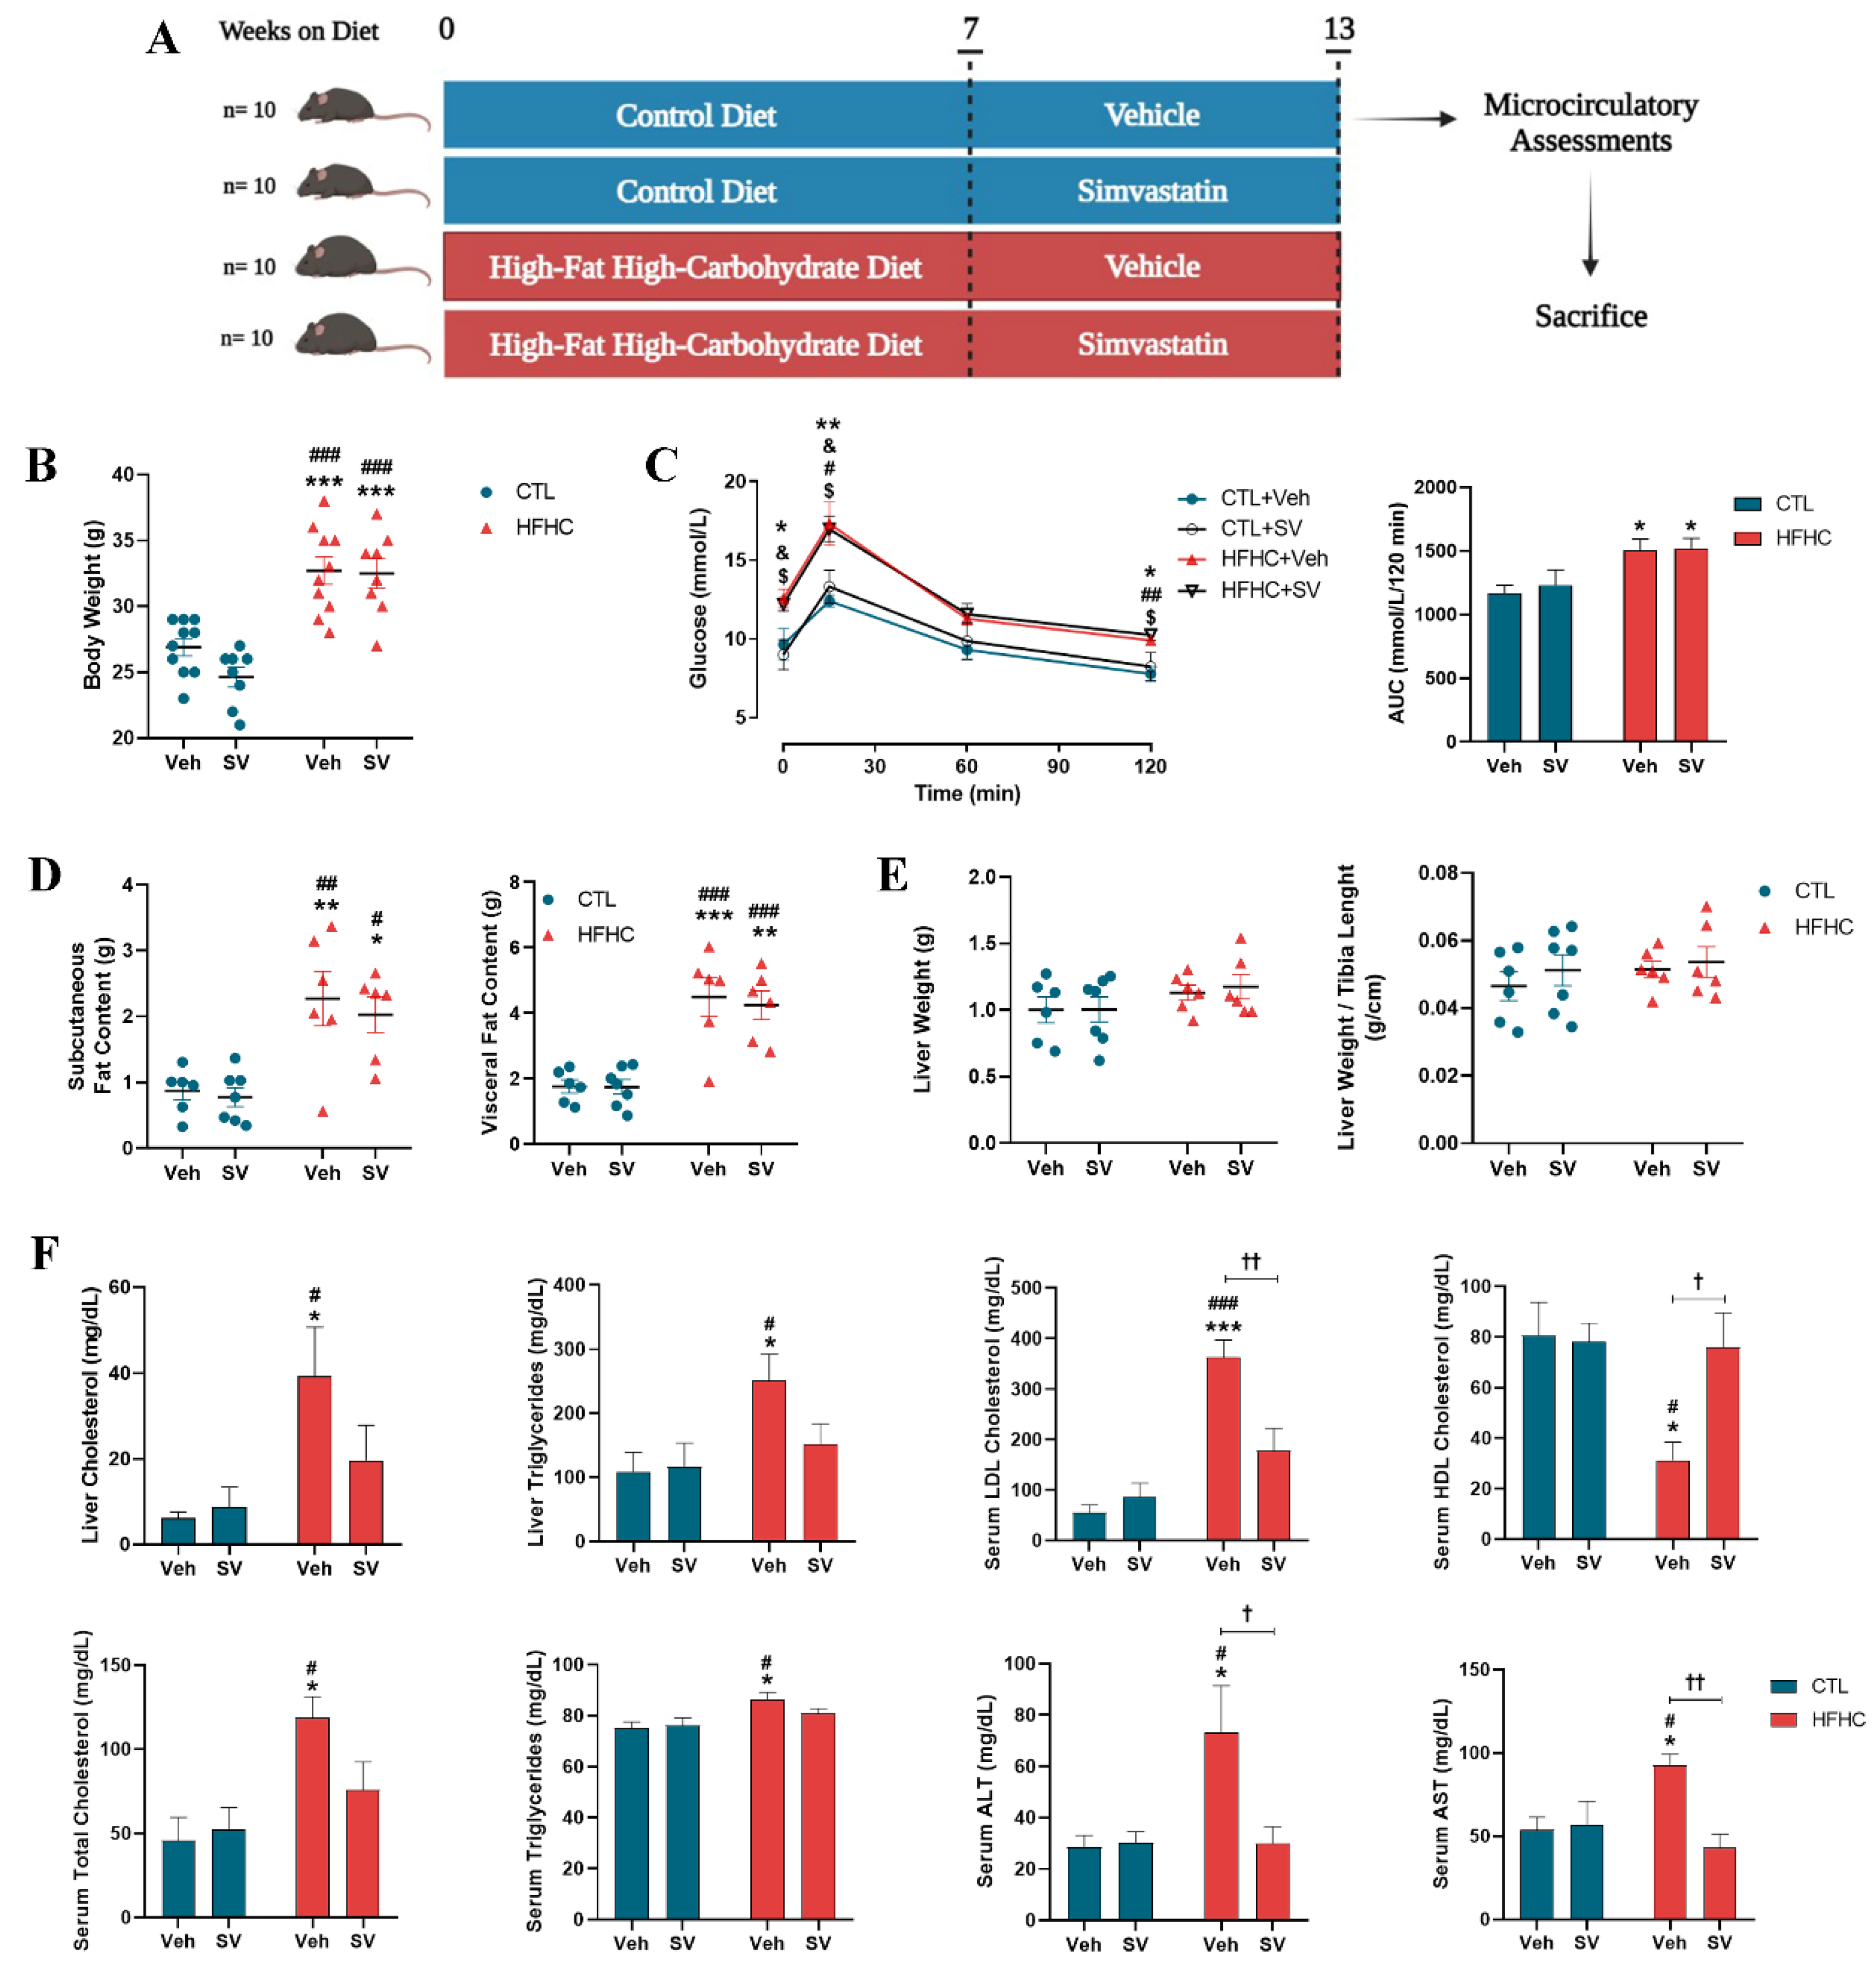
Abstract
:1. Introduction
2. Materials and Methods
2.1. Animals and Experimental Protocol
2.2. Biochemical Parameters
2.3. Oral Glucose Tolerance Test (OGTT)
2.4. Measurement of Hepatic Nitrite (NO2-) Concentration
2.5. Histopathology
2.6. Immunohistochemistry
2.7. RT-PCR
2.8. Thiobarbituric Acid Reactive Species (TBARs)
2.9. Antioxidant Enzyme Activity
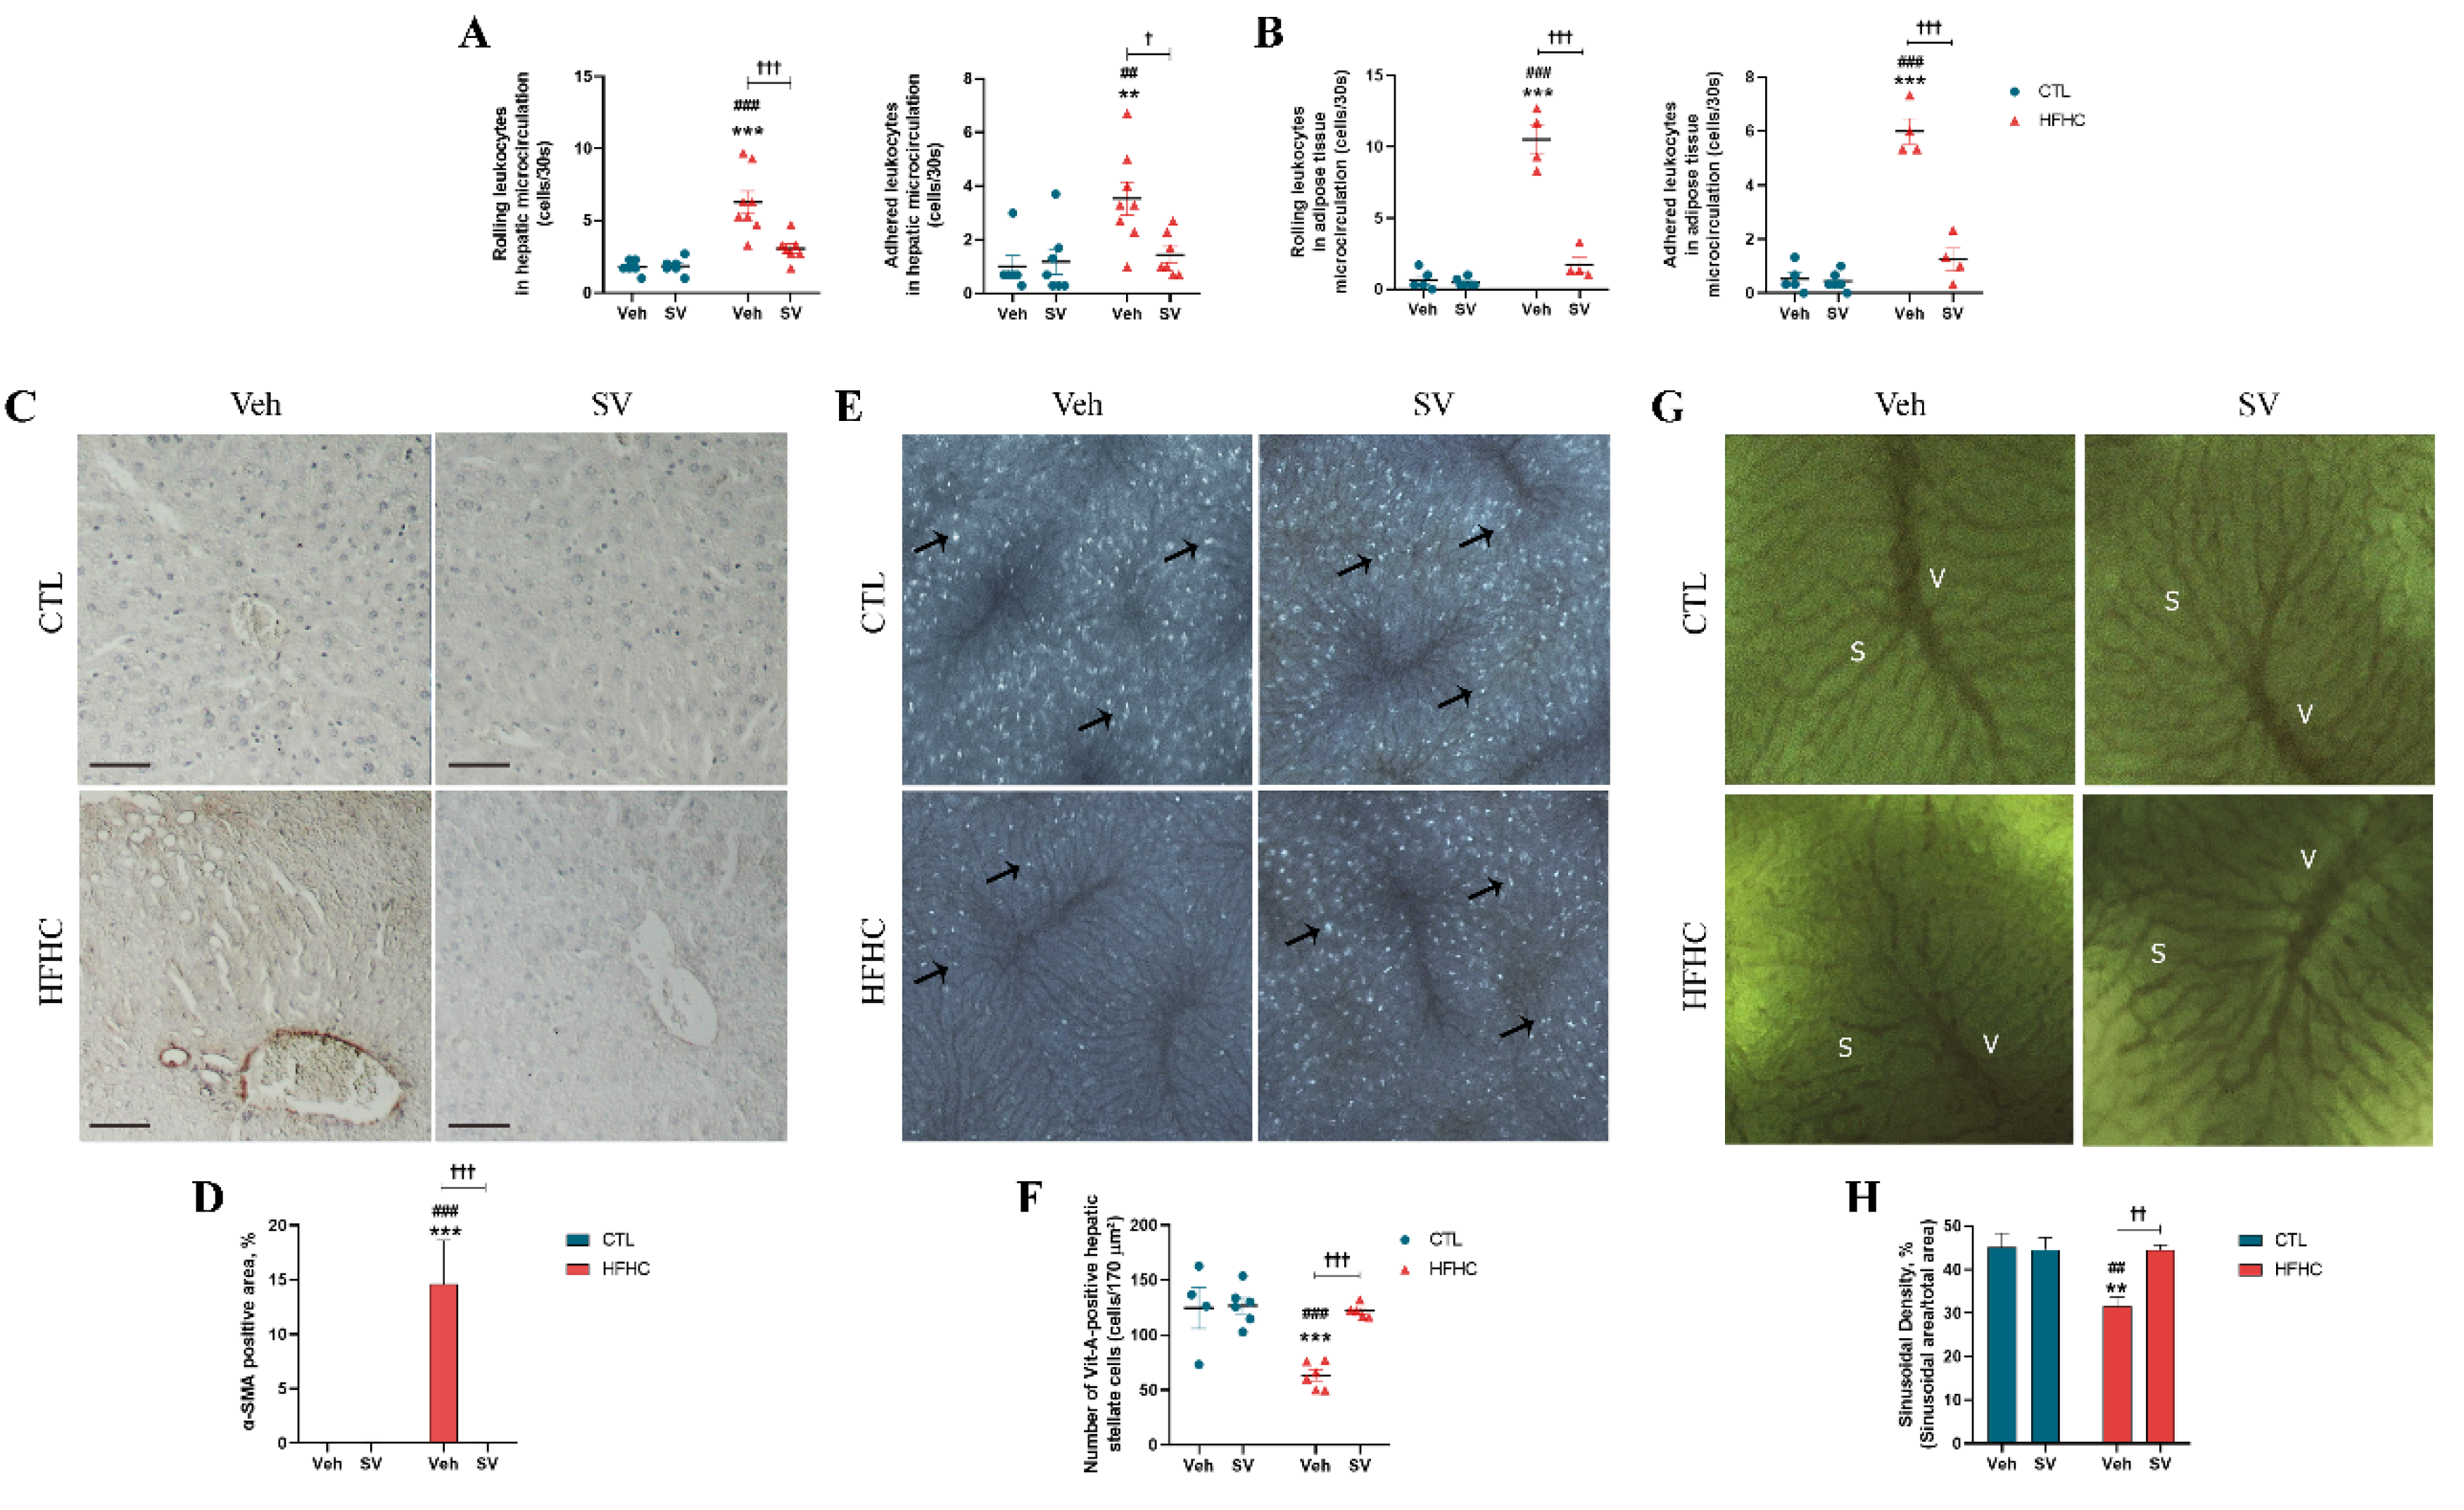
2.10. Intravital Microscopy
2.11. Laser Speckle Flowmetry
2.12. Quantification of Advanced Lipoxidation End Products (ALEs)
2.13. Western Blot
2.14. Statistical Analysis
3. Results
3.1. SV Protects against NAFLD-Induced Metabolic Changes
3.2. SV Prevents Microcirculatory Dysfunction in HFHC-Fed Mice
3.3. SV Protects against NAFLD-Induced Oxidative Damage and Inflammation
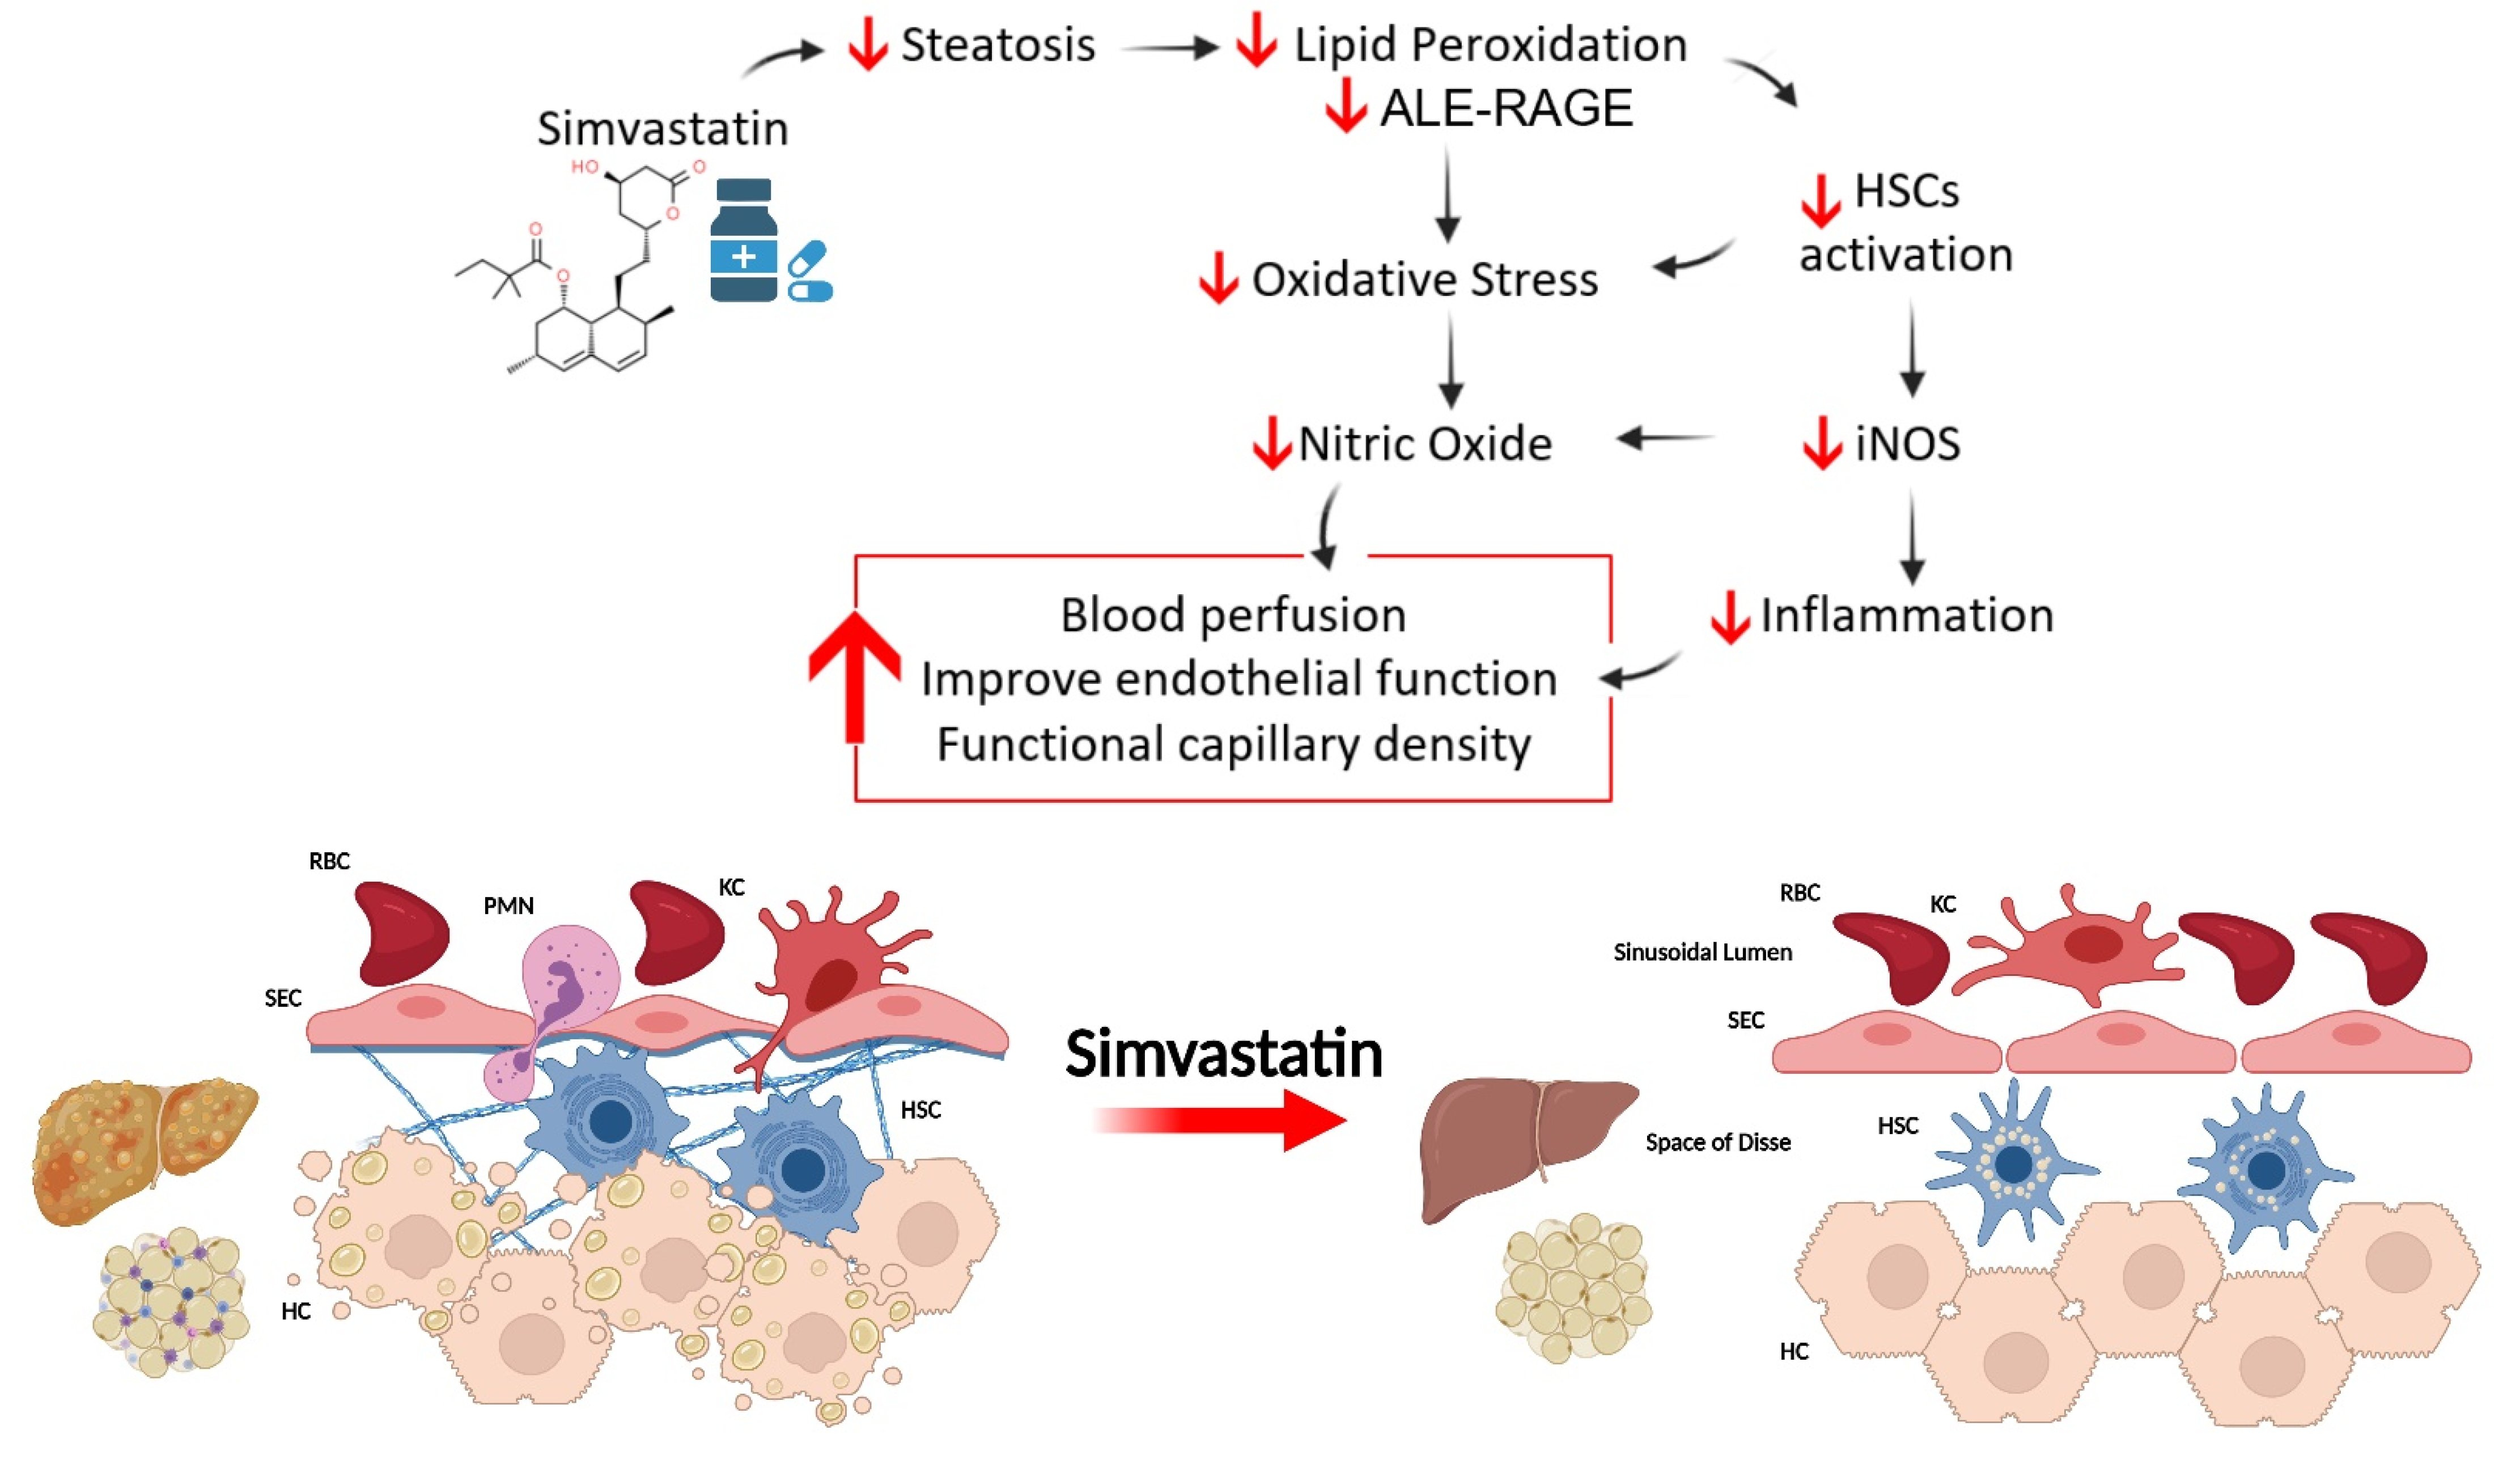
4. Discussion
5. Conclusions
Author Contributions
Funding
Institutional Review Board Statement
Informed Consent Statement
Data Availability Statement
Acknowledgments
Conflicts of Interest
References
- Kotronen, A.; Westerbacka, J.; Bergholm, R.; Pietilainen, K.H.; Yki-Jarvinen, H. Liver fat in the metabolic syndrome. J. Clin. Endocrinol. Metab. 2007, 92, 3490–3497. [Google Scholar] [CrossRef]
- Kotronen, A.; Yki-Jarvinen, H. Fatty liver: A novel component of the metabolic syndrome. Arterioscler. Thromb. Vasc. Biol. 2008, 28, 27–38. [Google Scholar] [CrossRef]
- Marchesini, G.; Bugianesi, E.; Forlani, G.; Cerrelli, F.; Lenzi, M.; Manini, R.; Natale, S.; Vanni, E.; Villanova, N.; Melchionda, N.; et al. Nonalcoholic fatty liver, steatohepatitis, and the metabolic syndrome. Hepatology 2003, 37, 917–923. [Google Scholar] [CrossRef]
- Athyros, V.G.; Tziomalos, K.; Katsiki, N.; Doumas, M.; Karagiannis, A.; Mikhailidis, D.P. Cardiovascular risk across the histological spectrum and the clinical manifestations of non-alcoholic fatty liver disease: An update. World J. Gastroenterol. 2015, 21, 6820–6834. [Google Scholar] [CrossRef]
- Byrne, C.D.; Targher, G. EASL-EASD-EASO Clinical Practice Guidelines for the management of non-alcoholic fatty liver disease. Diabetologia 2016, 59, 1121–1140. [Google Scholar] [CrossRef] [PubMed] [Green Version]
- Farrell, G.C.; Teoh, N.C.; McCuskey, R.S. Hepatic microcirculation in fatty liver disease. Anat. Rec. 2008, 291, 684–692. [Google Scholar] [CrossRef]
- Everhart, J.E.; Bambha, K.M. Fatty liver: Think globally. Hepatology 2010, 51, 1491–1493. [Google Scholar] [CrossRef]
- Bugianesi, E.; Leone, N.; Vanni, E.; Marchesini, G.; Brunello, F.; Carucci, P.; Musso, A.; De Paolis, P.; Capussotti, L.; Salizzoni, M.; et al. Expanding the natural history of nonalcoholic steatohepatitis: From cryptogenic cirrhosis to hepatocellular carcinoma. Gastroenterology 2002, 123, 134–140. [Google Scholar] [CrossRef] [PubMed]
- McCullough, A.J. The clinical features, diagnosis and natural history of nonalcoholic fatty liver disease. Clin. Liver Dis. 2004, 8, 521–533. [Google Scholar] [CrossRef]
- Eslam, M.; Sanyal, A.J.; George, J.; Sanyal, A.; Neuschwander-Tetri, B.; Tiribelli, C.; Kleiner, D.E.; Brunt, E.; Bugianesi, E.; Yki-Järvinen, H.; et al. MAFLD: A Consensus-Driven Proposed Nomenclature for Metabolic Associated Fatty Liver Disease. Gastroenterology 2020, 158, 1999–2014.e1. [Google Scholar] [CrossRef] [PubMed]
- Eslam, M.; Newsome, P.N.; Sarin, S.K.; Anstee, Q.M.; Targher, G.; Romero-Gomez, M.; Zelber-Sagi, S.; Wai-Sun Wong, V.; Dufour, J.F.; Schattenberg, J.M.; et al. A new definition for metabolic dysfunction-associated fatty liver disease: An international expert consensus statement. J. Hepatol. 2020, 73, 202–209. [Google Scholar] [CrossRef]
- Ahmed, A.; Wong, R.J.; Harrison, S.A. Nonalcoholic Fatty Liver Disease Review: Diagnosis, Treatment, and Outcomes. Clin. Gastroenterol. Hepatol. 2015, 13, 2062–2070. [Google Scholar] [CrossRef] [PubMed] [Green Version]
- Wong, R.J.; Aguilar, M.; Cheung, R.; Perumpail, R.B.; Harrison, S.A.; Younossi, Z.M.; Ahmed, A. Nonalcoholic steatohepatitis is the second leading etiology of liver disease among adults awaiting liver transplantation in the United States. Gastroenterology 2015, 148, 547–555. [Google Scholar] [CrossRef]
- McClain, C.J.; Song, Z.; Barve, S.S.; Hill, D.B.; Deaciuc, I. Recent advances in alcoholic liver disease. IV. Dysregulated cytokine metabolism in alcoholic liver disease. Am. J. Physiol. Gastrointest. Liver Physiol. 2004, 287, G497–G502. [Google Scholar] [CrossRef] [PubMed]
- Wanless, I.R.; Shiota, K. The pathogenesis of nonalcoholic steatohepatitis and other fatty liver diseases: A four-step model including the role of lipid release and hepatic venular obstruction in the progression to cirrhosis. Semin. Liver Dis. 2004, 24, 99–106. [Google Scholar] [CrossRef] [PubMed]
- Gracia-Sancho, J.; Garcia-Caldero, H.; Hide, D.; Marrone, G.; Guixe-Muntet, S.; Peralta, C.; Garcia-Pagan, J.C.; Abraldes, J.G.; Bosch, J. Simvastatin maintains function and viability of steatotic rat livers procured for transplantation. J. Hepatol. 2013, 58, 1140–1146. [Google Scholar] [CrossRef]
- Pereira, E.; Silvares, R.R.; Flores, E.E.I.; Rodrigues, K.L.; Ramos, I.P.; da Silva, I.J.; Machado, M.P.; Miranda, R.A.; Pazos-Moura, C.C.; Goncalves-de-Albuquerque, C.F.; et al. Hepatic microvascular dysfunction and increased advanced glycation end products are components of non-alcoholic fatty liver disease. PLoS ONE 2017, 12, e0179654. [Google Scholar] [CrossRef] [Green Version]
- Ijaz, S.; Yang, W.; Winslet, M.C.; Seifalian, A.M. Impairment of hepatic microcirculation in fatty liver. Microcirculation 2003, 10, 447–456. [Google Scholar] [CrossRef]
- McCuskey, R.S.; Ito, Y.; Robertson, G.R.; McCuskey, M.K.; Perry, M.; Farrell, G.C. Hepatic microvascular dysfunction during evolution of dietary steatohepatitis in mice. Hepatology 2004, 40, 386–393. [Google Scholar] [CrossRef]
- Pereira, E.; Silvares, R.R.; Rodrigues, K.L.; Flores, E.E.I.; Daliry, A. Pyridoxamine and Caloric Restriction Improve Metabolic and Microcirculatory Abnormalities in Rats with Non-Alcoholic Fatty Liver Disease. J. Vasc. Res. 2021, 58, 121–130. [Google Scholar] [CrossRef]
- Rosenstengel, S.; Stoeppeler, S.; Bahde, R.; Spiegel, H.U.; Palmes, D. Type of steatosis influences microcirculation and fibrogenesis in different rat strains. J. Investig. Surg. 2011, 24, 273–282. [Google Scholar] [CrossRef]
- Schleicher, J.; Guthke, R.; Dahmen, U.; Dirsch, O.; Holzhuetter, H.G.; Schuster, S. A theoretical study of lipid accumulation in the liver-implications for nonalcoholic fatty liver disease. Biochim. Biophys. Acta 2014, 1841, 62–69. [Google Scholar] [CrossRef]
- Schierwagen, R.; Uschner, F.E.; Magdaleno, F.; Klein, S.; Trebicka, J. Rationale for the use of statins in liver disease. Am. J. Physiol. Gastrointest. Liver Physiol. 2017, 312, G407–G412. [Google Scholar] [CrossRef] [Green Version]
- Blais, P.; Lin, M.; Kramer, J.R.; El-Serag, H.B.; Kanwal, F. Statins Are Underutilized in Patients with Nonalcoholic Fatty Liver Disease and Dyslipidemia. Dig. Dis. Sci. 2016, 61, 1714–1720. [Google Scholar] [CrossRef] [PubMed]
- Ajamieh, H.; Farrell, G.C.; McCuskey, R.S.; Yu, J.; Chu, E.; Wong, H.J.; Lam, W.; Teoh, N.C. Acute atorvastatin is hepatoprotective against ischaemia-reperfusion injury in mice by modulating eNOS and microparticle formation. Liver Int. 2015, 35, 2174–2186. [Google Scholar] [CrossRef] [PubMed]
- Atar, S.; Ye, Y.; Lin, Y.; Freeberg, S.Y.; Nishi, S.P.; Rosanio, S.; Huang, M.H.; Uretsky, B.F.; Perez-Polo, J.R.; Birnbaum, Y. Atorvastatin-induced cardioprotection is mediated by increasing inducible nitric oxide synthase and consequent S-nitrosylation of cyclooxygenase-2. Am. J. Physiol. Heart Circ. Physiol. 2006, 290, H1960–H1968. [Google Scholar] [CrossRef]
- Gaur, V.; Kumar, A. Neuroprotective potentials of candesartan, atorvastatin and their combination against stroke induced motor dysfunction. Inflammopharmacology 2011, 19, 205–214. [Google Scholar] [CrossRef]
- Reis, P.A.; Estato, V.; da Silva, T.I.; d'Avila, J.C.; Siqueira, L.D.; Assis, E.F.; Bozza, P.T.; Bozza, F.A.; Tibirica, E.V.; Zimmerman, G.A.; et al. Statins decrease neuroinflammation and prevent cognitive impairment after cerebral malaria. PLoS Pathog. 2012, 8, e1003099. [Google Scholar] [CrossRef] [PubMed]
- Reis, P.A.; Alexandre, P.C.B.; D'Avila, J.C.; Siqueira, L.D.; Antunes, B.; Estato, V.; Tibirica, E.V.; Verdonk, F.; Sharshar, T.; Chretien, F.; et al. Statins prevent cognitive impairment after sepsis by reverting neuroinflammation, and microcirculatory/endothelial dysfunction. Brain Behav. Immun. 2017, 60, 293–303. [Google Scholar] [CrossRef] [PubMed]
- Omori, H.; Nagashima, H.; Tsurumi, Y.; Takagi, A.; Ishizuka, N.; Hagiwara, N.; Kawana, M.; Kasanuki, H. Direct in vivo evidence of a vascular statin: A single dose of cerivastatin rapidly increases vascular endothelial responsiveness in healthy normocholesterolaemic subjects. Br. J. Clin. Pharmacol. 2002, 54, 395–399. [Google Scholar] [CrossRef] [Green Version]
- Schierwagen, R.; Maybuchen, L.; Hittatiya, K.; Klein, S.; Uschner, F.E.; Braga, T.T.; Franklin, B.S.; Nickenig, G.; Strassburg, C.P.; Plat, J.; et al. Statins improve NASH via inhibition of RhoA and Ras. Am. J. Physiol. Gastrointest. Liver Physiol. 2016, 311, G724–G733. [Google Scholar] [CrossRef]
- Liang, H.; Feng, Y.; Cui, R.; Qiu, M.; Zhang, J.; Liu, C. Simvastatin protects against acetaminophen-induced liver injury in mice. Biomed. Pharmacother. 2018, 98, 916–924. [Google Scholar] [CrossRef] [PubMed]
- Lu, Y.; Du, Y.; Qin, L.; Wu, D.; Wang, W.; Ling, L.; Ma, F.; Ling, H.; Yang, L.; Wang, C.; et al. Gypenosides Altered Hepatic Bile Acids Homeostasis in Mice Treated with High Fat Diet. Evid.-Based Complement. Altern. Med. 2018, 2018, 8098059. [Google Scholar] [CrossRef] [PubMed]
- Dimmeler, S.; Aicher, A.; Vasa, M.; Mildner-Rihm, C.; Adler, K.; Tiemann, M.; Rutten, H.; Fichtlscherer, S.; Martin, H.; Zeiher, A.M. HMG-CoA reductase inhibitors (statins) increase endothelial progenitor cells via the PI 3-kinase/Akt pathway. J. Clin. Investig. 2001, 108, 391–397. [Google Scholar] [CrossRef] [PubMed]
- Sumi, D.; Ignarro, L.J. Regulation of inducible nitric oxide synthase expression in advanced glycation end product-stimulated raw 264.7 cells: The role of heme oxygenase-1 and endogenous nitric oxide. Diabetes 2004, 53, 1841–1850. [Google Scholar] [CrossRef] [Green Version]
- Tschanz, S.A.; Burri, P.H.; Weibel, E.R. A simple tool for stereological assessment of digital images: The STEPanizer. J. Microsc. 2011, 243, 47–59. [Google Scholar] [CrossRef]
- Elias, H.; Hennig, A.; Schwartz, D.E. Stereology: Applications to biomedicalresearch. Physiol. Rev. 1971, 51, 158–200. [Google Scholar] [CrossRef]
- Kleiner, D.E.; Brunt, E.M.; Van Natta, M.; Behling, C.; Contos, M.J.; Cummings, O.W.; Ferrell, L.D.; Liu, Y.C.; Torbenson, M.S.; Unalp-Arida, A.; et al. Design and validation of a histological scoring system for nonalcoholic fatty liver disease. Hepatology 2005, 41, 1313–1321. [Google Scholar] [CrossRef]
- Schneider, C.A.; Rasband, W.S.; Eliceiri, K.W. NIH Image to ImageJ: 25 years of image analysis. Nat. Methods 2012, 9, 671–675. [Google Scholar] [CrossRef]
- Draper, H.H.; Hadley, M. Malondialdehyde determination as index of lipid peroxidation. Methods Enzymol. 1990, 186, 421–431. [Google Scholar] [CrossRef]
- Sun, Y.; Oberley, L.W.; Li, Y. A simple method for clinical assay of superoxide dismutase. Clin. Chem. 1988, 34, 497–500. [Google Scholar] [CrossRef]
- Pereira, E.; Silvares, R.R.; Flores, E.E.I.; Rodrigues, K.L.; Daliry, A. Pyridoxamine improves metabolic and microcirculatory complications associated with nonalcoholic fatty liver disease. Microcirculation 2020, 27, e12603. [Google Scholar] [CrossRef] [PubMed]
- Nakayama, H.; Mitsuhashi, T.; Kuwajima, S.; Aoki, S.; Kuroda, Y.; Itoh, T.; Nakagawa, S. Immunochemical detection of advanced glycation end products in lens crystallins from streptozocin-induced diabetic rat. Diabetes 1993, 42, 345–350. [Google Scholar] [CrossRef]
- Rodrigues, G.; Moreira, A.J.; Bona, S.; Schemitt, E.; Marroni, C.A.; Di Naso, F.C.; Dias, A.S.; Pires, T.R.; Picada, J.N.; Marroni, N.P. Simvastatin Reduces Hepatic Oxidative Stress and Endoplasmic Reticulum Stress in Nonalcoholic Steatohepatitis Experimental Model. Oxid. Med. Cell. Longev. 2019, 2019, 3201873. [Google Scholar] [CrossRef] [PubMed] [Green Version]
- Wang, W.; Zhao, C.; Zhou, J.; Zhen, Z.; Wang, Y.; Shen, C. Simvastatin ameliorates liver fibrosis via mediating nitric oxide synthase in rats with non-alcoholic steatohepatitis-related liver fibrosis. PLoS ONE 2013, 8, e76538. [Google Scholar] [CrossRef] [PubMed] [Green Version]
- Athyros, V.G.; Tziomalos, K.; Gossios, T.D.; Griva, T.; Anagnostis, P.; Kargiotis, K.; Pagourelias, E.D.; Theocharidou, E.; Karagiannis, A.; Mikhailidis, D.P.; et al. Safety and efficacy of long-term statin treatment for cardiovascular events in patients with coronary heart disease and abnormal liver tests in the Greek Atorvastatin and Coronary Heart Disease Evaluation (GREACE) Study: A post-hoc analysis. Lancet 2010, 376, 1916–1922. [Google Scholar] [CrossRef]
- Review, T.; LaBrecque, D.R.; Abbas, Z.; Anania, F.; Ferenci, P.; Khan, A.G.; Goh, K.L.; Hamid, S.S.; Isakov, V.; Lizarzabal, M.; et al. World Gastroenterology Organisation global guidelines: Nonalcoholic fatty liver disease and nonalcoholic steatohepatitis. J. Clin. Gastroenterol. 2014, 48, 467–473. [Google Scholar] [CrossRef]
- Chalasani, N.; Younossi, Z.; Lavine, J.E.; Diehl, A.M.; Brunt, E.M.; Cusi, K.; Charlton, M.; Sanyal, A.J. The diagnosis and management of non-alcoholic fatty liver disease: Practice Guideline by the American Association for the Study of Liver Diseases, American College of Gastroenterology, and the American Gastroenterological Association. Hepatology 2012, 55, 2005–2023. [Google Scholar] [CrossRef]
- Bays, H.; Cohen, D.E.; Chalasani, N.; Harrison, S.A. An assessment by the Statin Liver Safety Task Force: 2014 update. J. Clin. Lipidol. 2014, 8, S47–S57. [Google Scholar] [CrossRef] [Green Version]
- Del Ben, M.; Polimeni, L.; Baratta, F.; Pastori, D.; Loffredo, L.; Angelico, F. Modern approach to the clinical management of non-alcoholic fatty liver disease. World J. Gastroenterol. 2014, 20, 8341–8350. [Google Scholar] [CrossRef]
- Ekstedt, M.; Franzen, L.E.; Mathiesen, U.L.; Holmqvist, M.; Bodemar, G.; Kechagias, S. Statins in non-alcoholic fatty liver disease and chronically elevated liver enzymes: A histopathological follow-up study. J. Hepatol. 2007, 47, 135–141. [Google Scholar] [CrossRef] [PubMed]
- Tilg, H.; Moschen, A.R. Evolution of inflammation in nonalcoholic fatty liver disease: The multiple parallel hits hypothesis. Hepatology 2010, 52, 1836–1846. [Google Scholar] [CrossRef] [PubMed]
- Akbal, E.; Kocak, E.; Akyurek, O.; Koklu, S.; Batgi, H.; Senes, M. Liver fatty acid-binding protein as a diagnostic marker for non-alcoholic fatty liver disease. Wien. Klin. Wochenschr. 2016, 128, 48–52. [Google Scholar] [CrossRef] [PubMed]
- Newberry, E.P.; Xie, Y.; Kennedy, S.M.; Luo, J.; Davidson, N.O. Protection against Western diet-induced obesity and hepatic steatosis in liver fatty acid-binding protein knockout mice. Hepatology 2006, 44, 1191–1205. [Google Scholar] [CrossRef]
- Newberry, E.P.; Kennedy, S.M.; Xie, Y.; Luo, J.; Davidson, N.O. Diet-induced alterations in intestinal and extrahepatic lipid metabolism in liver fatty acid binding protein knockout mice. Mol. Cell. Biochem. 2009, 326, 79–86. [Google Scholar] [CrossRef] [Green Version]
- Chen, A.; Tang, Y.; Davis, V.; Hsu, F.F.; Kennedy, S.M.; Song, H.; Turk, J.; Brunt, E.M.; Newberry, E.P.; Davidson, N.O. Liver fatty acid binding protein (L-Fabp) modulates murine stellate cell activation and diet-induced nonalcoholic fatty liver disease. Hepatology 2013, 57, 2202–2212. [Google Scholar] [CrossRef] [Green Version]
- Landrier, J.F.; Thomas, C.; Grober, J.; Duez, H.; Percevault, F.; Souidi, M.; Linard, C.; Staels, B.; Besnard, P. Statin induction of liver fatty acid-binding protein (L-FABP) gene expression is peroxisome proliferator-activated receptor-alpha-dependent. J. Biol. Chem. 2004, 279, 45512–45518. [Google Scholar] [CrossRef] [PubMed] [Green Version]
- Song, S.; Niu, M.; Liang, Q.; Wang, L.; Min, H.; Peng, Y.; Wang, H.; Gao, Q. Statin Treatment Induced a Lipogenic Expression Hierarchical Network Centered by SREBF2 in the Liver. Front. Endocrinol. 2021, 12, 573824. [Google Scholar] [CrossRef]
- Pasarin, M.; La Mura, V.; Gracia-Sancho, J.; Garcia-Caldero, H.; Rodriguez-Vilarrupla, A.; Garcia-Pagan, J.C.; Bosch, J.; Abraldes, J.G. Sinusoidal endothelial dysfunction precedes inflammation and fibrosis in a model of NAFLD. PLoS ONE 2012, 7, e32785. [Google Scholar] [CrossRef] [Green Version]
- Anavi, S.; Madar, Z.; Tirosh, O. Non-alcoholic fatty liver disease, to struggle with the strangle: Oxygen availability in fatty livers. Redox Biol. 2017, 13, 386–392. [Google Scholar] [CrossRef]
- Chidlow, J.H., Jr.; Sessa, W.C. Caveolae, caveolins, and cavins: Complex control of cellular signalling and inflammation. Cardiovasc. Res. 2010, 86, 219–225. [Google Scholar] [CrossRef] [Green Version]
- Reynaert, H.; Thompson, M.G.; Thomas, T.; Geerts, A. Hepatic stellate cells: Role in microcirculation and pathophysiology of portal hypertension. Gut 2002, 50, 571–581. [Google Scholar] [CrossRef] [PubMed]
- Marrone, G.; Maeso-Diaz, R.; Garcia-Cardena, G.; Abraldes, J.G.; Garcia-Pagan, J.C.; Bosch, J.; Gracia-Sancho, J. KLF2 exerts antifibrotic and vasoprotective effects in cirrhotic rat livers: Behind the molecular mechanisms of statins. Gut 2015, 64, 1434–1443. [Google Scholar] [CrossRef]
- Bravo, M.; Raurell, I.; Hide, D.; Fernandez-Iglesias, A.; Gil, M.; Barbera, A.; Salcedo, M.T.; Augustin, S.; Genesca, J.; Martell, M. Restoration of liver sinusoidal cell phenotypes by statins improves portal hypertension and histology in rats with NASH. Sci. Rep. 2019, 9, 20183. [Google Scholar] [CrossRef]
- Dold, S.; Laschke, M.W.; Lavasani, S.; Menger, M.D.; Jeppsson, B.; Thorlacius, H. Simvastatin protects against cholestasis-induced liver injury. Br. J. Pharmacol. 2009, 156, 466–474. [Google Scholar] [CrossRef] [Green Version]
- Abraldes, J.G.; Rodriguez-Vilarrupla, A.; Graupera, M.; Zafra, C.; Garcia-Caldero, H.; Garcia-Pagan, J.C.; Bosch, J. Simvastatin treatment improves liver sinusoidal endothelial dysfunction in CCl4 cirrhotic rats. J. Hepatol. 2007, 46, 1040–1046. [Google Scholar] [CrossRef]
- Gracia-Sancho, J.; Russo, L.; Garcia-Caldero, H.; Garcia-Pagan, J.C.; Garcia-Cardena, G.; Bosch, J. Endothelial expression of transcription factor Kruppel-like factor 2 and its vasoprotective target genes in the normal and cirrhotic rat liver. Gut 2011, 60, 517–524. [Google Scholar] [CrossRef]
- Russo, L.; Gracia-Sancho, J.; Garcia-Cald.d.dero, H.; Marrone, G.; Garcia-Pagan, J.C.; Garcia-Cardena, G.; Bosch, J. Addition of simvastatin to cold storage solution prevents endothelial dysfunction in explanted rat livers. Hepatology 2012, 55, 921–930. [Google Scholar] [CrossRef]
- Weisberg, S.P.; McCann, D.; Desai, M.; Rosenbaum, M.; Leibel, R.L.; Ferrante, A.W., Jr. Obesity is associated with macrophage accumulation in adipose tissue. J. Clin. Investig. 2003, 112, 1796–1808. [Google Scholar] [CrossRef]
- Xu, H.; Barnes, G.T.; Yang, Q.; Tan, G.; Yang, D.; Chou, C.J.; Sole, J.; Nichols, A.; Ross, J.S.; Tartaglia, L.A.; et al. Chronic inflammation in fat plays a crucial role in the development of obesity-related insulin resistance. J. Clin. Investig. 2003, 112, 1821–1830. [Google Scholar] [CrossRef]
- Halberg, N.; Khan, T.; Trujillo, M.E.; Wernstedt-Asterholm, I.; Attie, A.D.; Sherwani, S.; Wang, Z.V.; Landskroner-Eiger, S.; Dineen, S.; Magalang, U.J.; et al. Hypoxia-inducible factor 1alpha induces fibrosis and insulin resistance in white adipose tissue. Mol. Cell. Biol. 2009, 29, 4467–4483. [Google Scholar] [CrossRef] [Green Version]
- Yin, J.; Gao, Z.; He, Q.; Zhou, D.; Guo, Z.; Ye, J. Role of hypoxia in obesity-induced disorders of glucose and lipid metabolism in adipose tissue. Am. J. Physiol. Endocrinol. Metab. 2009, 296, E333–E342. [Google Scholar] [CrossRef] [Green Version]
- McArdle, M.A.; Finucane, O.M.; Connaughton, R.M.; McMorrow, A.M.; Roche, H.M. Mechanisms of obesity-induced inflammation and insulin resistance: Insights into the emerging role of nutritional strategies. Front. Endocrinol. 2013, 4, 52. [Google Scholar] [CrossRef] [Green Version]
- de Heredia, F.P.; Gomez-Martinez, S.; Marcos, A. Obesity, inflammation and the immune system. Proc. Nutr. Soc. 2012, 71, 332–338. [Google Scholar] [CrossRef] [Green Version]
- Parker, R.; Kim, S.J.; Gao, B. Alcohol, adipose tissue and liver disease: Mechanistic links and clinical considerations. Nat. Rev. Gastroenterol. Hepatol. 2018, 15, 50–59. [Google Scholar] [CrossRef] [PubMed]
- Tchernof, A.; Despres, J.P. Pathophysiology of human visceral obesity: An update. Physiol. Rev. 2013, 93, 359–404. [Google Scholar] [CrossRef] [PubMed]
- van der Poorten, D.; Milner, K.L.; Hui, J.; Hodge, A.; Trenell, M.I.; Kench, J.G.; London, R.; Peduto, T.; Chisholm, D.J.; George, J. Visceral fat: A key mediator of steatohepatitis in metabolic liver disease. Hepatology 2008, 48, 449–457. [Google Scholar] [CrossRef]
- Ye, D.W.; Rong, X.L.; Xu, A.M.; Guo, J. Liver-adipose tissue crosstalk: A key player in the pathogenesis of glucolipid metabolic disease. Chin. J. Integr. Med. 2017, 23, 410–414. [Google Scholar] [CrossRef]
- Borrelli, A.; Bonelli, P.; Tuccillo, F.M.; Goldfine, I.D.; Evans, J.L.; Buonaguro, F.M.; Mancini, A. Role of gut microbiota and oxidative stress in the progression of non-alcoholic fatty liver disease to hepatocarcinoma: Current and innovative therapeutic approaches. Redox. Biol. 2018, 15, 467–479. [Google Scholar] [CrossRef]
- Koruk, M.; Taysi, S.; Savas, M.C.; Yilmaz, O.; Akcay, F.; Karakok, M. Oxidative stress and enzymatic antioxidant status in patients with nonalcoholic steatohepatitis. Ann. Clin. Lab. Sci. 2004, 34, 57–62. [Google Scholar]
- Sumida, Y.; Niki, E.; Naito, Y.; Yoshikawa, T. Involvement of free radicals and oxidative stress in NAFLD/NASH. Free Radic. Res. 2013, 47, 869–880. [Google Scholar] [CrossRef]
- Koroglu, E.; Canbakan, B.; Atay, K.; Hatemi, I.; Tuncer, M.; Dobrucali, A.; Sonsuz, A.; Gultepe, I.; Senturk, H. Role of oxidative stress and insulin resistance in disease severity of non-alcoholic fatty liver disease. Turk. J. Gastroenterol. 2016, 27, 361–366. [Google Scholar] [CrossRef] [PubMed]
- Stojsavljevic, S.; Gomercic Palcic, M.; Virovic Jukic, L.; Smircic Duvnjak, L.; Duvnjak, M. Adipokines and proinflammatory cytokines, the key mediators in the pathogenesis of nonalcoholic fatty liver disease. World J. Gastroenterol. 2014, 20, 18070–18091. [Google Scholar] [CrossRef] [PubMed] [Green Version]
- Koumenis, C.; Naczki, C.; Koritzinsky, M.; Rastani, S.; Diehl, A.; Sonenberg, N.; Koromilas, A.; Wouters, B.G. Regulation of protein synthesis by hypoxia via activation of the endoplasmic reticulum kinase PERK and phosphorylation of the translation initiation factor eIF2alpha. Mol. Cell. Biol. 2002, 22, 7405–7416. [Google Scholar] [CrossRef] [Green Version]
- Silvares, R.R.; Pereira, E.N.; Flores, E.E.; Estato, V.; Reis, P.A.; Silva, I.J.; Machado, M.P.; Neto, H.C.; Tibirica, E.; Daliry, A. Combined therapy with metformin and insulin attenuates systemic and hepatic alterations in a model of high-fat diet-/streptozotocin-induced diabetes. Int. J. Exp. Pathol. 2016, 97, 266–277. [Google Scholar] [CrossRef] [PubMed]
- Delbosc, S.; Morena, M.; Djouad, F.; Ledoucen, C.; Descomps, B.; Cristol, J.P. Statins, 3-hydroxy-3-methylglutaryl coenzyme A reductase inhibitors, are able to reduce superoxide anion production by NADPH oxidase in THP-1-derived monocytes. J. Cardiovasc. Pharmacol. 2002, 40, 611–617. [Google Scholar] [CrossRef]
- Wassmann, S.; Laufs, U.; Baumer, A.T.; Muller, K.; Ahlbory, K.; Linz, W.; Itter, G.; Rosen, R.; Bohm, M.; Nickenig, G. HMG-CoA reductase inhibitors improve endothelial dysfunction in normocholesterolemic hypertension via reduced production of reactive oxygen species. Hypertension 2001, 37, 1450–1457. [Google Scholar] [CrossRef]
- Negre-Aminou, P.; van Leeuwen, R.E.; van Thiel, G.C.; van den, I.P.; de Jong, W.W.; Quinlan, R.A.; Cohen, L.H. Differential effect of simvastatin on activation of Rac(1) vs. activation of the heat shock protein 27-mediated pathway upon oxidative stress, in human smooth muscle cells. Biochem. Pharmacol. 2002, 64, 1483–1491. [Google Scholar] [CrossRef]
- Greenwood, J.; Steinman, L.; Zamvil, S.S. Statin therapy and autoimmune disease: From protein prenylation to immunomodulation. Nat. Rev. Immunol. 2006, 6, 358–370. [Google Scholar] [CrossRef] [Green Version]
- Habeos, I.G.; Ziros, P.G.; Chartoumpekis, D.; Psyrogiannis, A.; Kyriazopoulou, V.; Papavassiliou, A.G. Simvastatin activates Keap1/Nrf2 signaling in rat liver. J. Mol. Med. 2008, 86, 1279–1285. [Google Scholar] [CrossRef]
- Moldogazieva, N.T.; Mokhosoev, I.M.; Mel'nikova, T.I.; Porozov, Y.B.; Terentiev, A.A. Oxidative Stress and Advanced Lipoxidation and Glycation End Products (ALEs and AGEs) in Aging and Age-Related Diseases. Oxid. Med. Cell. Longev. 2019, 2019, 3085756. [Google Scholar] [CrossRef] [PubMed] [Green Version]
- Pamplona, R. Advanced lipoxidation end-products. Chem. Biol. Interact. 2011, 192, 14–20. [Google Scholar] [CrossRef]
- Delgado-Andrade, C.; Fogliano, V. Dietary Advanced Glycosylation End-Products (dAGEs) and Melanoidins Formed through the Maillard Reaction: Physiological Consequences of their Intake. Annu. Rev. Food Sci. Technol. 2018, 9, 271–291. [Google Scholar] [CrossRef]
- Mol, M.; Degani, G.; Coppa, C.; Baron, G.; Popolo, L.; Carini, M.; Aldini, G.; Vistoli, G.; Altomare, A. Advanced lipoxidation end products (ALEs) as RAGE binders: Mass spectrometric and computational studies to explain the reasons why. Redox. Biol. 2019, 23, 101083. [Google Scholar] [CrossRef] [PubMed]
- Brett, J.; Schmidt, A.M.; Yan, S.D.; Zou, Y.S.; Weidman, E.; Pinsky, D.; Nowygrod, R.; Neeper, M.; Przysiecki, C.; Shaw, A.; et al. Survey of the distribution of a newly characterized receptor for advanced glycation end products in tissues. Am. J. Pathol. 1993, 143, 1699–1712. [Google Scholar] [PubMed]
- Sebekova, K.; Kupcova, V.; Schinzel, R.; Heidland, A. Markedly elevated levels of plasma advanced glycation end products in patients with liver cirrhosis-amelioration by liver transplantation. J. Hepatol. 2002, 36, 66–71. [Google Scholar] [CrossRef]
- Gaens, K.H.; Niessen, P.M.; Rensen, S.S.; Buurman, W.A.; Greve, J.W.; Driessen, A.; Wolfs, M.G.; Hofker, M.H.; Bloemen, J.G.; Dejong, C.H.; et al. Endogenous formation of Nepsilon-(carboxymethyl)lysine is increased in fatty livers and induces inflammatory markers in an in vitro model of hepatic steatosis. J. Hepatol. 2012, 56, 647–655. [Google Scholar] [CrossRef] [PubMed]
- Basta, G.; Navarra, T.; De Simone, P.; Del Turco, S.; Gastaldelli, A.; Filipponi, F. What is the role of the receptor for advanced glycation end products-ligand axis in liver injury? Liver Transpl. 2011, 17, 633–640. [Google Scholar] [CrossRef]
- Song, F.; Hurtado del Pozo, C.; Rosario, R.; Zou, Y.S.; Ananthakrishnan, R.; Xu, X.; Patel, P.R.; Benoit, V.M.; Yan, S.F.; Li, H.; et al. RAGE regulates the metabolic and inflammatory response to high-fat feeding in mice. Diabetes 2014, 63, 1948–1965. [Google Scholar] [CrossRef] [Green Version]
- Patel, R.; Baker, S.S.; Liu, W.; Desai, S.; Alkhouri, R.; Kozielski, R.; Mastrandrea, L.; Sarfraz, A.; Cai, W.; Vlassara, H.; et al. Effect of dietary advanced glycation end products on mouse liver. PLoS ONE 2012, 7, e35143. [Google Scholar] [CrossRef]
- Leung, C.; Herath, C.B.; Jia, Z.; Goodwin, M.; Mak, K.Y.; Watt, M.J.; Forbes, J.M.; Angus, P.W. Dietary glycotoxins exacerbate progression of experimental fatty liver disease. J. Hepatol. 2014, 60, 832–838. [Google Scholar] [CrossRef]
- Leung, C.; Herath, C.B.; Jia, Z.; Andrikopoulos, S.; Brown, B.E.; Davies, M.J.; Rivera, L.R.; Furness, J.B.; Forbes, J.M.; Angus, P.W. Dietary advanced glycation end-products aggravate non-alcoholic fatty liver disease. World J. Gastroenterol. 2016, 22, 8026–8040. [Google Scholar] [CrossRef] [Green Version]
- Sayej, W.N.; Knight Iii, P.R.; Guo, W.A.; Mullan, B.; Ohtake, P.J.; Davidson, B.A.; Khan, A.; Baker, R.D.; Baker, S.S. Advanced Glycation End Products Induce Obesity and Hepatosteatosis in CD-1 Wild-Type Mice. BioMed Res. Int. 2016, 2016, 7867852. [Google Scholar] [CrossRef] [PubMed]
- Negrean, M.; Stirban, A.; Stratmann, B.; Gawlowski, T.; Horstmann, T.; Gotting, C.; Kleesiek, K.; Mueller-Roesel, M.; Koschinsky, T.; Uribarri, J.; et al. Effects of low- and high-advanced glycation endproduct meals on macro- and microvascular endothelial function and oxidative stress in patients with type 2 diabetes mellitus. Am. J. Clin. Nutr. 2007, 85, 1236–1243. [Google Scholar] [CrossRef] [Green Version]
- Jinnouchi, Y.; Yamagishi, S.; Takeuchi, M.; Ishida, S.; Jinnouchi, Y.; Jinnouchi, J.; Imaizumi, T. Atorvastatin decreases serum levels of advanced glycation end products (AGEs) in patients with type 2 diabetes. Clin. Exp. Med. 2006, 6, 191–193. [Google Scholar] [CrossRef]
- Iwakiri, Y.; Kim, M.Y. Nitric oxide in liver diseases. Trends Pharmacol. Sci. 2015, 36, 524–536. [Google Scholar] [CrossRef] [Green Version]
- Nathan, C. Nitric oxide as a secretory product of mammalian cells. FASEB J. 1992, 6, 3051–3064. [Google Scholar] [CrossRef] [PubMed]
- Taylor, B.S.; Alarcon, L.H.; Billiar, T.R. Inducible nitric oxide synthase in the liver: Regulation and function. Biochemistry 1998, 63, 766–781. [Google Scholar]
- Rockey, D.C.; Chung, J.J. Regulation of inducible nitric oxide synthase in hepatic sinusoidal endothelial cells. Am. J. Physiol. 1996, 271, G260–G267. [Google Scholar] [CrossRef] [PubMed]
- Bryan, N.S.; Bian, K.; Murad, F. Discovery of the nitric oxide signaling pathway and targets for drug development. Front. Biosci. 2009, 14, 1–18. [Google Scholar] [CrossRef] [Green Version]
- Rockey, D.C. Vascular mediators in the injured liver. Hepatology 2003, 37, 4–12. [Google Scholar] [CrossRef] [PubMed]
- Friedman, S.L. Hepatic stellate cells: Protean, multifunctional, and enigmatic cells of the liver. Physiol. Rev. 2008, 88, 125–172. [Google Scholar] [CrossRef] [PubMed]
- Leung, T.M.; Tipoe, G.L.; Liong, E.C.; Lau, T.Y.; Fung, M.L.; Nanji, A.A. Endothelial nitric oxide synthase is a critical factor in experimental liver fibrosis. Int. J. Exp. Pathol. 2008, 89, 241–250. [Google Scholar] [CrossRef]
- Leung, T.M.; Fung, M.L.; Liong, E.C.; Lau, T.Y.; Nanji, A.A.; Tipoe, G.L. Role of nitric oxide in the regulation of fibrogenic factors in experimental liver fibrosis in mice. Histol. Histopathol. 2011, 26, 201–211. [Google Scholar] [CrossRef] [PubMed]
- Blum, A.; Shamburek, R. The pleiotropic effects of statins on endothelial function, vascular inflammation, immunomodulation and thrombogenesis. Atherosclerosis 2009, 203, 325–330. [Google Scholar] [CrossRef]
- Park, J.K.; Muller, D.N.; Mervaala, E.M.; Dechend, R.; Fiebeler, A.; Schmidt, F.; Bieringer, M.; Schafer, O.; Lindschau, C.; Schneider, W.; et al. Cerivastatin prevents angiotensin II-induced renal injury independent of blood pressure- and cholesterol-lowering effects. Kidney Int. 2000, 58, 1420–1430. [Google Scholar] [CrossRef] [Green Version]
- Trocha, M.; Merwid-Lad, A.; Szuba, A.; Chlebda, E.; Piesniewska, M.; Sozanski, T.; Szelag, A. Effect of simvastatin on nitric oxide synthases (eNOS, iNOS) and arginine and its derivatives (ADMA, SDMA) in ischemia/reperfusion injury in rat liver. Pharmacol. Rep. 2010, 62, 343–351. [Google Scholar] [CrossRef]


Publisher’s Note: MDPI stays neutral with regard to jurisdictional claims in published maps and institutional affiliations. |
© 2022 by the authors. Licensee MDPI, Basel, Switzerland. This article is an open access article distributed under the terms and conditions of the Creative Commons Attribution (CC BY) license (https://creativecommons.org/licenses/by/4.0/).
Share and Cite
Pereira, E.N.G.d.S.; Araujo, B.P.d.; Rodrigues, K.L.; Silvares, R.R.; Martins, C.S.M.; Flores, E.E.I.; Fernandes-Santos, C.; Daliry, A. Simvastatin Improves Microcirculatory Function in Nonalcoholic Fatty Liver Disease and Downregulates Oxidative and ALE-RAGE Stress. Nutrients 2022, 14, 716. https://doi.org/10.3390/nu14030716
Pereira ENGdS, Araujo BPd, Rodrigues KL, Silvares RR, Martins CSM, Flores EEI, Fernandes-Santos C, Daliry A. Simvastatin Improves Microcirculatory Function in Nonalcoholic Fatty Liver Disease and Downregulates Oxidative and ALE-RAGE Stress. Nutrients. 2022; 14(3):716. https://doi.org/10.3390/nu14030716
Chicago/Turabian StylePereira, Evelyn Nunes Goulart da Silva, Beatriz Peres de Araujo, Karine Lino Rodrigues, Raquel Rangel Silvares, Carolina Souza Machado Martins, Edgar Eduardo Ilaquita Flores, Caroline Fernandes-Santos, and Anissa Daliry. 2022. "Simvastatin Improves Microcirculatory Function in Nonalcoholic Fatty Liver Disease and Downregulates Oxidative and ALE-RAGE Stress" Nutrients 14, no. 3: 716. https://doi.org/10.3390/nu14030716