
The Associations between Maternal Serum Aspartame and Sucralose and Metabolic Health during Pregnancy

Abstract
:
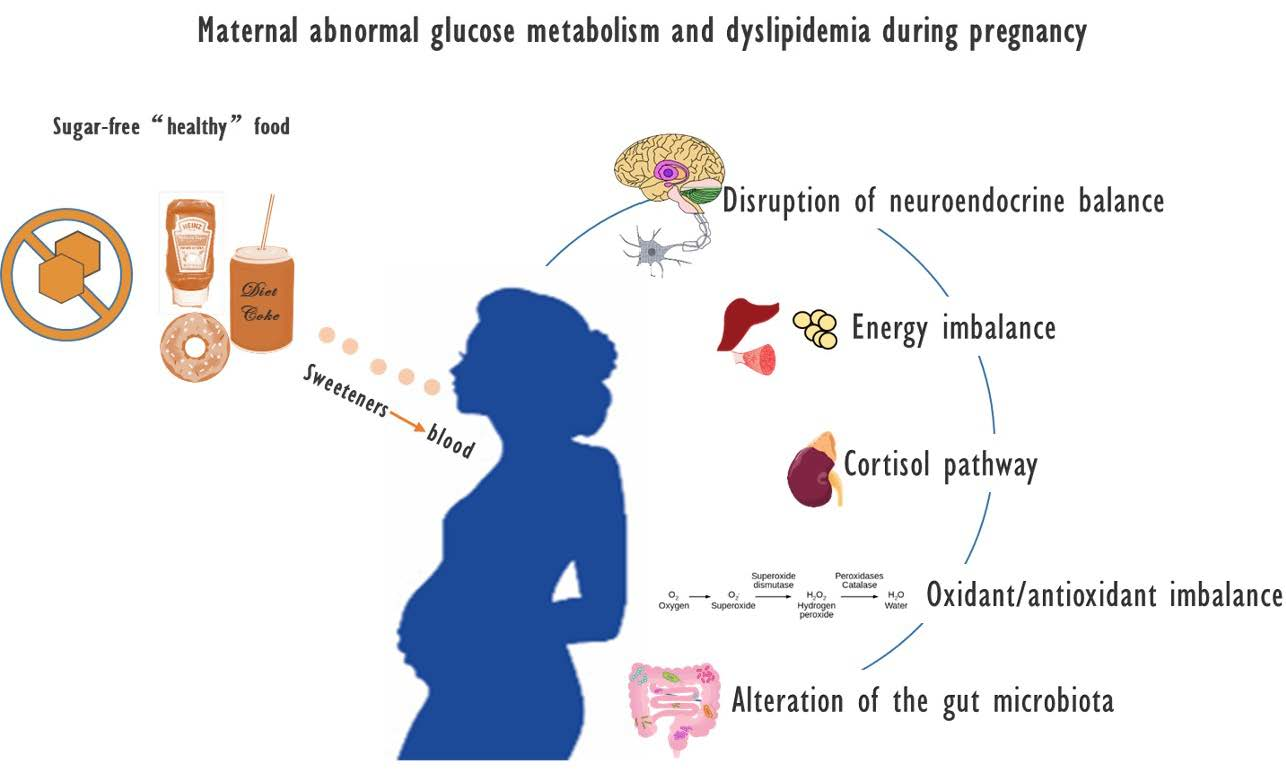
1. Introduction
2. Methods
2.1. Participants
2.2. Study Visit
2.3. Laboratory Measurements
2.4. Serum Aspartame and Sucralose Level Measurements
2.4.1. Sample Preparation
2.4.2. UPLC-MS/MS Analysis Parameters
2.5. Diagnosis and Definition
2.6. Statistical Analysis
3. Results
3.1. Distributions of Serum Aspartame and Sucralose Levels
3.2. Participants’ Characteristics
3.3. Factors Associated with Serum Aspartame and Sucralose Levels
3.4. Linear Associations between Serum Aspartame and Sucralose Levels and Glycemic and Lipid Traits
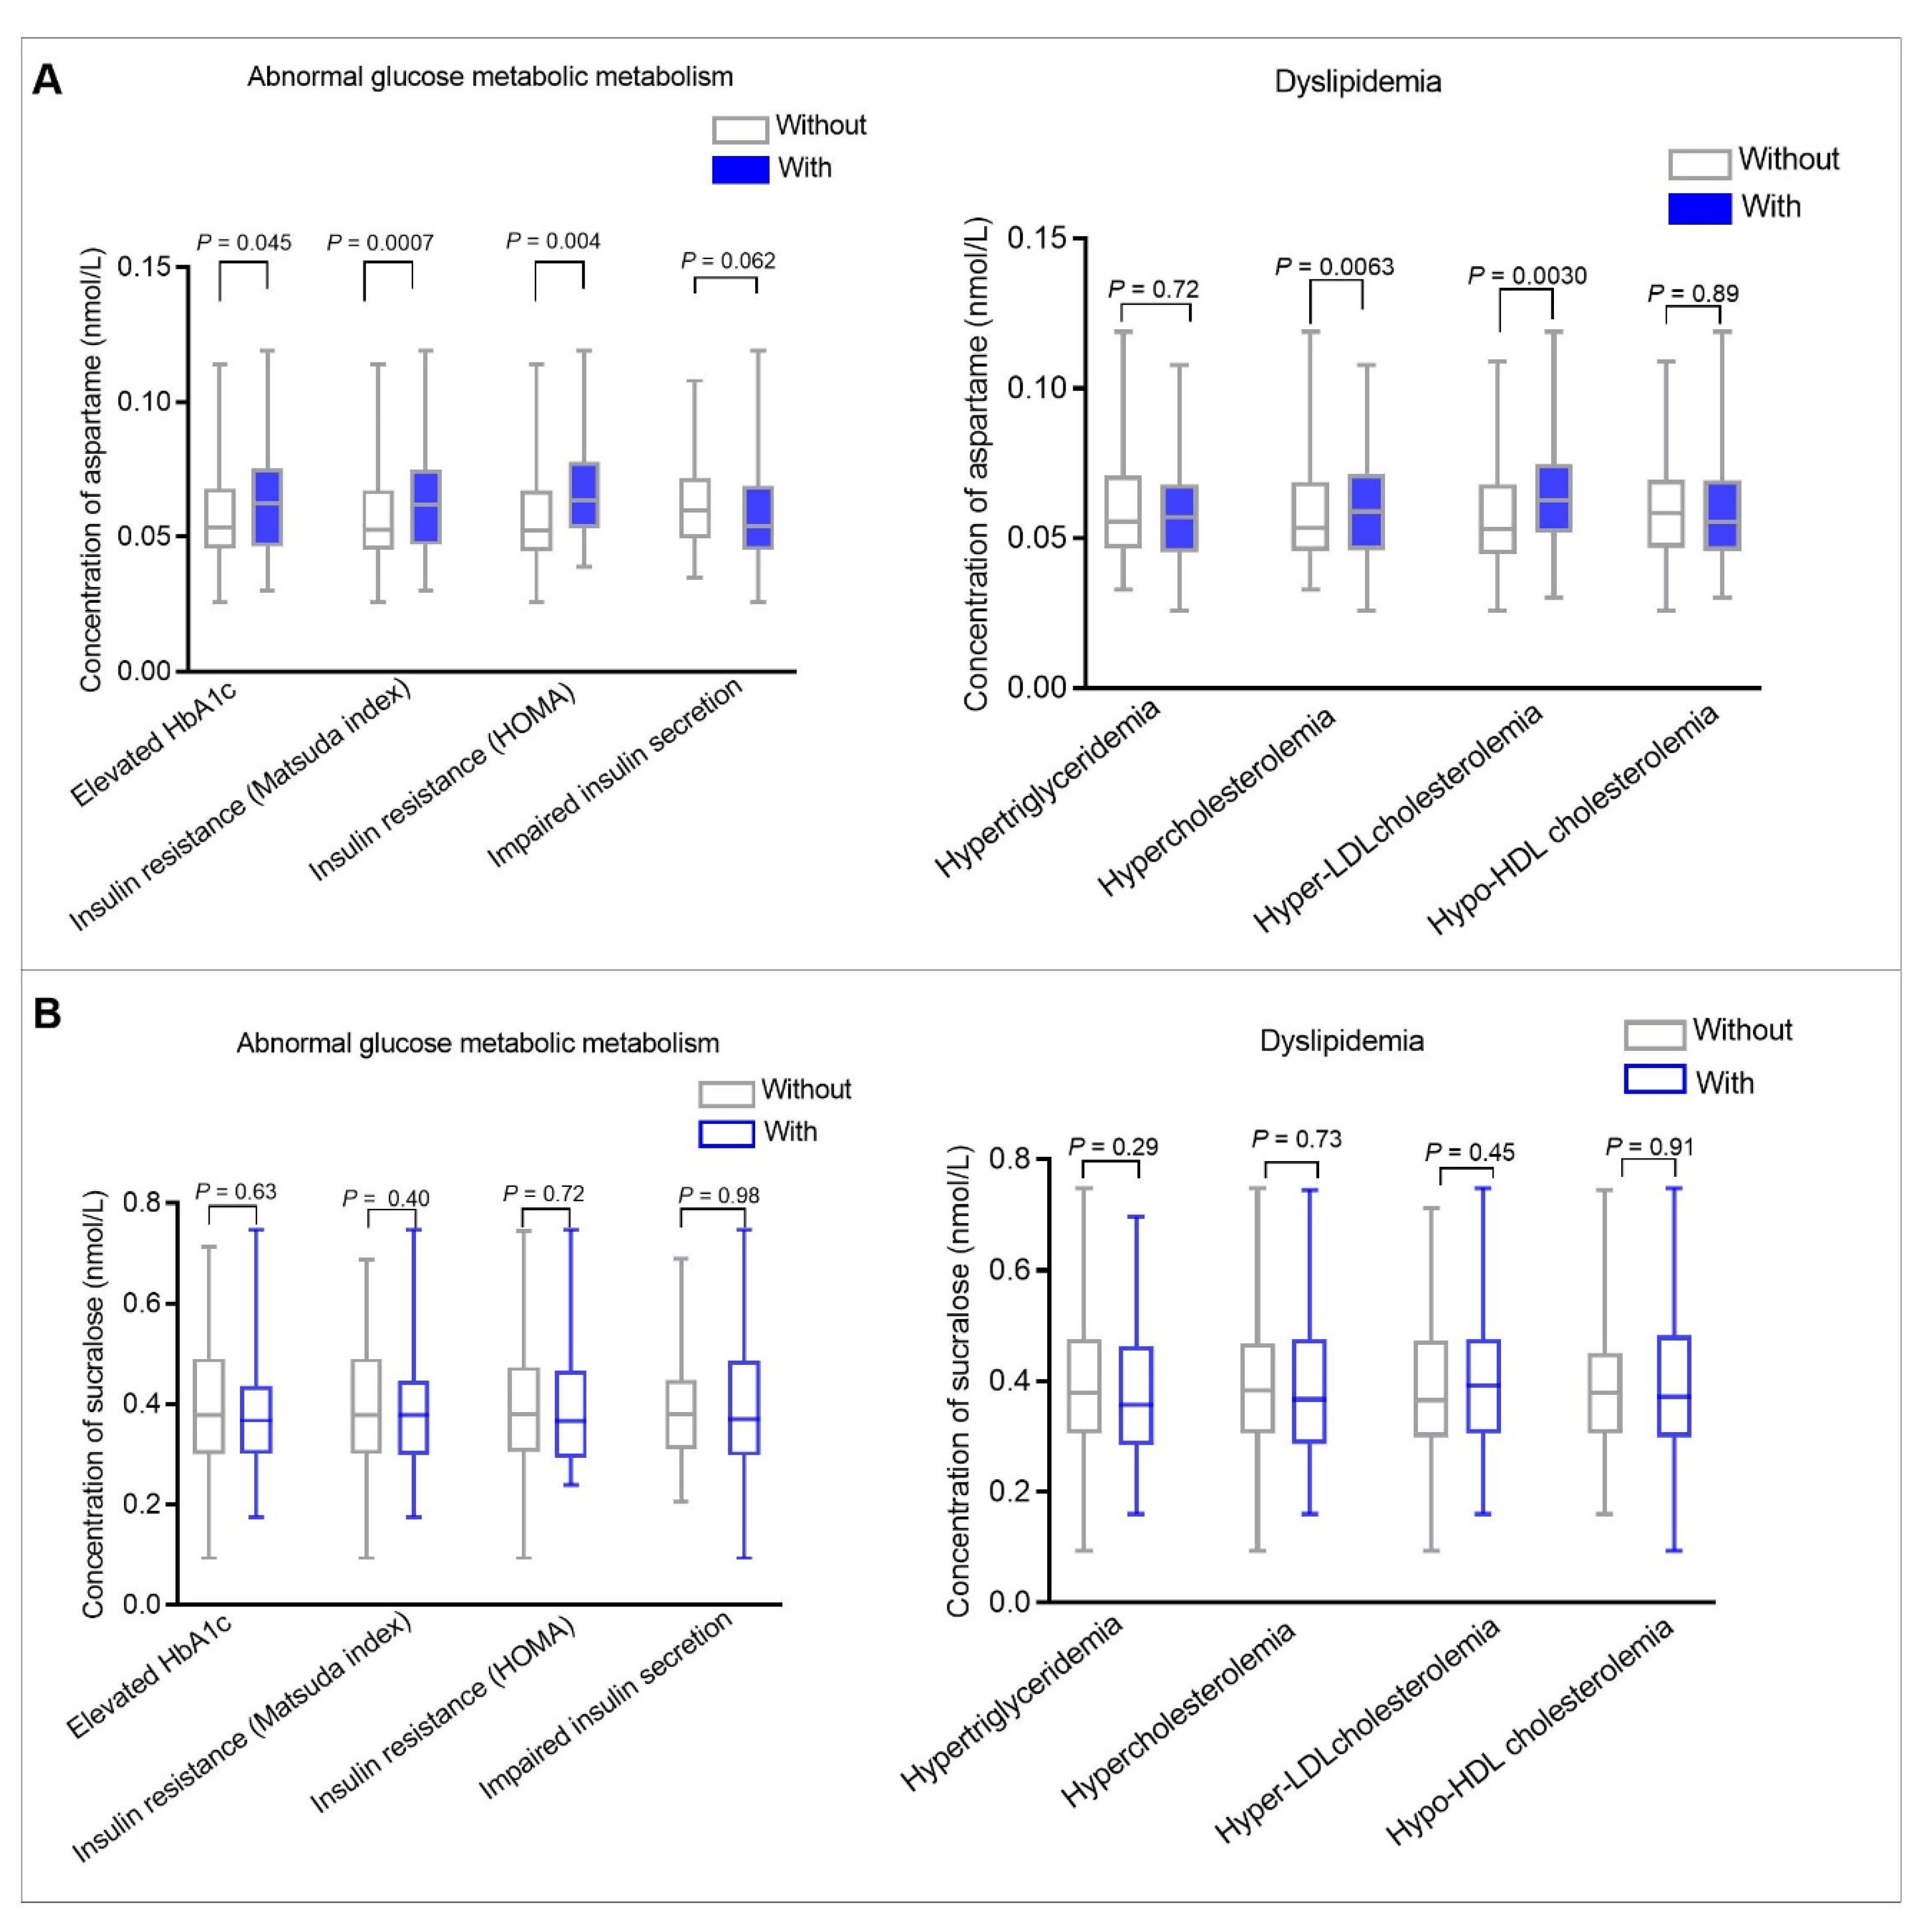
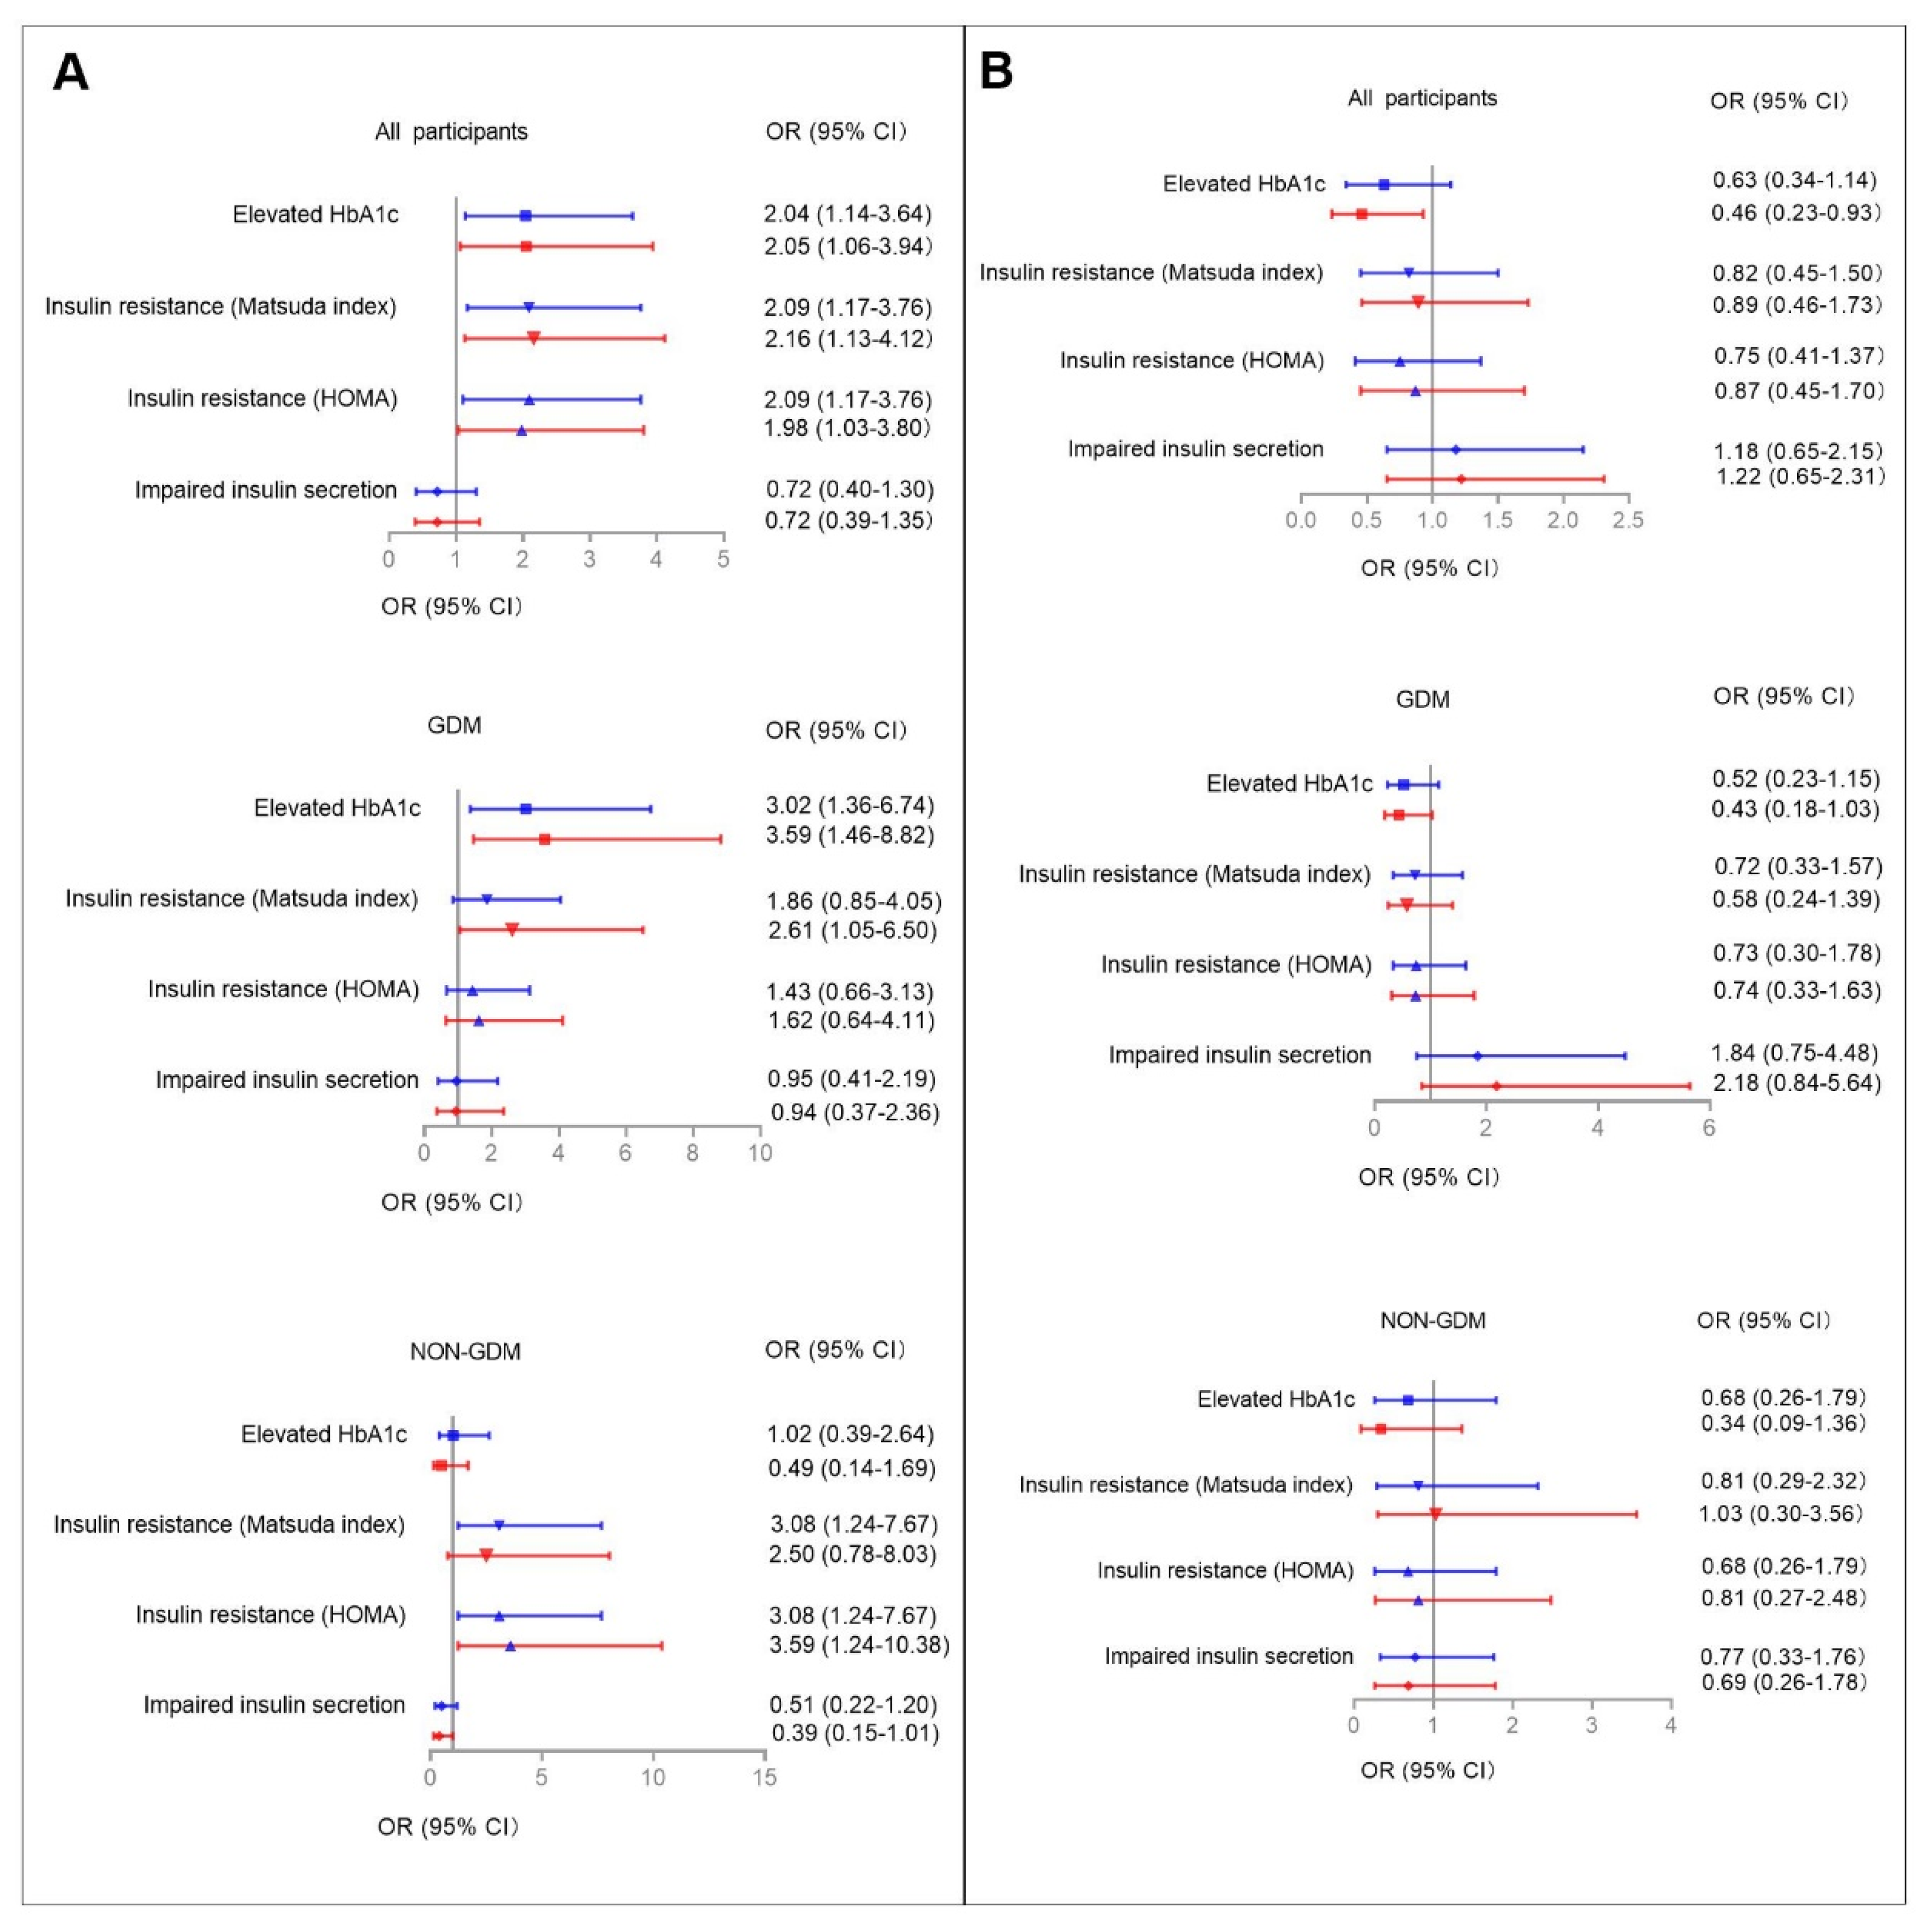
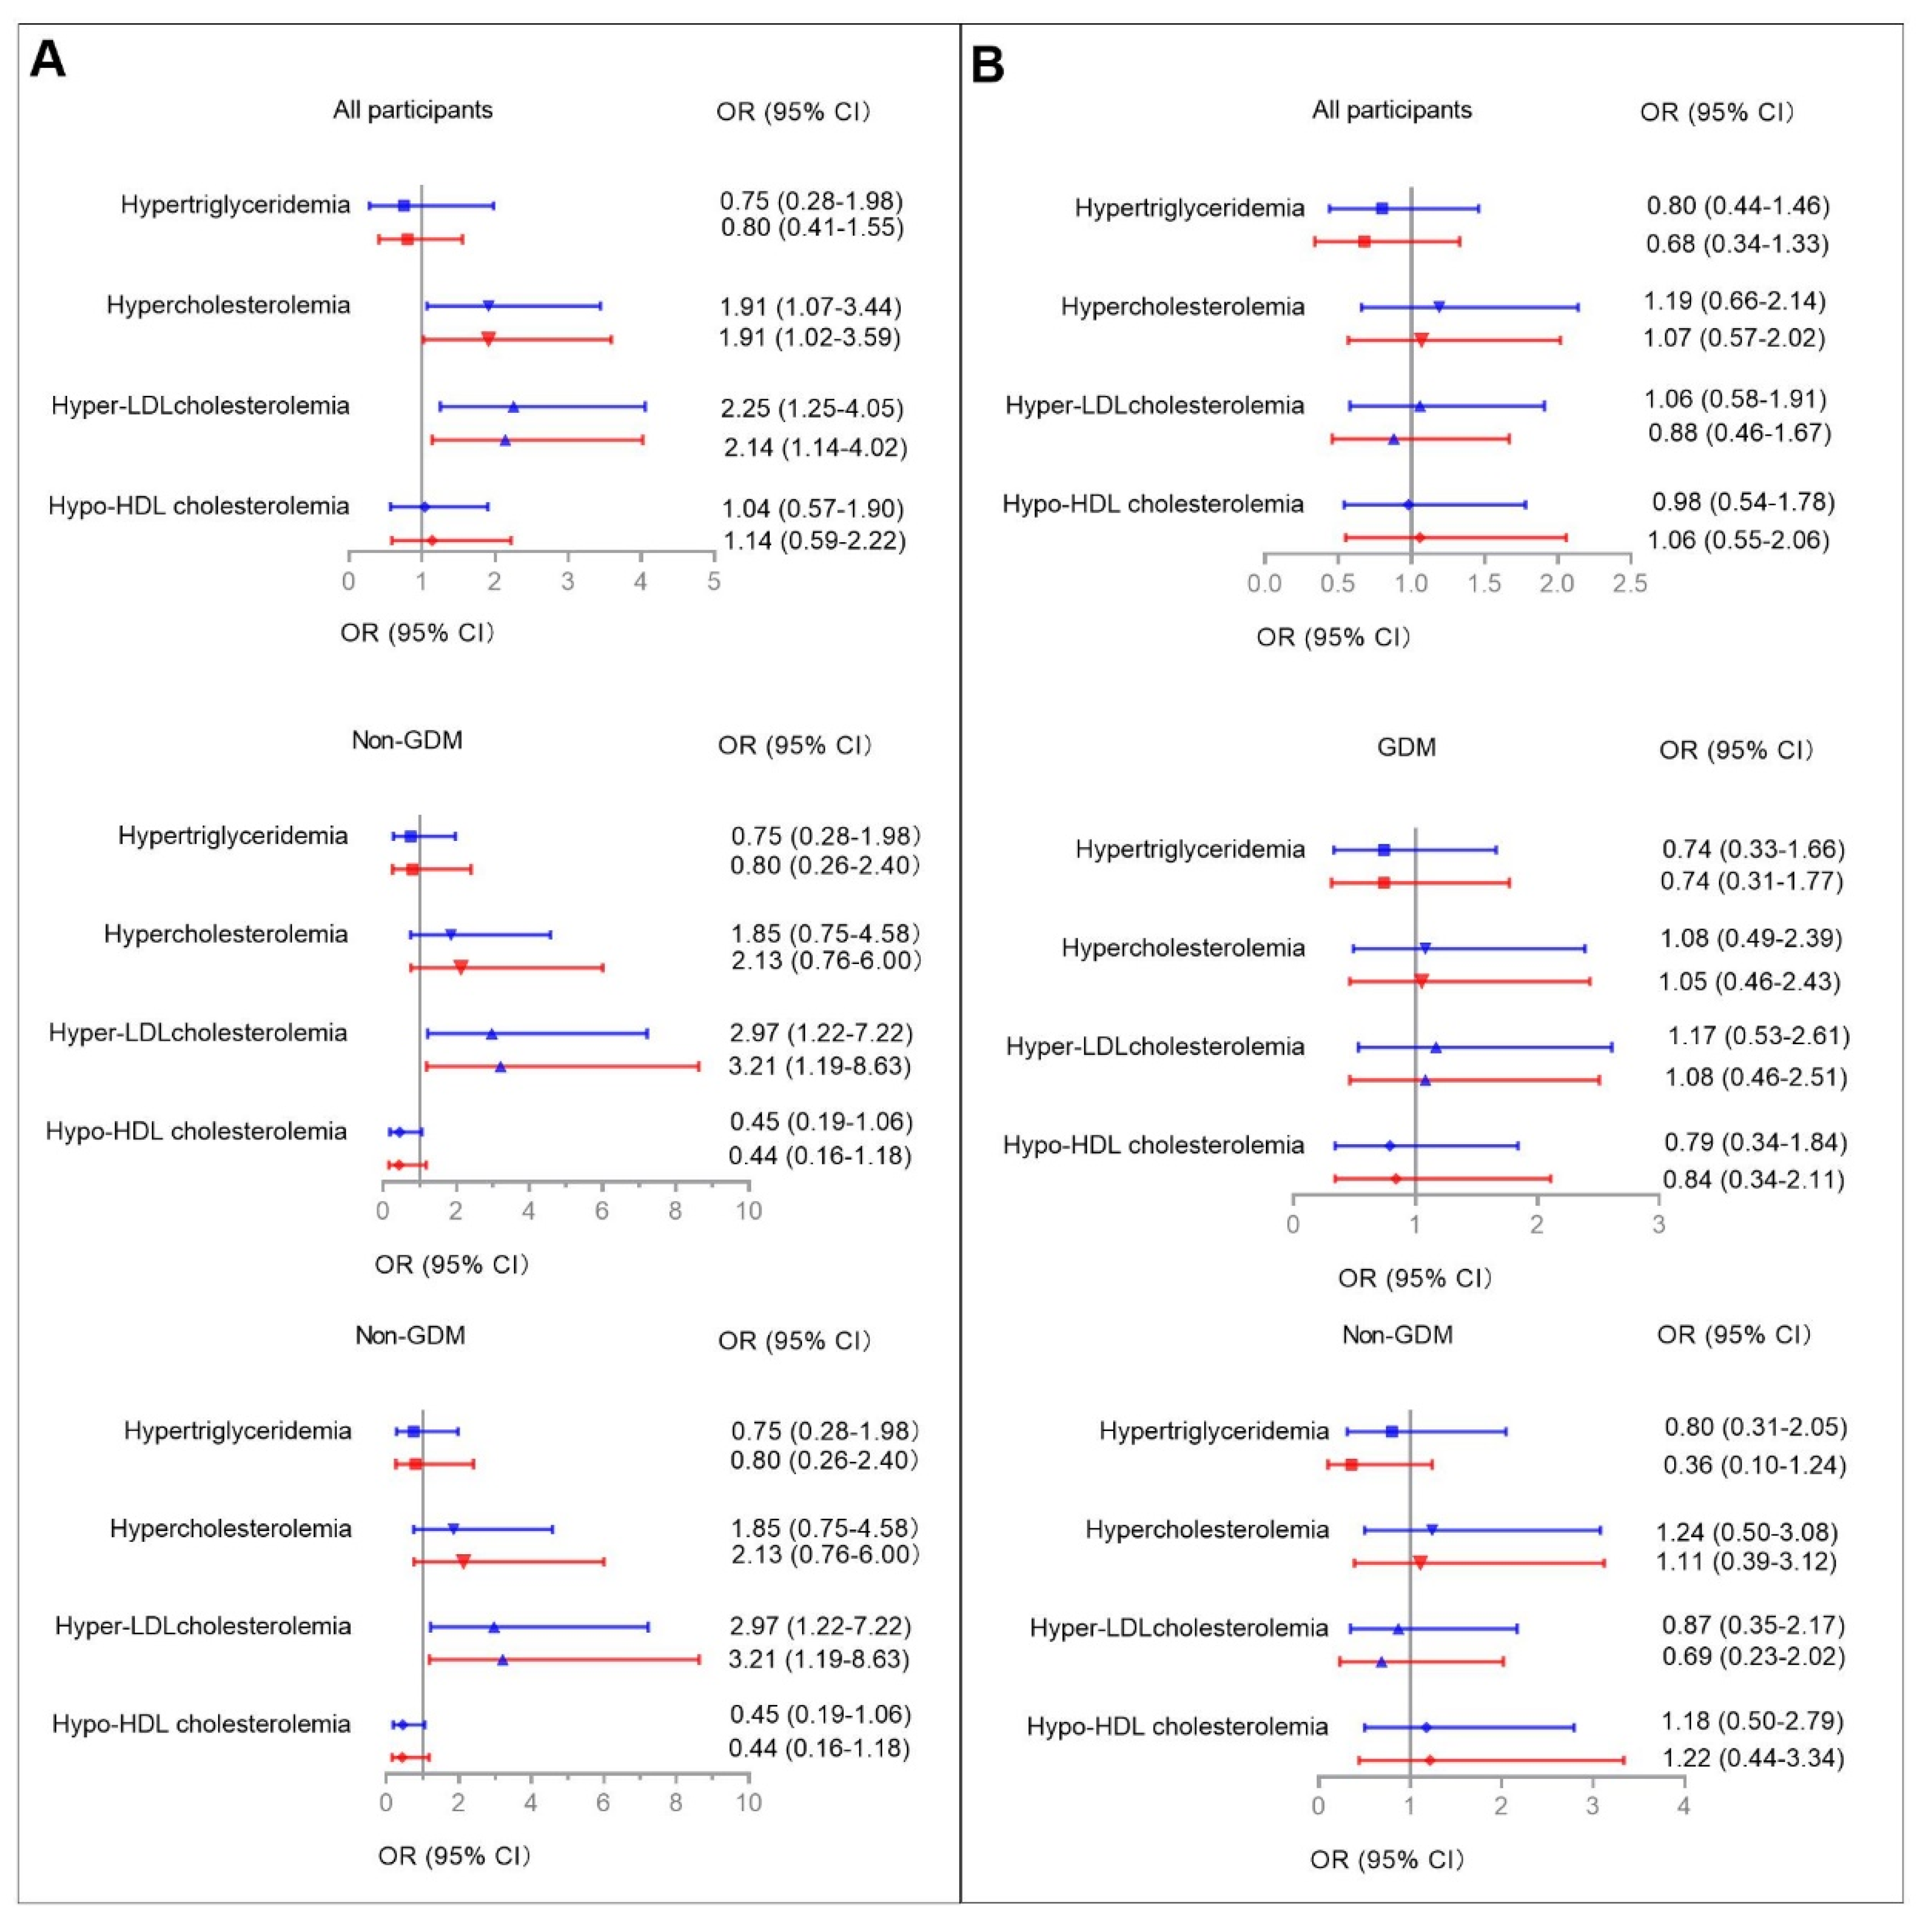
3.5. Categorized Serum Aspartame and Sucralose Levels Associated with Abnormal Glucose Metabolism and Dyslipidemia
3.6. Categorized Serum Aspartame and Sucralose Levels Associated with Abnormal Glucose Metabolism/Dyslipidemia in GDM and Non-GDM Groups
4. Discussion
5. Conclusions
Supplementary Materials
Author Contributions
Funding
Institutional Review Board Statement
Informed Consent Statement
Data Availability Statement
Acknowledgments
Conflicts of Interest
References
- Azad, M.B.; Sharma, A.K.; de Souza, R.; Dolinsky, V.W.; Becker, A.B.; Mandhane, P.J.; Turvey, S.; Subbarao, P.; Lefebvre, D.L.; Sears, M.R.; et al. Association Between Artificially Sweetened Beverage Consumption During Pregnancy and Infant Body Mass Index. JAMA Pediatr. 2016, 170, 662–670. [Google Scholar] [CrossRef] [PubMed]
- Zhu, Y.; Olsen, S.F.; Mendola, P.; Halldorsson, T.I.; Rawal, S.; Hinkle, S.N.; Yeung, E.H.; Chavarro, J.E.E.; Grunnet, L.G.; Granström, C.; et al. Maternal consumption of artificially sweetened beverages during pregnancy, and offspring growth through 7 years of age: A prospective cohort study. Int. J. Epidemiol. 2017, 46, 1499–1508. [Google Scholar] [CrossRef] [Green Version]
- Ragi, M.-E.E.; El-Haber, R.; El-Masri, F.; Obeid, O.A. The effect of aspartame and sucralose intake on body weight measures and blood metabolites: Role of their form (solid and/or liquid) of ingestion. Br. J. Nutr. 2021, 128, 352–360. [Google Scholar] [CrossRef] [PubMed]
- Lebda, M.A.; Tohamy, H.G.; El-Sayed, Y.S. Long-term soft drink and aspartame intake induces hepatic damage via dysregulation of adipocytokines and alteration of the lipid profile and antioxidant status. Nutr. Res. 2017, 41, 47–55. [Google Scholar] [CrossRef]
- Choudhary, A.K.; Pretorius, E. Revisiting the safety of aspartame. Nutr. Rev. 2017, 75, 718–730. [Google Scholar] [CrossRef] [PubMed] [Green Version]
- Temizkan, S.; Deyneli, O.; Yasar, M.; Arpa, M.; Gunes, M.; Yazici, D.; Sirikci, O.; Haklar, G.; Imeryuz, N.; Yavuz, D.G. Sucralose enhances GLP-1 release and lowers blood glucose in the presence of carbohydrate in healthy subjects but not in patients with type 2 diabetes. Eur. J. Clin. Nutr. 2014, 69, 162–166. [Google Scholar] [CrossRef]
- Vigues, S.; Dotson, C.; Munger, S. The Receptor Basis of Sweet Taste in Mammals. Results Probl. Cell Differ. 2009, 47, 187–202. [Google Scholar] [CrossRef]
- Mawhinney, D.B.; Young, R.B.; Vanderford, B.J.; Borch, T.; Snyder, S.A. Artificial Sweetener Sucralose in U.S. Drinking Water Systems. Environ. Sci. Technol. 2011, 45, 8716–8722. [Google Scholar] [CrossRef]
- Sylvetsky, A.C.; Bauman, V.; Blau, J.E.; Garraffo, H.M.; Walter, P.J.; Rother, K.I. Plasma concentrations of sucralose in children and adults. Toxicol. Environ. Chem. 2016, 99, 535–542. [Google Scholar] [CrossRef] [Green Version]
- Zhang, T.; Gan, Z.; Gao, C.; Ma, L.; Li, Y.; Li, X.; Sun, H. Occurrence of artificial sweeteners in human liver and paired blood and urine samples from adults in Tianjin, China and their implications for human exposure. Environ. Sci. Process. Impacts 2016, 18, 1169–1176. [Google Scholar] [CrossRef]
- Silwood, C.; Lynch, E.; Claxson, A.; Grootveld, M. 1H and 13C NMR Spectroscopic Analysis of Human Saliva. J. Dent. Res. 2002, 81, 422–427. [Google Scholar] [CrossRef]
- Nettleton, J.E.; Cho, N.A.; Klancic, T.; Nicolucci, A.C.; Shearer, J.; Borgland, S.L.; Johnston, L.A.; Ramay, H.R.; Tuplin, E.N.; Chleilat, F.; et al. Maternal low-dose aspartame and stevia consumption with an obesogenic diet alters metabolism, gut microbiota and mesolimbic reward system in rat dams and their offspring. Gut 2020, 69, 1807–1817. [Google Scholar] [CrossRef] [Green Version]
- Guo, W.; Li, J.; Liu, Q.; Shi, J.; Gao, Y. Tracking the fate of artificial sweeteners within the coastal waters of Shenzhen city, China: From wastewater treatment plants to sea. J. Hazard. Mater. 2021, 414, 125498. [Google Scholar] [CrossRef]
- Zhu, H.; Zhao, Z.; Xu, J.; Chen, Y.; Zhu, Q.; Zhou, L.; Cai, J.; Ji, L. The prevalence of gestational diabetes mellitus before and after the implementation of the universal two-child policy in China. Front. Endocrinol. 2022, 13, 960877. [Google Scholar] [CrossRef]
- Zhang, X.; Gong, Y.; Della Corte, K.; Yu, D.; Xue, H.; Shan, S.; Tian, G.; Liang, Y.; Zhang, J.; He, F.; et al. Relevance of dietary glycemic index, glycemic load and fiber intake before and during pregnancy for the risk of gestational diabetes mellitus and maternal glucose homeostasis. Clin. Nutr. 2021, 40, 2791–2799. [Google Scholar] [CrossRef]
- Franklin, S.S.; Lopez, V.A.; Wong, N.D.; Mitchell, G.F.; Larson, M.G.; Vasan, R.S.; Levy, D. Single Versus Combined Blood Pressure Components and Risk for Cardiovascular Disease: The Framingham Heart Study. Circulation 2009, 119, 243–250. [Google Scholar] [CrossRef] [Green Version]
- Matthews, D.R.; Hosker, J.P.; Rudenski, A.S.; Naylor, B.A.; Treacher, D.F.; Turner, R.C. Homeostasis model assessment: Insulin resistance and β-cell function from fasting plasma glucose and insulin concentrations in man. Diabetologia 1985, 28, 412–419. [Google Scholar] [CrossRef] [Green Version]
- Wallace, T.M.; Levy, J.C.; Matthews, D.R. Use and Abuse of HOMA Modeling. Diabetes Care 2004, 27, 1487–1495. [Google Scholar] [CrossRef] [Green Version]
- Matsuda, M.; DeFronzo, R.A. Insulin sensitivity indices obtained from oral glucose tolerance testing: Comparison with the euglycemic insulin clamp. Diabetes Care 1999, 22, 1462–1470. [Google Scholar] [CrossRef]
- Logue, C.; Dowey, L.R.C.; Strain, J.J.; Verhagen, H.; McClean, S.; Gallagher, A.M. Application of Liquid Chromatography–Tandem Mass Spectrometry to Determine Urinary Concentrations of Five Commonly Used Low-Calorie Sweeteners: A Novel Biomarker Approach for Assessing Recent Intakes? J. Agric. Food Chem. 2017, 65, 4516–4525. [Google Scholar] [CrossRef]
- Kubica, P.; Namieśnik, J.; Wasik, A. Comparison of hydrophilic interaction and reversed phase liquid chromatography coupled with tandem mass spectrometry for the determination of eight artificial sweeteners and common steviol glycosides in popular beverages. J. Pharm. Biomed. Anal. 2016, 127, 184–192. [Google Scholar] [CrossRef] [PubMed]
- Metzger, B.E.; Gabbe, S.G.; Persson, B.; Buchanan, T.A.; Catalano, P.A.; Damm, P.; Dyer, A.R.; de Leiva, A.; Hod, M.; Kitzmiler, J.L.; et al. International Association of Diabetes and Pregnancy Study Groups Recommendations on the Diagnosis and Classification of Hyperglycemia in Pregnancy. Diabetes Care 2010, 33, 676–682. [Google Scholar] [CrossRef] [PubMed] [Green Version]
- Evard, H.; Kruve, A.; Leito, I. Tutorial on estimating the limit of detection using LC-MS analysis, part I: Theoretical review. Anal. Chim. Acta 2016, 942, 23–39. [Google Scholar] [CrossRef]
- Ahmad, S.Y.; Friel, J.K.; Mackay, D.S. Effect of sucralose and aspartame on glucose metabolism and gut hormones. Nutr. Rev. 2020, 78, 725–746. [Google Scholar] [CrossRef] [PubMed]
- Park, C.H.; Choi, S.H.; Piao, Y.; Kim, S.-H.; Lee, Y.-J.; Kim, H.-S.; Jeong, S.-J.; Rah, J.-C.; Seo, J.-H.; Lee, J.-H.; et al. Glutamate and aspartate impair memory retention and damage hypothalamic neurons in adult mice. Toxicol. Lett. 2000, 115, 117–125. [Google Scholar] [CrossRef]
- Iyyaswamy, A.; Rathinasamy, S. Effect of chronic exposure to aspartame on oxidative stress in brain discrete regions of albino rats. J. Biosci. 2012, 37, 679–688. [Google Scholar] [CrossRef]
- Christian, B.; McConnaughey, K.; Bethea, E.; Brantley, S.; Coffey, A.; Hammond, L.; Harrell, S.; Metcalf, K.; Muehlenbein, D.; Spruill, W.; et al. Chronic aspartame affects T-maze performance, brain cholinergic receptors and Na+,K+-ATPase in rats. Pharmacol. Biochem. Behav. 2004, 78, 121–127. [Google Scholar] [CrossRef]
- Abdel-Salam, O.M.E.; Salem, N.A.; Hussein, J.S. Effect of Aspartame on Oxidative Stress and Monoamine Neurotransmitter Levels in Lipopolysaccharide-Treated Mice. Neurotox. Res. 2011, 21, 245–255. [Google Scholar] [CrossRef]
- Higgins, K.A.; Considine, R.V.; Mattes, R.D. Aspartame Consumption for 12 Weeks Does Not Affect Glycemia, Appetite, or Body Weight of Healthy, Lean Adults in a Randomized Controlled Trial. J. Nutr. 2018, 148, 650–657. [Google Scholar] [CrossRef] [Green Version]
- Kuk, J.L.; Brown, R.E. Aspartame intake is associated with greater glucose intolerance in individuals with obesity. Appl. Physiol. Nutr. Metab. 2016, 41, 795–798. [Google Scholar] [CrossRef]
- Azad, M.B.; Archibald, A.; Tomczyk, M.M.; Head, A.; Cheung, K.G.; De Souza, R.J.; Becker, A.B.; Mandhane, P.J.; Turvey, S.; Moraes, T.J.; et al. Nonnutritive sweetener consumption during pregnancy, adiposity, and adipocyte differentiation in offspring: Evidence from humans, mice, and cells. Int. J. Obes. 2020, 44, 2137–2148. [Google Scholar] [CrossRef]
- Okuno, G.; Kawakami, F.; Tako, H.; Kashihara, T.; Shibamoto, S.; Yamazaki, T.; Yamamoto, K.; Saeki, M. Glucose tolerance, blood lipid, insulin and glucagon concentration after single or continuous administration of aspartame in diabetics. Diabetes Res. Clin. Pract. 1986, 2, 23–27. [Google Scholar] [CrossRef]
- Colagiuri, S.; Miller, J.J.; Edwards, R.A. Metabolic effects of adding sucrose and aspartame to the diet of subjects with noninsulin-dependent diabetes mellitus. Am. J. Clin. Nutr. 1989, 50, 474–478. [Google Scholar] [CrossRef] [Green Version]
- Qian, C.; Qi, Y.; Feng, R.; Yang, M.; Zhang, M.; Liu, W.; Rayner, C.K.; Ma, J. Sucralose can improve glucose tolerance and upregulate expression of sweet taste receptors and glucose transporters in an obese rat model. Eur. J. Nutr. 2020, 60, 1809–1817. [Google Scholar] [CrossRef]
- Choudhary, A.K. Aspartame: Should Individuals with Type II Diabetes be Taking it? Curr. Diabetes Rev. 2018, 14, 350–362. [Google Scholar] [CrossRef]
- Romo-Romo, A.; Aguilar-Salinas, C.A.; Brito-Córdova, G.X.; Gomez-Diaz, R.; Almeda-Valdes, P. Sucralose decreases insulin sensitivity in healthy subjects: A randomized controlled trial. Am. J. Clin. Nutr. 2018, 108, 485–491. [Google Scholar] [CrossRef]
- Ahmad, S.; Friel, J.; Mackay, D. The Effects of Non-Nutritive Artificial Sweeteners, Aspartame and Sucralose, on the Gut Microbiome in Healthy Adults: Secondary Outcomes of a Randomized Double-Blinded Crossover Clinical Trial. Nutrients 2020, 12, 3408. [Google Scholar] [CrossRef]
- Ma, J.; Chang, J.; Checklin, H.L.; Young, R.L.; Jones, K.L.; Horowitz, M.; Rayner, C.K. Effect of the artificial sweetener, sucralose, on small intestinal glucose absorption in healthy human subjects. Br. J. Nutr. 2010, 104, 803–806. [Google Scholar] [CrossRef] [Green Version]
- Ma, J.; Bellon, M.; Wishart, J.M.; Young, R.; Blackshaw, L.A.; Jones, K.L.; Horowitz, M.; Rayner, C.K. Effect of the artificial sweetener, sucralose, on gastric emptying and incretin hormone release in healthy subjects. Am. J. Physiol. Liver Physiol. 2009, 296, G735–G739. [Google Scholar] [CrossRef] [Green Version]
- Gómez--Fernández, A.R.; Santacruz, A.; Jacobo--Velázquez, D.A. The complex relationship between metabolic syndrome and sweeteners. J. Food Sci. 2021, 86, 1511–1531. [Google Scholar] [CrossRef]
- Belloir, C.; Neiers, F.; Briand, L. Sweeteners and sweetness enhancers. Curr. Opin. Clin. Nutr. Metab. Care 2017, 20, 279–285. [Google Scholar] [CrossRef] [PubMed]


| Trait (Units) | Serum Aspartame Levels | Serum Sucralose Levels | ||||
|---|---|---|---|---|---|---|
| Lower (n = 144) | Higher (n = 74) | p | Lower (n = 143) | Higher (n = 75) | p | |
| Aspartame/sucralose levels (nmol/L) | 0.0495 (0.0432–0.0560) | 0.0765 (0.0692–0.0841) | - | 0.32 (0.28–0.37) | 0.51 (0.46–0.57) | - |
| Age at OGTT (years) | 30.1 ± 4.3 | 29.9 ± 4.4 | 0.70 | 29.9 ± 4.3 | 30.4 ± 4.3 | 0.44 |
| Gestational age at OGTT (weeks) | 25.0 (25.0–26.0) | 25.0 (25.0–26.0) | 0.70 | 25.0 (25.0–26.0) | 25.0 (24.0–26.0) | 0.13 |
| Pre-pregnancy BMI (kg/m2) | 22.38 ± 3.34 | 22.88 ± 3.42 | 0.30 | 22.62 ± 3.43 | 22.52 ± 3.46 | 0.75 |
| BMI (kg/m2) | 25.07 ± 3.66 | 25.51 ± 3.46 | 0.39 | 25.31 ± 3.54 | 25.04 ± 3.70 | 0.61 |
| MAP (mmHg) | 87.1 ± 8.4 | 89.4 ± 9.3 | 0.073 | 88.2 ± 9.0 | 87.4 ± 8.3 | 0.56 |
| FPG (mmol/L) | 4.57 ± 0.48 | 4.67 ± 0.49 | 0.13 | 4.64 ± 0.48 | 4.53 ± 0.49 | 0.12 |
| 1 h plasma glucose levels (mmol/L) | 8.39 ± 1.87 | 8.72 ± 1.77 | 0.20 | 8.57 ± 1.83 | 8.36 ± 1.87 | 0.42 |
| 2 h plasma glucose levels (mmol/L) | 7.44 ± 1.62 | 7.71 ± 1.68 | 0.26 | 7.56 ± 1.61 | 7.49 ± 1.71 | 0.79 |
| Fasting insulin levels (mmol/L) | 41.54 (27.29–61.55) | 56.63 (34.57–77.22) | 0.0087 | 50.87 (29.62–70.76) | 42.20 (29.36–67.76) | 0.34 |
| 1 h insulin levels (mmol/L) | 334.15 (208.45–538.55) | 402.00 (319.40–534.50) | 0.026 | 368.50 (251.70–540.70) | 345.00 (229.50–533.60) | 0.58 |
| 2 h insulin levels (mmol/L) | 314.85 (235.15–473.95) | 449.65 (293.20–582.00) | 0.0092 | 366.60 (240.70–522.10) | 346.00 (235.80–519.80) | 0.95 |
| HbA1c (%) | 4.89 ± 0.37 | 5.03 ± 0.37 | 0.014 | 4.98 ± 0.36 | 4.87 ± 0.40 | 0.04 |
| HbA1c (mmol/mol) | 29.99 ± 4.06 | 31.43 ± 4.05 | 0.014 | 30.90 ± 3.93 | 29.68 ± 4.34 | 0.04 |
| Matsuda ISI | 5.99 (4.00–8.98) | 4.44 (3.56–6.93) | 0.004 | 5.44 (3.75–7.49) | 5.61 (3.95–9.24) | 0.46 |
| HOMA-IR | 1.40 (0.86–2.21) | 1.96 (1.10–2.73) | 0.0095 | 1.70 (0.96–2.53) | 1.44 (0.94–2.29) | 0.30 |
| HOMA-β | 144.64 (103.52–195.09) | 155.01 (114.68–253.42) | 0.14 | 140.24 (105.41–216.83) | 152.07 (113.43–195.77) | 0.56 |
| Triglycerides (mmol/L) | 1.58 (1.27–2.07) | 1.74 (1.37–2.19) | 0.21 | 1.65 (1.31–2.09) | 1.60 (1.30–2.10) | 0.93 |
| Total cholesterol (mmol/L) | 5.25 ± 0.84 | 5.55 ± 0.80 | 0.014 | 5.33 ± 0.82 | 5.40 ± 0.88 | 0.56 |
| LDL cholesterol (mmol/L) | 2.70 (2.35–3.13) | 3.01 (2.64–3.48) | 0.0035 | 2.78 (2.36–3.24) | 2.93 (2.46–3.41) | 0.27 |
| HDL cholesterol (mmol/L) | 2.65 ± 0.56 | 2.67 ± 0.51 | 0.86 | 2.66 ± 0.54 | 2.65 ± 0.55 | 0.92 |
| Family history of diabetes, No. (%) | 9 (6.3) | 7 (9.5) | 0.39 | 8 (5.6) | 8 (10.7) | 0.17 |
| GDM, No. (%) | 76 (46.5) | 42 (56.8) | 0.15 | 69 (48.3) | 40 (53.3) | 0.48 |
Publisher’s Note: MDPI stays neutral with regard to jurisdictional claims in published maps and institutional affiliations. |
© 2022 by the authors. Licensee MDPI, Basel, Switzerland. This article is an open access article distributed under the terms and conditions of the Creative Commons Attribution (CC BY) license (https://creativecommons.org/licenses/by/4.0/).
Share and Cite
Liu, Y.; Li, X.; Wu, Y.; Su, Q.; Qin, L.; Ma, J. The Associations between Maternal Serum Aspartame and Sucralose and Metabolic Health during Pregnancy. Nutrients 2022, 14, 5001. https://doi.org/10.3390/nu14235001
Liu Y, Li X, Wu Y, Su Q, Qin L, Ma J. The Associations between Maternal Serum Aspartame and Sucralose and Metabolic Health during Pregnancy. Nutrients. 2022; 14(23):5001. https://doi.org/10.3390/nu14235001
Chicago/Turabian StyleLiu, Yu, Xiaoyong Li, Yiming Wu, Qing Su, Li Qin, and Jing Ma. 2022. "The Associations between Maternal Serum Aspartame and Sucralose and Metabolic Health during Pregnancy" Nutrients 14, no. 23: 5001. https://doi.org/10.3390/nu14235001