
Vitamin D Deficiency Is Associated with Glycometabolic Changes in Nondiabetic Patients with Arterial Hypertension

 , , and
Abstract
:
1. Introduction
2. Materials and Methods
2.1. Patients
2.2. Vitamin D Status Assessment
2.3. Glucose Metabolism Assessment
2.4. Statistical Analysis
3. Results
4. Discussion
5. Conclusions
Author Contributions
Funding
Institutional Review Board Statement
Informed Consent Statement
Data Availability Statement
Conflicts of Interest
References
- Morrish, N.J.; Wang, S.L.; Stevens, L.K.; Fuller, J.H.; Keen, H. Mortality and causes of death in the WHO multinational study of vascular disease in diabetes. Diabetologia 2001, 44, S14–S21. [Google Scholar] [CrossRef] [PubMed]
- Palmieri, V.; Bella, J.N.; Arnett, D.K.; Liu, L.E.; Oberman, A.; Schuck, M.Y.; Kitzman, D.W.; Hopkins, P.N.; Morgan, D.; Rao, D.C.; et al. Effect of type 2 diabetes mellitus on left ventricular geometry and systolic function in hypertensive subjects. Hypertension Genetic Epidemiology Network (HyperGEN) study. Circulation 2001, 103, 102–107. [Google Scholar] [CrossRef] [PubMed] [Green Version]
- Ning, F.; Zhang, L.; Dekker, J.M.; Onat, A.; Stehouwer, C.D.; Yudkin, J.S.; Laakikainen, T.; Tuomilehto, J.; Pyörälä, K.; Qiao, Q. Decode Finnish and Swedish Study Investigators. Development of coronary heart disease and ischemic stroke in relation to fasting and 2-hour plasma glucose levels in the normal range. Cardiovasc. Diabetol. 2012, 11, 76. [Google Scholar] [CrossRef] [PubMed]
- Hanssen, N.M.; Kraakman, M.J.; Flynn, M.C.; Nagareddy, P.R.; Schalkwijk, C.G.; Murphy, A.J. Postprandial glucose spikes, An important contributor to cardiovascular disease in diabetes. Front. Cardiovasc. Med. 2020, 7, 570553. [Google Scholar] [CrossRef]
- Catena, C.; Colussi, G.; Martinis, F.; Pezzutto, F.; Sechi, L.A. Plasma glucose levels and left ventricular diastolic function in nondiabetic hypertensive patients. Am. J. Hypertens. 2013, 26, 1353–1361. [Google Scholar] [CrossRef] [Green Version]
- Catena, C.; Colussi, G.L.; Frangipane, A.; Russo, A.; Verheyen, N.; Sechi, L.A. Carotid artery stiffness is related to hyper-insulinemia and insulin-resistance in middle-aged, non-diabetic hypertensive patients. Nutr. Metab. Cardiovasc. Dis. 2015, 25, 968–974. [Google Scholar] [CrossRef]
- Chanda, D.; Oligschlalger, Y.; Geraets, I.; Liu, Y.; Zhu, X.; Li, J.; Nabben, M.; Coumans, W.; Luiken, J.J.F.P.; Glatz, J.F.C.; et al. 2-Arachidonoylglycerol ameliorates inflammatory stress-induced insulin resistance in cardiomyocytes. J. Biol. Chem. 2017, 292, 7105–7114. [Google Scholar] [CrossRef] [Green Version]
- Ahsan, S.; Ahmed, S.; Ahmed, S.D.; Nauman, K. Status of serum adiponectin related to insulin resistance in prediabetics. J. Pak. Med. Assoc. 2014, 64, 184–188. [Google Scholar]
- Molinaro, A.; Caesar, R.; Holm, L.M.; Tremaroli, V.; Cani, P.D.; Bäckhed, F. Host-microbiota interaction induces bi-phasic inflammation and glucose intolerance in mice. Mol. Metab. 2017, 6, 1371–1380. [Google Scholar] [CrossRef]
- Vitezova, A.; Zillikens, M.C.; Van Herpt, T.W.; Sijbrands, E.J.; Hofman, A.; Uitterlinden, A.G.; Franco, O.H.; Kiefte-de Jong, J.C. Vitamin D status and metabolic syndrome in the elderly: The Rotterdam Study. Eur. J. Endocrinol. 2015, 172, 327–335. [Google Scholar] [CrossRef] [Green Version]
- Mousa, A.; Naderpoor, N.; De Courten, M.P.J.; Scragg, R.; De Courten, B. 25-hydroxyvitamin D is associated with adiposity and cardiometabolic risk factors in a predominantly vitamin D-deficient and overweight/obese but otherwise healthy cohort. J. Steroid. Biochem. Mol. Biol. 2017, 173, 258–264. [Google Scholar] [CrossRef]
- Schmitt, E.B.; Nahas-Neto, J.; Bueloni-Dias, F.; Ferreira Poloni, P.; Lera Orsatti, C.; Aguiar Petri Nahas, E. Vitamin D deficiency is associated with metabolic syndrome in postmenopusal women. Maturitas 2018, 107, 97–102. [Google Scholar] [CrossRef] [Green Version]
- Amer, M.; Qayyum, R. Relationship between 25-hydroxyvitamin D and all-cause and cardiovascular disease mortality. Am. J. Med. 2013, 126, 509–514. [Google Scholar] [CrossRef]
- Pilz, S.; Gaksch, M.; Kienreich, K.; Grϋbler, M.; Verheien, N.; Fahrleitner-Pammer, A.; Treiber, G.; Drechsler, C.; ó Hartaigh, B.; Obermayer-Pietsch, B.; et al. Effects of vitamin D on blood pressure and cardiovascular risk factors: A randomized controlled trial. Hypertension 2015, 65, 1195–1201. [Google Scholar] [CrossRef]
- Fallo, F.; Catena, C.; Camozzi, V.; Luisetto, G.; Cosma, C.; Plebani, M.; Lupia, M.; Tona, F.; Sechi, L.A. Low serum 25-hydroxyvitamin D levels are associated with left ventricular hypertrophy in arterial hypertension. Nutr. Metab. Cardiovasc. Dis. 2012, 22, 871–876. [Google Scholar] [CrossRef]
- Sechi, L.A.; Novello, M.; Colussi, G.; Di Fabio, A.; Chiuch, A.; Nadalini, E.; Casanova-Borca, A.; Uzzau, A.; Catena, C. Relationship of plasma renin with a prothrombotic state in hypertension: Relevance for organ damage. Am. J. Hypertens. 2008, 21, 1347–1353. [Google Scholar] [CrossRef] [Green Version]
- Williams, B.; Mancia, G.; Spiering, W.; Agabiti Rosei, E.; Azizi, M.; Burnier, M.; Clement, D.L.; Coca, A.; de Simone, G.; Dominiczak, A.; et al. 2018 ESH/ESC guidelines for the management of arterial hypertension: The task force for the management of arterial hypertension of the European Society of Cardiology and the European Society of Hypertension. J. Hypertens. 2018, 36, 1953–2041. [Google Scholar] [CrossRef] [Green Version]
- Catena, C.; Novello, M.; Dotto, L.; De Marchi, S.; Sechi, L.A. Serum lipoprotein(a) concentrations and alcohol consumption in hypertension: Possible relevance for cardiovascular damage. J. Hypertens. 2003, 21, 281–288. [Google Scholar] [CrossRef]
- Holick, M.F.; Bikley, N.C.; Bischoff-Ferrari, H.A.; Gordon, C.M.; Hanley, D.A.; Heaney, R.P.; Murad, M.H.; Weaver, C.M. Evaluation, treatment and prevention of vitamin D deficiency: An Endocrine Society Clinical Practice Guideline. J. Clin. Endocrinol. Metab. 2011, 96, 1911–1930. [Google Scholar] [CrossRef] [Green Version]
- Sechi, L.A.; Zingaro, L.; Catena, C.; Perin, A.; De Marchi, S.; Bartoli, S. Lipoprotein (a) and apolipoprotein(a) isoforms and proteinuria in patients with moderate renal failure. Kidney Int. 1999, 56, 1049–1057. [Google Scholar] [CrossRef] [Green Version]
- Sechi, L.A.; Catena, C.; Zingaro, L.; Melis, A.; De Marchi, S. Abnormalities of glucose metabolism in patients with early renal failure. Diabetes 2002, 51, 1226–1232. [Google Scholar] [CrossRef] [Green Version]
- American Diabetes Association. Diagnosis and classification of diabetes mellitus. Diabetes Care 2011, 34, S62–S69. [Google Scholar] [CrossRef] [Green Version]
- Grundy, S.M.; Cleeman, J.I.; Daniels, S.R.; Donato, K.A.; Eckel, R.H.; Franklin, B.A.; Gordon, D.J.; Krauss, R.M.; Savage, P.J.; Smith, S.C.; et al. Diagnosis and management of the metabolic syndrome. An American Heart Association/National Heart, Lung, and Blood Institute Scientific Statement. Circulation 2005, 112, 2735–2752. [Google Scholar] [CrossRef] [Green Version]
- Hurskainen, A.R.; Virtanen, J.K.; Tuomainen, T.P.; Nurmi, T.; Vontilainen, S. Association of serum 25-hydroxyvitamin D with type 2 diabetes and markers of insulin resistance in a general older population in Finland. Diabetes Metab. Res. Rev. 2012, 28, 418–423. [Google Scholar] [CrossRef]
- Chiu, K.C.; Chu, A.; Go, V.L.W.; Saad, M.F. Hypovitaminosis D is associated with insulin resistance and beta cell dysfunction. Am. J. Clin. Nutr. 2004, 79, 820–825. [Google Scholar] [CrossRef] [Green Version]
- Lee, M.; Ebert, J.R.; Kadakia, M.P.; Zhang, J.; Czerwinski, S.A. Inverse relationships between cardiometabolic risk factors and 25-hydroxyvitamin D in obese American children and adolescents. Am. J. Hum. Biol. 2016, 28, 736–742. [Google Scholar] [CrossRef]
- Poomthavorn, P.; Saowan, S.; Mahachoklertwattana, P.; Chailurkit, L.; Khailurkit, P. Vitamin D status and glucose homeostasis in obese children and adolescents in the tropics. Int. J. Obes. 2012, 36, 491–495. [Google Scholar] [CrossRef] [Green Version]
- Schöttker, B.; Herder, C.; Rothenbacher, D.; Perna, L.; Muller, H.; Brenner, H. Serum hydroxyvitamin D levels and incident diabetes mellitus type 2. A competing risk analysis in a large population-based cohort of older adults. Eur. J. Epidemiol. 2013, 28, 267–275. [Google Scholar] [CrossRef] [PubMed]
- Pilz, S.; Van Den Hurk, K.; Nijpels, G.; Stehouwer, C.D.; Van’t Riet, E.; Kienreich, K.; Tomaschitz, A.; Dekker, J.M. Vitamin D status, incident diabetes and prospective changes in glucose metabolism in older subjects: The Hoorn Study. Nutr. Metab. Cardiovasc. Dis. 2012, 22, 883–889. [Google Scholar] [CrossRef] [PubMed]
- Grϋbler, M.R.; Gaksch, M.; Kienreich, K.; Verheyen, N.; Schmid, J.; ó Hartaigh, B.; Richtig, G.; Scharnagl, H.; Meinitzer, A.; Fahrleitner-Pammer, A.; et al. Effects of vitamin D supplementation on glycated haemoglobin and fasting glucose levels in hypertensive patients: A randomized controlled trial. Diabetes Obes. Metab. 2016, 18, 1006–1012. [Google Scholar] [CrossRef] [PubMed]
- Scott, D.; Mousa, A.; Naderpoor, N.; De Courten, M.P.J.; Scragg, R.; De Courten, B. Vitamin D supplementation improves waist-to-hip ratio and fasting blood glucose in vitamin D deficient, overweight or obese Asians: A pilot secondary analysis of a randomized controlled trial. J. Steroid Biochem. Mol. Biol. 2019, 186, 136–141. [Google Scholar] [CrossRef]
- Poolsup, N.; Suksomboon, N.; Plordplong, N. Effect of vitamin D supplementation on insulin resistance and glycaemic control in prediabetics: A systematic review and meta-analysis. Diabet. Met. 2016, 33, 290–299. [Google Scholar]
- Hilger, J.; Friedel, A.; Herr, R.; Rausch, T.; Roos, F.; Wahl, D.A.; Pierroz, D.D.; Weber, P.; Hoffmann, K. A systematic review of vitamin D status in population worldwide. Br. J. Nutr. 2014, 111, 23–45. [Google Scholar] [CrossRef] [Green Version]
- Sciacqua, A.; Perticone, M.; Grillo, N.; Falbo, T.; Bencardino, G.; Angotti, E.; Arturi, F.; Parlato, G.; Sesti, G.; Perticone, F. Vitamin D and 1-hour post-load glucose in hypertensive patients. Cardiovasc. Diabetol. 2014, 13, 48. [Google Scholar] [CrossRef] [Green Version]
- Clark, S.A.; Stumpf, W.E.; Sar, M.; DeLuca, H.F.; Tanaka, Y. Target cells for 1,25 dihydroxyvitamin D3 in the pancreas. Cell. Tissue Res. 1980, 209, 515–520. [Google Scholar] [CrossRef]
- Wolden-Kirk, H.; Overbergh, L.; Christensen, H.T.; Brusgaard, K.; Mathieu, C. Vitamin D and diabetes: Its importance for beta cell and immune function. Mol. Cell. Endocrinol. 2011, 347, 106–120. [Google Scholar] [CrossRef]
- Sung, C.C.; Liao, M.T.; Lu, K.C.; Wu, C.C. Role of vitamin D in insulin resistance. J. Biomed. Biotechnol. 2012, 2012, 634195. [Google Scholar] [CrossRef]
- Maestro, B.; Campion, J.; Davila, N.; Calle, C. Stimulation by 1, 25 dihydroxyvitamin D3 of insulin receptor expression and insulin responsiveness for glucose transport in U-937 human promonocytic cells. Endocr. J. 2000, 47, 383–391. [Google Scholar] [CrossRef] [Green Version]
- Teergarden, D.; Donkin, S.S. Vitamin D: Emerging new roles in insulin sensitivity. Nutr. Res. Rev. 2009, 22, 82–92. [Google Scholar] [CrossRef] [Green Version]
- Lind, L.; Lithell, H.; Hvarfner, A.; Ljunghall, S. Indices of mineral metabolism in subjects with an impaired glucose tolerance. Exp. Clin. Endocrinol. 1990, 96, 109–112. [Google Scholar] [CrossRef]
- Liu, S.; Liu, Q. Personalized magnesium intervention to improve vitamin D metabolism: Applying a system approach for precision nutrition in large randomized trials of diverse populations. Am. J. Clin. Nutr. 2018, 108, 1159–1161. [Google Scholar] [CrossRef]
- Guerrero-Romero, F.; Rascon-Pacheco, R.A.; Rodriguez-Moran, M.; Escobedo de la Pena, J.; Wacher, N. Hypomagnesemia and risk for metabolic glucose disorders: A 10-year follow-up study. Eur. J. Clin. Invest. 2008, 38, 389–396. [Google Scholar] [CrossRef]


| Variables | All Patients | 25(OH)D | 25(OH)D | 25(OH)D | p |
|---|---|---|---|---|---|
| (n = 187) | <21 ng/mL | 21–29 ng/mL | ≥30 ng/mL | ||
| (n = 62) | (n = 45) | (n = 80) | |||
| Clinical characteristics | |||||
| Age, year | 50 ± 13 | 54 ± 12 | 52 ± 13 | 47 ± 11 | 0.001 |
| Males, n (%) | 106 (57) | 29 (52) | 27 (63) | 44 (54) | 0.526 |
| BMI, kg/m2 | 28.0 ± 5.1 | 28.7 ± 5.6 | 28.1 ± 4.4 | 27.5 ± 5.2 | 0.394 |
| Heart rate, bpm | 71 ± 12 | 74 ± 12 | 69 ± 13 | 71 ± 12 | 0.931 |
| Systolic BP, mm Hg | 149 ± 19 | 155 ± 21 | 150 ± 20 | 146 ± 17 | 0.038 |
| Diastolic BP, mm Hg | 93 ± 12 | 93 ± 12 | 94 ± 14 | 93 ± 12 | 0.931 |
| Duration of hypertension, y | 7 ± 9 | 10 ± 10 | 7 ± 8 | 6 ± 8 | 0.126 |
| Antihypertensive Tx, n (%) | 107 (57) | 36 (64) | 26 (60) | 43 (53) | 0.404 |
| Alcohol intake, g/day | 9 ± 19 | 7 ± 14 | 14 ± 25 | 8 ± 17 | 0.336 |
| Smokers, n (%) | 44 (23) | 15 (27) | 11 (26) | 17 (21) | 0.704 |
| Physically active, n (%) | 37 (20) | 11 (20) | 11 (26) | 15 (18) | 0.638 |
| Metabolic syndrome, n (%) | 68 (36) | 29 (52) | 17 (39) | 17 (21) | 0.001 |
| Season | 0.021 | ||||
| Spring, n (%) | 57 (30) | 22 (35) | 14 (31) | 21 (26) | 0.492 |
| Summer, n (%) | 26 (14) | 2 (4) | 6 (14) | 18 (69) | 0.004 |
| Autumn, n (%) | 46 (25) | 15 (27) | 8 (19) | 23 (50) | 0.391 |
| Winter, n (%) | 58 (31) | 22 (30) | 17 (35) | 19 (35) | 0.173 |
| Summer/autumn | 72 (38) | 17 (27) | 14 (31) | 41 (51) | 0.008 |
| Biochemical variables | |||||
| Serum creatinine, mg/dL | 0.93 ± 0.23 | 0.94 ± 0.31 | 1.01 ± 0.25 | 0.99 ± 0.26 | 0.274 |
| GFR, mL/min. 1.73 m2 | 99 ± 26 | 92 ± 26 | 101 ± 26 | 100 ± 26 | 0.124 |
| Fasting glucose, mg/dL | 91 ± 13 | 92 ± 14 | 95 ± 18 | 88 ± 9 | 0.031 |
| Fasting insulin, µUI/mL | 7.5 (4.2–11.8) | 9.40 (4.6–13.1) | 7.3 (3.7–12.2) | 7.0 (4.1–10.0) | 0.478 |
| C-peptide, ng/dL | 1.89 (1.35–2.63) | 1.99 (1.47–2.84) | 1.97 (1.40–2.77) | 1.74 (1.21–2.49) | 0.097 |
| HOMA index | 1.64 (0.86–2.68) | 1.97 (1.00–1.77) | 1.58 (0.76–3.28) | 1.51 (0.86–2.29) | 0.368 |
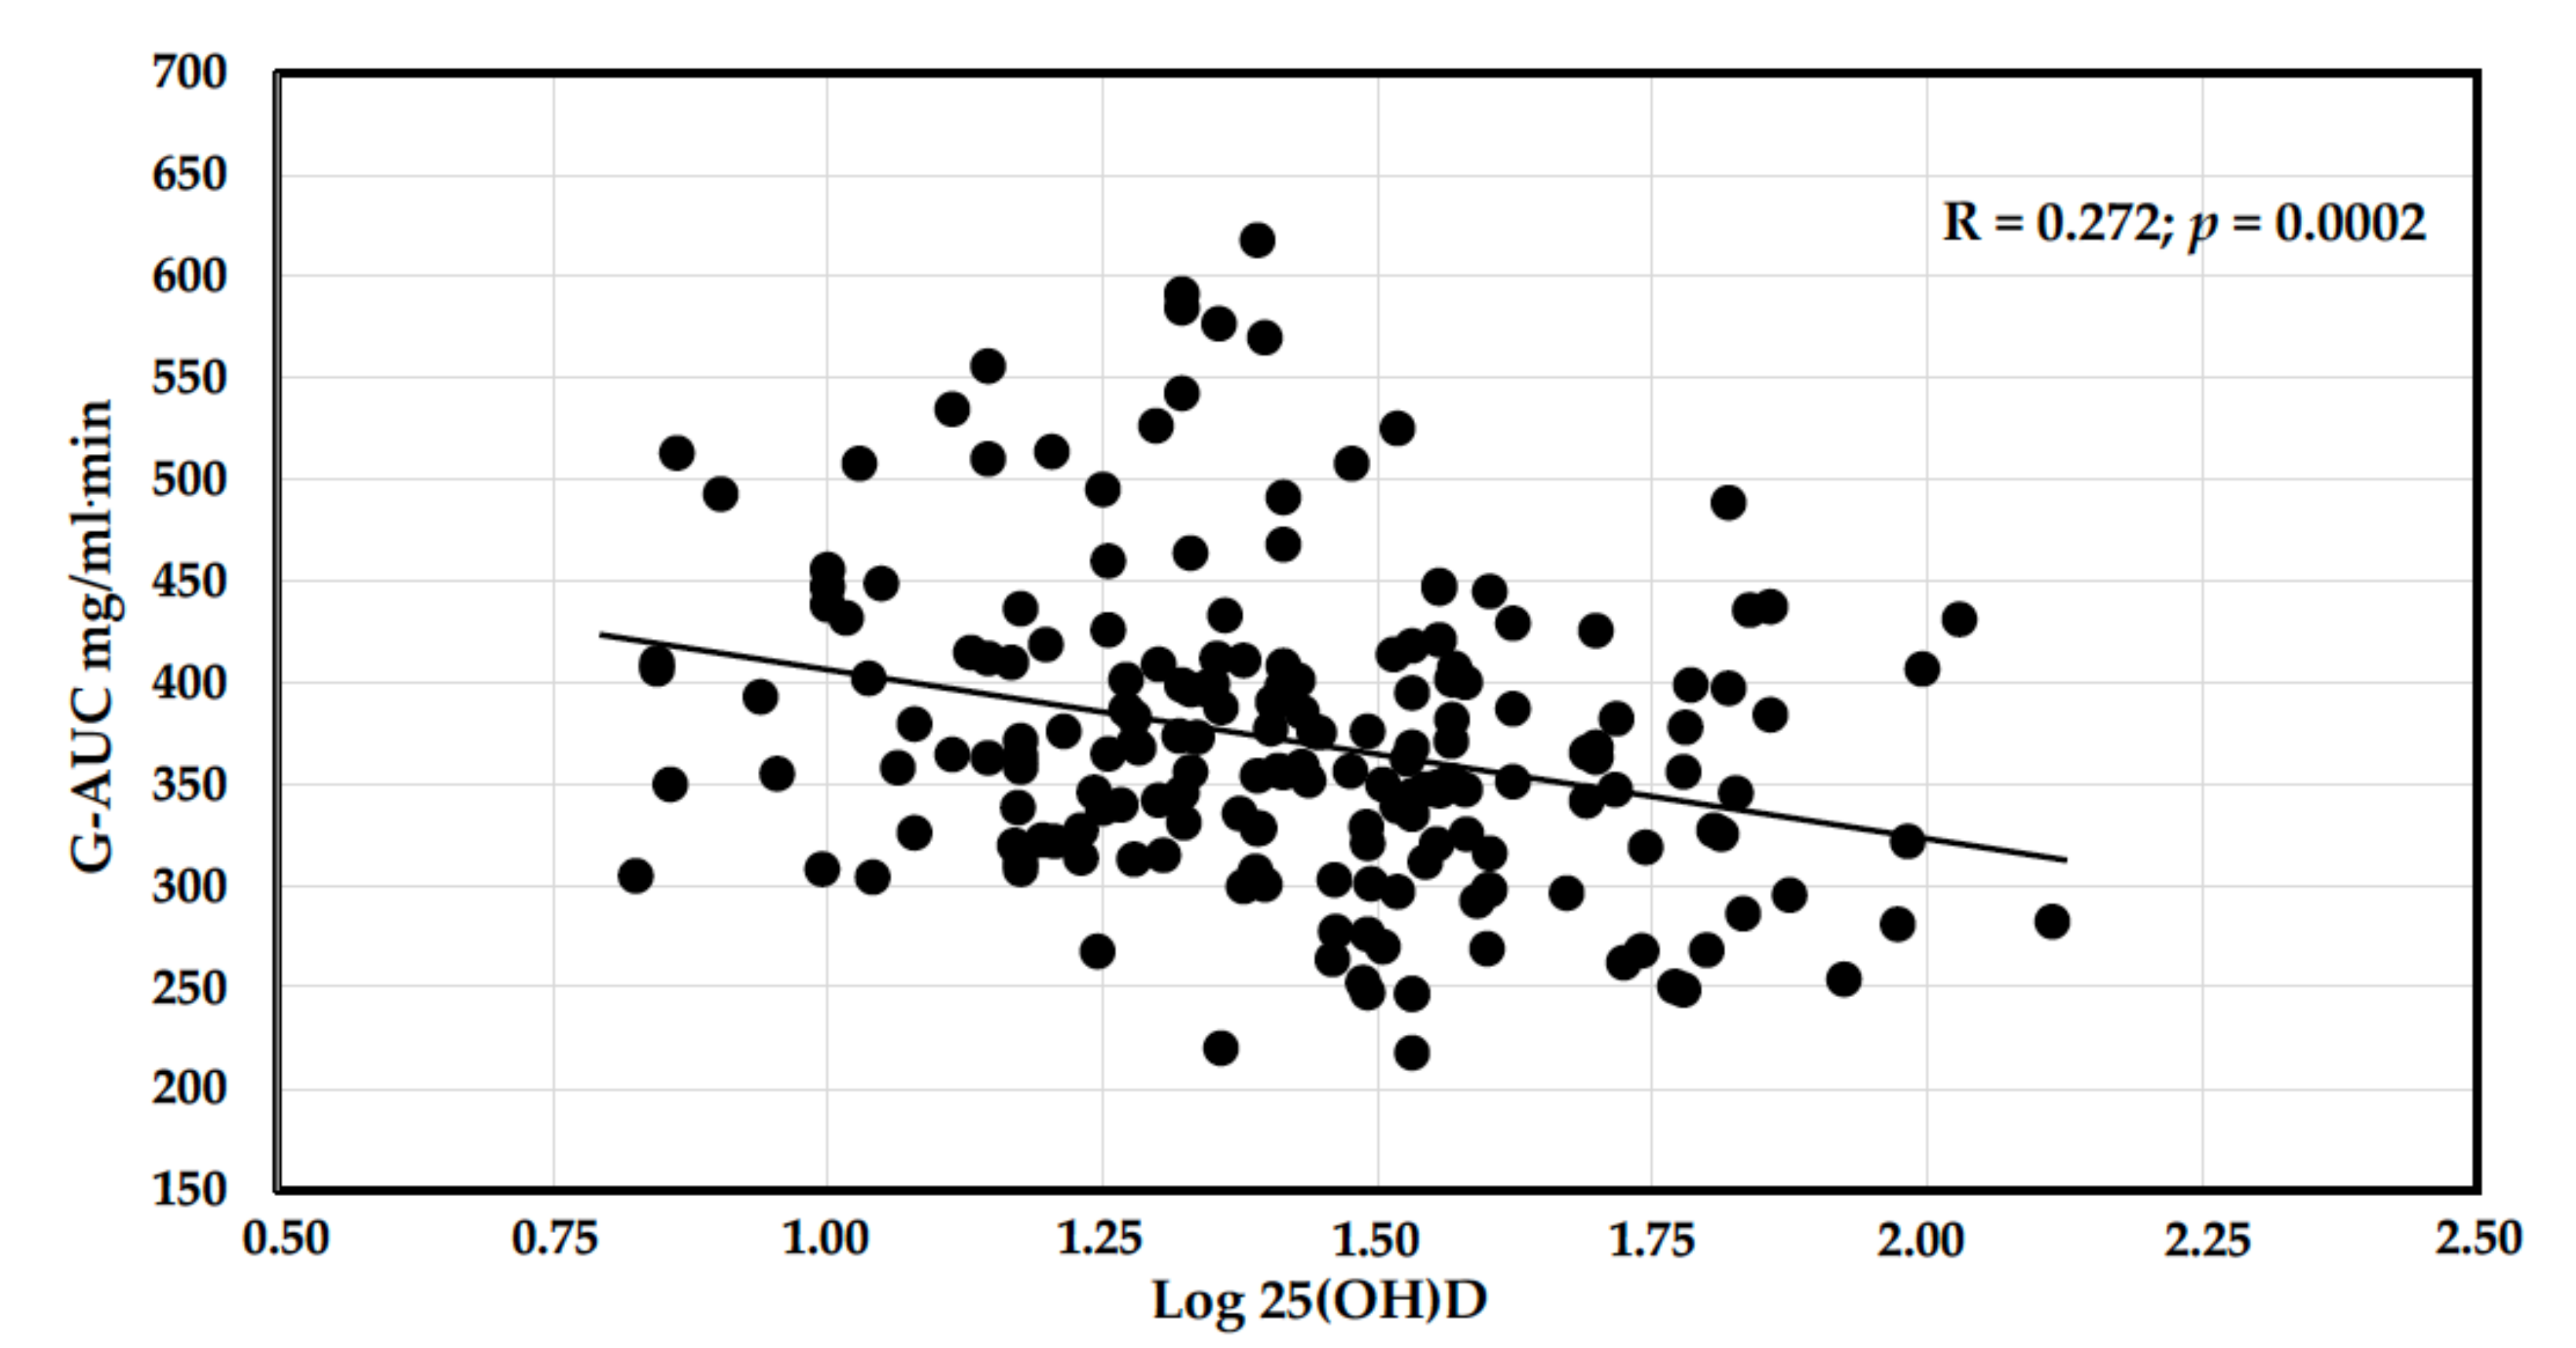
| G-AUC, mg/dL·min | 373 ± 76 | 393 ± 68 | 397 ± 92 | 348 ± 66 | <0.001 |
| G-120, mg/dl | 120 ± 45 | 131 ± 47 | 132 ± 60 | 107 ± 29 | 0.001 |
| I-AUC, µUI/mL·min | 133 (91–200) | 141 (99–220) | 162 (107–242) | 114 (87–158) | 0.039 |
| Triglycerides, mg/dL | 118 ± 66 | 130 ± 82 | 120 ± 60 | 105 ± 52 | 0.076 |
| Cholesterol, mg/dL | 200 ± 41 | 204 ± 42 | 197 ± 46 | 197 ± 40 | 0.530 |
| HDL cholesterol, mg/dL | 56 ± 17 | 52 ± 14 | 55 ± 15 | 59 ± 18 | 0.049 |
| LDL cholesterol, mg/dL | 120 ± 36 | 128 ± 38 | 117 ± 38 | 117 ± 34 | 0.245 |
| 25(OH)D, mg/mL | 26.0 (17.9–37.0) | 15.0 (11.2–18.0) | 24.6 (22.5–26.0) | 39.9 (34.0–60.0) | <0.001 |
| 1,25(OH)D, pg/mL | 81 ± 52 | 61.4 ± 44.3 | 65.6 ± 38.3 | 104.7 ± 53.6 | <0.001 |
| PTH, pg/mL | 61 (43–76) | 67 (59–86) | 59 (47–77) | 54 (39–70) | <0.001 |
| Calcium, mg/dL | 9.2 ± 0.5 | 9.3 ± 0.4 | 9.2 ± 0.5 | 9.1 ± 0.5 | 0.086 |
| Magnesium, mmol/L | 0.85 ± 0.09 | 0.85 ± 0.10 | 0.84 ± 0.08 | 0.85 ± 0.08 | 0.881 |
| Variables | NGT | IGT | p |
|---|---|---|---|
| (n = 143) | (n = 45) | ||
| Clinical characteristics | |||
| Age, year | 49 ± 12 | 54 ± 12 | 0.009 |
| Males, n (%) | 75 (52) | 31 (69) | 0.077 |
| BMI, kg/m2 | 27.5 ± 5.3 | 29.8 ± 4.0 | 0.007 |
| Heart rate, bpm | 70 ± 12 | 73 ± 12 | 0.275 |
| Systolic BP, mm Hg | 148 ± 17 | 154 ± 18 | 0.061 |
| Diastolic BP, mm Hg | 92 ± 12 | 95 ± 11 | 0.210 |
| Duration of hypertension, year | 7 ± 8 | 9 ± 9 | 0.119 |
| Antihypertensive Tx, n (%) | 80 (56) | 27 (60) | 0.631 |
| Alcohol intake, g/day | 8 ± 16 | 14 ± 24 | 0.061 |
| Smokers, n (%) | 35 (24) | 9 (20) | 0.536 |
| Physically active, n (%) | 28 (20) | 9 (20) | 0.951 |
| Metabolic syndrome, n (%) | 39 (27) | 29 (64) | <0.001 |
| Biochemical variables | |||
| Serum creatinine, mg/dL | 0.92 ± 0.21 | 0.96 ± 0.27 | 0.265 |
| GFR, ml/min. 1.73 m2 | 98 ± 26 | 96 ± 26 | 0.645 |
| Fasting glucose, mg/dL | 88 ± 9 | 100 ± 18 | <0.001 |
| Fasting insulin, µUI/mL | 7.0 (4.0–10.6) | 11.0 (5.2–14.9) | <0.001 |
| C-peptide, ng/dL | 1.85 (1.21–2.49) | 2.44 (1.70–2.91) | 0.017 |
| HOMA index | 1.51 (0.84–2.29) | 2.79 (1.34–4.19) | <0.001 |
| G-AUC, mg/dL·min | 344 ± 53 | 464 ± 67 | <0.001 |
| G-120, mg/dL | 102 ± 21 | 178 ± 52 | <0.001 |
| I-AUC, µUI/mL·min | 105 (88–119) | 154 (147–193) | <0.001 |
| Triglycerides, mg/dL | 113 ± 68 | 134 ± 60 | 0.064 |
| Cholesterol, mg/dL | 199 ± 41 | 201 ± 43 | 0.825 |
| HDL cholesterol, mg/dL | 58 ± 17 | 50 ± 13 | 0.010 |
| LDL cholesterol, mg/dL | 119 ± 36 | 122 ± 38 | 0.636 |
| 25(OH)D, mg/mL | 29.0 (19.0–38.8) | 21.0 (14.0–26.8) | <0.001 |
| PTH, pg/mL | 60 (42–74) | 68 (48–82) | 0.569 |
| Calcium, mg/dL | 9.1 ± 0.5 | 9.3 ± 0.4 | 0.047 |
| Magnesium, mmol/L | 0.85 ± 0.08 | 0.84 ± 0.11 | 0.507 |
| Variables | r | p | Variables | r | p |
|---|---|---|---|---|---|
| Age | −0.255 | 0.001 | HOMA index | −0.118 | 0.116 |
| Body mass index | −0.065 | 0.377 | G-AUC | −0.272 | <0.001 |
| Systolic blood pressure | −0.167 | 0.021 | G-120 | −0.222 | 0.002 |
| Diastolic blood pressure | −0.012 | 0.866 | I-AUC | −0.133 | 0.079 |
| Duration hypertension | −0.117 | 0.117 | Triglycerides | −0.180 | 0.014 |
| Alcohol intake | −0.048 | 0.535 | Total cholesterol | −0.121 | 0.100 |
| GFR | 0.005 | 0.942 | HDL cholesterol | 0.110 | 0.136 |
| Fasting glucose | −0.215 | 0.003 | LDL cholesterol | −0.111 | 0.134 |
| Fasting insulin | −0.076 | 0.306 | PTH | −0.310 | <0.001 |
| C-peptide | −0.194 | 0.010 | Calcium | −0.168 | 0.022 |
| Fasting Glucose | G-AUC | G-120 | ||||
|---|---|---|---|---|---|---|
| r | p | r | p | r | p | |
| Clinical characteristics | ||||||
| Age | 0.299 | <0.001 | 0.253 | <0.001 | 0.277 | <0.001 |
| Body mass index | 0.250 | 0.001 | 0.279 | <0.001 | 0.231 | 0.001 |
| Systolic blood pressure | 0.101 | 0.172 | 0.296 | <0.001 | 0.195 | 0.008 |
| Diastolic blood pressure | −0.024 | 0.747 | 0.101 | 0.170 | 0.036 | 0.623 |
| Duration of hypertension | 0.149 | 0.049 | 0.240 | 0.001 | 0.249 | 0.001 |
| Alcohol intake | 0.265 | <0.001 | 0.301 | <0.001 | 0.122 | 0.113 |
| Biochemical variables | ||||||
| GFR | −0.021 | 0.779 | −0.046 | 0.532 | −0.073 | 0.323 |
| Fasting insulin | 0.372 | <0.001 | 0.264 | <0.001 | 0.226 | 0.002 |
| C-peptide | 0.404 | <0.001 | 0.252 | 0.001 | 0.239 | 0.002 |
| I-AUC | 0.134 | 0.078 | 0.384 | <0.001 | 0.267 | <0.001 |
| Triglycerides | 0.172 | 0.019 | 0.240 | 0.001 | 0.191 | 0.009 |
| Total cholesterol | 0.153 | 0.037 | 0.127 | 0.083 | 0.017 | 0.822 |
| HDL cholesterol | −0.133 | 0.073 | −0.140 | 0.058 | −0.187 | 0.011 |
| LDL cholesterol | 0.155 | 0.036 | 0.099 | 0.183 | 0.009 | 0.903 |
| 25(OH)D | −0.215 | 0.003 | −0.267 | <0.001 | −0.222 | 0.002 |
| 1,25(OH)D | −0.025 | 0.808 | 0.008 | 0.938 | −0.100 | 0.325 |
| PTH | 0.125 | 0.094 | 0.190 | 0.011 | 0.135 | 0.070 |
| Calcium | 0.212 | 0.004 | 0.232 | 0.002 | 0.093 | 0.207 |
| Fasting Glucose | G-AUC | G-120 | ||||||
|---|---|---|---|---|---|---|---|---|
| β | p | β | p | β | p | |||
| Age | 0.229 | 0.001 | Age | 0.108 | 0.145 | Age | 0.223 | 0.009 |
| Body mass index | 0.126 | 0.084 | Male gender | 0.125 | 0.093 | Body mass index | 0.165 | 0.037 |
| Male gender | 0.128 | 0.067 | Body mass index | 0.161 | 0.032 | Log insulin | 0.079 | 0.218 |
| Alcohol intake | 0.202 | 0.004 | Alcohol intake | 0.212 | 0.005 | Log 25(OH)D | 0.172 | 0.025 |
| Log insulin | 0.271 | <0.001 | Log I-AUC | 0.245 | 0.001 | Log PTH | 0.002 | 0.983 |
| Log 25(OH)D | 0.079 | 0.243 | Log 25(OH)D | 0.155 | 0.047 | Calcium | 0.155 | 0.029 |
| Calcium | 0.261 | <0.001 | Log PTH | 0.018 | 0.806 | |||
| Summer/Autumn | 0.149 | 0.041 | ||||||
Publisher’s Note: MDPI stays neutral with regard to jurisdictional claims in published maps and institutional affiliations. |
© 2022 by the authors. Licensee MDPI, Basel, Switzerland. This article is an open access article distributed under the terms and conditions of the Creative Commons Attribution (CC BY) license (https://creativecommons.org/licenses/by/4.0/).
Share and Cite
Brosolo, G.; Da Porto, A.; Bulfone, L.; Scandolin, L.; Vacca, A.; Bertin, N.; Vivarelli, C.; Sechi, L.A.; Catena, C. Vitamin D Deficiency Is Associated with Glycometabolic Changes in Nondiabetic Patients with Arterial Hypertension. Nutrients 2022, 14, 311. https://doi.org/10.3390/nu14020311
Brosolo G, Da Porto A, Bulfone L, Scandolin L, Vacca A, Bertin N, Vivarelli C, Sechi LA, Catena C. Vitamin D Deficiency Is Associated with Glycometabolic Changes in Nondiabetic Patients with Arterial Hypertension. Nutrients. 2022; 14(2):311. https://doi.org/10.3390/nu14020311
Chicago/Turabian StyleBrosolo, Gabriele, Andrea Da Porto, Luca Bulfone, Laura Scandolin, Antonio Vacca, Nicole Bertin, Cinzia Vivarelli, Leonardo A. Sechi, and Cristiana Catena. 2022. "Vitamin D Deficiency Is Associated with Glycometabolic Changes in Nondiabetic Patients with Arterial Hypertension" Nutrients 14, no. 2: 311. https://doi.org/10.3390/nu14020311