
Healthy Lifestyle Is Associated with Reduced Mortality in Patients with Non-Alcoholic Fatty Liver Disease
Abstract
:1. Introduction
2. Methods
2.1. Study Participants
2.2. Definition of NAFLD
2.3. Assessment of Lifestyle Factors
2.4. Definition of Low-Risk Lifestyle
2.5. Assessment of Covariates
2.6. Outcome Ascertainment
2.7. Statistical Analysis
3. Results
4. Discussion
5. Conclusions
Supplementary Materials
Author Contributions
Funding
Informed Consent Statement
Data Availability Statement
Acknowledgments
Conflicts of Interest
References
- Wong, V.W.; Adams, L.A.; de Lédinghen, V.; Wong, G.L.; Sookoian, S. Noninvasive biomarkers in NAFLD and NASH—Current progress and future promise. Nat. Rev. Gastroenterol. Hepatol. 2018, 15, 461–478. [Google Scholar] [CrossRef] [PubMed]
- Chalasani, N.; Younossi, Z.; Lavine, J.E.; Diehl, A.M.; Brunt, E.M.; Cusi, K.; Charlton, M.; Sanyal, A.J. The diagnosis and management of non-alcoholic fatty liver disease: Practice Guideline by the American Association for the Study of Liver Diseases, American College of Gastroenterology, and the American Gastroenterological Association. Hepatology 2012, 55, 2005–2023. [Google Scholar] [CrossRef] [PubMed]
- Younossi, Z.M.; Otgonsuren, M.; Henry, L.; Venkatesan, C.; Mishra, A.; Erario, M.; Hunt, S. Association of nonalcoholic fatty liver disease (NAFLD) with hepatocellular carcinoma (HCC) in the United States from 2004 to 2009. Hepatology 2015, 62, 1723–1730. [Google Scholar] [CrossRef] [PubMed]
- Kumar, R.; Priyadarshi, R.N.; Anand, U. Non-alcoholic Fatty Liver Disease: Growing Burden, Adverse Outcomes and Associations. J. Clin. Transl. Hepatol. 2020, 8, 76–86. [Google Scholar] [CrossRef] [PubMed]
- Dam-Larsen, S.; Franzmann, M.; Andersen, I.B.; Christoffersen, P.; Jensen, L.B.; Sørensen, T.I.; Becker, U.; Bendtsen, F. Long term prognosis of fatty liver: Risk of chronic liver disease and death. Gut 2004, 53, 750–755. [Google Scholar] [CrossRef]
- Hwang, Y.C.; Ahn, H.Y.; Park, S.W.; Park, C.Y. Nonalcoholic Fatty Liver Disease Associates With Increased Overall Mortality and Death from Cancer, Cardiovascular Disease, and Liver Disease in Women but Not Men. Clin. Gastroenterol. Hepatol. 2018, 16, 1131–1137.e5. [Google Scholar] [CrossRef]
- Kim, D.; Konyn, P.; Sandhu, K.K.; Dennis, B.B.; Cheung, A.C.; Ahmed, A. Metabolic dysfunction-associated fatty liver disease is associated with increased all-cause mortality in the United States. J. Hepatol. 2021, 75, 1284–1291. [Google Scholar] [CrossRef]
- Mantovani, A.; Scorletti, E.; Mosca, A.; Alisi, A.; Byrne, C.D.; Targher, G. Complications, morbidity and mortality of nonalcoholic fatty liver disease. Metabolism 2020, 111, 154170. [Google Scholar] [CrossRef]
- Stepanova, M.; Younossi, Z.M. Independent association between nonalcoholic fatty liver disease and cardiovascular disease in the US population. Clin. Gastroenterol. Hepatol. 2012, 10, 646–650. [Google Scholar] [CrossRef]
- Kim, D.; Li, A.A.; Gadiparthi, C.; Khan, M.A.; Cholankeril, G.; Glenn, J.S.; Ahmed, A. Changing Trends in Etiology-Based Annual Mortality From Chronic Liver Disease, From 2007 Through 2016. Gastroenterology 2018, 155, 1154–1163.e1153. [Google Scholar] [CrossRef] [Green Version]
- Gadiparthi, C.; Spatz, M.; Greenberg, S.; Iqbal, U.; Kanna, S.; Satapathy, S.K.; Broder, A.; Ahmed, A. NAFLD Epidemiology, Emerging Pharmacotherapy, Liver Transplantation Implications and the Trends in the United States. J. Clin. Transl. Hepatol. 2020, 8, 215–221. [Google Scholar] [CrossRef]
- Prasoppokakorn, T.; Pitisuttithum, P.; Treeprasertsuk, S. Pharmacological Therapeutics: Current Trends for Metabolic Dysfunction-Associated Fatty Liver Disease (MAFLD). J. Clin. Transl. Hepatol. 2021, 9, 939–946. [Google Scholar] [CrossRef]
- Lange, N.F.; Radu, P.; Dufour, J.F. Prevention of NAFLD-associated HCC: Role of lifestyle and chemoprevention. J. Hepatol. 2021, 75, 1217–1227. [Google Scholar] [CrossRef]
- Song, C.; Lv, J.; Yu, C.; Zhu, M.; Yu, C.; Guo, Y.; Yang, L.; Chen, Y.; Chen, Z.; Jiang, T.; et al. Adherence to Healthy Lifestyle and Liver cancer in Chinese: A prospective cohort study of 0.5 million people. Br. J. Cancer 2022, 126, 815–821. [Google Scholar] [CrossRef]
- Bhaskaran, K.; Dos-Santos-Silva, I.; Leon, D.A.; Douglas, I.J.; Smeeth, L. Association of BMI with overall and cause-specific mortality: A population-based cohort study of 3·6 million adults in the UK. Lancet Diabetes Endocrinol. 2018, 6, 944–953. [Google Scholar] [CrossRef]
- Carter, B.D.; Abnet, C.C.; Feskanich, D.; Freedman, N.D.; Hartge, P.; Lewis, C.E.; Ockene, J.K.; Prentice, R.L.; Speizer, F.E.; Thun, M.J.; et al. Smoking and mortality--beyond established causes. N. Engl. J. Med. 2015, 372, 631–640. [Google Scholar] [CrossRef]
- Ekelund, U.; Steene-Johannessen, J.; Brown, W.J.; Fagerland, M.W.; Owen, N.; Powell, K.E.; Bauman, A.; Lee, I.M. Does physical activity attenuate, or even eliminate, the detrimental association of sitting time with mortality? A harmonised meta-analysis of data from more than 1 million men and women. Lancet 2016, 388, 1302–1310. [Google Scholar] [CrossRef]
- Orlich, M.J.; Singh, P.N.; Sabaté, J.; Jaceldo-Siegl, K.; Fan, J.; Knutsen, S.; Beeson, W.L.; Fraser, G.E. Vegetarian dietary patterns and mortality in Adventist Health Study 2. JAMA Intern Med. 2013, 173, 1230–1238. [Google Scholar] [CrossRef]
- Zhang, Y.B.; Chen, C.; Pan, X.F.; Guo, J.; Li, Y.; Franco, O.H.; Liu, G.; Pan, A. Associations of healthy lifestyle and socioeconomic status with mortality and incident cardiovascular disease: Two prospective cohort studies. BMJ 2021, 373, n604. [Google Scholar] [CrossRef]
- Kim, D.; Vazquez-Montesino, L.M.; Escober, J.A.; Fernandes, C.T.; Cholankeril, G.; Loomba, R.; Harrison, S.A.; Younossi, Z.M.; Ahmed, A. Low Thyroid Function in Nonalcoholic Fatty Liver Disease Is an Independent Predictor of All-Cause and Cardiovascular Mortality. Am. J. Gastroenterol. 2020, 115, 1496–1504. [Google Scholar] [CrossRef]
- Kim, D.; Kim, W.R.; Kim, H.J.; Therneau, T.M. Association between noninvasive fibrosis markers and mortality among adults with nonalcoholic fatty liver disease in the United States. Hepatology 2013, 57, 1357–1365. [Google Scholar] [CrossRef] [PubMed]
- National Center for Health Statistics. NHANES III Hepatic Steatosis Ultrasound Images Assessment Procedures Manual 2010 November. Available online: https://www.cdc.gov/nchs/data/nhanes/nhanes3/hepatic_steatosis_ultrasound_procedures_manual.pdf (accessed on 14 July 2022).
- Kennedy, E.T.; Ohls, J.; Carlson, S.; Fleming, K. The Healthy Eating Index: Design and applications. J. Am. Diet. Assoc. 1995, 95, 1103–1108. [Google Scholar] [CrossRef]
- Yoo, E.R.; Kim, D.; Vazquez-Montesino, L.M.; Escober, J.A.; Li, A.A.; Tighe, S.P.; Fernandes, C.T.; Cholankeril, G.; Ahmed, A. Diet quality and its association with nonalcoholic fatty liver disease and all-cause and cause-specific mortality. Liver Int. 2020, 40, 815–824. [Google Scholar] [CrossRef] [PubMed]
- World Health Organization. Tackling NCDs: ‘Best Buys’ and Other Recommended Interventions for the Prevention and Control of Noncommunicable Diseases. 2017. Available online: https://apps.who.int/iris/bitstream/handle/10665/259232/WHO-NMH-NVI-17.9-eng.pdf?sequence=1&isAllowed=y (accessed on 26 October 2017).
- US Department of Agriculture, US Department of Health and Human Services. Dietary Guidelines for Americans, 2020–2025. 2020. Available online: www.dietaryguidelines.gov/sites/default/files/2020-12/Dietary_Guidelines_for_Americans_2020-2025.pdf (accessed on 1 December 2020).
- National Health Service. The Risks of Drinking Too Much. 2019. Available online: www.nhs.uk/live-well/alcohol-support/the-risks-of-drinking-too-much/ (accessed on 23 May 2022).
- US Centers for Disease Control and Prevention. Key Concepts about NHANES Survey Design. 2015. Available online: www.cdc.gov/nchs/tutorials/nhanes/SurveyDesign/SampleDesign/Info1.htm (accessed on 6 November 2015).
- Loef, M.; Walach, H. The combined effects of healthy lifestyle behaviors on all cause mortality: A systematic review and meta-analysis. Prev. Med. 2012, 55, 163–170. [Google Scholar] [CrossRef] [PubMed]
- Li, Y.; Schoufour, J.; Wang, D.D.; Dhana, K.; Pan, A.; Liu, X.; Song, M.; Liu, G.; Shin, H.J.; Sun, Q.; et al. Healthy lifestyle and life expectancy free of cancer, cardiovascular disease, and type 2 diabetes: Prospective cohort study. BMJ 2020, 368, l6669. [Google Scholar] [CrossRef] [PubMed]
- Lo, C.H.; Khalili, H.; Song, M.; Lochhead, P.; Burke, K.E.; Richter, J.M.; Giovannucci, E.L.; Chan, A.T.; Ananthakrishnan, A.N. Healthy Lifestyle Is Associated With Reduced Mortality in Patients With Inflammatory Bowel Diseases. Clin. Gastroenterol. Hepatol. 2021, 19, 87–95.e4. [Google Scholar] [CrossRef]
- Lee, I.; Kim, S.; Kang, H. Lifestyle Risk Factors and All-Cause and Cardiovascular Disease Mortality: Data from the Korean Longitudinal Study of Aging. Int. J. Environ. Res. Public Health 2019, 16, 3040. [Google Scholar] [CrossRef]
- Adams, L.A.; Anstee, Q.M.; Tilg, H.; Targher, G. Non-alcoholic fatty liver disease and its relationship with cardiovascular disease and other extrahepatic diseases. Gut 2017, 66, 1138–1153. [Google Scholar] [CrossRef]
- Tamakoshi, A.; Kawado, M.; Ozasa, K.; Tamakoshi, K.; Lin, Y.; Yagyu, K.; Kikuchi, S.; Hashimoto, S. Impact of smoking and other lifestyle factors on life expectancy among japanese: Findings from the Japan Collaborative Cohort (JACC) Study. J. Epidemiol. 2010, 20, 370–376. [Google Scholar] [CrossRef]
- Chudasama, Y.V.; Khunti, K.; Gillies, C.L.; Dhalwani, N.N.; Davies, M.J.; Yates, T.; Zaccardi, F. Healthy lifestyle and life expectancy in people with multimorbidity in the UK Biobank: A longitudinal cohort study. PLoS Med. 2020, 17, e1003332. [Google Scholar] [CrossRef]
- Ferrucci, L.; Izmirlian, G.; Leveille, S.; Phillips, C.L.; Corti, M.C.; Brock, D.B.; Guralnik, J.M. Smoking, physical activity, and active life expectancy. Am. J. Epidemiol. 1999, 149, 645–653. [Google Scholar] [CrossRef]
- Peeters, A.; Barendregt, J.J.; Willekens, F.; Mackenbach, J.P.; Al Mamun, A.; Bonneux, L. Obesity in adulthood and its consequences for life expectancy: A life-table analysis. Ann. Intern. Med. 2003, 138, 24–32. [Google Scholar] [CrossRef]


| Characteristics | Total Population | Unfavorable Lifestyle | Intermediate Lifestyle | Favorable Lifestyle | p Value |
|---|---|---|---|---|---|
| n = 9771 | n = 5300 | n = 2943 | n = 1528 | ||
| Mean age (years) | 42.86 ± 0.42 | 42.14 ± 0.44 | 43.87 ± 0.52 | 43.50 ± 0.83 | 0.012 |
| Gender (%) | <0.001 | ||||
| Male | 4366 (47.01) | 2854 (54.43) | 1116 (42.12) | 396 (30.65) | |
| Female | 5405 (52.99) | 2446 (45.57) | 1827 (57.88) | 1132 (69.35) | |
| Ethnicity (%) | <0.001 | ||||
| Non-Hispanic White | 3875 (77.55) | 2150 (79.93) | 1096 (74.87) | 629 (74.32) | |
| Non-Hispanic Black | 2766 (9.97) | 1585 (10.19) | 809 (10.63) | 372 (8.01) | |
| Mexican American | 2728 (4.87) | 1407 (4.44) | 897 (5.69) | 424 (4.84) | |
| Others | 402 (7.61) | 158 (5.44) | 141 (8.81) | 103 (12.83) | |
| Poverty status (%) | 0.007 | ||||
| Yes | 2185 (11.47) | 1239 (12.65) | 614 (9.70) | 332 (10.66) | |
| No | 7586 (88.53) | 4061 (87.35) | 2329 (90.30) | 1196 (89.34) | |
| Education | <0.001 | ||||
| Less than high school | 3517 (21.59) | 2094 (25.12) | 934 (17.91) | 489 (16.22) | |
| High school or above | 6254 (78.41) | 3206 (74.88) | 2009 (82.09) | 1039 (83.78) | |
| Body mass index (kg/m2) | 26.70 ± 0.14 | 27.07 ± 0.16 | 26.55 ± 0.21 | 25.76 ± 0.19 | <0.001 |
| Waist circumference (cm) * | 91.90 ± 0.30 | 93.64 ± 0.35 | 90.81 ± 0.52 | 87.93 ± 0.49 | <0.001 |
| Total cholesterol (mg/dL) * | 203.60 ± 0.83 | 203.80 ± 0.96 | 203.49 ± 1.44 | 203.14 ± 1.72 | 0.925 |
| HDL-cholesterol (mg/dL) * | 49.74 ± 0.38 | 47.89 ± 0.41 | 51.67 ± 0.55 | 52.60 ± 0.56 | <0.001 |
| Fasting glucose (mg/dL) * | 98.21 ± 0.55 | 98.63 ± 0.57 | 98.83 ± 0.92 | 95.70 ± 0.86 | 0.003 |
| Hemoglobin A1c (%) * | 5.36 ± 0.03 | 5.40 ± 0.02 | 5.33 ± 0.04 | 5.29 ± 0.04 | 0.005 |
| Alanine aminotransferase (IU/L) * | 17.52 ± 0.39 | 17.68 ± 0.40 | 17.76 ± 0.57 | 16.56 ± 0.53 | 0.027 |
| Aspartate aminotransferase (IU/L) * | 20.82 ± 0.14 | 20.46 ± 0.17 | 21.55 ± 0.28 | 20.71 ± 0.27 | 0.002 |
| Self-reported comorbidities (%) | |||||
| Hypertension | 3154 (27.48) | 1748 (28.11) | 934 (27.63) | 472 (25.06) | 0.298 |
| Diabetes | 1018 (7.06) | 576 (7.49) | 294 (6.94) | 148 (5.81) | 0.196 |
| CVD | 600 (4.42) | 376 (4.63) | 168 (5.14) | 56 (2.43) | 0.017 |
| Cancer | 537 (6.69) | 272 (6.19) | 179 (8.20) | 86 (5.68) | 0.049 |
| Emphysema or chronic bronchitis | 645 (7.24) | 430 (9.10) | 155 (5.83) | 60 (3.44) | <0.001 |
| NAFLD (%) | 3578 (34.17) | 1992 (35.27) | 1049 (33.71) | 537 (31.30) | 0.041 |
| Hepatic Steatosis | 0.069 | ||||
| Normal | 6193 (65.83) | 3308 (64.73) | 1894 (66.29) | 991 (68.70) | |
| Mild | 1344 (13.91) | 706 (13.75) | 409 (13.37) | 229 (15.44) | |
| Moderate | 1498 (13.54) | 855 (14.29) | 435 (13.81) | 208 (10.49) | |
| Severe | 736 (6.72) | 431 (7.22) | 205 (6.53) | 100 (5.37) |
| Healthy Lifestyle Category | NAFLD | No NAFLD | ||||
|---|---|---|---|---|---|---|
| Unfavorable Lifestyle | Intermediate Lifestyle | Favorable Lifestyle | Unfavorable Lifestyle | Intermediate Lifestyle | Favorable Lifestyle | |
| All-cause mortality | ||||||
| No. of total | 1992 (56.57%) | 1049 (28.62%) | 537 (14.81%) | 3308 (53.90%) | 1894 (29.22%) | 991 (16.88%) |
| No. of cases/ Person-years | 781/39498 | 353/21491 | 149/11289 | 962/69281 | 444/41278 | 243/21326 |
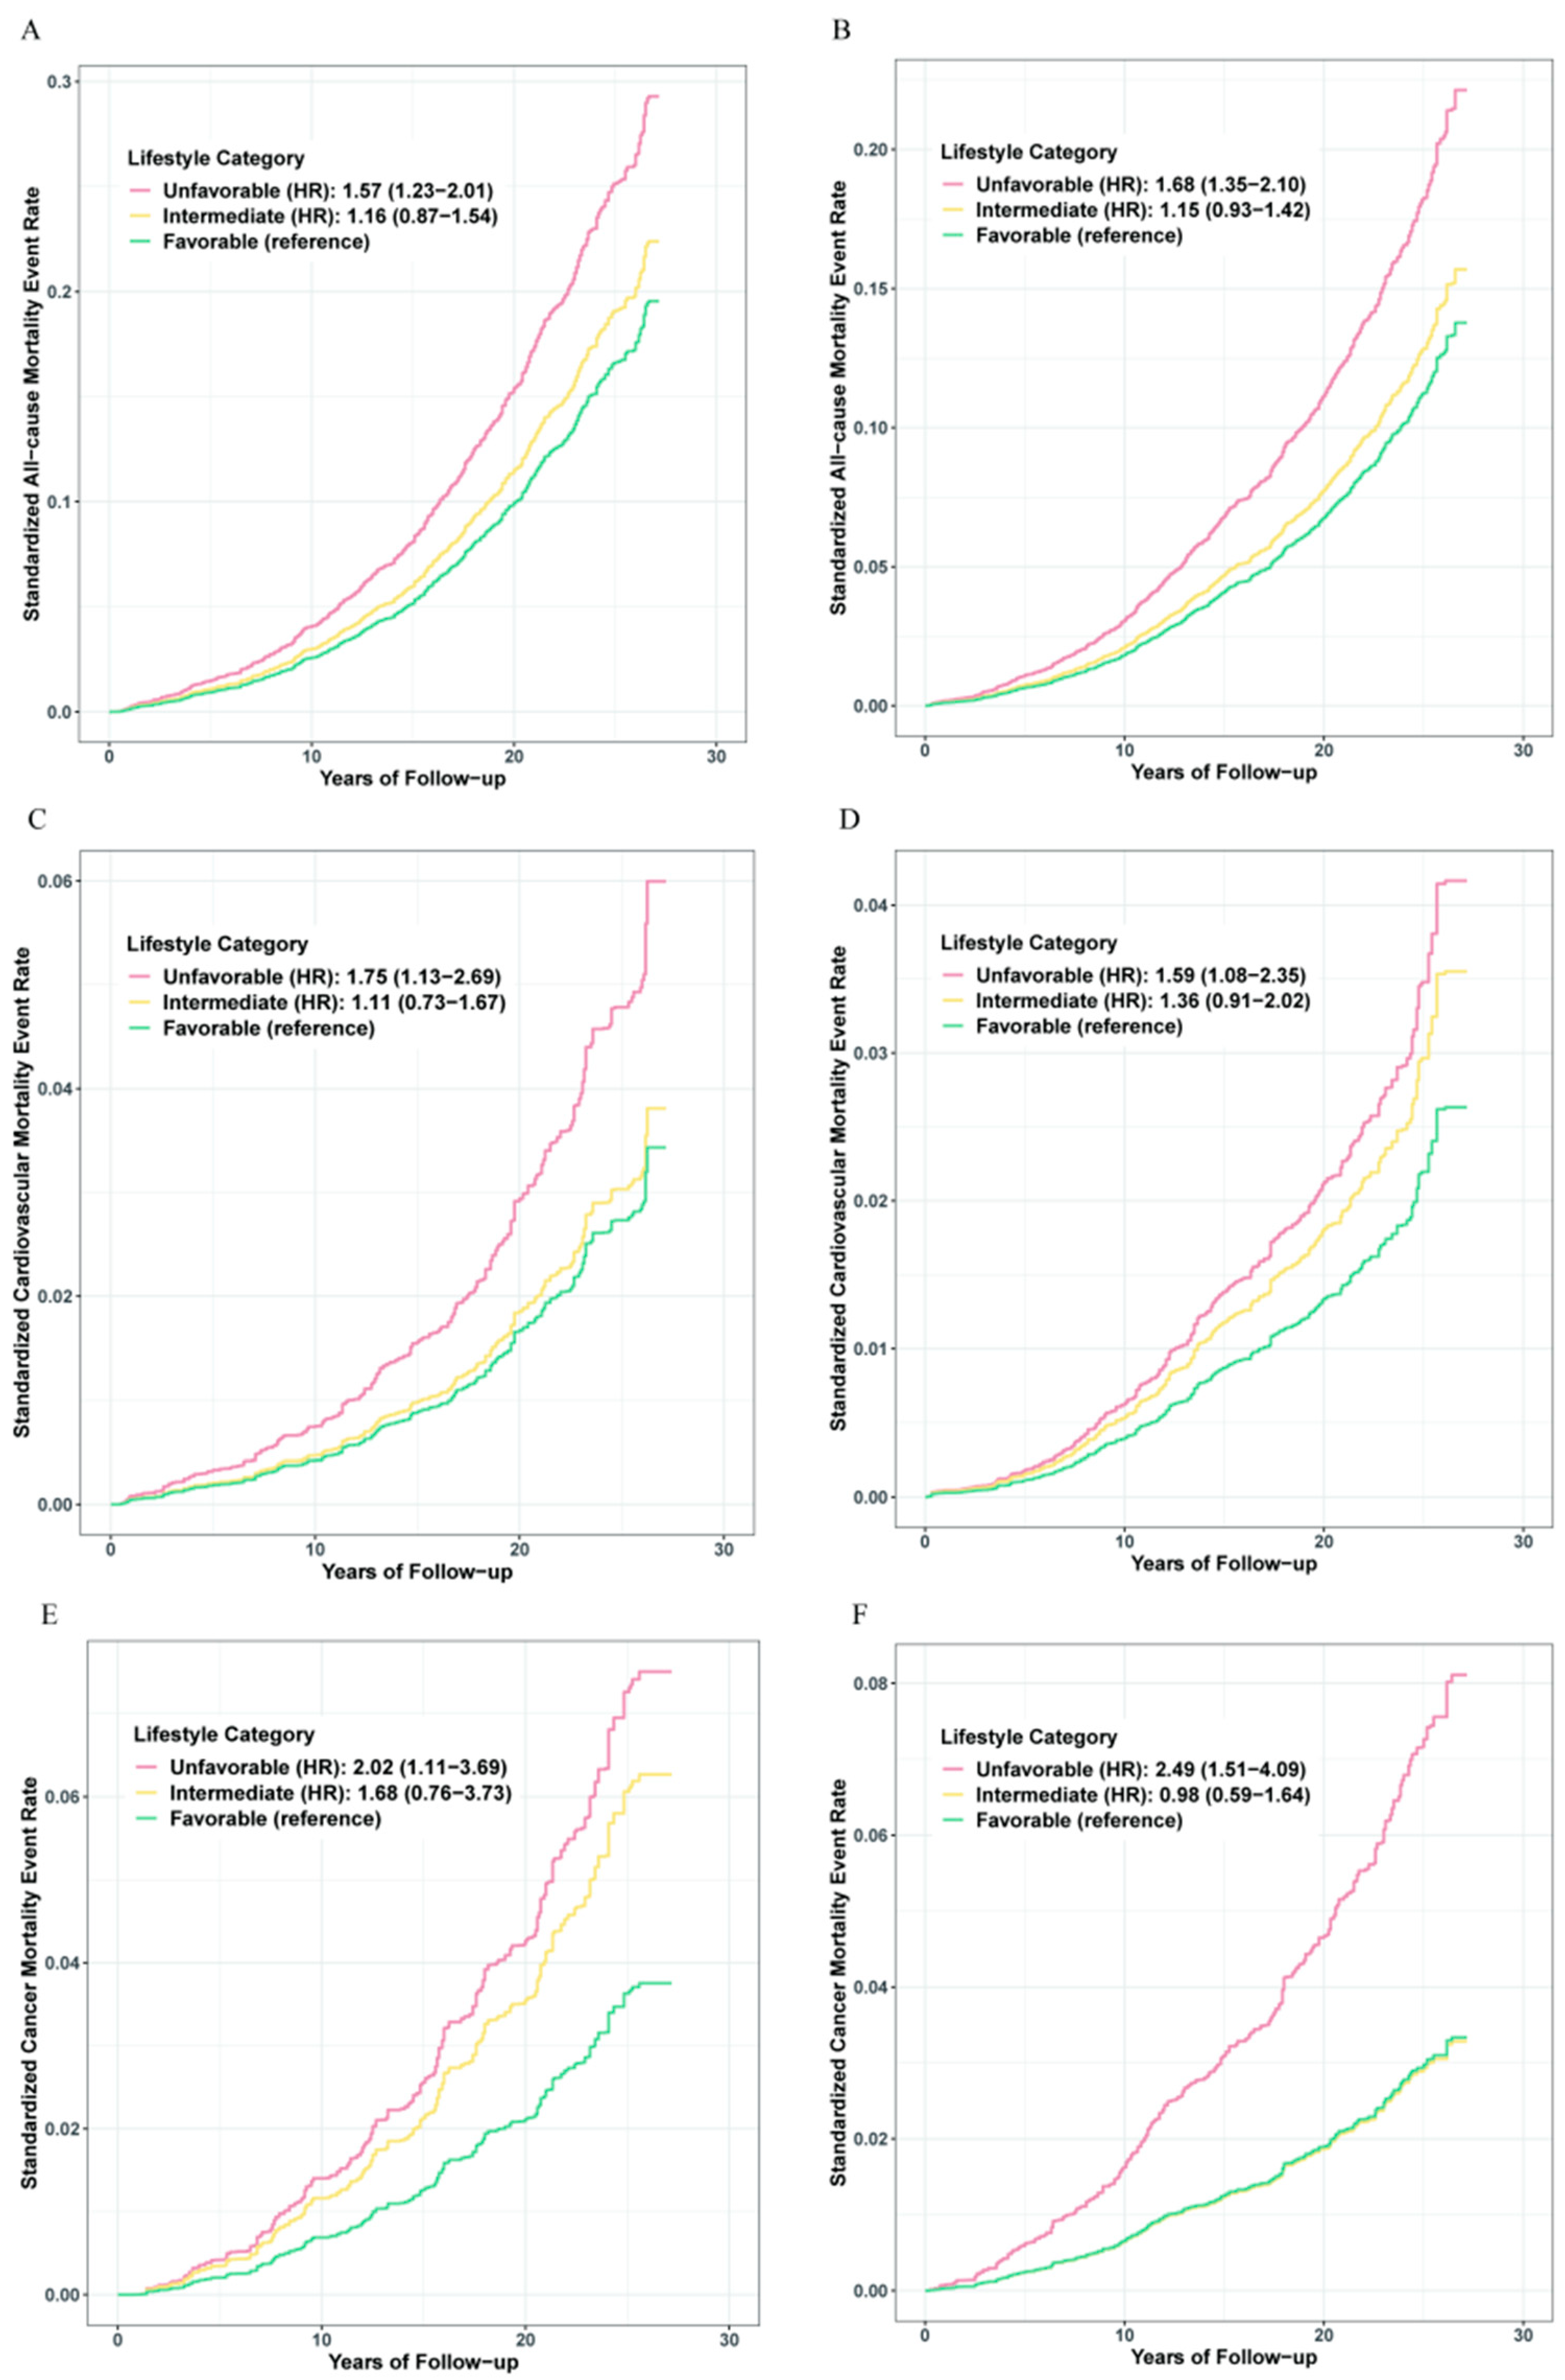
| HR (95% CI) a | 1 [Reference] | 0.73 (0.59–0.91) | 0.64 (0.50–0.81) | 1 [Reference] | 0.68 (0.57–0.82) | 0.60 (0.48–0.74) |
| p value a | 0.006 | <0.001 | <0.001 | <0.001 | ||
| p value for trend a | <0.001 | <0.001 | ||||
| Absolute risk, % (95% CI) | 39.21 (37.06–41.39) | 33.65 (30.81–36.61) | 27.75 (24.04–31.78) | 29.08 (27.54–30.67) | 23.44 (21.56–25.43) | 24.52 (21.90–27.35) |
| Incidence rate per 1000 PYs (95% CI) b | 13.37 (12.23–14.61) | 10.60 (9.39–11.96) | 8.51 (7.15–10.13) | 8.67 (7.98–9.41) | 6.16 (5.51–6.87) | 5.81 (5.03–6.70) |
| Numbers needed -20 years c | 22 | 16 | 27 | 21 | ||
| Cardiovascular mortality | ||||||
| No. of total | 1992 (56.57%) | 1049 (28.62%) | 537 (14.81%) | 3308 (53.90%) | 1894 (29.22%) | 991 (16.88%) |
| No. of cases/ Person years | 225/39498 | 95/21491 | 44/11289 | 248/69281 | 132/41278 | 63/21326 |
| HR (95% CI) a | 1 [Reference] | 0.63 (0.40–1.01) | 0.57 (0.37–0.88) | 1 [Reference] | 0.85 (0.57–1.28) | 0.63 (0.43–0.93) |
| p value a | 0.055 | 0.011 | 0.438 | 0.020 | ||
| p value for trend a | 0.018 | 0.045 | ||||
| Absolute risk, % (95% CI) | 11.30 (9.96–12.79) | 9.06 (7.42–11.00) | 8.19 (6.08–10.93) | 7.50 (6.63–8.46) | 6.97 (5.88–8.23) | 6.36 (4.96–8.11) |
| Incidence rate per 1000 PYs (95% CI) b | 3.05 (2.52–3.68) | 2.25 (1.76–2.89) | 2.02 (1.45–2.83) | 1.66 (1.37–1.99) | 1.30 (1.04–1.64) | 1.04 (0.77–1.41) |
| Numbers needed -20 years c | 90 | 77 | 311 | 125 | ||
| Cancer mortality | ||||||
| No. of total | 1992 (56.57%) | 1049 (28.62%) | 537 (14.81%) | 3308 (53.90%) | 1894 (29.22%) | 991 (16.88%) |
| No. of cases/ Person years | 178/39498 | 80/21491 | 31/11289 | 269/69281 | 89/41278 | 55/21326 |
| HR (95% CI) a | 1 [Reference] | 0.83 (0.54–1.27) | 0.49 (0.27–0.90) | 1 [Reference] | 0.39 (0.28–0.55) | 0.40 (0.24–0.66) |
| p value a | 0.394 | 0.022 | <0.001 | <0.001 | ||
| p value for trend a | 0.007 | <0.001 | ||||
| Absolute risk, % (95% CI) | 8.94 (7.74–10.30) | 7.63 (6.13–9.44) | 5.77 (4.02–8.18) | 8.13 (7.23–9.13) | 4.70 (3.81–5.78) | 5.55 (4.24–7.21) |
| Incidence rate per 1000 PYs (95% CI) b | 3.38 (2.84–4.04) | 2.68 (2.10–3.43) | 1.97 (1.35–2.87) | 2.70 (2.32–3.13) | 1.36 (1.08–1.72) | 1.43 (1.07–1.92) |
| Numbers needed -20 years c | 135 | 45 | 35 | 35 | ||
Publisher’s Note: MDPI stays neutral with regard to jurisdictional claims in published maps and institutional affiliations. |
© 2022 by the authors. Licensee MDPI, Basel, Switzerland. This article is an open access article distributed under the terms and conditions of the Creative Commons Attribution (CC BY) license (https://creativecommons.org/licenses/by/4.0/).
Share and Cite
Yu, C.; Gao, J.; Ge, X.; Wang, X.; Ding, Y.; Tian, T.; Xu, X.; Guo, W.; Wang, Q.; Ge, Z.; et al. Healthy Lifestyle Is Associated with Reduced Mortality in Patients with Non-Alcoholic Fatty Liver Disease. Nutrients 2022, 14, 3785. https://doi.org/10.3390/nu14183785
Yu C, Gao J, Ge X, Wang X, Ding Y, Tian T, Xu X, Guo W, Wang Q, Ge Z, et al. Healthy Lifestyle Is Associated with Reduced Mortality in Patients with Non-Alcoholic Fatty Liver Disease. Nutrients. 2022; 14(18):3785. https://doi.org/10.3390/nu14183785
Chicago/Turabian StyleYu, Chengxiao, Jiaxin Gao, Xinyuan Ge, Xiao Wang, Yuqing Ding, Ting Tian, Xin Xu, Wen Guo, Quanrongzi Wang, Zijun Ge, and et al. 2022. "Healthy Lifestyle Is Associated with Reduced Mortality in Patients with Non-Alcoholic Fatty Liver Disease" Nutrients 14, no. 18: 3785. https://doi.org/10.3390/nu14183785