
Differences in Nutritional Intake, Total Body Fat, and BMI Score between Twins
 , , ,
, , ,
Abstract
:1. Introduction
2. Materials and Methods
2.1. Source of Data
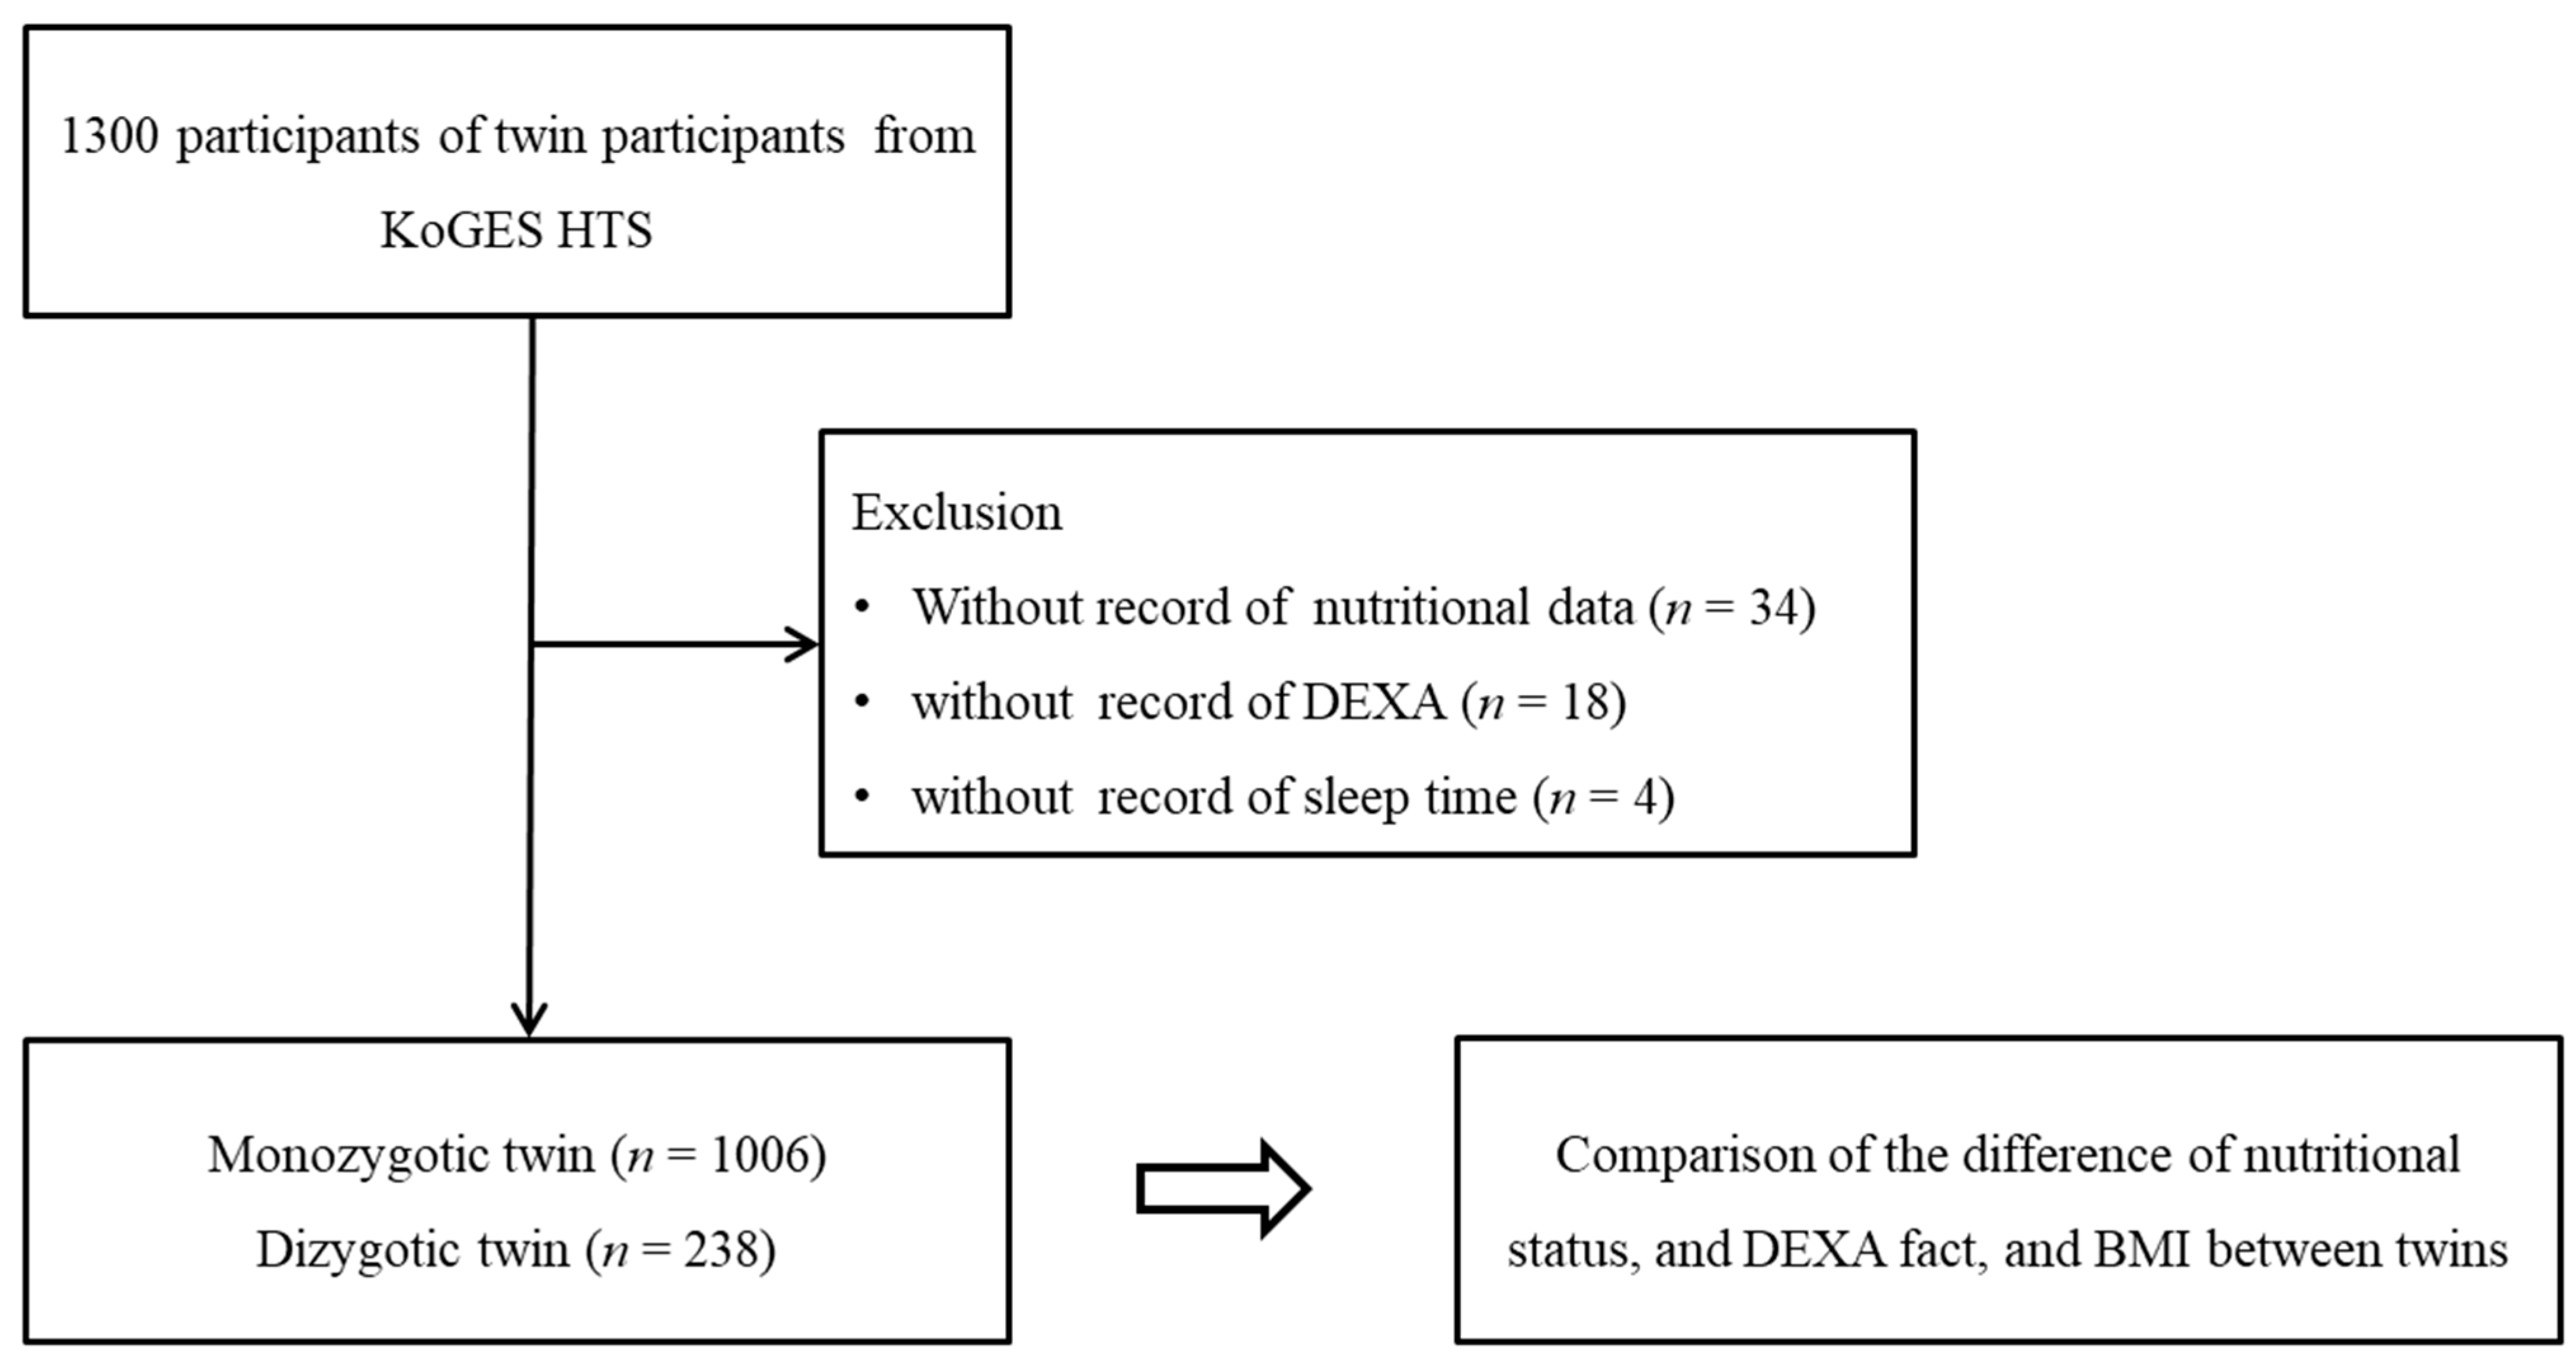
2.2. Participants Selection
2.3. Survey
2.4. Outcome
2.5. Statistical Analyses
3. Results
4. Discussion
5. Conclusions
Author Contributions
Funding
Institutional Review Board Statement
Informed Consent Statement
Data Availability Statement
Conflicts of Interest
References
- Ng, M.; Fleming, T.; Robinson, M.; Thomson, B.; Graetz, N.; Margono, C.; Mullany, E.C.; Biryukov, S.; Abbafati, C.; Abera, S.F.; et al. Global, regional, and national prevalence of overweight and obesity in children and adults during 1980–2013: A systematic analysis for the Global Burden of Disease Study. Lancet 2014, 384, 766–781. [Google Scholar] [CrossRef]
- Engin, A. The Definition and Prevalence of Obesity and Metabolic Syndrome. In Obesity and Lipotoxicity; Advances in Experimental Medicine and Biology; Springer: Cham, Switzerland, 2017; Volume 960, pp. 1–17. [Google Scholar] [CrossRef]
- Xi, Y.; Gao, W.; Zheng, K.; Lv, J.; Yu, C.; Wang, S.; Huang, T.; Sun, D.; Liao, C.; Pang, Y.; et al. The Roles of Genetic and Early-Life Environmental Factors in the Association Between Overweight or Obesity and Hypertension: A Population-Based Twin Study. Front. Endocrinol. 2021, 12, 743962. [Google Scholar] [CrossRef] [PubMed]
- Guo, J.; Li, X.; Yang, R.; Marseglia, A.; Dove, A.; Johnell, K.; Xu, W. Association of body mass index and its long-term changes with cardiometabolic diseases: A nationwide twin study. Clin. Nutr. 2021, 40, 5467–5474. [Google Scholar] [CrossRef] [PubMed]
- Naukkarinen, J.; Rissanen, A.; Kaprio, J.; Pietiläinen, K.H. Causes and consequences of obesity: The contribution of recent twin studies. Int. J. Obes. 2011, 36, 1017–1024. [Google Scholar] [CrossRef] [PubMed]
- Yu, K.; Yu, C.-G.; Yin, X.-Q.; Wang, Z.-W.; Wang, X.-B.; Wang, L.-L.; Guo, S.; An, Y.-X.; Zhao, D. Metabolites of gut microbiome are associated with glucose metabolism in non-diabetic obese adults: A Chinese monozygotic twin study. Diabetol. Metab. Syndr. 2021, 13, 106. [Google Scholar] [CrossRef]
- Meslier, V.; Laiola, M.; Roager, H.M.; De Filippis, F.; Roume, H.; Quinquis, B.; Giacco, R.; Mennella, I.; Ferracane, R.; Pons, N.; et al. Mediterranean diet intervention in overweight and obese subjects lowers plasma cholesterol and causes changes in the gut microbiome and metabolome independently of energy intake. Gut 2020, 69, 1258–1268. [Google Scholar] [CrossRef]
- Zheng, K.; Gao, W.; Cao, W.; Lv, J.; Yu, C.; Wang, S.; Huang, T.; Sun, D.; Liao, C.; Pang, Y.; et al. Education, income, and obesity: A nationwide Chinese twin study. Obesity 2022, 30, 931–942. [Google Scholar] [CrossRef]
- Kim, Y.; Han, B.-G. The KoGES group Cohort Profile: The Korean Genome and Epidemiology Study (KoGES) Consortium. Int. J. Epidemiol. 2016, 46, e20. [Google Scholar] [CrossRef]
- Kim, H.; Choe, S.-A.; Lee, S.J.; Sung, J. Causal relationship between the timing of menarche and young adult body mass index with consideration to a trend of consistently decreasing age at menarche. PLoS ONE 2021, 16, e0247757. [Google Scholar] [CrossRef]
- Sung, J.; Lee, K.; Song, Y.-M. Heritabilities of Alcohol Use Disorders Identification Test (AUDIT) scores and alcohol biomarkers in Koreans: The KoGES (Korean Genome Epi Study) and Healthy Twin Study. Drug Alcohol Depend. 2011, 113, 104–109. [Google Scholar] [CrossRef]
- Lee, S.J.; Lee, J.; Sung, J. Obesity and Bone Health Revisited: A Mendelian Randomization Study for Koreans. J. Bone Miner. Res. 2019, 34, 1058–1067. [Google Scholar] [CrossRef] [PubMed]
- Ahn, Y.; Kwon, E.; Shim, J.E.; Park, M.K.; Joo, Y.; Kimm, K.; Park, C.; Kim, D.H. Validation and reproducibility of food frequency questionnaire for Korean genome epidemiologic study. Eur. J. Clin. Nutr. 2007, 61, 1435–1441. [Google Scholar] [CrossRef] [PubMed]
- Kulyté, A.; Lundbäck, V.; Arner, P.; Strawbridge, R.J.; Dahlman, I. Shared genetic loci for body fat storage and adipocyte lipolysis in humans. Sci. Rep. 2022, 12, 3666. [Google Scholar] [CrossRef]
- Rask-Andersen, M.; Karlsson, T.; Ek, W.E.; Johansson, Å. Genome-wide association study of body fat distribution identifies adiposity loci and sex-specific genetic effects. Nat. Commun. 2019, 10, 339. [Google Scholar] [CrossRef] [PubMed]
- Singh, R.K.; Kumar, P.; Mahalingam, K. Molecular genetics of human obesity: A comprehensive review. Comptes Rendus. Biol. 2017, 340, 87–108. [Google Scholar] [CrossRef]
- Van Vliet-Ostaptchouk, J.V.; Hofker, M.H.; Van Der Schouw, Y.T.; Wijmenga, C.; Onland-Moret, N.C. Genetic variation in the hypothalamic pathways and its role on obesity. Obes. Rev. 2009, 10, 593–609. [Google Scholar] [CrossRef]
- Müller, M.J.; Bosy-Westphal, A.; Krawczak, M. Genetic studies of common types of obesity: A critique of the current use of phenotypes. Obes. Rev. 2010, 11, 612–618. [Google Scholar] [CrossRef]
- Haines, J.; Neumark-Sztainer, D. Prevention of obesity and eating disorders: A consideration of shared risk factors. Health Educ. Res. 2006, 21, 770–782. [Google Scholar] [CrossRef]
- Li, J.; Liu, H.; Beaty, T.H.; Chen, H.; Caballero, B.; Wang, Y. Heritability of Children’s Dietary Intakes: A Population-Based Twin Study in China. Twin Res. Hum. Genet. 2016, 19, 472–484. [Google Scholar] [CrossRef] [Green Version]
- Hasselbalch, A.L.; Heitmann, B.L.; Kyvik, K.O.; Sørensen, T.I.A. Studies of Twins Indicate That Genetics Influence Dietary Intake. J. Nutr. 2008, 138, 2406–2412. [Google Scholar] [CrossRef]
- Keskitalo, K.; Silventoinen, K.; Tuorila, H.; Perola, M.; Pietiläinen, K.H.; Rissanen, A.; Kaprio, J. Genetic and environmental contributions to food use patterns of young adult twins. Physiol. Behav. 2008, 93, 235–242. [Google Scholar] [CrossRef] [PubMed]
- Bree, M.B.V.D.; Eaves, L.J.; Dwyer, J.T. Genetic and environmental influences on eating patterns of twins aged ≥50 y. Am. J. Clin. Nutr. 1999, 70, 456–465. [Google Scholar] [CrossRef] [PubMed]
- Ling, C.; Rönn, T. Epigenetics in Human Obesity and Type 2 Diabetes. Cell Metab. 2019, 29, 1028–1044. [Google Scholar] [CrossRef] [PubMed]
- Ahlberg, R.; Garcia-Argibay, M.; Hirvikoski, T.; Boman, M.; Chen, Q.; Taylor, M.J.; Frans, E.; Bölte, S.; Larsson, H. Shared familial risk factors between autism spectrum disorder and obesity— a register-based familial coaggregation cohort study. J. Child Psychol. Psychiatry 2021, 63, 890–899. [Google Scholar] [CrossRef]
- Ji, M.; An, R. Parental Effects on Obesity, Smoking, and Drinking in Children and Adolescents: A Twin Study. J. Adolesc. Health 2022, 71, 196–203. [Google Scholar] [CrossRef]
- Sturm, R.; An, R. Obesity and economic environments. CA A Cancer J. Clin. 2014, 64, 337–350. [Google Scholar] [CrossRef]
- Brown, A.W.; Aslibekyan, S.; Bier, D.; da Silva, R.F.; Hoover, A.; Klurfeld, D.M.; Loken, E.; Mayo-Wilson, E.; Menachemi, N.; Pavela, G.; et al. Toward more rigorous and informative nutritional epidemiology: The rational space between dismissal and defense of the status quo. Crit. Rev. Food Sci. Nutr. 2021, 1–18. [Google Scholar] [CrossRef]
- Burrows, T.L.; Martin, R.J.; Collins, C.E. A Systematic Review of the Validity of Dietary Assessment Methods in Children when Compared with the Method of Doubly Labeled Water. J. Am. Diet. Assoc. 2010, 110, 1501–1510. [Google Scholar] [CrossRef]
- Freedman, L.S.; Commins, J.M.; Moler, J.E.; Willett, W.; Tinker, L.F.; Subar, A.F.; Spiegelman, D.; Rhodes, D.; Potischman, N.; Neuhouser, M.L.; et al. Pooled Results From 5 Validation Studies of Dietary Self-Report Instruments Using Recovery Biomarkers for Potassium and Sodium Intake. Am. J. Epidemiol. 2015, 181, 473–487. [Google Scholar] [CrossRef] [Green Version]
- Kipnis, V.; Midthune, D.; Freedman, L.; Bingham, S.; E Day, N.; Riboli, E.; Ferrari, P.; Carroll, R.J. Bias in dietary-report instruments and its implications for nutritional epidemiology. Public Health Nutr. 2002, 5, 915–923. [Google Scholar] [CrossRef]
- Prentice, R.L. Criteria for Acceptable Dietary Intake Biomarkers. Cancer Epidemiol. Biomark. Prev. 2022, 31, 1151–1153. [Google Scholar] [CrossRef] [PubMed]


| Characteristics | Total Participants | ||
|---|---|---|---|
| Monozygotic Twin | Dizygotic Twin | p-Value | |
| Age (years old, n, %) | 0.001 * | ||
| 20–24 | 6 (0.6) | 0 (0) | |
| 25–29 | 66 (6.6) | 4 (1.7) | |
| 30–34 | 342 (34) | 83 (34.9) | |
| 35–39 | 234 (23.3) | 65 (27.3) | |
| 40–44 | 132 (13.1) | 36 (15.1) | |
| 45–49 | 128 (12.7) | 18 (7.6) | |
| 50–54 | 80 (8) | 22 (9.2) | |
| 55–59 | 12 (1.2) | 10 (4.2) | |
| 60–64 | 4 (0.4) | 0 (0) | |
| 65+ | 2 (0.2) | 0 (0) | |
| Sex (n, %) | 0.023 * | ||
| Males | 368 (36.6) | 106 (44.5) | |
| Females | 638 (63.4) | 132 (55.5) | |
| Income (n, %) | 0.957 | ||
| <2 million (won) | 335 (33.3) | 78 (32.8) | |
| 2 to <3 million (won) | 266 (26.4) | 67 (28.2) | |
| 3 to <4 million (won) | 205 (20.4) | 48 (20.2) | |
| ≥4 million (won) | 200 (19.9) | 45 (18.9) | |
| Education (n, %) | 0.860 | ||
| Under high school | 117 (11.6) | 25 (10.5) | |
| Graduated from High school | 359 (35.7) | 87 (36.6) | |
| Commercial college-Dropped out of college | 119 (11.8) | 32 (13.4) | |
| Graduated from High school | 411 (40.9) | 94 (39.5) | |
| Marriage (n, %) | 0.398 | ||
| Unmarried | 233 (23.2) | 49 (20.6) | |
| Married | 706 (70.2) | 168 (70.6) | |
| Divorced or others | 67 (6.7) | 21 (8.8) | |
| Physical Activity | |||
| Hard (hour/1 week, mean, SD) | 3.1 (6.8) | 4.7 (9.8) | 0.021 * |
| Moderate (hour/1 week, mean, SD) | 5.9 (10.5) | 6.2 (10.2) | 0.652 |
| Walk (hour/1 week, mean, SD) | 6.2 (9.7) | 6.6 (10.1) | 0.546 |
| Sit (hour/1 week, mean, SD) | 40.5 (21.9) | 37.8 (20.9) | 0.086 |
| Obesity (n, %) | 0.260 | ||
| Underweight (BMI < 18.5) | 26 (2.6) | 5 (2.1) | |
| Normal (BMI ≥ 18.5 to <23) | 484 (48.1) | 109 (45.8) | |
| Overweight (BMI 23 to <25) | 212 (21.1) | 66 (27.7) | |
| Obese I (BMI ≥ 25 to <30) | 253 (25.1) | 52 (21.8) | |
| Obese II (BMI ≥ 30) | 31 (3.1) | 6 (2.5) | |
| Smoking status (n, %) | 0.112 | ||
| Nonsmoker | 662 (65.8) | 141 (59.2) | |
| Past smoker | 102 (10.1) | 33 (13.9) | |
| Current smoker | 242 (24.1) | 64 (26.9) | |
| Frequency of drinking alcohol (n, %) | 0.279 | ||
| Nondrinker | 291 (28.9) | 60 (25.2) | |
| ≤1 time per month | 228 (22.7) | 46 (19.3) | |
| 2–4 times per month | 291 (28.9) | 79 (33.2) | |
| ≥2 times per week | 196 (19.5) | 53 (22.3) | |
| Sleeping hours (n, %) | 0.314 | ||
| h ≤ 5 | 52 (5.2) | 16 (6.7) | |
| 5 < h ≤ 7 | 592 (58.8) | 142 (59.7) | |
| 7 < h ≤ 9 | 336 (33.4) | 70 (29.4) | |
| >9 | 26 (2.6) | 10 (4.2) | |
| Nutritional intake | |||
| Total calories (kcal, mean, SD) | 1851.6 (744.2) | 1933.8 (914.1) | 0.198 |
| Protein (g, mean, SD) | 64.1 (35.8) | 66.7 (39.9) | 0.340 |
| Fat (g, mean, SD) | 35.9 (26.2) | 36.6 (32.5) | 0.739 |
| Carbohydrate (g, mean, SD) | 314.9 (114.4) | 330.6 (142.9) | 0.116 |
| Calcium (mg, mean, SD) | 462.7 (314.8) | 463.9 (360.4) | 0.961 |
| Phosphorus (mg, mean, SD) | 937.1 (474.3) | 969 (544.8) | 0.364 |
| Iron (mg, mean, SD) | 10.6 (6.5) | 10.8 (7) | 0.582 |
| Potassium (mg, mean, SD) | 2362.6 (1336.5) | 2411.6 (1507.6) | 0.620 |
| Vitamin A (mg, mean, SD) | 485.9 (428.8) | 478.7 (384.7) | 0.813 |
| Sodium (mg, mean, SD) | 2547.3 (1628.1) | 2710.8 (1674.4) | 0.166 |
| Vitamin B1 (mg, mean, SD) | 1.1 (0.6) | 1.2 (0.8) | 0.351 |
| Vitamin B2 (mg, mean, SD) | 1 (0.6) | 1 (0.7) | 0.791 |
| Nicotinic acid (mg, mean, SD) | 15.8 (8.7) | 16.5 (9.7) | 0.289 |
| Vitamin C (mg, mean, SD) | 113 (85.2) | 110.9 (88.6) | 0.740 |
| Zinc (ug, mean, SD) | 8.3 (5) | 8.7 (4.8) | 0.319 |
| Vitamin B6 (mg, mean, SD) | 1.6 (0.9) | 1.7 (1) | 0.288 |
| Folic acid (ug, mean, SD) | 221.2 (154.7) | 225.3 (168) | 0.717 |
| Retinol (ug, mean, SD) | 86.3 (74.9) | 85.2 (88.9) | 0.851 |
| Carotene (ug, mean, SD) | 2294.4 (2280.8) | 2243.2 (1973.5) | 0.750 |
| Ash (mg, mean, SD) | 15.3 (10.2) | 15.9 (10.2) | 0.391 |
| Fiber (g, mean, SD) | 5.6 (3.5) | 5.7 (3.6) | 0.737 |
| Vitamin E (mg, mean, SD) | 9 (5.5) | 9.3 (7.3) | 0.624 |
| Cholesterol (mg, mean, SD) | 201.2 (159.6) | 198.4 (163.5) | 0.808 |
| DEXA fat (g, mean, SD) | 16,916 (7404.8) | 16,672.2 (7382.5) | 0.648 |
| DEXA fat (%, mean, SD) | 28.0 (7.6) | 26.7 (8.6) | 0.622 |
| BMI (kg/m2, mean, SD) | 23.3 (3.2) | 23.4 (3.2) | 0.591 |
| Difference of Dietary Intake | Monozygotic Twin | Dizygotic Twin | Estimated Values of Absolute Difference between Twin (95% CI) | |||
|---|---|---|---|---|---|---|
| Mean (SD) | Mean (SD) | Crude | p-Value | Adjusted † | p-Value | |
| Difference of total calories (kcal) | 637.6 (600.8) | 813.7 (1050.2) | 176.06 (75.8 to 276.31) | 0.001 * | 130.95 (22.66 to 239.24) | 0.018 |
| Difference of protein (g) | 26.8 (31.6) | 33.5 (45.6) | 6.73 (1.81 to 11.64) | 0.007 * | 1.62 (−3.68 to 6.92) | 0.548 |
| Difference of fat (g) | 19.6 (25) | 23.1 (39.2) | 3.46 (−0.54 to 7.46) | 0.090 | 0.99 (−3.32 to 5.3) | 0.653 |
| Difference of carbohydrate (g) | 104.4 (88.2) | 132.4 (162.6) | 27.96 (12.91 to 43.02) | 0.000* | 19.46 (3.19 to 35.74) | 0.019 |
| Difference of calcium (mg) | 256.5 (272.1) | 297.4 (383.3) | 40.84 (−1.1 to 82.78) | 0.056 | 34 (−11.28 to 79.28) | 0.141 |
| Difference of phosphorus (mg) | 380.4 (405.6) | 465.7 (596.9) | 85.34 (21.92 to 148.75) | 0.008 * | 50.96 (−17.38 to 119.3) | 0.144 |
| Difference of iron (mg) | 4.8 (5.3) | 6 (7.9) | 1.2 (0.37 to 2.03) | 0.005 * | 0.53 (−0.37 to 1.42) | 0.249 |
| Difference of potassium (mg) | 1129.9 (1162.2) | 1280.8 (1640.6) | 150.83 (−28.42 to 330.07) | 0.099 | 120.08 (−73.41 to 313.57) | 0.224 |
| Difference of vitamin A (mg) | 322.7 (419) | 327.3 (441.2) | 4.58 (−55.29 to 64.45) | 0.881 | −14.57 (−78.7 to 49.56) | 0.656 |
| Difference of sodium (mg) | 1412.2 (1363.4) | 1486.4 (1565.2) | 74.2 (−124.36 to 272.77) | 0.464 | −163.71 (−377.37 to 49.95) | 0.133 |
| Difference of vitamin B1 (mg) | 0.5 (0.6) | 0.6 (0.9) | 0.1 (0.01 to 0.19) | 0.032 * | 0.02 (−0.08 to 0.12) | 0.732 |
| Difference of vitamin B2 (mg) | 0.5 (0.5) | 0.6 (0.7) | 0.07 (−0.01 to 0.15) | 0.101 | 0.05 (−0.04 to 0.13) | 0.314 |
| Difference of nicotinic acid (mg) | 6.7 (7.7) | 8.5 (11) | 1.82 (0.62 to 3.01) | 0.003 * | 0.58 (−0.71 to 1.86) | 0.380 |
| Difference of vitamin C (mg) | 69.6 (73.7) | 81.7 (93.6) | 12.14 (1.12 to 23.15) | 0.031 * | 6.69 (−5.19 to 18.58) | 0.269 |
| Difference of zinc (ug) | 3.6 (5) | 4.4 (5.3) | 0.84 (0.12 to 1.55) | 0.021 * | 0.14 (−0.63 to 0.9) | 0.721 |
| Difference of vitamin B6 (mg) | 0.7 (0.8) | 0.9 (1.1) | 0.2 (0.08 to 0.32) | 0.001 * | 0.05 (−0.08 to 0.18) | 0.446 |
| Difference of folic acid (ug) | 119.9 (135.7) | 141.9 (186.3) | 21.99 (1.24 to 42.74) | 0.038 * | 4.22 (−18.14 to 26.59) | 0.711 |
| Difference of retinol (ug) | 59.7 (78.5) | 66.2 (97.5) | 6.5 (−5.17 to 18.17) | 0.275 | 4.86 (−7.59 to 17.31) | 0.444 |
| Difference of carotene (ug) | 1635 (2286.4) | 1685.1 (2286.6) | 50.15 (−273.18 to 373.48) | 0.761 | −82.49 (−429.43 to 264.46) | 0.641 |
| Difference of ash (mg) | 7.9 (9.8) | 9.2 (10.6) | 1.24 (−0.16 to 2.65) | 0.084 | −0.98 (−2.49 to 0.54) | 0.207 |
| Difference of fiber (g) | 2.8 (2.9) | 3.2 (3.9) | 0.39 (−0.05 to 0.83) | 0.079 | 0.23 (−0.24 to 0.7) | 0.338 |
| Difference of vitamin E (mg) | 4.6 (4.5) | 6.1 (8.5) | 1.53 (0.75 to 2.31) | 0.000 * | 0.79 (−0.05 to 1.64) | 0.066 |
| Difference of cholesterol (mg) | 124.2 (146.5) | 139.3 (166.8) | 15.14 (−6.15 to 36.43) | 0.163 | −5.13 (−27.85 to 17.59) | 0.018 |
| Difference of Clinical Examination | Monozygotic Twin | Dizygotic Twin | Estimated Values Of Absolute Difference Between Twin (95% CI) | |||
|---|---|---|---|---|---|---|
| Mean (SD) | Mean (SD) | Crude | p-Value | Adjusted † | p-Value | |
| Difference of total body fat (g) | 3303.7 (3839.5) | 5821.2 (6950) | 2517.54 (1866.68 to 3168.40) | <0.001 * | 2427.86 (1777.19 to 3078.53) | <0.001 * |
| Difference of total body fat (%) | 3.7 (3.5) | 5.7 (5.6) | 1.98 (1.42 to 2.54) | <0.001 * | 1.90 (1.33 to 2.46) | <0.001 * |
| Difference of body mass index (kg/m2) | 23.3 (3.2) | 23.4 (3.2) | 0.12 (−0.33 to 0.57) | 0.591 | −0.08 (−0.50 to 0.34) | 0.709 |
Publisher’s Note: MDPI stays neutral with regard to jurisdictional claims in published maps and institutional affiliations. |
© 2022 by the authors. Licensee MDPI, Basel, Switzerland. This article is an open access article distributed under the terms and conditions of the Creative Commons Attribution (CC BY) license (https://creativecommons.org/licenses/by/4.0/).
Share and Cite
Kim, S.Y.; Yoo, D.M.; Kwon, M.J.; Kim, J.H.; Kim, J.-H.; Bang, W.J.; Choi, H.G. Differences in Nutritional Intake, Total Body Fat, and BMI Score between Twins. Nutrients 2022, 14, 3655. https://doi.org/10.3390/nu14173655
Kim SY, Yoo DM, Kwon MJ, Kim JH, Kim J-H, Bang WJ, Choi HG. Differences in Nutritional Intake, Total Body Fat, and BMI Score between Twins. Nutrients. 2022; 14(17):3655. https://doi.org/10.3390/nu14173655
Chicago/Turabian StyleKim, So Young, Dae Myoung Yoo, Mi Jung Kwon, Ji Hee Kim, Joo-Hee Kim, Woo Jin Bang, and Hyo Geun Choi. 2022. "Differences in Nutritional Intake, Total Body Fat, and BMI Score between Twins" Nutrients 14, no. 17: 3655. https://doi.org/10.3390/nu14173655