
Sex Differences in Dietary Patterns of Adults and Their Associations with the Double Burden of Malnutrition: A Population-Based National Survey in the Philippines
 ,
,
Abstract
:1. Introduction
2. Materials and Methods
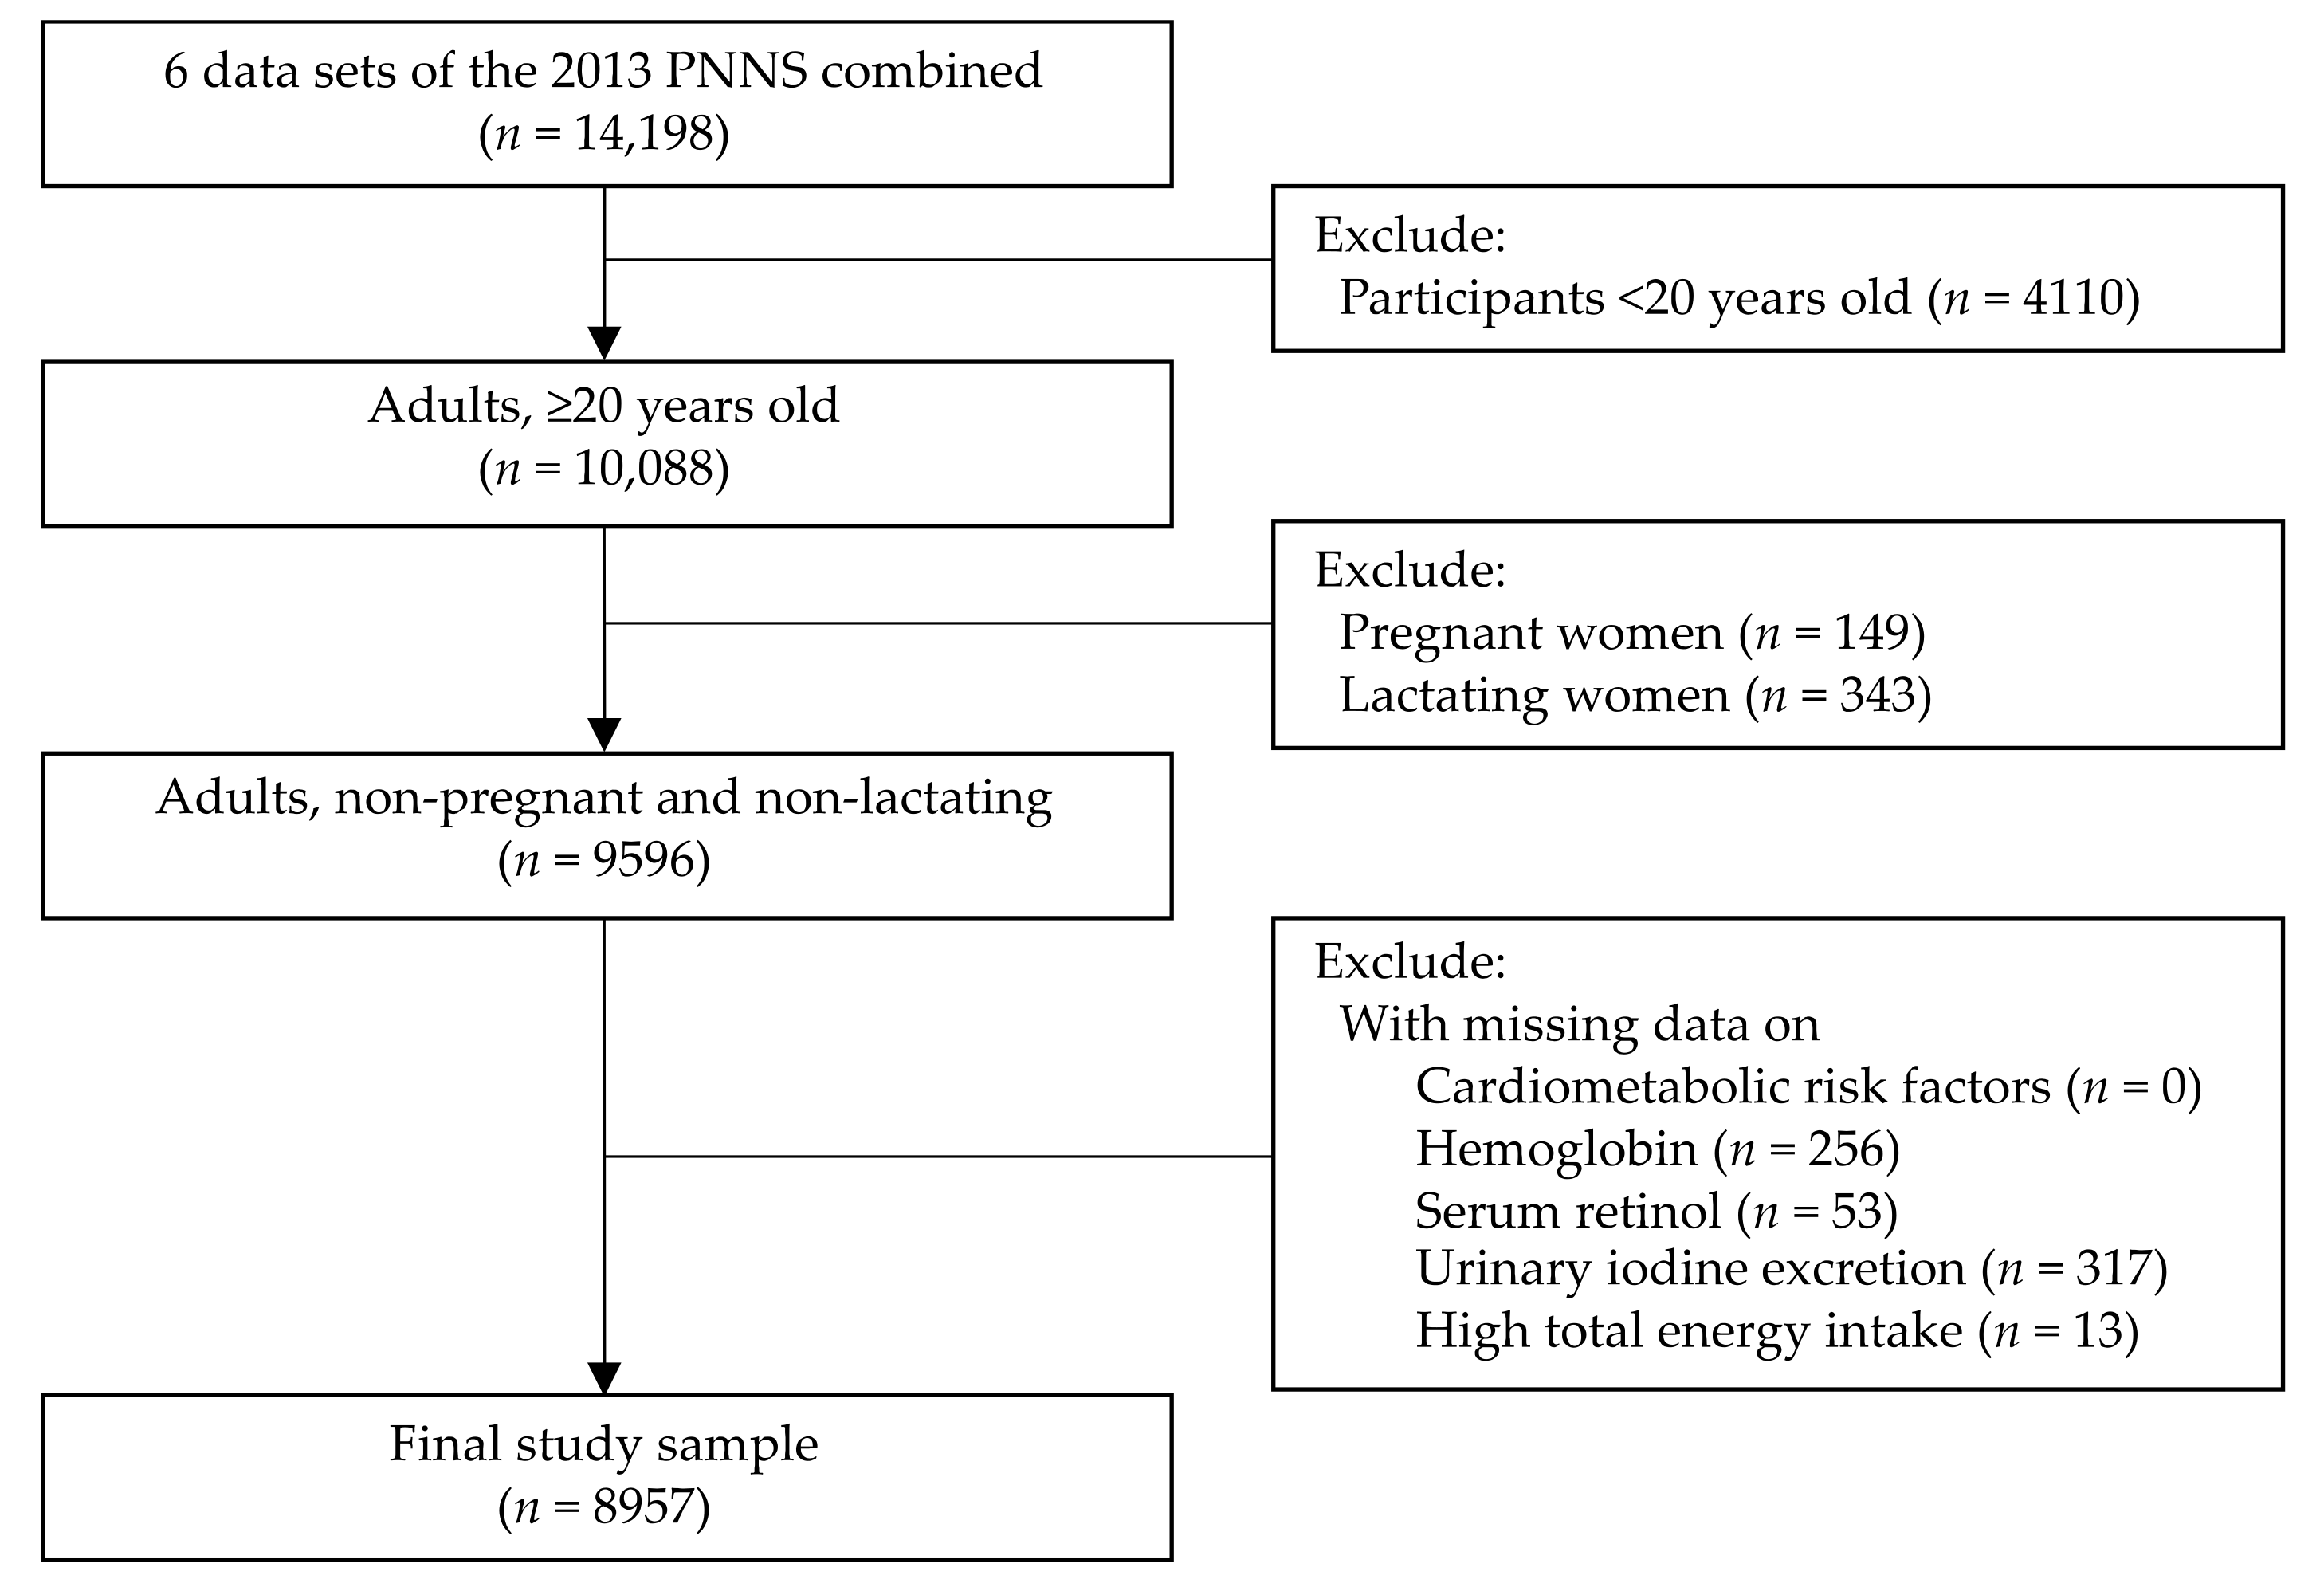
2.1. Data Source and Subjects
2.2. Dietary Intake Assessment and Dietary Pattern Analysis
2.3. Undernutrition, Cardiometabolic Risk Factors, and Double Burden of Malnutrition
2.4. Other Co-Variates
2.5. Statistical Analysis
3. Results
3.1. Participants’ Characteristics
3.2. Dietary Patterns
3.3. Association of Dietary Patterns and Double Burden of Malnutrition
4. Discussion
5. Conclusions
Supplementary Materials
Author Contributions
Funding
Institutional Review Board Statement
Informed Consent Statement
Data Availability Statement
Acknowledgments
Conflicts of Interest
References
- Winichagoon, P.; Margetts, B.M. The Double Burden of Malnutrition in Low-and Middle-Income Countries. Available online: https://publications.iarc.fr/Book-And-Report-Series/Iarc-Working-Group-Reports/Energy-Balance-And-Obesity-2017 (accessed on 26 September 2020).
- Popkin, B.M.; Corvalan, C.; Grummer-Strawn, L.M. Dynamics of the double burden of malnutrition and the changing nutrition reality. Lancet 2020, 395, 65–74. [Google Scholar] [CrossRef]
- Bertin, M.; Touvier, M.; Dubuisson, C.; Dufiur, A.; Havard, S.; Lafay, L.; Volatier, J.L.; Lioret, S. Dietary patterns of French adults: Associations with demographic, socio-economic and behavioural factors. J. Hum. Nutr. Diet. 2016, 29, 241–254. [Google Scholar] [CrossRef] [PubMed]
- Knudsen, V.K.; Matthiessen, J.; Biltoft-Jensen, A.; Sørensen, M.R.; Groth, M.V.; Christensen, T.; Fagt, S. Identifying dietary patterns and associated health-related lifestyle factors in the adult Danish population. Eur. J. Clin. Nutr. 2014, 68, 736–740. [Google Scholar] [CrossRef] [PubMed]
- Muga, M.A.; Owili, P.O.; Hsu, C.Y.; Rau, H.H.; Chao, J.C.J. Dietary patterns, gender, and weight status among middle-aged and older adults in Taiwan: A cross-sectional study. BMC Geriatr. 2017, 17, 1–10. [Google Scholar] [CrossRef]
- Khor, G.L.; Sharif, Z.M. Dual forms of malnutrition in the same households in Malaysia—A case study among Malay rural households. Asia Pac. J. Clin. Nutr. 2003, 12, 427–437. [Google Scholar]
- Lee, S.J.; Ryu, H.K. Relationship between dietary intakes and the double burden of malnutrition in adults of Malang, Indonesia: An exploratory study. Nutr. Res. Pract. 2018, 12, 426–435. [Google Scholar] [CrossRef]
- Melby, C.L.; Orozco, F.; Averett, J.; Muñoz, F.; Romero, M.J.; Barahona, A. Agricultural food production diversity and dietary diversity among female small holder farmers in a region of the Ecuadorian Andes experiencing nutrition transition. Nutrients 2020, 12, 2454. [Google Scholar] [CrossRef]
- Zeba, A.N.; Delisle, H.F.; Renier, G. Dietary patterns and physical inactivity, two contributing factors for the double burden of malnutrition among adults in Burkina Faso, West Africa. J. Nutr. Sci. 2014, 3, e50. [Google Scholar] [CrossRef]
- Department of Science and Technology-Food and Nutrition Research Institute. Philippine Facts and Figures: 2018 Expanded National Nutrition Survey. Available online: http://enutrition.fnri.dost.gov.ph/site/uploads/2018%20Expanded%20National%20Nutrition%20Survey-TAGUIG.pdf (accessed on 3 August 2020).
- De Juras, A.R.; Hsu, W.C.; Hu, S.C. Prevalence and determinants of the co-occurrence of overweight or obesity and micronutrient deficiencies among adults in the Philippines: Results from a National Representative Survey. Nutrients 2021, 13, 2339. [Google Scholar] [CrossRef]
- De Juras, A.R.; Hsu, W.C.; Hu, S.C. The double burden of malnutrition at the individual level among adults: A nationwide survey in the Philippines. Front. Nutr. 2021, 8, 760437. [Google Scholar] [CrossRef]
- Pedro, M.R.; Barba, C.; Benavides-de Leon, R. Nutrition Transition in the Philippines. Available online: https://www.semanticscholar.org/paper/Nutrition-Transition-in-the-Philippines-Pedro-Barba/d3aa78884070a2a53fa99cd801d847992fcfb90b (accessed on 27 November 2020).
- Department of Science and Technology-Food and Nutrition Research Institute. Public Use File. Available online: http://enutrition.fnri.dost.gov.ph/site/home.php (accessed on 3 September 2020).
- Barcenas, M.L. The Development of the 2003 Master Sample (MS) for Philippine Household Surveys. In Proceedings of the 9th National Nutrition on Statistics, Manila, Philippines, 4–5 October 2004. [Google Scholar]
- Patalen, C.F.; Ikeda, N.; Angeles-Agdeppa, I.; Vargas, M.B.; Nishi, N.; Duante, C.A.; Capanzana, M.V. Data Resource Profile: The Philippine National Nutrition Survey (NNS). Int. J. Epidemiol. 2020, 49, 742–743f. [Google Scholar] [CrossRef] [PubMed]
- Flores, M.; Macias, N.; Rivera, M.; Lozada, A.; Barquera, S.; Rivera-Dommarco, J.; Tucker, K.L. Dietary patterns in Mexican adults are associated with risk of being overweight or obese. J. Nutr. 2010, 140, 1869–1873. [Google Scholar] [CrossRef] [PubMed]
- Department of Science and Technology-Food Nutrition Research Institute. eNutrition, Facts and Figure 2013 National Nutrition Survey. Available online: https://www.fnri.dost.gov.ph/index.php/19-nutrition-statistic/175-national-nutrition-survey#facts-and-figures (accessed on 3 September 2020).
- Gazan, R.; Béchaux, C.; Crépet, A.; Sirot, V.; Drouillet-Pinard, P.; Dubuisson, C.; Harvard, S. Dietary patterns in the French adult population: A study from the second French national cross-sectional dietary survey (INCA2) (2006–2007). Br. J. Nutr. 2016, 116, 300–315. [Google Scholar] [CrossRef] [PubMed]
- De Gavelle, E.; Huneau, J.F.; Mariotti, F. Patterns of protein food intake are associated with nutrient adequacy in the general French adult population. Nutrients 2018, 10, 226. [Google Scholar] [CrossRef]
- Zárate-Ortiz, A.G.; Melse-Boonstra, A.; Rodríguez-Ramírez, S.; Hernández-Cordero, S.; Feskens, E.J. Dietary patterns and the double burden of malnutrition in Mexican adolescents: Results from ENSANUT-2006. Nutrients 2019, 11, 2753. [Google Scholar] [CrossRef]
- De Juras, A.R.; Hsu, W.C.; Hu, S.C. Dietary patterns and their association with sociodemographic and lifestyle factors in Filipino adults. Nutrients 2022, 14, 886. [Google Scholar] [CrossRef]
- Angeles-Agdeppa, I.; Sun, Y.; Tanda, K.V. Dietary pattern and nutrient intakes in association with non-communicable disease risk factors among Filipino adults: A cross-sectional study. Nutr. J. 2020, 19, 1–13. [Google Scholar] [CrossRef]
- Bell, L.K.; Edwards, S.; Grieger, J.A. The relationship between dietary patterns and metabolic health in a representative sample of adult Australians. Nutrients 2015, 7, 6491–6505. [Google Scholar] [CrossRef]
- Cai, J.X.; Nuli, R.; Zhang, Y.; Zhang, Y.Y.; Abudusemaiti, M.; Kadeer, A.; Tian, X.; Xiao, H. Association of dietary patterns with type 2 diabetes mellitus among middle-aged adults in Uygur population of Xinjiang region. J. Nutr. Sci. Vitaminol. 2019, 65, 362–374. [Google Scholar] [CrossRef]
- World Health Organization. WHO Technical Report Series on Obesity: Preventing and Managing the Global Epidemic. Available online: https://apps.who.int/iris/handle/10665/42330 (accessed on 21 September 2020).
- International Committee for Standardization in Haematology. International Committee for Standardization in Haematology: Protocol for type testing equipment and apparatus used for haematological analysis. J. Clin. Pathol. 1978, 31, 275–279. [Google Scholar] [CrossRef]
- World Health Organization; United Nations Children’s Fund; United Nations University. Iron Deficiency Anaemia: Assessment, Prevention and Control, a Guide for Programme Managers. Available online: https://www.ihs.org.in/SHG/WHO-Anemia%20detection%20guidelines.pdf (accessed on 26 September 2020).
- Furr, H.C.; Tanmihardjo, S.A.; Olson, J.A. Training Manual for Assessing Vitamin a Status by Use of the Modified Relative Dose Response and Relative Dose Response Assays; United States Agency for International Development: Washington, DC, USA, 1992.
- Sommer, A. Vitamin A Deficiency and Its Consequences: A Field Guide to Detection and Control. Available online: https://apps.who.int/iris/handle/10665/40535 (accessed on 26 September 2020).
- Dunn, J.T.; Crutchfield, H.E.; Gutekunst, R.; Dunn, A.D. Methods for Measuring Iodine in Urine; International Council for Control of Iodine Deficiency Disorders (ICCIDD): Wageningen, The Netherlands, 1993. [Google Scholar]
- World Health Organization. Assessment of Iodine Deficiency Disorders and Monitoring Their Elimination: A Guide for Programme Managers. Available online: https://www.who.int/publications/i/item/9789241595827 (accessed on 26 September 2020).
- World Health Organization. Waist Circumference and Waist-Hip Ratio: Report of a WHO Expert Consultation. Available online: https://www.who.int/publications/i/item/9789241501491 (accessed on 3 September 2020).
- James, P.A.; Oparil, S.; Carter, B.L.; Cushman, W.C.; Dennison-Himmelfarb, C.; Handler, J.; Lackland, D.T.; LeFevre, M.L.; MacKenzie, T.D.; Ogedegbe, O.; et al. 2014 evidence-based guideline for the management of high blood pressure in adults: Report from the panel members appointed to the Eight Joint National Committee (JNC 8). JAMA 2014, 311, 507–520. [Google Scholar] [CrossRef] [PubMed] [Green Version]
- World Health Organization. Definition, Diagnosis, and Classification of Diabetes Mellitus and Its Complications: Report of a WHO Consultation, Part 1, Diagnosis and Classification of Diabetes Mellitus. Available online: https://apps.who.int/iris/handle/10665/66040 (accessed on 3 September 2020).
- Expert Panel on Detection, Evaluation, and Treatment of High Blood Cholesterol in Adults. Executive summary of the Third report of the National Cholesterol Education Program (NCEP) Expert Panel on Detection, Evaluation, and Treatment of High Blood Cholesterol in Adults (Adult Treatment Panel III). JAMA 2001, 285, 2486–2497. [Google Scholar] [CrossRef]
- Grundy, S.M.; Brewer Jr, H.B.; Cleeman, J.I.; Smith Jr, S.C.; Lenfant, C. Definition of metabolic syndrome: Report of the National Heart, Lung, and Blood Institute/American Heart Association Conference on Scientific Issues Related to Definition. Circulation 2004, 109, 433–438. [Google Scholar] [CrossRef] [PubMed]
- World Health Organization. WHO STEPS Surveillance Manual: The WHO STEPwise Approach to Chronic Disease Risk Factor Surveillance; WHO: Geneva, Switzerland, 2005. [Google Scholar]
- World Health Organization. Global Status Report on Alcohol and Health 2018; WHO: Geneva, Switzerland, 2019. [Google Scholar]
- Park, S.; Bae, J.-H. Fermented food intake is associated with a reduced likelihood of atopic dermatitis in an adult population (Korean National Health and Nutrition Examination Survey 2012–2013). Nutr. Res. 2016, 36, 125–133. [Google Scholar] [CrossRef]
- Lee, W.L.; Woo, H.D.; Cho, M.J.; Park, J.K.; Kim, S.S. Identification of dietary patterns associated with incidence of hyperglycemia in middle-aged and older Korean adults. Nutrients 2019, 11, 1801. [Google Scholar] [CrossRef]
- Venkaiah, K.; Brahmam, G.N.V.; Vijayaraghavan, K. Application of factor analysis to identify dietary patterns and use of factor scores to study their relationship with nutritional status of adult rural populations. J. Health Popul. Nutr. 2011, 29, 327–338. [Google Scholar] [CrossRef] [PubMed]
- Chen, Z.; Liu, L.; Roebothan, B.; Ryan, A.; Colbourne, J.; Baker, N.; Yan, J.; Wang, P.P. Four major dietary patterns identified for a target-population of adults residing in Newfoundland and Labrador, Canada. BMC Public Health 2015, 15, 1–12. [Google Scholar] [CrossRef]
- Mishra, G.; Ball, K.; Arbuckle, J.; Crawford, D. Dietary patterns of Australian adults and their association with socioeconomic status: Results from the 1995 National Nutrition Survey. Eur. J. Clin. Nutr. 2002, 56, 687–693. [Google Scholar] [CrossRef]
- Okada, E.; Takahashi, K.; Takimoto, H.; Takabayashi, S.; Kishi, T.; Kobayashi, T.; Nakamura, K.; Ukawa, S.; Nakamura, M.; Sasaki, S.; et al. Dietary patterns among Japanese adults: Findings from the National Health and Nutrition Survey, 2012. Asia Pac. J. Clin. Nutr. 2018, 27, 1120–1130. [Google Scholar]
- Rashidkhani, B.; Gargari, B.P.; Ranjbar, F.; Zareiy, S.; Kargarnovin, Z. Dietary patterns and anthropometric indices among Iranian women with major depressive disorder. Psychiatry Res. 2013, 210, 115–120. [Google Scholar] [CrossRef]
- Rezazadeh, A.; Rashidkhani, B. The association of general and central obesity with major dietary patterns of adult women living in Tehran, Iran. J. Nutr. Sci. Vitaminol. 2010, 56, 132–138. [Google Scholar] [CrossRef] [PubMed]
- Rezazadeh, A.; Rashidkhani, B.; Omidvar, N. Association of major dietary patterns with socio-economic and lifestyle factors of adult women living in Tehran, Iran. Nutrition 2010, 26, 337–341. [Google Scholar] [CrossRef] [PubMed]
- Deshmukh-Taskar, P.R.; O’Neil, C.E.; Nicklas, T.A.; Yang, S.J.; Liu, Y.; Gustat, J.; Berenson, G.S. Dietary patterns associated with metabolic syndrome, sociodemographic and lifestyle factors in young adults: The Bogalusa Heart Study. Public Health Nutr. 2009, 12, 2493–2503. [Google Scholar] [CrossRef] [PubMed]
- Farmaki, A.E.; Rayner, N.W.; Matchan, A.; Spiliopoulou, P.; Gilly, A.; Kariakli, V.; Kiagiadaki, C.; Tsafantakis, E.; Zeggini, E.; Dedoussis, G. The mountainous Cretan dietary patterns and their relationship with cardiovascular risk factors: The Hellenic Isolated Cohorts MANOLIS study. Public Health Nutr. 2016, 20, 1063–1074. [Google Scholar] [CrossRef]
- Hendricks, K.M.; Mkaya Mwamburi, D.; Newby, P.K.; Wanke, C.A. Dietary patterns and nutrition outcomes in men living with HIV infection. Am. J. Clin. Nutr. 2008, 88, 1584–1592. [Google Scholar] [CrossRef]
- Beck, K.L.; Kruger, R.; Conlon, C.A.; Heath, A.-L.M.; Mathhys, C.; Coad, J.; Stonehouse, W. Suboptimal iron status and associated dietary patterns and practices in postmenopausal women living in Auckland, New Zealand. Eur. J. Clin. Nutr. 2013, 52, 467–476. [Google Scholar] [CrossRef]
- Hong, X.; Xu, F.; Wang, Z.Y.; Liang, Y.Q.; Li, J.Q. Dietary patterns and the incidence of hyperglycemia in China. Public Health Nutr. 2015, 19, 131–141. [Google Scholar] [CrossRef]
- Ovaskainen, M.-L.; Tapanainen, H.; Laatikainen, T.; Männistö, S.; Heininen, H.; Vartiainen, E. Perceived health-related self-efficacy associated with BMI in adults in a population-based survey. Scand. J. Public Health 2015, 43, 197–203. [Google Scholar] [CrossRef]
- Krittanawong, C.; Tunhasiriwet, A.; Zhang, H.; Prokop, L.J.; Chirapongsathom, S.; Sun, T.; Wang, Z. Is white rice consumption a risk for metabolic and cardiovascular outcomes? A systematic review and meta-analysis. Heart Asia 2017, 9, e010909. [Google Scholar] [CrossRef]
- Muraki, I.; Wu, H.; Imamura, F.; Laden, F.; Rimm, E.B.; Hu, F.B.; Willet, W.C.; Sun, Q. Rice consumption and risk of cardiovascular disease: Results from a pooled analysis of 3 US cohorts. Am. J. Clin. Nutr. 2014, 101, 164–172. [Google Scholar] [CrossRef]
- Eshak, E.S.; Iso, H.; Date, C.; Yamagishi, K.; Kikuchi, S.; Watanabe, Y.; Wada, Y.; Tamakoshi, A.; JACC Study Group. Rice intake is associated with reduced risk of mortality from cardiovascular disease in Japanese men but not women. J. Nutr. 2011, 141, 595–602. [Google Scholar] [PubMed]
- Boers, H.M.; Hoorn, J.S.T.; Mela, D.J. A systematic review of the influence of rice characteristics processing methods on postprandial glycaemic and insulinaemic responses. Br. J. Nutr. 2015, 114, 1035–1045. [Google Scholar] [CrossRef] [PubMed]
- Saneei, P.; Larijani, B.; Esmailzadeh, A. Rice consumption, incidence of chronic diseases and risk of mortality: Meta-analysis of cohort studies. Public Health Nutr. 2017, 20, 233–244. [Google Scholar] [CrossRef] [PubMed]
- Department of Health-Philippines. Food Fortification Program. Available online: https://doh.gov.ph/food-fortification-program (accessed on 11 March 2022).
- Palanog, A.D.; Calayugan, M.I.C.; Descalsota-Empleo, G.I.; Amparado, A.; Inabangan-Asilo, M.A.; Arocena, E.C.; Sta Cruz, P.C.; Borromeo, T.H.; Lalusin, A.; Hernandez, J.E.; et al. Zinc and iron nutrition status in the Philippines population and local soils. Front. Nutr. 2019, 6, 81. [Google Scholar] [CrossRef] [PubMed]
- World Health Organization. Guideline: Fortification of Rice with Vitamins and Minerals as a Public Health Strategy. Available online: https://www.who.int/publications/i/item/9789241550291 (accessed on 12 March 2022).
- Tielemans, S.M.; Altorf-van der Kuil, W.; Engberink, M.F.; Brink, E.J.; van Baak, M.A.; Bakker, S.J.; Gelejinse, J.M. Intake of total protein, plant protein and animal protein in relation to blood pressure: A meta-analysis of observational and intervention studies. J. Hum. Hypertens. 2013, 27, 564–571. [Google Scholar] [CrossRef]
- Zhubi-Bakija, F.; Bajraktari, G.; Bytuçi, I.; Mikhailidis, D.P.; Henein, M.Y.; Latkovskis, G.; Rexhaj, Z.; Zhubi, E.; Banach, M.; Alnouri, F.; et al. The impact of type of dietary protein, animal versus vegetable, in modifying cardiometabolic risk factors: A position paper from the International Lipid Expert Panel (ILEP). Clin. Nutr. 2021, 40, 255–276. [Google Scholar] [CrossRef]
- Mariotti, F. Animal and plant protein sources and cardiometabolic health. Adv. Nutr. 2019, 10, S351–S366. [Google Scholar] [CrossRef]
- Morega, L.T.; Mallard, S.; Mann, J. Dietary sugars and body: Systematic review and meta-analyses of randomized controlled trials and cohort studies. Brit. Med. J. 2013, 346, e7492. [Google Scholar] [CrossRef]
- Khan, T.A.; Tayyiba, M.; Agarwal, A.; Mejia, S.B.; de Souza, R.J.; Wolever, T.M.S.; Leiter, L.A.; Kendall, C.W.C.; Jenkins, D.J.A.; Sievenpiper, J.L. Relation of total sugars, sucrose, fructose, and added sugars with the risk of cardiovascular disease: A systematic review and dose-response meta-analysis of prospective cohort studies. Mayo Clin. Proc. 2019, 94, 2399–2414. [Google Scholar] [CrossRef]
- Anderson, J.W.; Baird, O.; Davis Jr, R.H.; Ferreri, S.; Knudtson, M.; Koraym, A.; Waters, V.; Willimas, C.L. Health benefits of dietary fiber. Nutr. Rev. 2009, 67, 188–205. [Google Scholar] [CrossRef]
- Fernandez, M.L.; West, K.L. Mechanisms by which dietary fatty acids modulate plasma lipids. J. Nutr. 2005, 135, 2075–2078. [Google Scholar] [CrossRef] [PubMed]
- Sleeth, M.L.; Thompson, E.L.; Ford, H.E.; Zac-Varghese, S.E.; Frost, G. Free fatty acid receptor 2 and nutrient sensing: A proposed role for fibre, fermentable carbohydrates and short-chain fatty acids in appetite regulation. Nutr. Res. Rev. 2010, 23, 135–145. [Google Scholar] [CrossRef] [Green Version]
- Fung, T.T.; Rimm, E.B.; Spiegelman, D.; Rifai, N.; Tofler, G.H.; Willet, W.C.; Hu, F.B. Association between dietary patterns and plasma biomarkers of obesity and cardiovascular disease risk. Am. J. Clin. Nutr. 2001, 73, 61–67. [Google Scholar] [CrossRef] [PubMed]
- Warensjö Lemming, E.; Byberg, L.; Stattin, K.; Ahmad, S.; Lind, L.; Elmståhl, S.; Larsson, S.C.; Wolk, A.; Michaëlsoon, K. Dietary pattern specific protein biomarkers for cardiovascular disease: A cross-sectional study in 2 independent cohorts. J. Am. Heart. Assoc. 2019, 8, e011860. [Google Scholar] [CrossRef] [PubMed]
- Ndanuko, R.N.; Tapsell, L.C.; Charlton, K.E.; Neale, E.P.; Batterham, M.J. Dietary patterns and blood pressure in adults: A systematic review and meta-analysis of randomized controlled trials. Adv. Nutr. 2016, 7, 76–89. [Google Scholar] [CrossRef]
- Neale, E.P.; Batterham, M.J.; Tapsell, L.C. Consumption of a healthy dietary pattern results in significant reductions in C-reactive protein levels in adults: A meta-analysis. Nutr. Res. 2016, 36, 391–401. [Google Scholar] [CrossRef]
- Craddock, J.C.; Neale, E.P.; Peoples, G.E.; Probst, Y.C. Vegetarian-based dietary patterns and their relation with inflammatory and immune biomarkers: A systematic review and meta-analysis. Adv. Nutr. 2019, 10, 433–451. [Google Scholar] [CrossRef] [PubMed]
- Melse-Boonstra, A. Bioavailability of micronutrients from micronutrient-dense whole foods: Zooming in on dairy, vegetables, and fruits. Front. Nutr. 2020, 7, 101. [Google Scholar] [CrossRef]
- Angeles-Agdeppa, I.; Sun, Y.; Denney, L.; Tanda, K.V.; Octavio, R.A.D.; Carriquiry, A.; Capanzana, M.V. Food sources, energy and nutrient intakes of adults: 2013 Philippines National Nutrition Survey. Nutr. J. 2019, 18, 1–12. [Google Scholar] [CrossRef]
- Miller, V.; Mente, A.; Dehghan, M.; Rangarajan, S.; Zhang, X.; Swaminathan, S.; Dagenais, G.; Gupta, R.; Mohan, V.; Lear, S.; et al. Fruit, vegetable, and legume intake, and cardiovascular disease and deaths in 18 countries (PURE): A prospective cohort study. Lancet 2017, 390, 2037–2049. [Google Scholar] [CrossRef] [Green Version]


| Variables 1 | Total | Male | Female | p-Value |
|---|---|---|---|---|
| (n = 8957) | (n = 4465) | (n = 4492) | ||
| Age group | <0.001 | |||
| 20–39 years | 46.5 | 48.8 | 44.2 | |
| 40–59 years | 38.3 | 37.3 | 39.3 | |
| ≥60 years | 15.2 | 13.8 | 16.6 | |
| Educational attainment | 0.005 | |||
| ≤Elementary | 31.9 | 33.9 | 29.9 | |
| High school | 37.9 | 38.2 | 37.6 | |
| ≥College | 30.2 | 27.8 | 32.4 | |
| Marital status | <0.001 | |||
| Single | 23.4 | 26.4 | 20.4 | |
| Married | 66.6 | 67.9 | 65.2 | |
| Others | 10.1 | 5.7 | 14.4 | |
| Employment status | <0.001 | |||
| Employed | 59.5 | 76.3 | 43.0 | |
| Unemployed | 40.5 | 23.7 | 57.0 | |
| Household size | 0.840 | |||
| 1–3 | 33.3 | 33.3 | 33.3 | |
| 4–6 | 45.1 | 44.9 | 45.3 | |
| ≥7 | 21.6 | 21.8 | 21.4 | |
| Wealth quintile | <0.001 | |||
| Poorest | 17.6 | 19.4 | 15.8 | |
| Poor | 19.3 | 20.0 | 18.6 | |
| Middle | 20.6 | 20.7 | 20.4 | |
| Rich | 20.6 | 19.9 | 21.2 | |
| Richest | 22.0 | 20.0 | 24.0 | |
| Current smoker | <0.001 | |||
| Yes | 26.9 | 46.0 | 8.1 | |
| No | 73.1 | 54.0 | 91.9 | |
| Current alcohol drinker | <0.001 | |||
| Yes | 51.3 | 72.4 | 30.6 | |
| No | 48.7 | 27.6 | 69.4 | |
| Physical activity | <0.001 | |||
| Low | 44.2 | 36.5 | 51.7 | |
| High | 55.8 | 63.5 | 48.3 |
| Variables | Total | Male | Female | p-Value |
|---|---|---|---|---|
| (n = 8957) | (n = 4465) | (n = 4492) | ||
| Undernutrition | ||||
| Underweight | 11.2 | 10.4 | 12.0 | <0.001 |
| Anemia | 6.5 | 5.4 | 7.5 | 0.014 |
| Vitamin A deficiency | 0.1 | 0.0 | 0.1 | 0.430 |
| Iodine insufficiency | 23.8 | 21.0 | 26.5 | 0.001 |
| Cardiometabolic risk factors | ||||
| Overweight/Obesity | 29.4 | 25.9 | 32.9 | 0.001 |
| Abdominal obesity | 13.4 | 3.4 | 23.2 | <0.001 |
| Hypertension | 22.5 | 24.3 | 20.6 | 0.008 |
| Hyperglycemia | 10.2 | 11.1 | 9.3 | 0.047 |
| Low HDL cholesterol | 70.1 | 61.4 | 78.8 | <0.001 |
| Hypertriacylglycerolemia | 39.5 | 46.5 | 32.6 | <0.001 |
| ≥1 Undernutrition 1 | 35.5 | 32.1 | 38.9 | 0.001 |
| ≥1 Cardiometabolic risk factor 2,3 | 84.5 | 81.9 | 87.1 | 0.002 |
| Total DBM 4 | 29.5 | 25.6 | 33.3 | <0.001 |
| Food Groups | Dietary Patterns 1 | ||||||
|---|---|---|---|---|---|---|---|
| Rice | Meat and Sugar | Fruits and Miscellaneous Food | Fish | Vegetables | Cereal, Egg, and Oils | Beverage | |
| Rice and rice products | 0.964 | 0.071 | 0.007 | 0.077 | 0.076 | −0.002 | −0.038 |
| Corn and corn products | −0.411 | −0.022 | −0.029 | 0.043 | 0.236 | −0.118 | −0.007 |
| Other cereal products | −0.026 | 0.252 | 0.032 | −0.056 | −0.066 | 0.381 | −0.031 |
| Starchy roots and tubers | −0.067 | 0.017 | 0.015 | 0.008 | 0.120 | −0.008 | −0.008 |
| Sugar and syrups | 0.027 | 0.460 | 0.005 | −0.018 | −0.025 | 0.172 | −0.007 |
| Dried beans, nuts, and seeds | 0.034 | 0.016 | −0.014 | −0.074 | 0.021 | 0.065 | 0.021 |
| Green leafy and yellow vegetables | −0.035 | −0.091 | 0.024 | −0.012 | 0.547 | −0.079 | −0.012 |
| Other vegetables | 0.099 | −0.079 | 0.024 | −0.134 | 0.282 | 0.074 | −0.001 |
| Fruits | 0.005 | 0.028 | 0.548 | 0.043 | 0.061 | 0.052 | −0.015 |
| Fish and fish products | 0.113 | −0.001 | 0.001 | 0.860 | −0.072 | −0.012 | 0.012 |
| Meat and meat products | 0.057 | 0.351 | 0.009 | −0.159 | −0.101 | 0.117 | 0.262 |
| Poultry | 0.058 | 0.174 | −0.011 | −0.115 | −0.036 | 0.141 | 0.079 |
| Eggs | 0.092 | 0.002 | −0.002 | −0.079 | −0.065 | 0.307 | 0.016 |
| Milk and milk products | −0.026 | 0.083 | 0.097 | −0.023 | 0.021 | 0.228 | 0.037 |
| Fats and oils | 0.019 | 0.041 | 0.013 | 0.050 | 0.022 | 0.377 | 0.018 |
| Beverages | −0.025 | 0.103 | −0.009 | 0.008 | −0.008 | 0.041 | 0.531 |
| Condiments and spices | −0.012 | 0.178 | 0.026 | 0.111 | −0.016 | −0.004 | 0.063 |
| Other miscellaneous | 0.016 | 0.005 | 0.639 | −0.013 | 0.012 | 0.051 | 0.005 |
| Proportion variance, % | 6.4 | 2.8 | 4.0 | 4.6 | 2.7 | 3.0 | 2.0 |
| Cumulative variance, % | 6.4 | 9.2 | 13.2 | 17.8 | 20.5 | 23.5 | 25.5 |
| Food Groups | Dietary Patterns 1 | |||||
|---|---|---|---|---|---|---|
| Rice | Protein-Rich Foods, Cereal, and Sugar | Fruits and Miscellaneous Food | Fish | Vegetables and Corn | Fats and Oils | |
| Rice and rice products | 0.889 | −0.308 | 0.019 | 0.131 | 0.029 | 0.114 |
| Corn and corn products | −0.299 | −0.067 | −0.043 | 0.028 | 0.327 | −0.055 |
| Other cereal products | −0.040 | 0.456 | −0.028 | −0.001 | −0.078 | 0.122 |
| Starchy roots and tubers | −0.031 | 0.028 | 0.065 | 0.002 | 0.149 | −0.012 |
| Sugar and syrups | 0.057 | 0.374 | 0.056 | −0.007 | 0.040 | 0.125 |
| Dried beans, nuts, and seeds | 0.032 | 0.037 | −0.042 | −0.057 | 0.070 | 0.205 |
| Green leafy and yellow vegetables | 0.018 | −0.150 | −0.010 | 0.010 | 0.405 | −0.032 |
| Other vegetables | 0.074 | −0.030 | 0.053 | −0.118 | 0.331 | 0.112 |
| Fruits | 0.000 | 0.112 | 0.536 | 0.012 | 0.080 | −0.011 |
| Fish and fish products | 0.097 | −0.093 | 0.028 | 0.669 | −0.091 | −0.070 |
| Meat and meat products | 0.051 | 0.385 | 0.011 | −0.156 | −0.057 | 0.110 |
| Poultry | 0.047 | 0.303 | 0.081 | −0.050 | −0.042 | 0.069 |
| Eggs | 0.045 | 0.046 | 0.058 | −0.055 | −0.041 | 0.189 |
| Milk and milk products | −0.040 | 0.345 | 0.107 | 0.036 | 0.007 | 0.063 |
| Fats and oils | −0.018 | 0.135 | 0.035 | 0.090 | −0.024 | 0.362 |
| Beverages | −0.028 | 0.206 | 0.033 | −0.074 | −0.031 | 0.022 |
| Condiments and spices | −0.010 | 0.344 | −0.045 | 0.100 | −0.017 | −0.087 |
| Other miscellaneous | 0.030 | 0.036 | 0.457 | 0.002 | 0.051 | 0.057 |
| Proportion variance, % | 5.1 | 5.2 | 3.0 | 3.0 | 2.5 | 1.7 |
| Cumulative variance, % | 5.1 | 10.3 | 13.3 | 16.3 | 18.8 | 20.5 |
| Dietary Patterns | Total DBM 2 (n = 1250) |
|---|---|
| OR (95% CI) | |
| Rice pattern (ref. = tertile 1) | |
| Tertile 2 | 0.82 (0.68, 0.99) |
| Tertile 3 | 1.06 (0.80, 1.41) |
| Meat and sugar pattern (ref. = tertile 1) | |
| Tertile 2 | 0.78 (0.64, 0.96) |
| Tertile 3 | 0.75 (0.58, 0.97) |
| Fruits and miscellaneous food pattern (ref. = tertile 1) | |
| Tertile 2 | 0.99 (0.82, 1.19) |
| Tertile 3 | 0.96 (0.79, 1.16) |
| Fish pattern (ref. = tertile 1) | |
| Tertile 2 | 1.02 (0.86, 1.22) |
| Tertile 3 | 1.00 (0.82, 1.23) |
| Vegetables pattern (ref. = tertile 1) | |
| Tertile 2 | 0.97 (0.80, 1.18) |
| Tertile 3 | 1.12 (0.91, 1.38) |
| Cereal, egg, and oils pattern (ref. = tertile 1) | |
| Tertile 2 | 0.89 (0.73, 1.09) |
| Tertile 3 | 0.93 (0.75, 1.16) |
| Beverage pattern (ref. = tertile 1) | |
| Tertile 2 | 1.05 (0.87, 1.25) |
| Tertile 3 | 0.93 (0.75, 1.14) |
| Dietary Patterns | Total DBM 2 (n = 1654) |
|---|---|
| OR (95% CI) | |
| Rice pattern (ref. = tertile 1) | |
| Tertile 2 | 1.16 (0.97, 1.39) |
| Tertile 3 | 1.02 (0.80, 1.30) |
| Protein-rich foods, cereal, and sugar pattern (ref. = tertile 1) | |
| Tertile 2 | 0.94 (0.77, 1.15) |
| Tertile 3 | 0.78 (0.61, 0.99) |
| Fruits and miscellaneous food pattern (ref. = tertile 1) | |
| Tertile 2 | 0.99 (0.82, 1.19) |
| Tertile 3 | 0.99 (0.82, 1.18) |
| Fish pattern (ref. = tertile 1) | |
| Tertile 2 | 0.95 (0.79, 1.13) |
| Tertile 3 | 0.86 (0.71, 1.04) |
| Vegetables and corn pattern (ref. = tertile 1) | |
| Tertile 2 | 1.28 (1.07, 1.53) |
| Tertile 3 | 1.36 (1.12, 1.64) |
| Fats and oils pattern (ref. = tertile 1) | |
| Tertile 2 | 0.84 (0.69, 1.02) |
| Tertile 3 | 0.83 (0.66, 1.03) |
Publisher’s Note: MDPI stays neutral with regard to jurisdictional claims in published maps and institutional affiliations. |
© 2022 by the authors. Licensee MDPI, Basel, Switzerland. This article is an open access article distributed under the terms and conditions of the Creative Commons Attribution (CC BY) license (https://creativecommons.org/licenses/by/4.0/).
Share and Cite
de Juras, A.R.; Hsu, W.-C.; Cheng, Y.-Y.; Ku, L.-J.E.; Yu, T.; Peng, C.-J.; Hu, S.C. Sex Differences in Dietary Patterns of Adults and Their Associations with the Double Burden of Malnutrition: A Population-Based National Survey in the Philippines. Nutrients 2022, 14, 3495. https://doi.org/10.3390/nu14173495
de Juras AR, Hsu W-C, Cheng Y-Y, Ku L-JE, Yu T, Peng C-J, Hu SC. Sex Differences in Dietary Patterns of Adults and Their Associations with the Double Burden of Malnutrition: A Population-Based National Survey in the Philippines. Nutrients. 2022; 14(17):3495. https://doi.org/10.3390/nu14173495
Chicago/Turabian Stylede Juras, Aileen Rodil, Wan-Chen Hsu, Yu-Yao Cheng, Li-Jung Elizabeth Ku, Tsung Yu, Cheau-Jane Peng, and Susan C. Hu. 2022. "Sex Differences in Dietary Patterns of Adults and Their Associations with the Double Burden of Malnutrition: A Population-Based National Survey in the Philippines" Nutrients 14, no. 17: 3495. https://doi.org/10.3390/nu14173495