
COVID-19 and Virtual Nutrition: A Pilot Study of Integrating Digital Food Models for Interactive Portion Size Education

 , ,
, ,  ,
,
Abstract
:1. Introduction
2. Materials and Methods
2.1. Participants
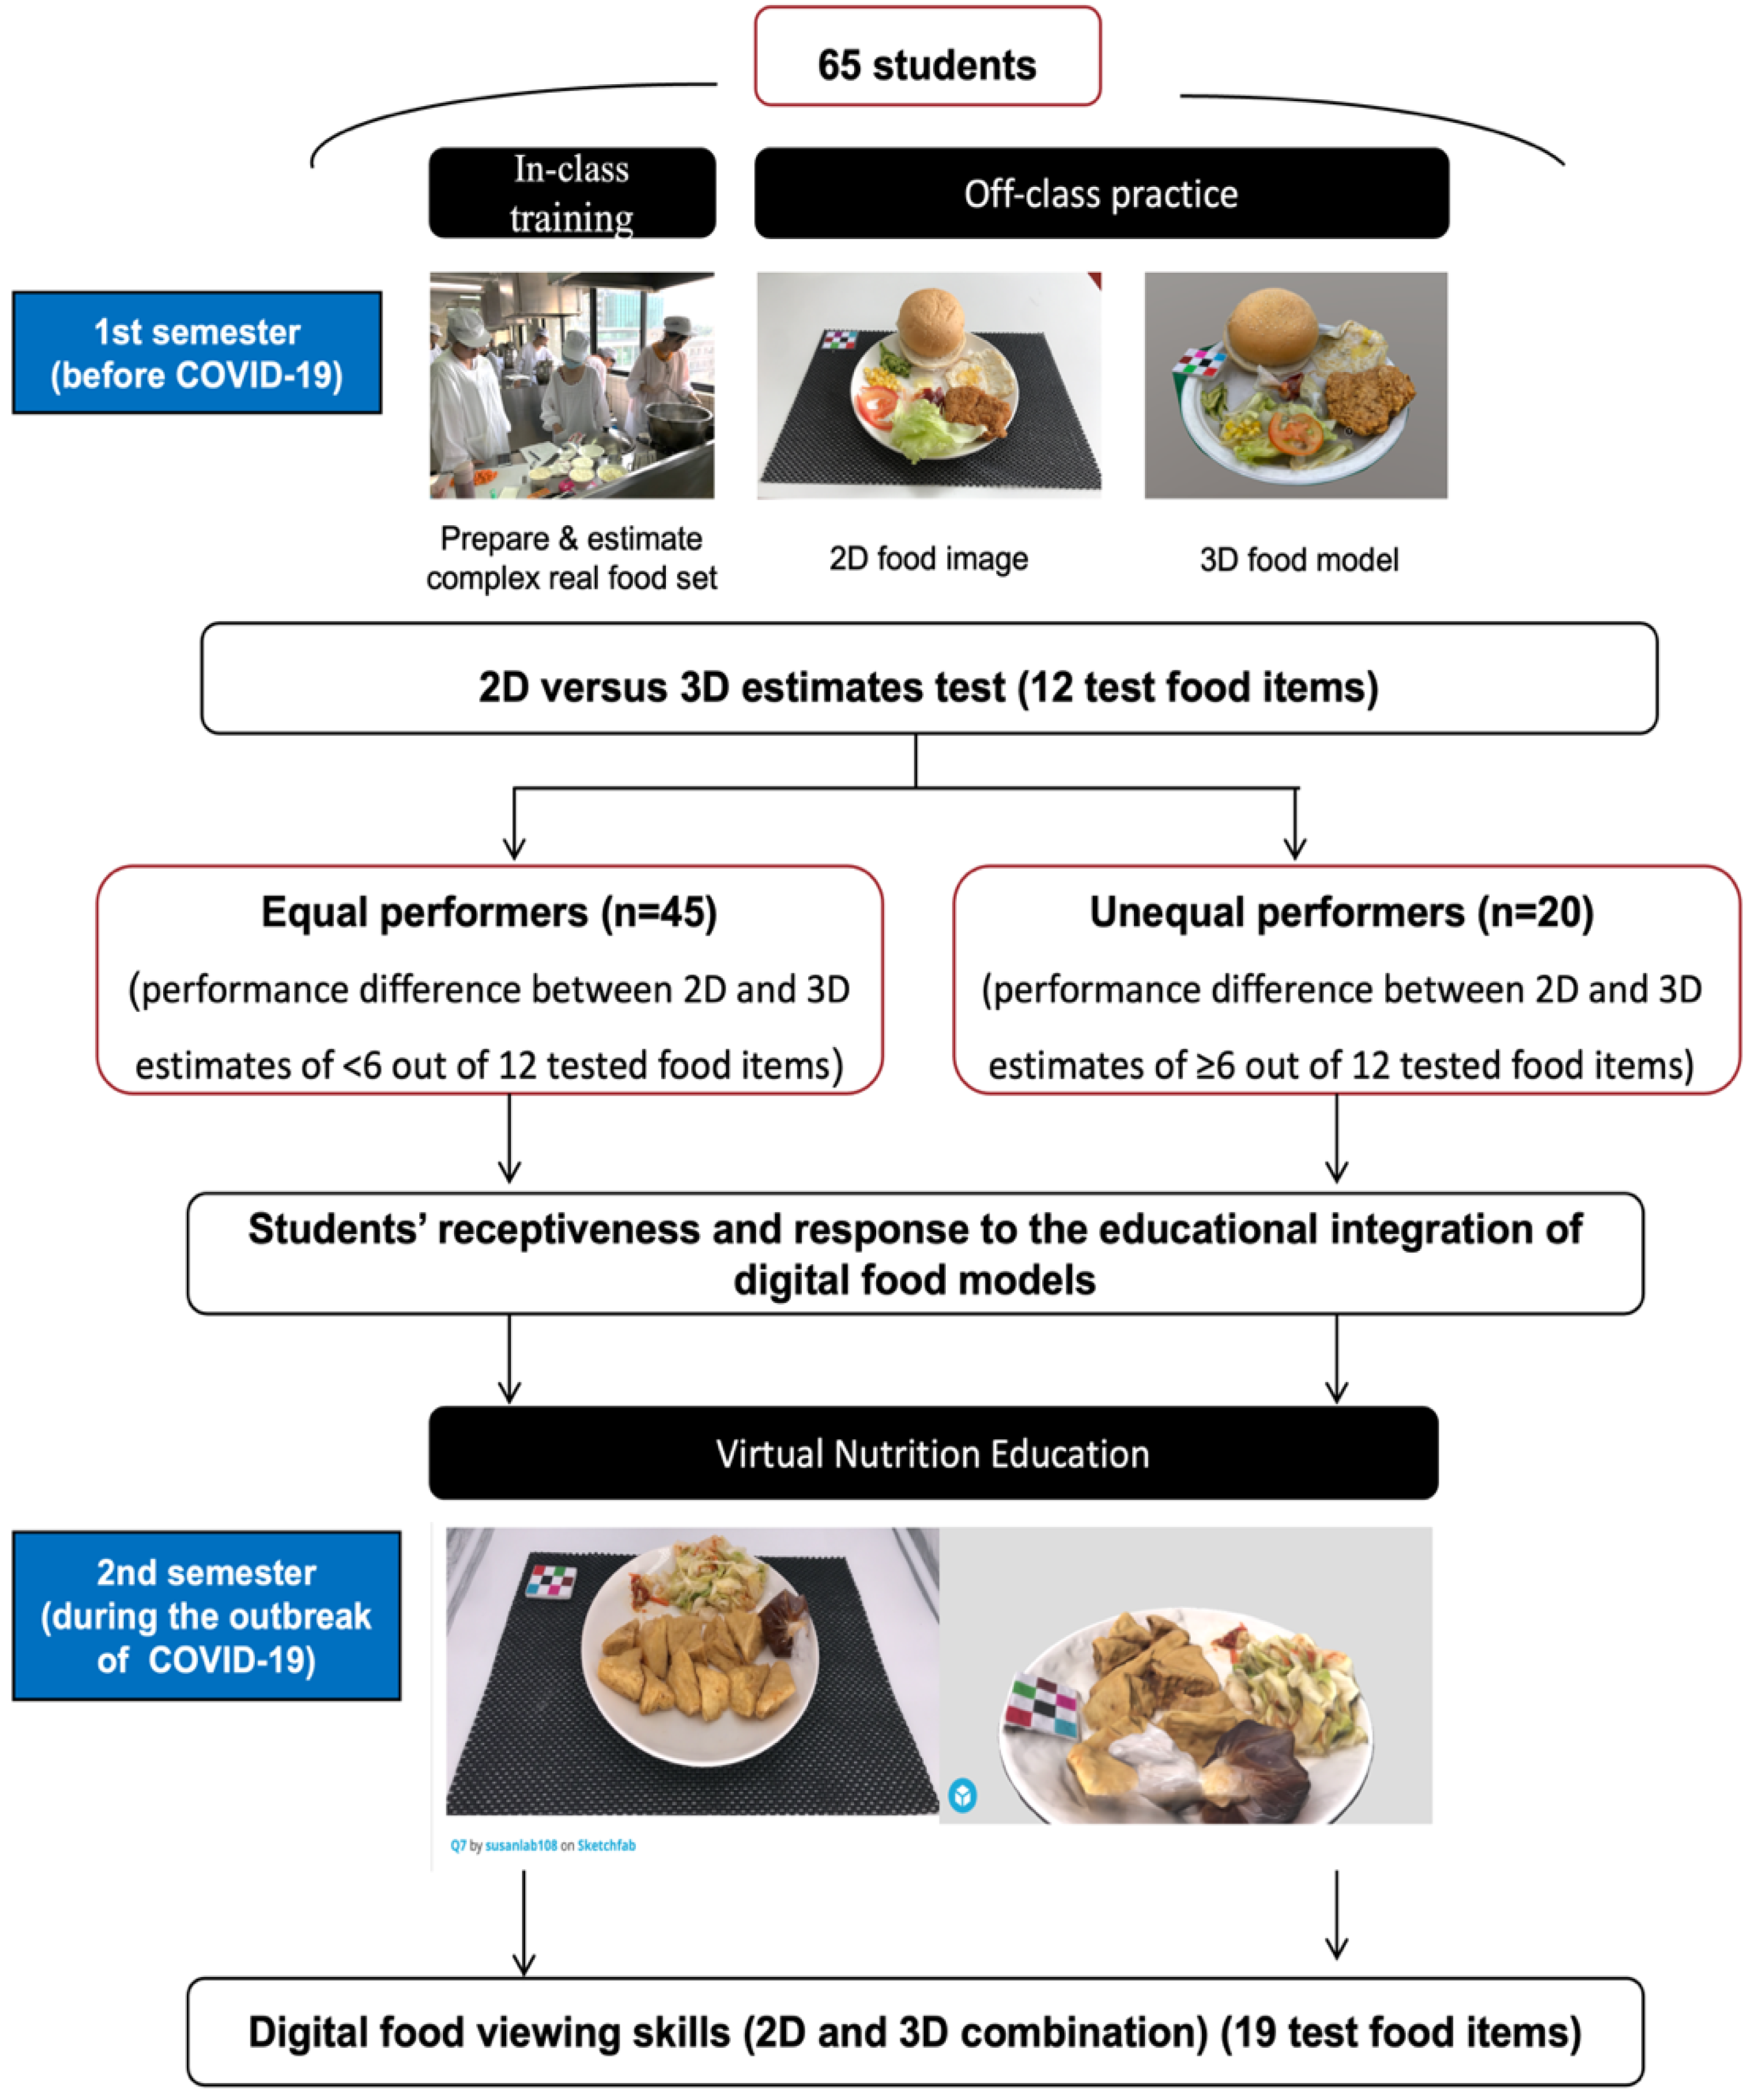
2.2. Study Design
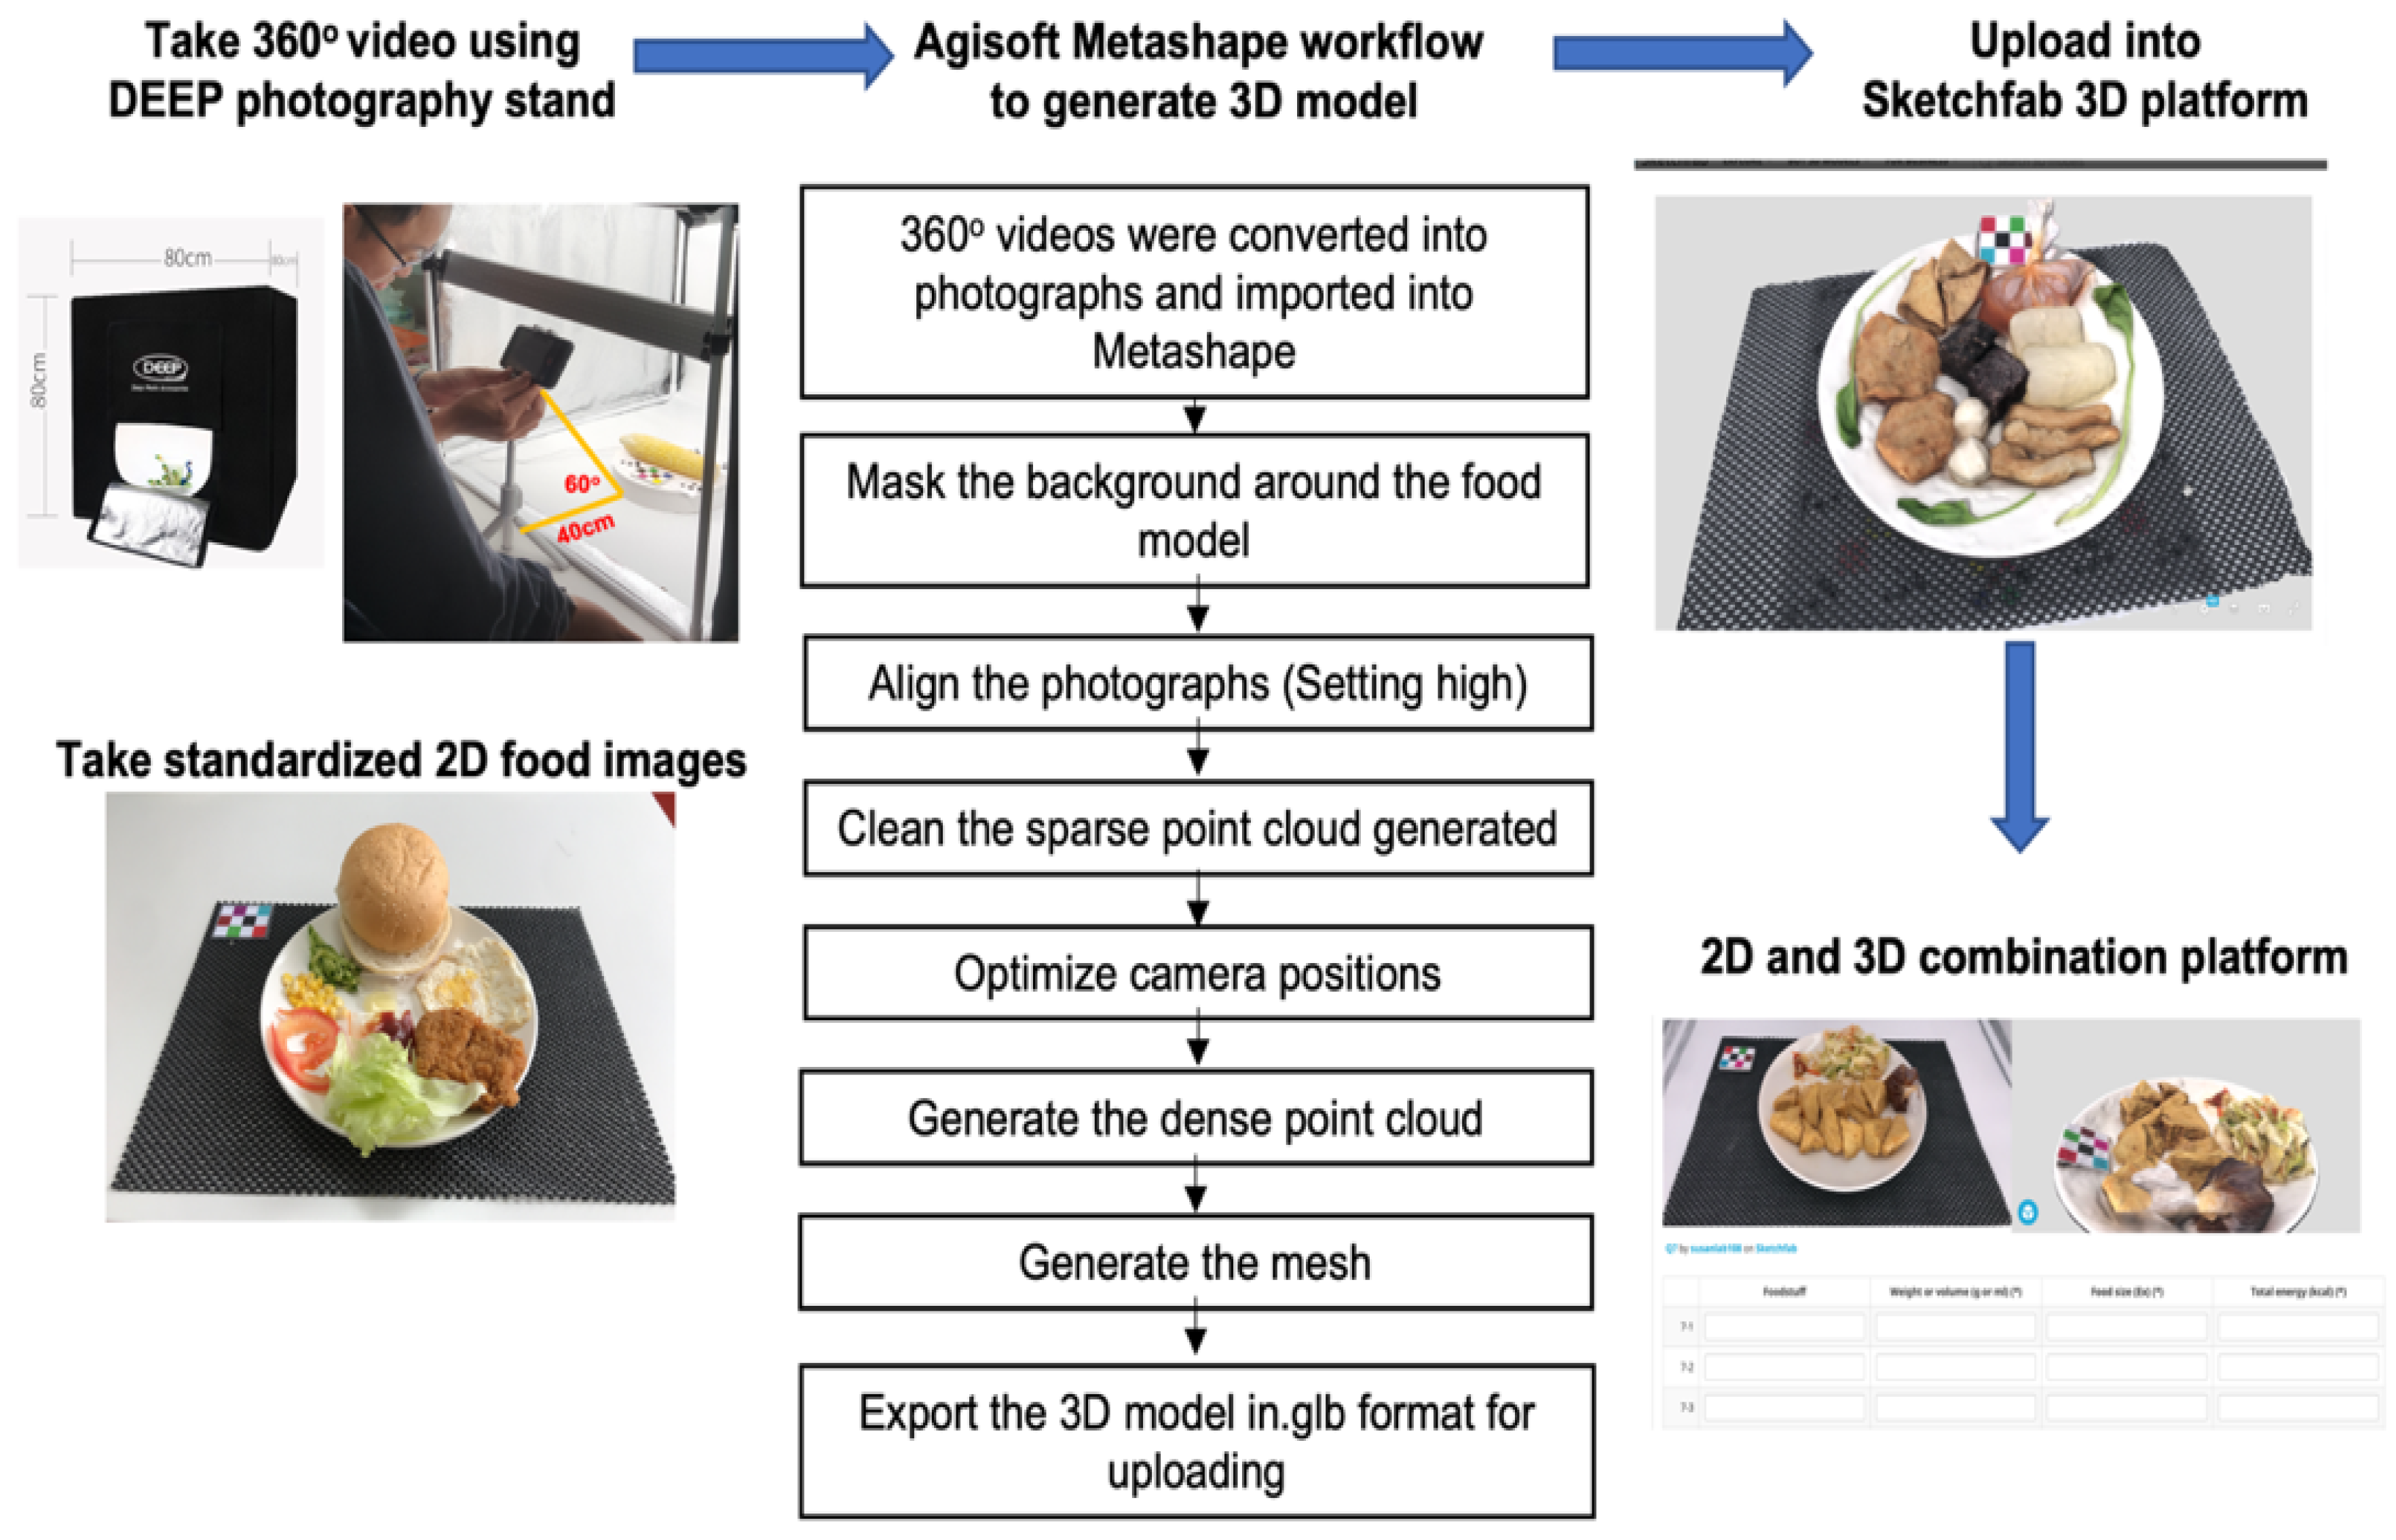
2.2.1. Integration of Digital Food Models into a Formal Dietetic Training Program
2.2.2. Evaluation of Digital Food Viewing Skills
First Semester: Comparison between 2-D and Interactive 3-D Food Models
Second Semester: Virtual Food Portion Education Using Combined (2-D and 3-D) Digital Food Models
Definition of Food Identification and Quantification Accuracy
2.3. Data Analysis
3. Results
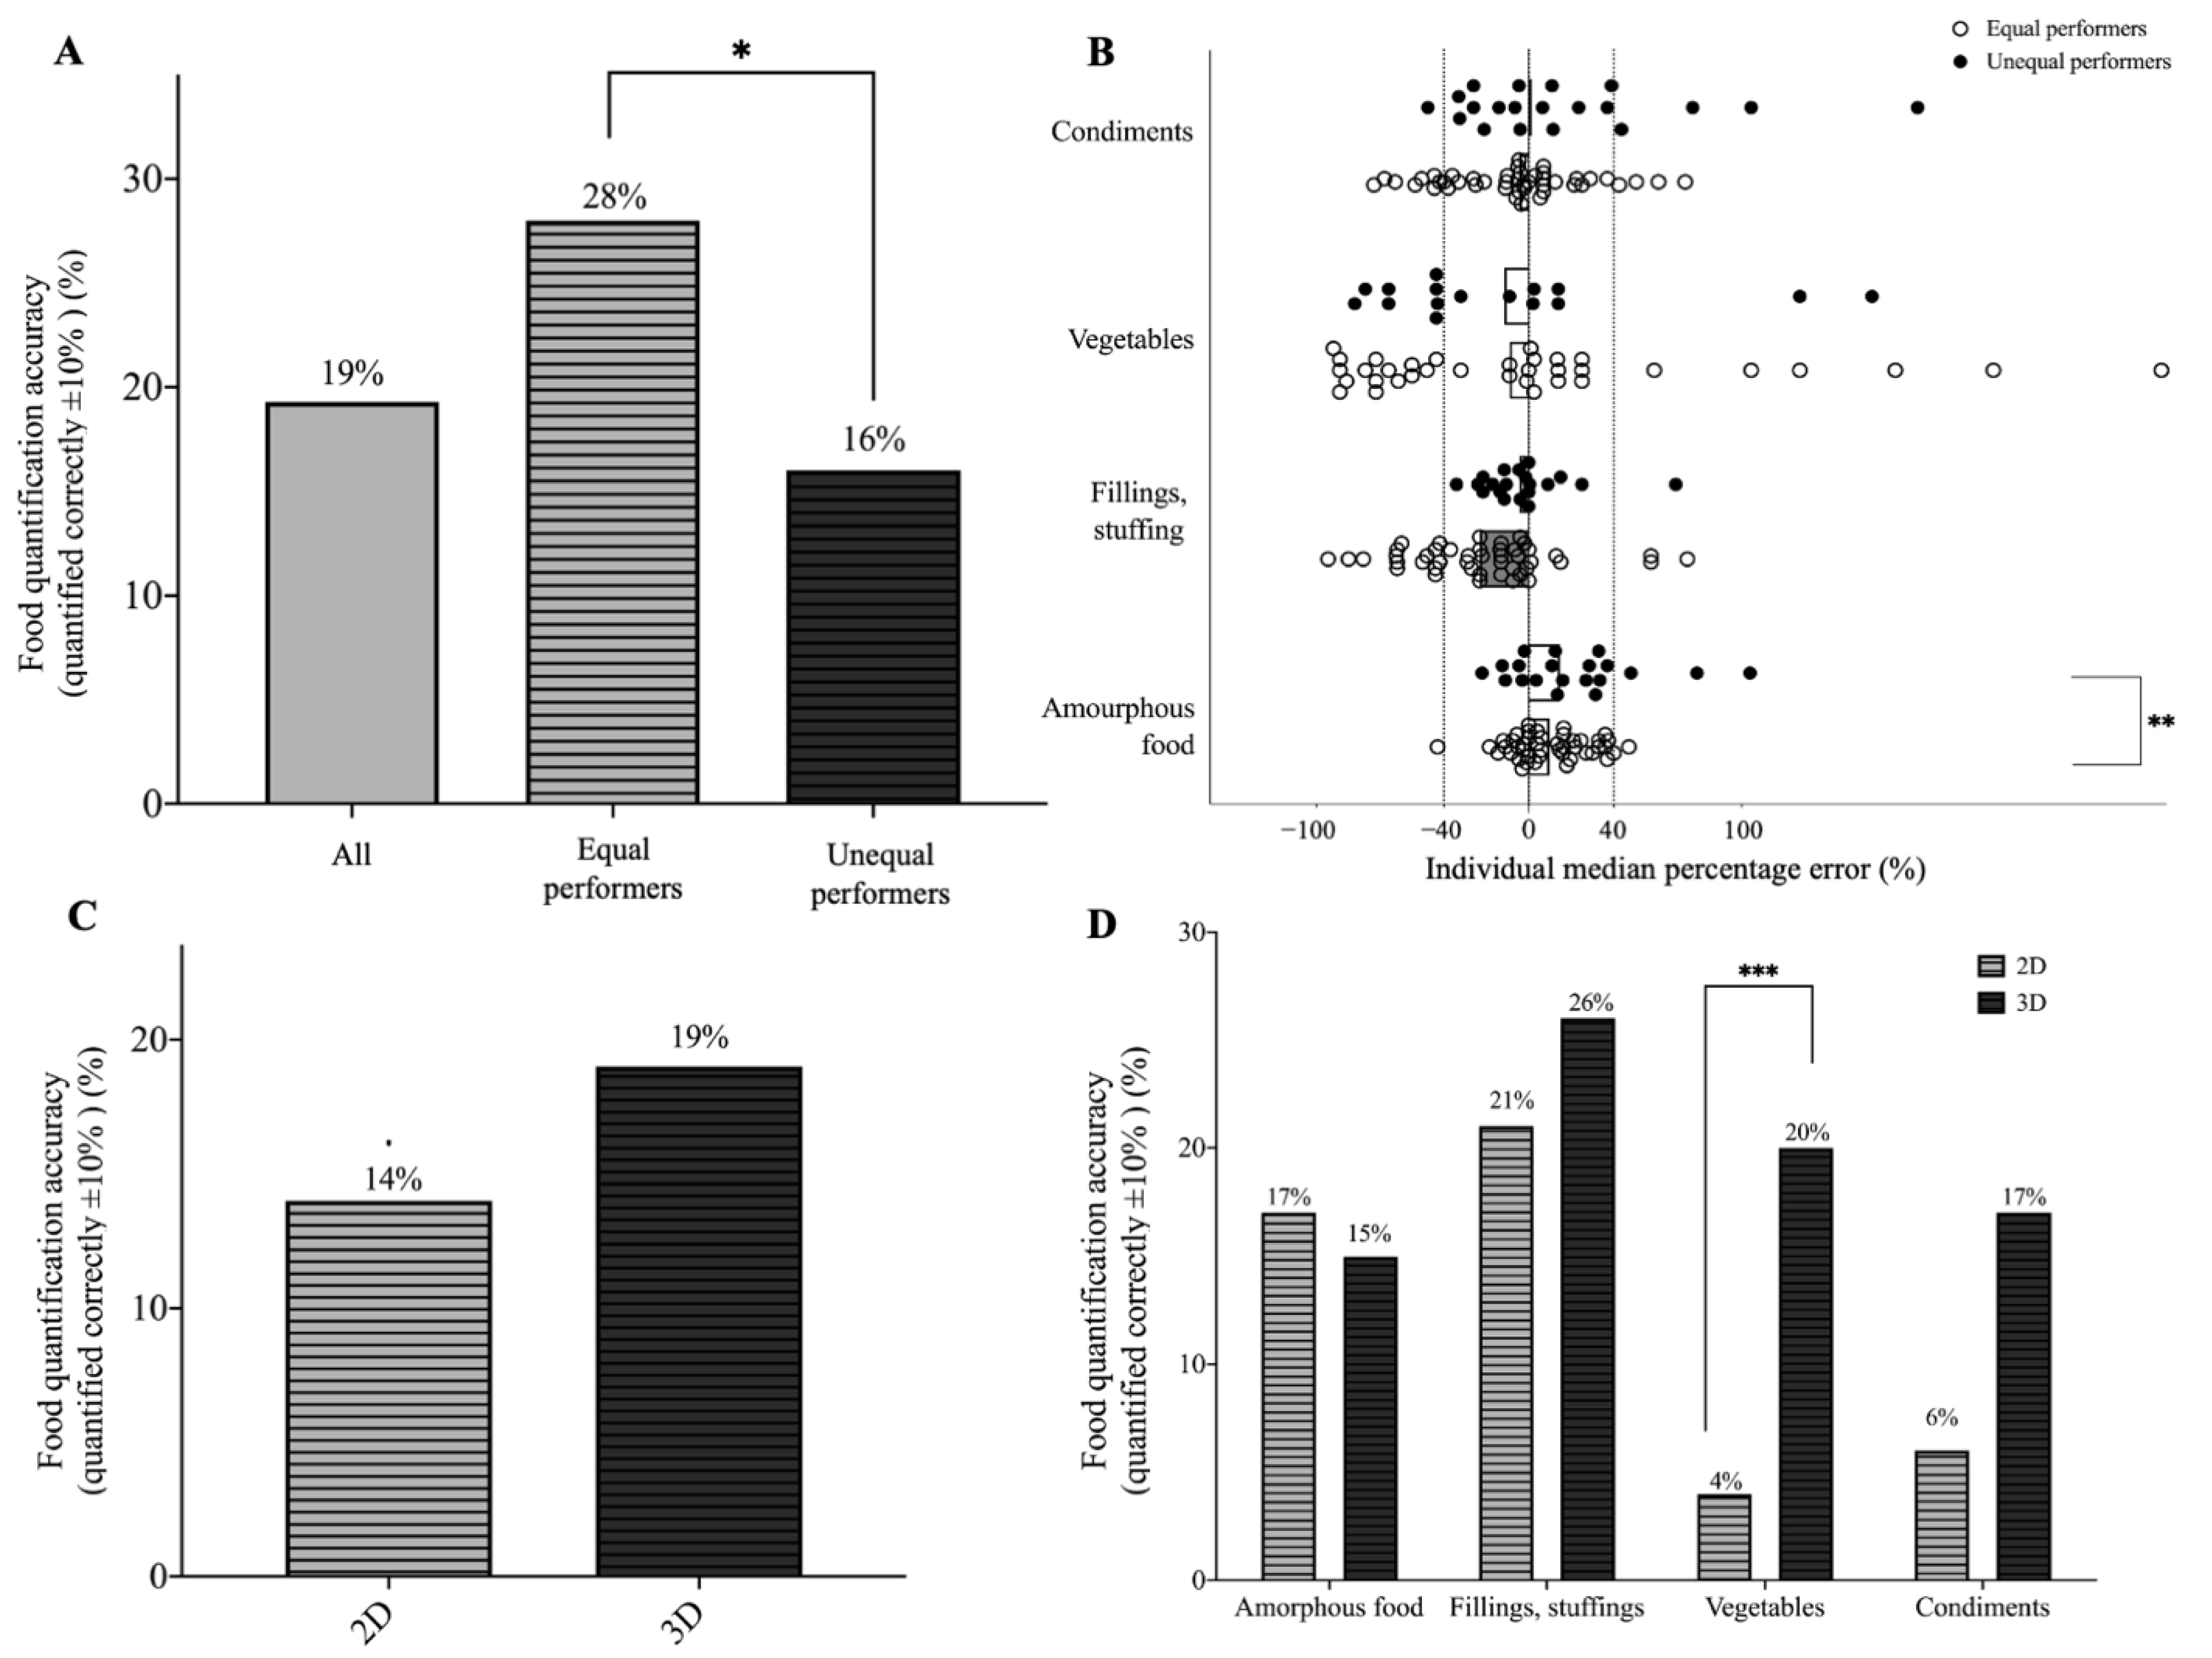
3.1. Comparison between 2-D and Interactive 3-D Digital Food Viewing Skills
3.2. Student’s Receptiveness towards Educational Integration of Digital Food Models
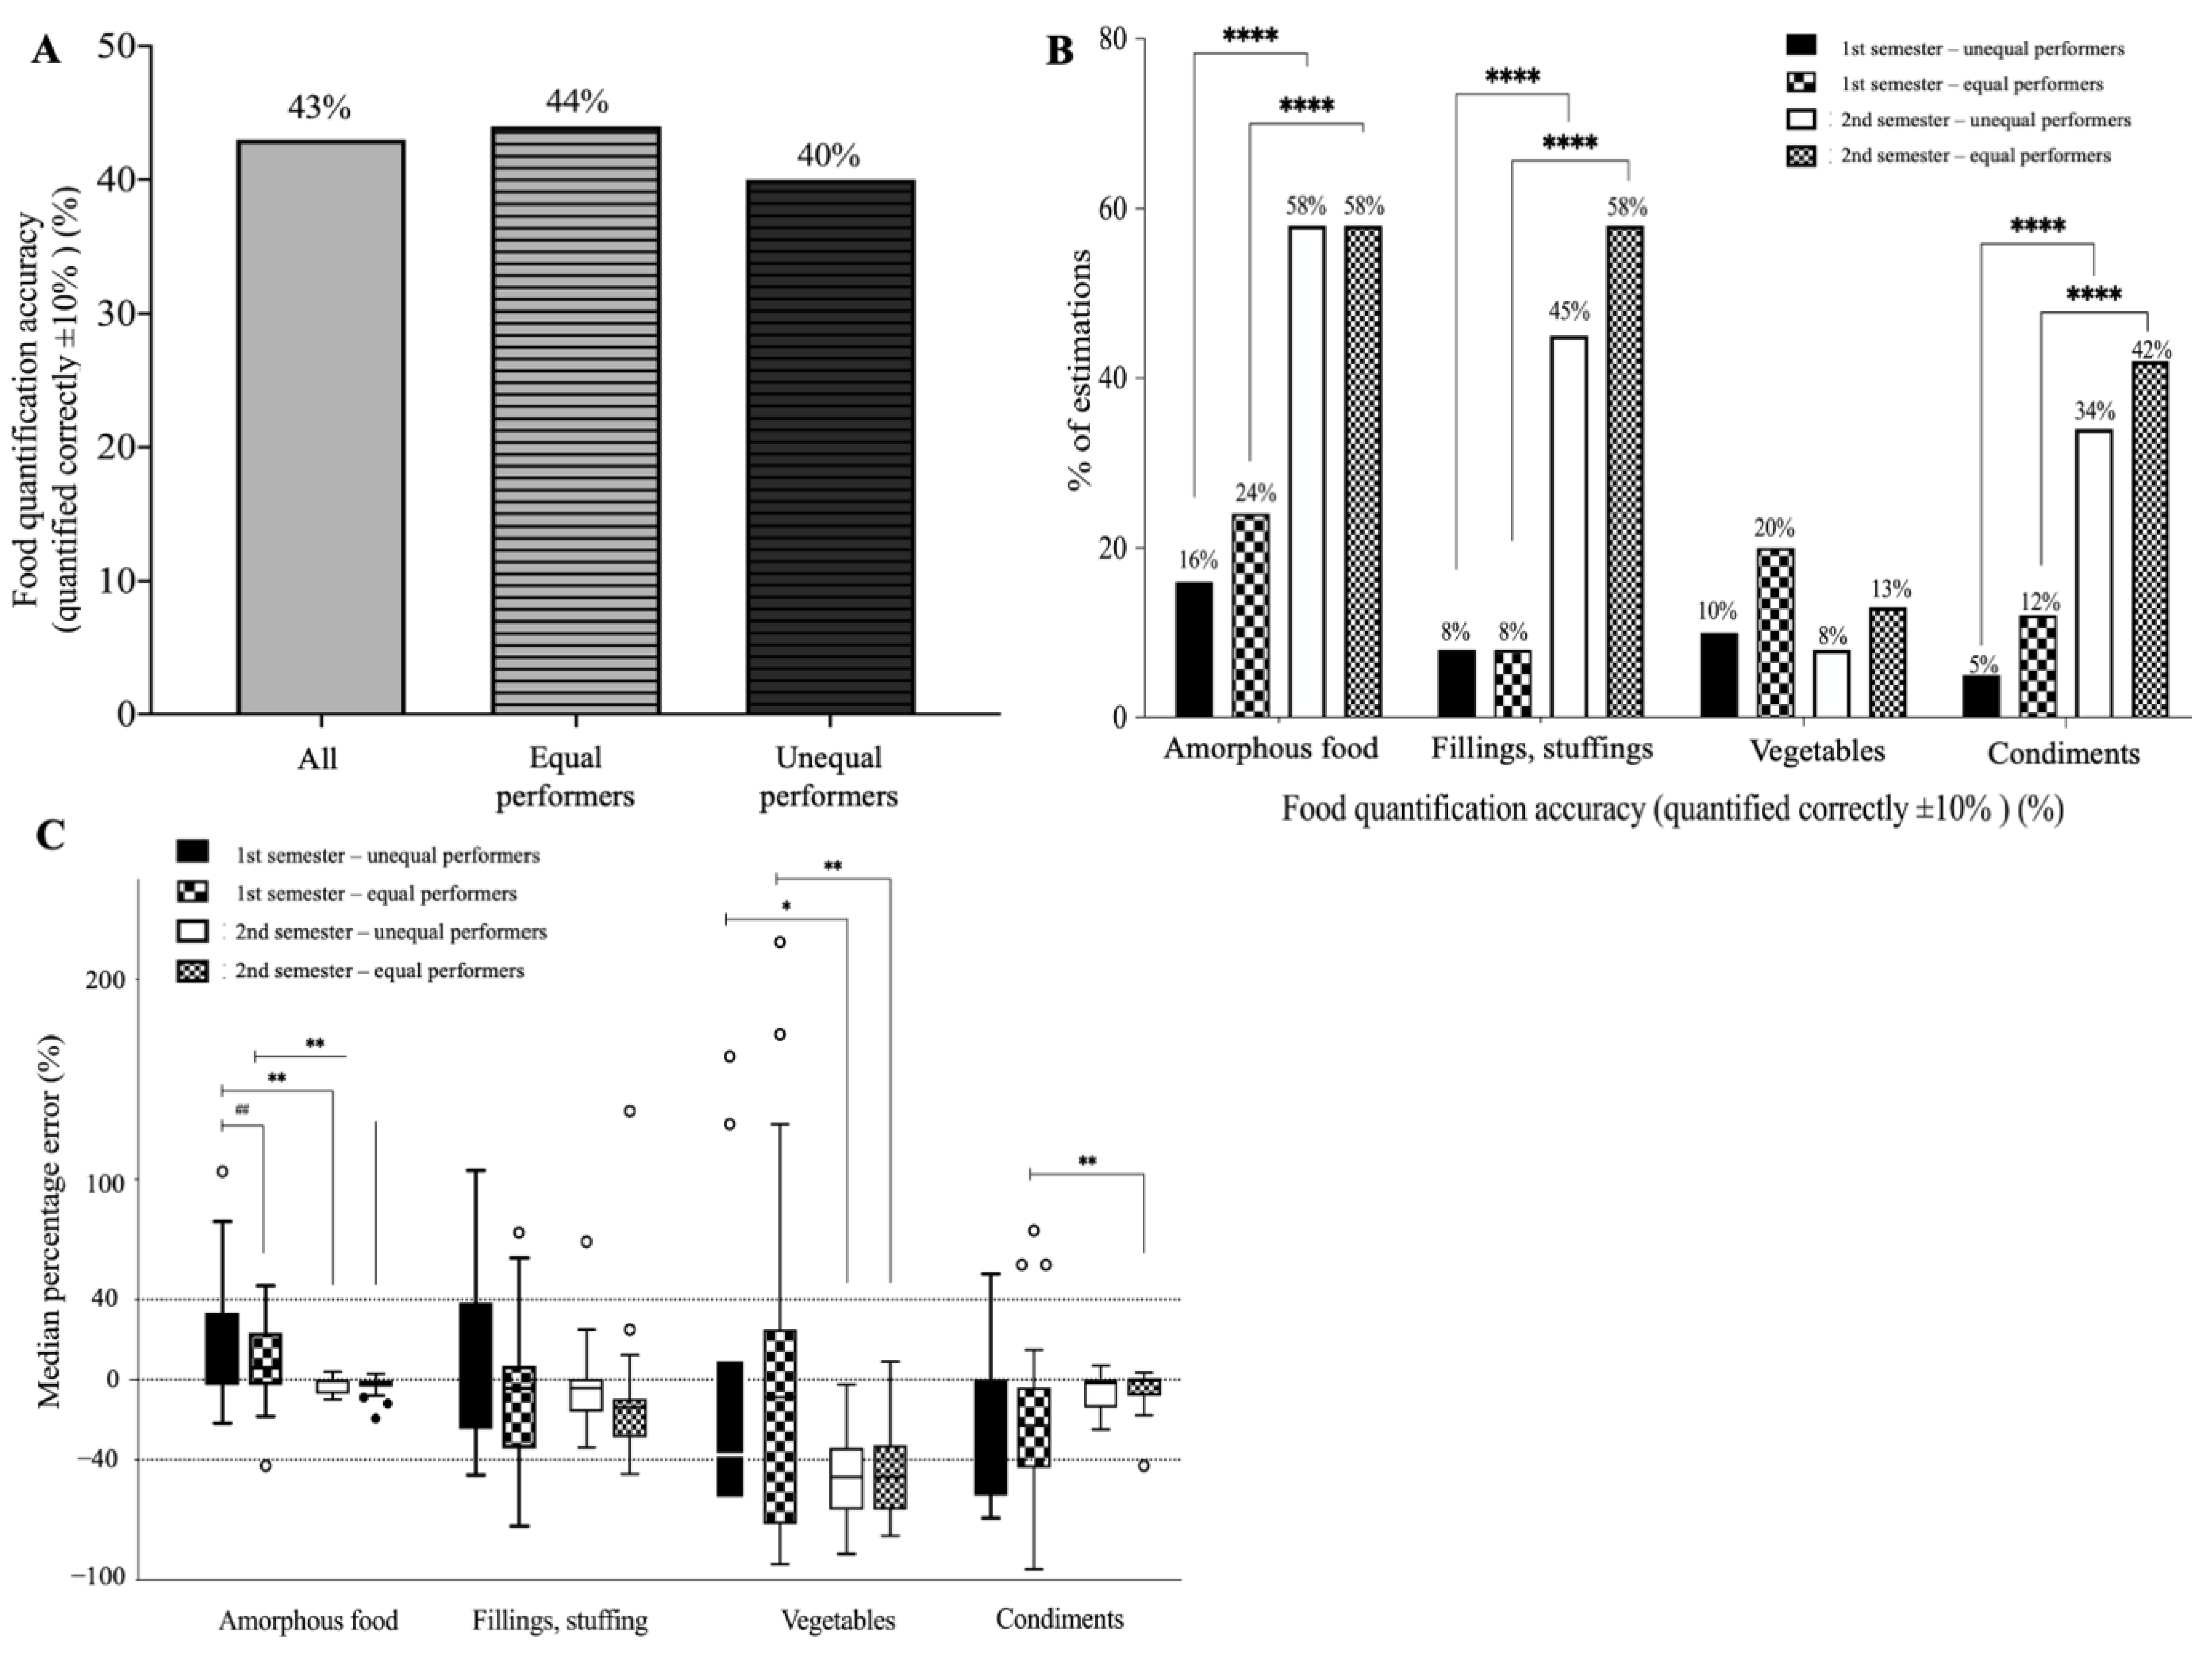
3.3. The Effectiveness of Virtual Food Portion Size Education Using Digital Food Models
4. Discussion
Strengths and Limitations
5. Conclusions
Author Contributions
Funding
Institutional Review Board Statement
Informed Consent Statement
Data Availability Statement
Acknowledgments
Conflicts of Interest
References
- de Vlieger, N.M.; Weltert, M.; Molenaar, A.; McCaffrey, T.A.; Rollo, M.E.; Truby, H.; Livingstone, B.; Kirkpatrick, S.I.; Boushey, C.J.; Kerr, D.A.; et al. A systematic review of recall errors associated with portion size estimation aids in children. Appetite 2020, 147, 104522. [Google Scholar] [CrossRef] [PubMed]
- Steyn, N.P.; Senekal, M.; Norris, S.A.; Whati, L.; MacKeown, J.M.; Nel, J.H. How well do adolescents determine portion sizes of foods and beverages? Asia Pac. J. Clin. Nutr. 2006, 15, 35–42. [Google Scholar] [PubMed]
- Szenczi-Cseh, J.; Horváth, Z.; Ambrus, Á. Validation of a food quantification picture book and portion sizes estimation applying perception and memory methods. Int. J. Food Sci. Nutr. 2017, 68, 960–972. [Google Scholar] [CrossRef]
- Korkalo, L.; Erkkola, M.; Fidalgo, L.; Nevalainen, J.; Mutanen, M. Food photographs in portion size estimation among adolescent Mozambican girls. Public Health Nutr. 2013, 16, 1558–1564. [Google Scholar] [CrossRef] [PubMed]
- Matheson, D.M.; Hanson, K.A.; McDonald, T.E.; Robinson, T.N. Validity of Children′s Food Portion Estimates: A Comparison of 2 Measurement Aids. Arch. Pediatrics Adolesc. Med. 2002, 156, 867–871. [Google Scholar] [CrossRef]
- Lanerolle, P.; Thoradeniya, T.; de Silva, A. Food models for portion size estimation of Asian foods. J. Hum. Nutr. Diet. 2013, 26, 380–386. [Google Scholar] [CrossRef] [PubMed]
- Martin, C.K.; Correa, J.B.; Han, H.; Allen, H.R.; Rood, J.C.; Champagne, C.M.; Gunturk, B.K.; Bray, G.A. Validity of the Remote Food Photography Method (RFPM) for estimating energy and nutrient intake in near real-time. Obesity 2012, 20, 891–899. [Google Scholar] [CrossRef] [PubMed]
- Ashman, A.M.; Collins, C.E.; Brown, L.J.; Rae, K.M.; Rollo, M.E. Validation of a Smartphone Image-Based Dietary Assessment Method for Pregnant Women. Nutrients 2017, 9, 73. [Google Scholar] [CrossRef] [PubMed]
- Rollo, M.E.; Ash, S.; Lyons-Wall, P.; Russell, A. Trial of a mobile phone method for recording dietary intake in adults with type 2 diabetes: Evaluation and implications for future applications. J. Telemed. Telecare 2011, 17, 318–323. [Google Scholar] [CrossRef] [PubMed]
- Ho, D.K.N.; Tseng, S.-H.; Wu, M.-C.; Shih, C.-K.; Atika, A.P.; Chen, Y.-C.; Chang, J.-S. Validity of image-based dietary assessment methods: A systematic review and meta-analysis. Clin. Nutr. 2020, 39, 2945–2959. [Google Scholar] [CrossRef]
- Ho, D.K.; Chiu, W.-C.; Lee, Y.-C.; Su, H.-Y.; Chang, C.-C.; Yao, C.-Y.; Hua, K.-L.; Chu, H.-K.; Hsu, C.-Y.; Chang, J.-S. Integration of an Image-Based Dietary Assessment Paradigm into Dietetic Training Improves Food Portion Estimates by Future Dietitians. Nutrients 2021, 13, 175. [Google Scholar] [CrossRef]
- Howes, E.; Boushey, C.J.; Kerr, D.A.; Tomayko, E.J.; Cluskey, M. Image-Based Dietary Assessment Ability of Dietetics Students and Interns. Nutrients 2017, 9, 114. [Google Scholar] [CrossRef] [PubMed]
- Fatehah, A.A.; Poh, B.K.; Shanita, S.N.; Wong, J.E. Feasibility of Reviewing Digital Food Images for Dietary Assessment among Nutrition Professionals. Nutrients 2018, 10, 984. [Google Scholar] [CrossRef] [PubMed]
- Nelson, M.; Atkinson, M.; Darbyshire, S. Food photography II: Use of food photographs for estimating portion size and the nutrient content of meals. Br. J. Nutr. 1996, 76, 31–49. [Google Scholar] [CrossRef]
- Lam, M.C.; Suwadi, N.A.; Mohd Zainul Arifien, A.H.; Poh, B.K.; Safii, N.S.; Wong, J.E. An evaluation of a virtual atlas of portion sizes (VAPS) mobile augmented reality for portion size estimation. Virtual Real. 2021, 25, 695–707. [Google Scholar] [CrossRef]
- Erolin, C. Interactive 3D Digital Models for Anatomy and Medical Education. In Biomedical Visualisation; Rea, P.M., Ed.; Springer International Publishing: Cham, Switzerland, 2019; Volume 2, pp. 1–16. [Google Scholar]
- Chanlin, L.-J.; Chan, K.-C. Augmented Reality Applied in Dietary Monitoring. Libri 2018, 68, 137–147. [Google Scholar] [CrossRef]
- Narumi, T.; Ban, Y.; Kajinami, T.; Tanikawa, T.; Hirose, M. Augmented perception of satiety: Controlling food consumption by changing apparent size of food with augmented reality. In Proceedings of the SIGCHI Conference on Human Factors in Computing Systems, Austin, TX, USA, 15–17 March 1982; pp. 109–118. [Google Scholar]
- Dinic, R.; Stütz, T. EatAR Tango: Results on the Accuracy of Portion Estimation. In Proceedings of the 2017 IEEE International Symposium on Mixed and Augmented Reality (ISMAR-Adjunct), Nantes, France, 9–13 October 2017; pp. 284–287. [Google Scholar]
- Rollo, M.E.; Bucher, T.; Smith, S.P.; Collins, C.E. ServAR: An augmented reality tool to guide the serving of food. Int. J. Behav. Nutr. Phys. Act. 2017, 14, 65. [Google Scholar] [CrossRef] [PubMed]
- Stokes, D.C. Senior Medical Students in the COVID-19 Response: An Opportunity to Be Proactive. Acad. Emerg. Med. 2020, 27, 343–345. [Google Scholar] [CrossRef] [PubMed]
- Khanna, N.; Boushey, C.J.; Kerr, D.; Okos, M.; Ebert, D.S.; Delp, E.J. An Overview of The Technology Assisted Dietary Assessment Project at Purdue University. In Proceedings of the IEEE International Symposium on Multimedia, Taichung, Taiwan, 13–15 December 2010; pp. 290–295. [Google Scholar] [CrossRef]
- Prinz, N.; Bohn, B.; Kern, A.; Püngel, D.; Pollatos, O.; Holl, R.W. Feasibility and relative validity of a digital photo-based dietary assessment: Results from the Nutris-Phone study. Public Health Nutr. 2019, 22, 1160–1167. [Google Scholar] [CrossRef] [PubMed]
- Arroyo, M.; de la Pera, C.M.; Ansotegui, L.; Rocandio, A.M. A short training program improves the accuracy of portion-size estimates in future dietitians. Arch Latinoam Nutr. 2007, 57, 163–167. [Google Scholar] [PubMed]
- Japur, C.C.; Diez-Garcia, R.W. Food energy content influences food portion size estimation by nutrition students. J. Hum. Nutr. Diet. 2010, 23, 272–276. [Google Scholar] [CrossRef] [PubMed]
- Vasiloglou, M.F.; Mougiakakou, S.; Aubry, E.; Bokelmann, A.; Fricker, R.; Gomes, F.; Guntermann, C.; Meyer, A.; Studerus, D.; Stanga, Z. A Comparative Study on Carbohydrate Estimation: GoCARB vs. Dietitians. Nutrients 2018, 10, 741. [Google Scholar] [CrossRef] [PubMed]
- Höchsmann, C.; Martin, C.K. Review of the validity and feasibility of image-assisted methods for dietary assessment. Int. J. Obes. 2020, 44, 2358–2371. [Google Scholar] [CrossRef] [PubMed]
- Chung, L.M.; Chung, J.W. Tele-Dietetics with Food Images as Dietary Intake Record in Nutrition Assessment. Telemed. J. E-Health 2010, 16, 691–698. [Google Scholar] [CrossRef] [PubMed]
- Dixit, I.; Kennedy, S.; Piemontesi, J.; Kennedy, B.; Krebs, C. Which Tool Is Best: 3D Scanning or Photogrammetry–It Depends on the Task. In Biomedical Visualisation; Rea, P.M., Ed.; Springer International Publishing: Cham, Switzerland, 2019; Volume 1, pp. 107–119. [Google Scholar]


| Food Set | 2-D | 3-D | Chi-Squared Test g | Spearman Correlation f | ||||||||
|---|---|---|---|---|---|---|---|---|---|---|---|---|
| Identified Correctly (%) | Quantified Correctly ±10% (%) | Over- | Under- | Omitted (%) | Identified Correctly (%) a | Quantified Correctly ±10% (%) b | Over- | Under- | Omitted (%) e | r; p Value g | ||
| Estimated (%) | Estimated (%) | Estimated (%) c | Estimated (%) d | |||||||||
| Sweet corn | 100.0% | 21% | 78% | 1% | 0% | 100.0% | 18% | 81% | 2% | 0% | 0.535 | 0.895; p < 0.0001 |
| Sweet potato | 100.0% | 6% | 45% | 49% | 0% | 99.0% | 6% | 48% | 46% | 0% | NA | 0.901; p < 0.0001 |
| Red beans | 99.0% | 21% | 25% | 54% | 0% | 100.0% | 24% | 24% | 52% | 0% | 0.508 | 0.779; p < 0.0001 |
| Sugar | 81.0% | 12% | 10% | 60% | 18% | 85.0% | 15% | 9% | 60% | 16% | 0.563 | 0.692; p < 0.0001 |
| Red bean cake | 99.0% | 24% | 46% | 28% | 1% | 55.0% | 19% | 43% | 36% | 2% | 0.410 | 0.704; p < 0.0001 |
| Wonton | 87.0% | 33% | 40% | 12% | 15% | 88.0% | 31% | 39% | 15% | 15% | 0.752 | 0.796; p < 0.0001 |
| Noodles | 97.0% | 25% | 36% | 37% | 1% | 99.0% | 30% | 37% | 31% | 1% | 0.453 | 0.782; p < 0.0001 |
| Pork stuffing | 90.0% | 22% | 42% | 25% | 10% | 88.0% | 24% | 46% | 19% | 12% | 0.766 | 0.745; p < 0.0001 |
| Chicken leg | 95.0% | 19% | 45% | 31% | 5% | 88.0% | 16% | 48% | 31% | 4% | 0.575 | 0.782; p < 0.0001 |
| Oil | 57.0% | 36% | 16% | 1% | 46% | 57.0% | 30% | 22% | 1% | 46% | 0.236 | 0.937; p < 0.0001 |
| Sauce | 81.0% | 4% | 15% | 51% | 30% | 85.0% | 3% | 22% | 45% | 30% | 0.436 | 0.795; p < 0.0001 |
| Vegetables | 73.1% | 9% | 24% | 42% | 25% | 61.9% | 15% | 22% | 37% | 15% | 0.181 | 0.876; p < 0.0001 |
| Overall | 89.2% | 19.4% | 35.2% | 32.7% | 12.7% | 84.9% | 19.3% | 36.8% | 31.3% | 11.8% | 0.968 | |
| All (n = 65) | Equal Performers (n = 45) | Unequal Performers (n = 20) | p Value a | |
|---|---|---|---|---|
| 1. Which method was easier to identify food items? | ||||
| Real food | 31% (20/65) | 27% (12/45) | 40% (8/20) | 0.383 |
| 2-D food image | 23% (15/65) | 22% (10/45) | 25% (5/20) | 0.99 |
| Interactive 3-D food model | 5% (3/65) | 7% (3/45) | 0% (0/20) | 0.547 |
| No difference between 2-D and 3-D | 28% (18/65) | 27% (12/45) | 30% (6/20) | 0.773 |
| 2-D and 3-D combination | 14% (9/65) | 18% (8/45) | 5% (1/20) | 0.255 |
| 2. Which method was easier to quantify food items? | ||||
| Real food | 38% (25/65) | 38% (17/45) | 40% (8/20) | 0.987 |
| 2-D food image | 11% (7/65) | 13% (6/45) | 5% (1/20) | 0.423 |
| Interactive 3-D food model | 3% (2/65) | 4% (2/45) | 0% (0/20) | 0.9 |
| No difference between 2-D and 3-D | 18% (12/65) | 18% (8/45) | 20% (4/20) | 0.921 |
| 2-D and 3-D combination | 26% (17/45) | 22% (10/45) | 35% (7/20) | 0.361 |
| 3. Which approach was helpful to conduct virtual “dietary assessment” training? | ||||
| 2-D food image | 15% (10/65) | 18% (8/45) | 10% (2/20) | 0.711 |
| Interactive 3-D food model | 3% (2/65) | 2% (1/45) | 5% (1/20) | 0.524 |
| 2-D and 3-D combination | 71% (46/65) | 67% (30/45) | 80% (16/20) | 0.413 |
| None of them | 11% (7/65) | 13% (6/45) | 5% (1/20) | 0.788 |
| 4. Do you think 2-D or 3-D training should be retained in the classroom in the future? | ||||
| 2-D food image | 12% (8/65) | 13% (6/45) | 10% (2/20) | 0.711 |
| Interactive 3-D food model | 3% (2/65) | 4% (2/45) | 0% (0/20) | 0.988 |
| 2-D and 3-D combination | 82% (53/65) | 78% (35/45) | 90% (18/20) | 0.768 |
| None of them | 3% (2/65) | 4% (2/45) | 0% (0/20) | 0.988 |
| Food Item | Number of Estimates | Median [IQR] Percentage Error (%) | Food Identification Accuracy (%) a | Quantified Correctly ±10% (%) b | Over-Estimated (%) c | Under-Estimated (%) d | Omitted e |
|---|---|---|---|---|---|---|---|
| Sweet potato | 58 | −9 [−25; 16] | 74% | 43% | 24% | 24% | 10% |
| Rice | 195 | 0 [−2; 0] | 100% | 95% | 1% | 5% | 0% |
| Noodles | 65 | 0 [−17; 4] | 100% | 63% | 9% | 28% | 0% |
| Burger | 65 | 4 [−3; 29] | 100% | 51% | 35% | 14% | 0% |
| Dumplings | 65 | −53 [−68; −43] | 100% | 6% | 2% | 92% | 0% |
| Bun | 65 | 0 [−3; 0] | 100% | 9% | 2% | 89% | 0% |
| Tempura | 65 | −27 [−37; −12] | 100% | 18% | 8% | 74% | 0% |
| Chicken | 65 | 0 [−3; 0] | 100% | 86% | 5% | 9% | 0% |
| Pork stuffing | 130 | −6 [−29; 0] | 100% | 54% | 23% | 23% | 0% |
| Fish | 65 | 0 [−2; 3] | 100% | 75% | 6% | 18% | 0% |
| Beef | 65 | −6 [−17; −0.5] | 100% | 71% | 2% | 28% | 0% |
| Egg | 130 | 0 [−5; 18] | 100% | 85% | 15% | 0% | 0% |
| Oysters | 58 | −21 [−21; 18] | 92% | 21% | 22% | 52% | 5% |
| Tofu | 50 | 7 [−3; 46] | 79% | 50% | 32% | 8% | 5% |
| Vegetables | 202 | −50 [−69; −27] | 77% | 11% | 4% | 61% | 23% |
| Sauce | 58 | 16.5 [−58; 150] | 91% | 26% | 36% | 30% | 8% |
| Mayonnaise | 44 | 50 [37; 71] | 68% | 0% | 0% | 71% | 29% |
| Coating | 46 | −31 [−47; −31] | 72% | 0% | 74% | 5% | 23% |
| Oil | 366 | 0 [−14; 0] | 85% | 51% | 10% | 29% | 10% |
| Overall | 91.50% | 42.90% | 16.30% | 35.00% | 6.0% |
Publisher’s Note: MDPI stays neutral with regard to jurisdictional claims in published maps and institutional affiliations. |
© 2022 by the authors. Licensee MDPI, Basel, Switzerland. This article is an open access article distributed under the terms and conditions of the Creative Commons Attribution (CC BY) license (https://creativecommons.org/licenses/by/4.0/).
Share and Cite
Ho, D.K.N.; Lee, Y.-C.; Chiu, W.-C.; Shen, Y.-T.; Yao, C.-Y.; Chu, H.-K.; Chu, W.-T.; Le, N.Q.K.; Nguyen, H.T.; Su, H.-Y.; et al. COVID-19 and Virtual Nutrition: A Pilot Study of Integrating Digital Food Models for Interactive Portion Size Education. Nutrients 2022, 14, 3313. https://doi.org/10.3390/nu14163313
Ho DKN, Lee Y-C, Chiu W-C, Shen Y-T, Yao C-Y, Chu H-K, Chu W-T, Le NQK, Nguyen HT, Su H-Y, et al. COVID-19 and Virtual Nutrition: A Pilot Study of Integrating Digital Food Models for Interactive Portion Size Education. Nutrients. 2022; 14(16):3313. https://doi.org/10.3390/nu14163313
Chicago/Turabian StyleHo, Dang Khanh Ngan, Yu-Chieh Lee, Wan-Chun Chiu, Yi-Ta Shen, Chih-Yuan Yao, Hung-Kuo Chu, Wei-Ta Chu, Nguyen Quoc Khanh Le, Hung Trong Nguyen, Hsiu-Yueh Su, and et al. 2022. "COVID-19 and Virtual Nutrition: A Pilot Study of Integrating Digital Food Models for Interactive Portion Size Education" Nutrients 14, no. 16: 3313. https://doi.org/10.3390/nu14163313