
Validating Accuracy of an Internet-Based Application against USDA Computerized Nutrition Data System for Research on Essential Nutrients among Social-Ethnic Diets for the E-Health Era


Abstract
:1. Introduction
2. Materials and Methods
2.1. Social-Ethnic Diets
2.2. Dietary Measures and Nutrient Intake
2.3. Data Analysis
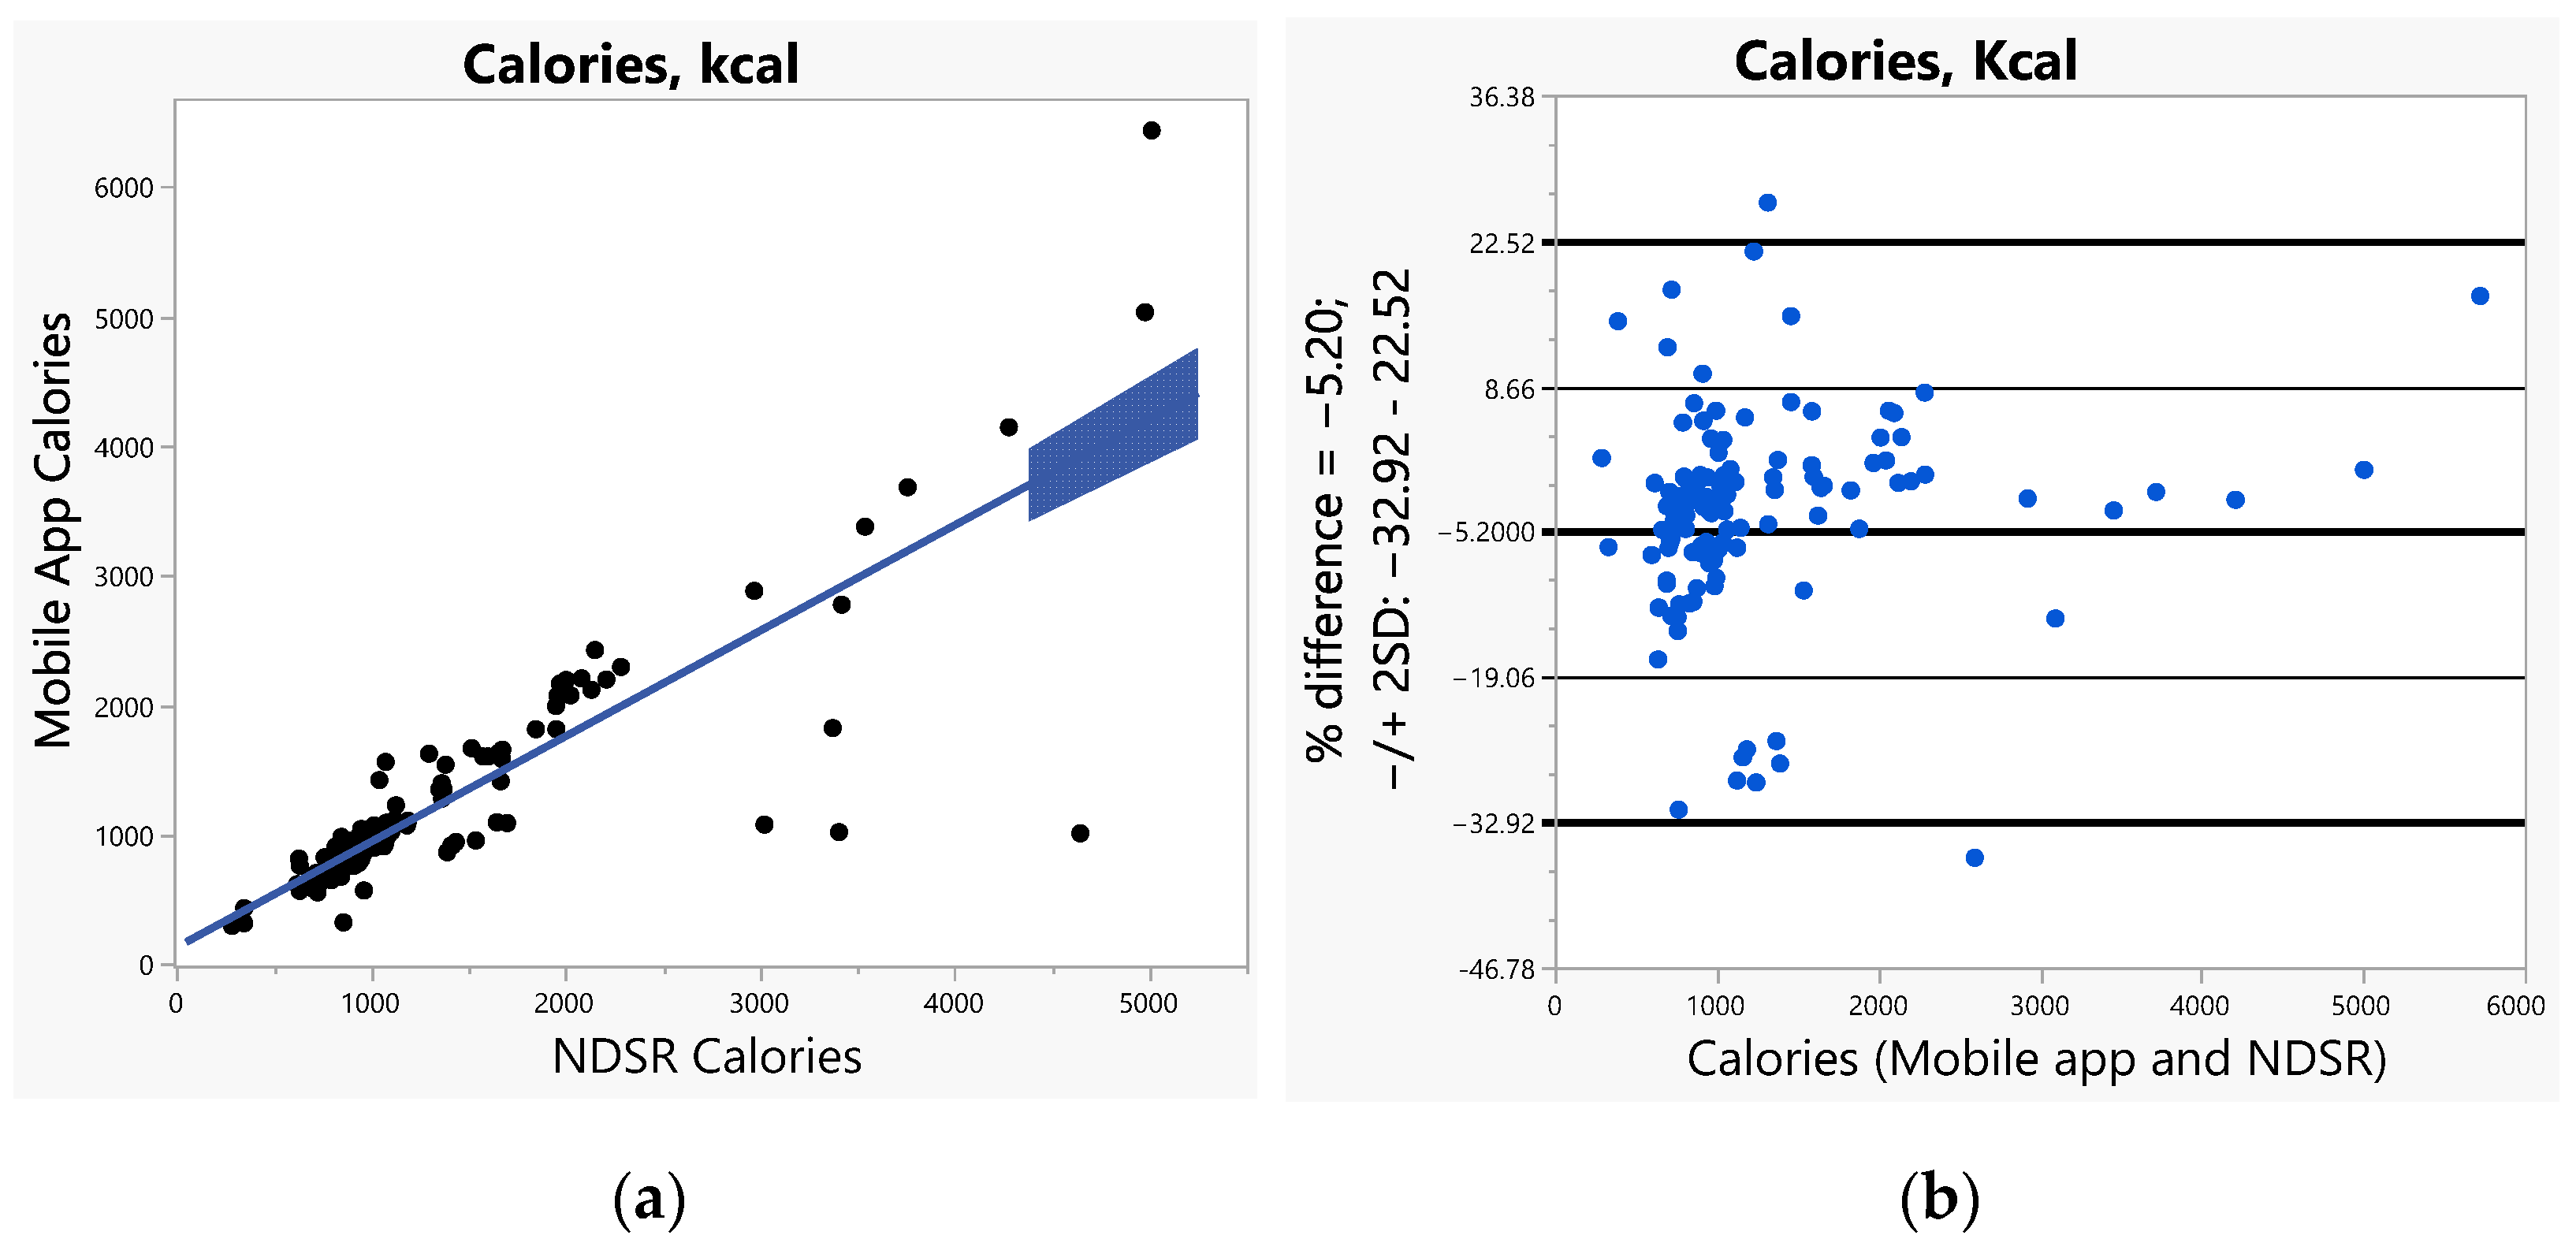
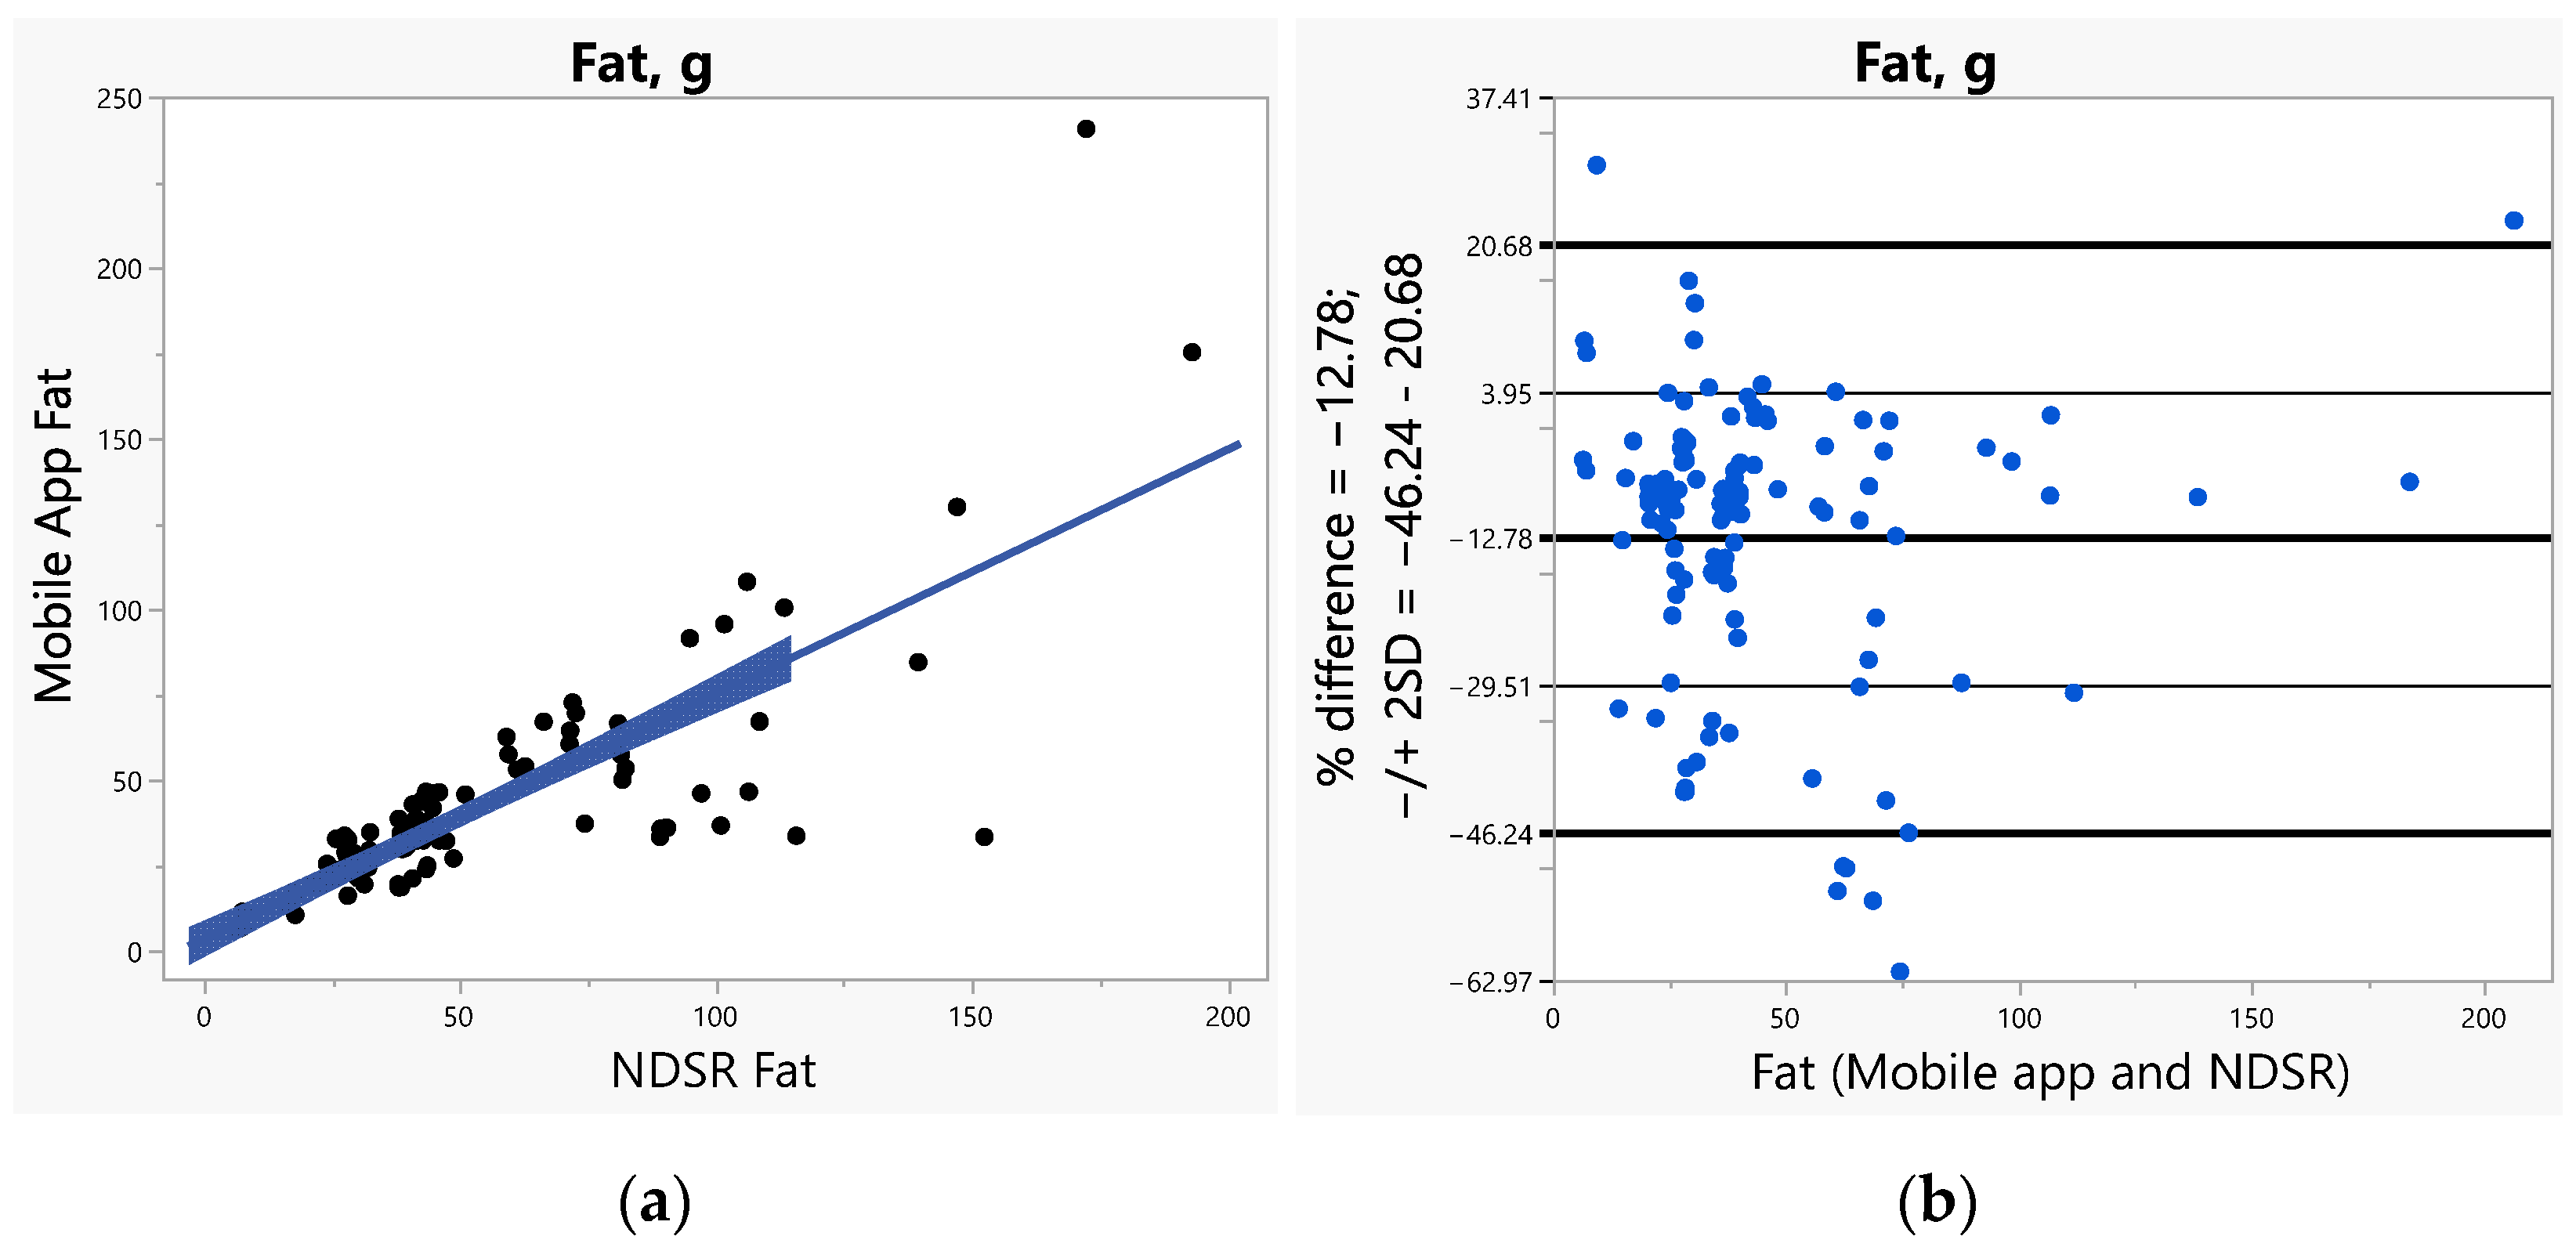
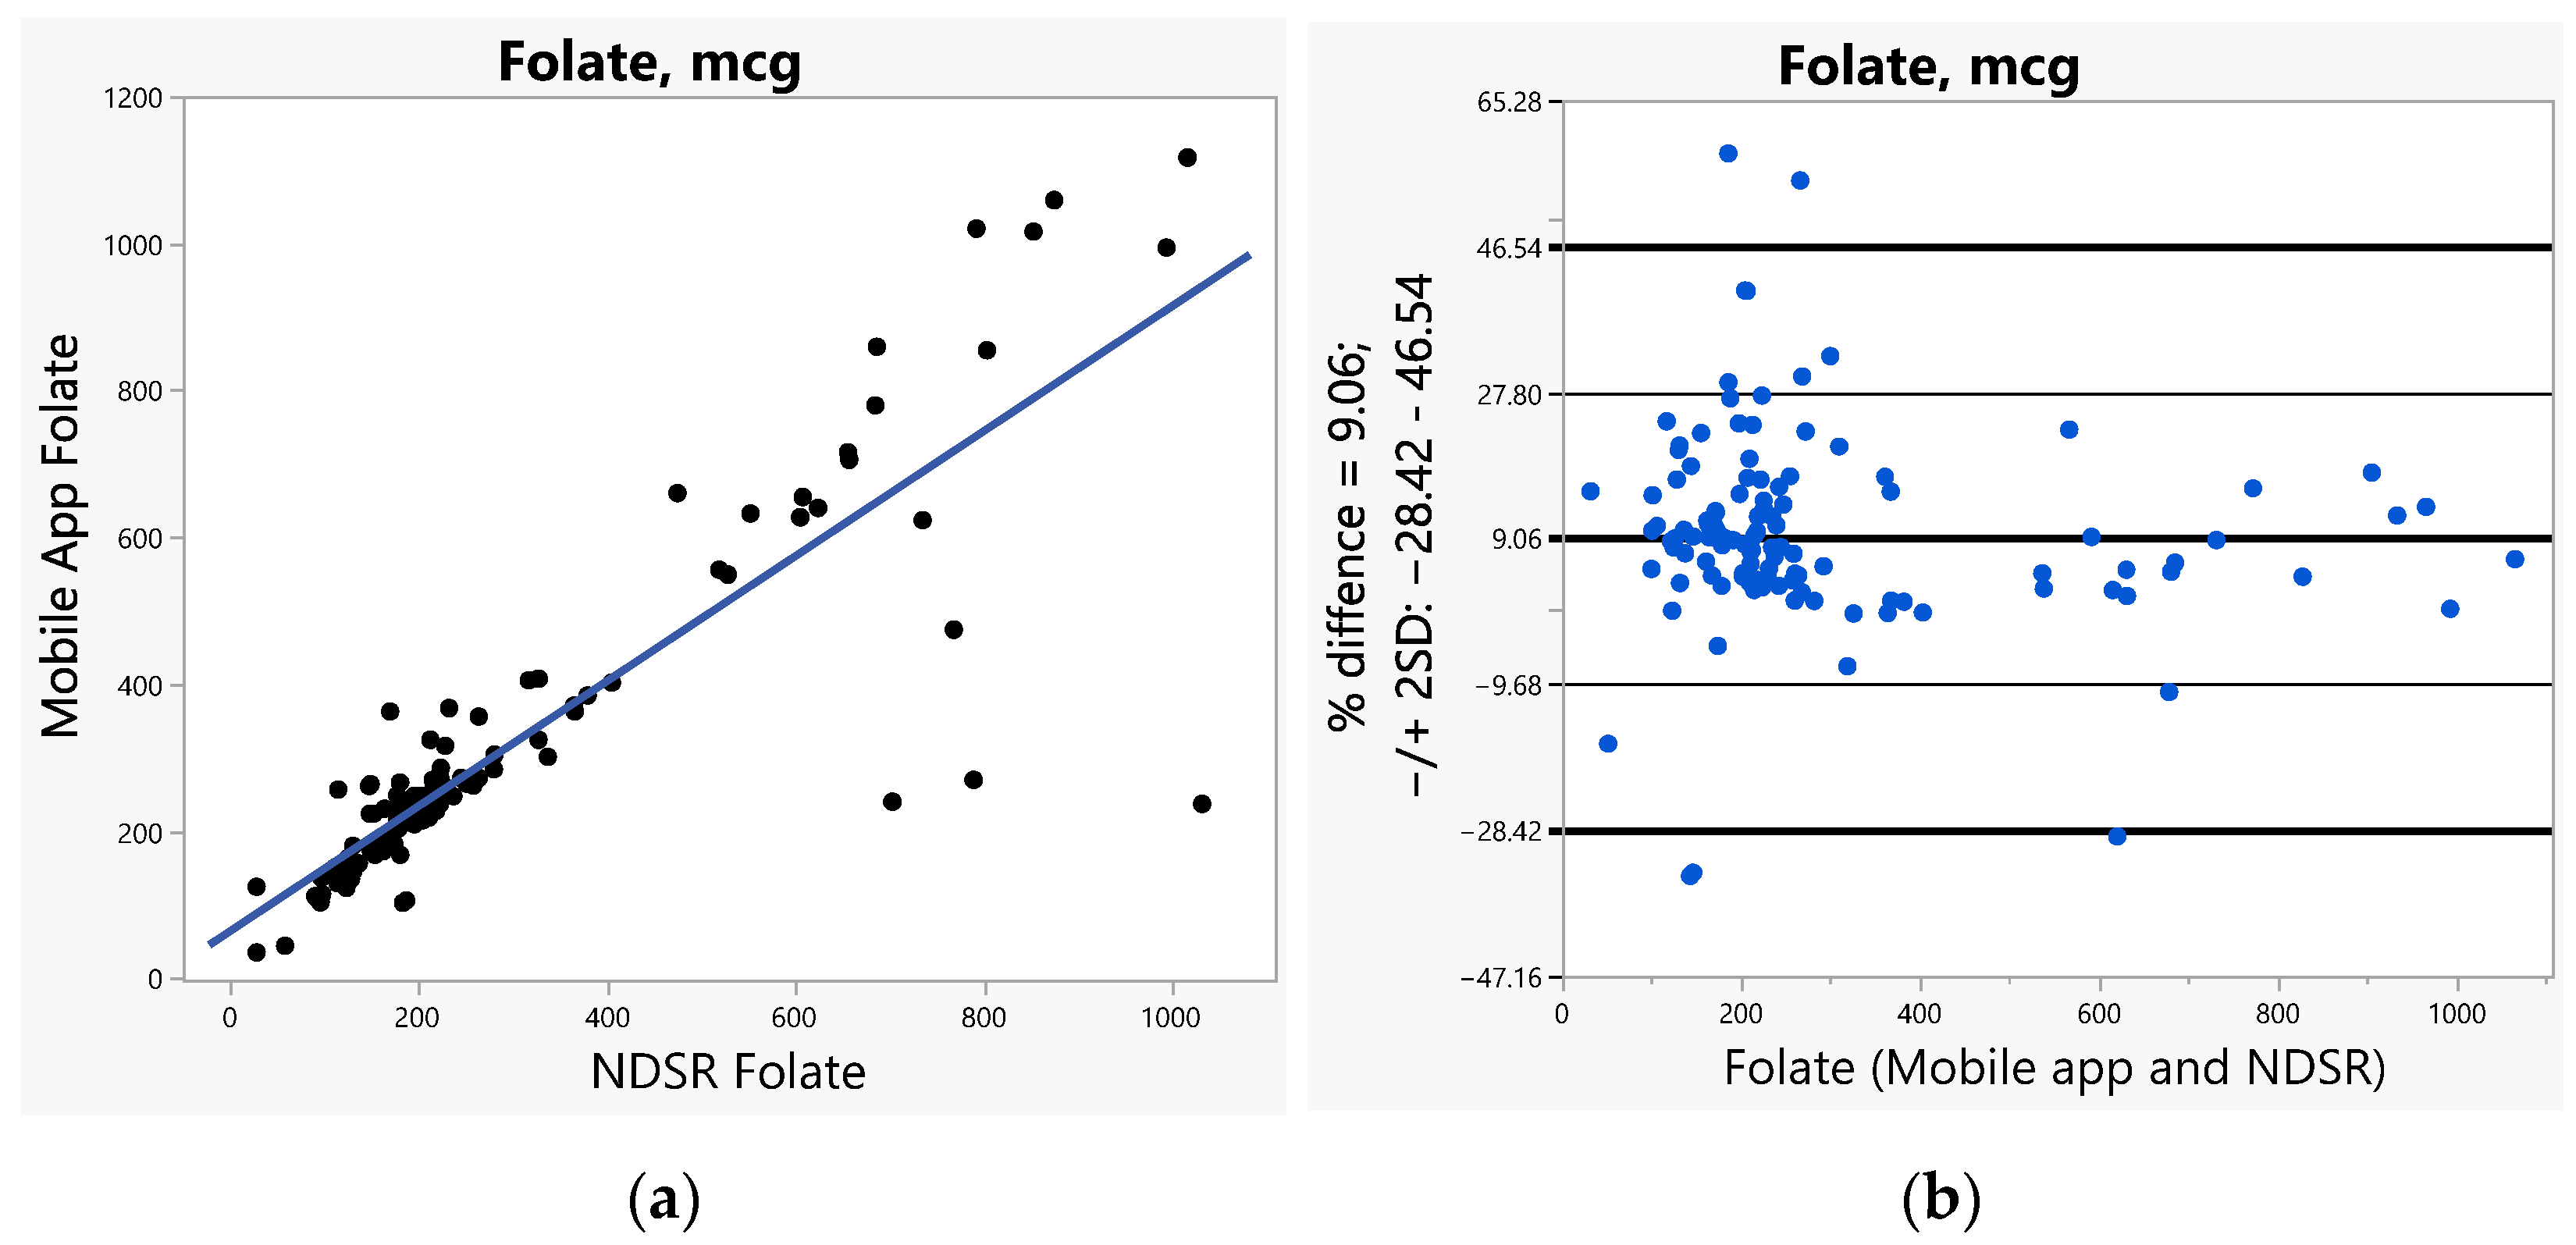
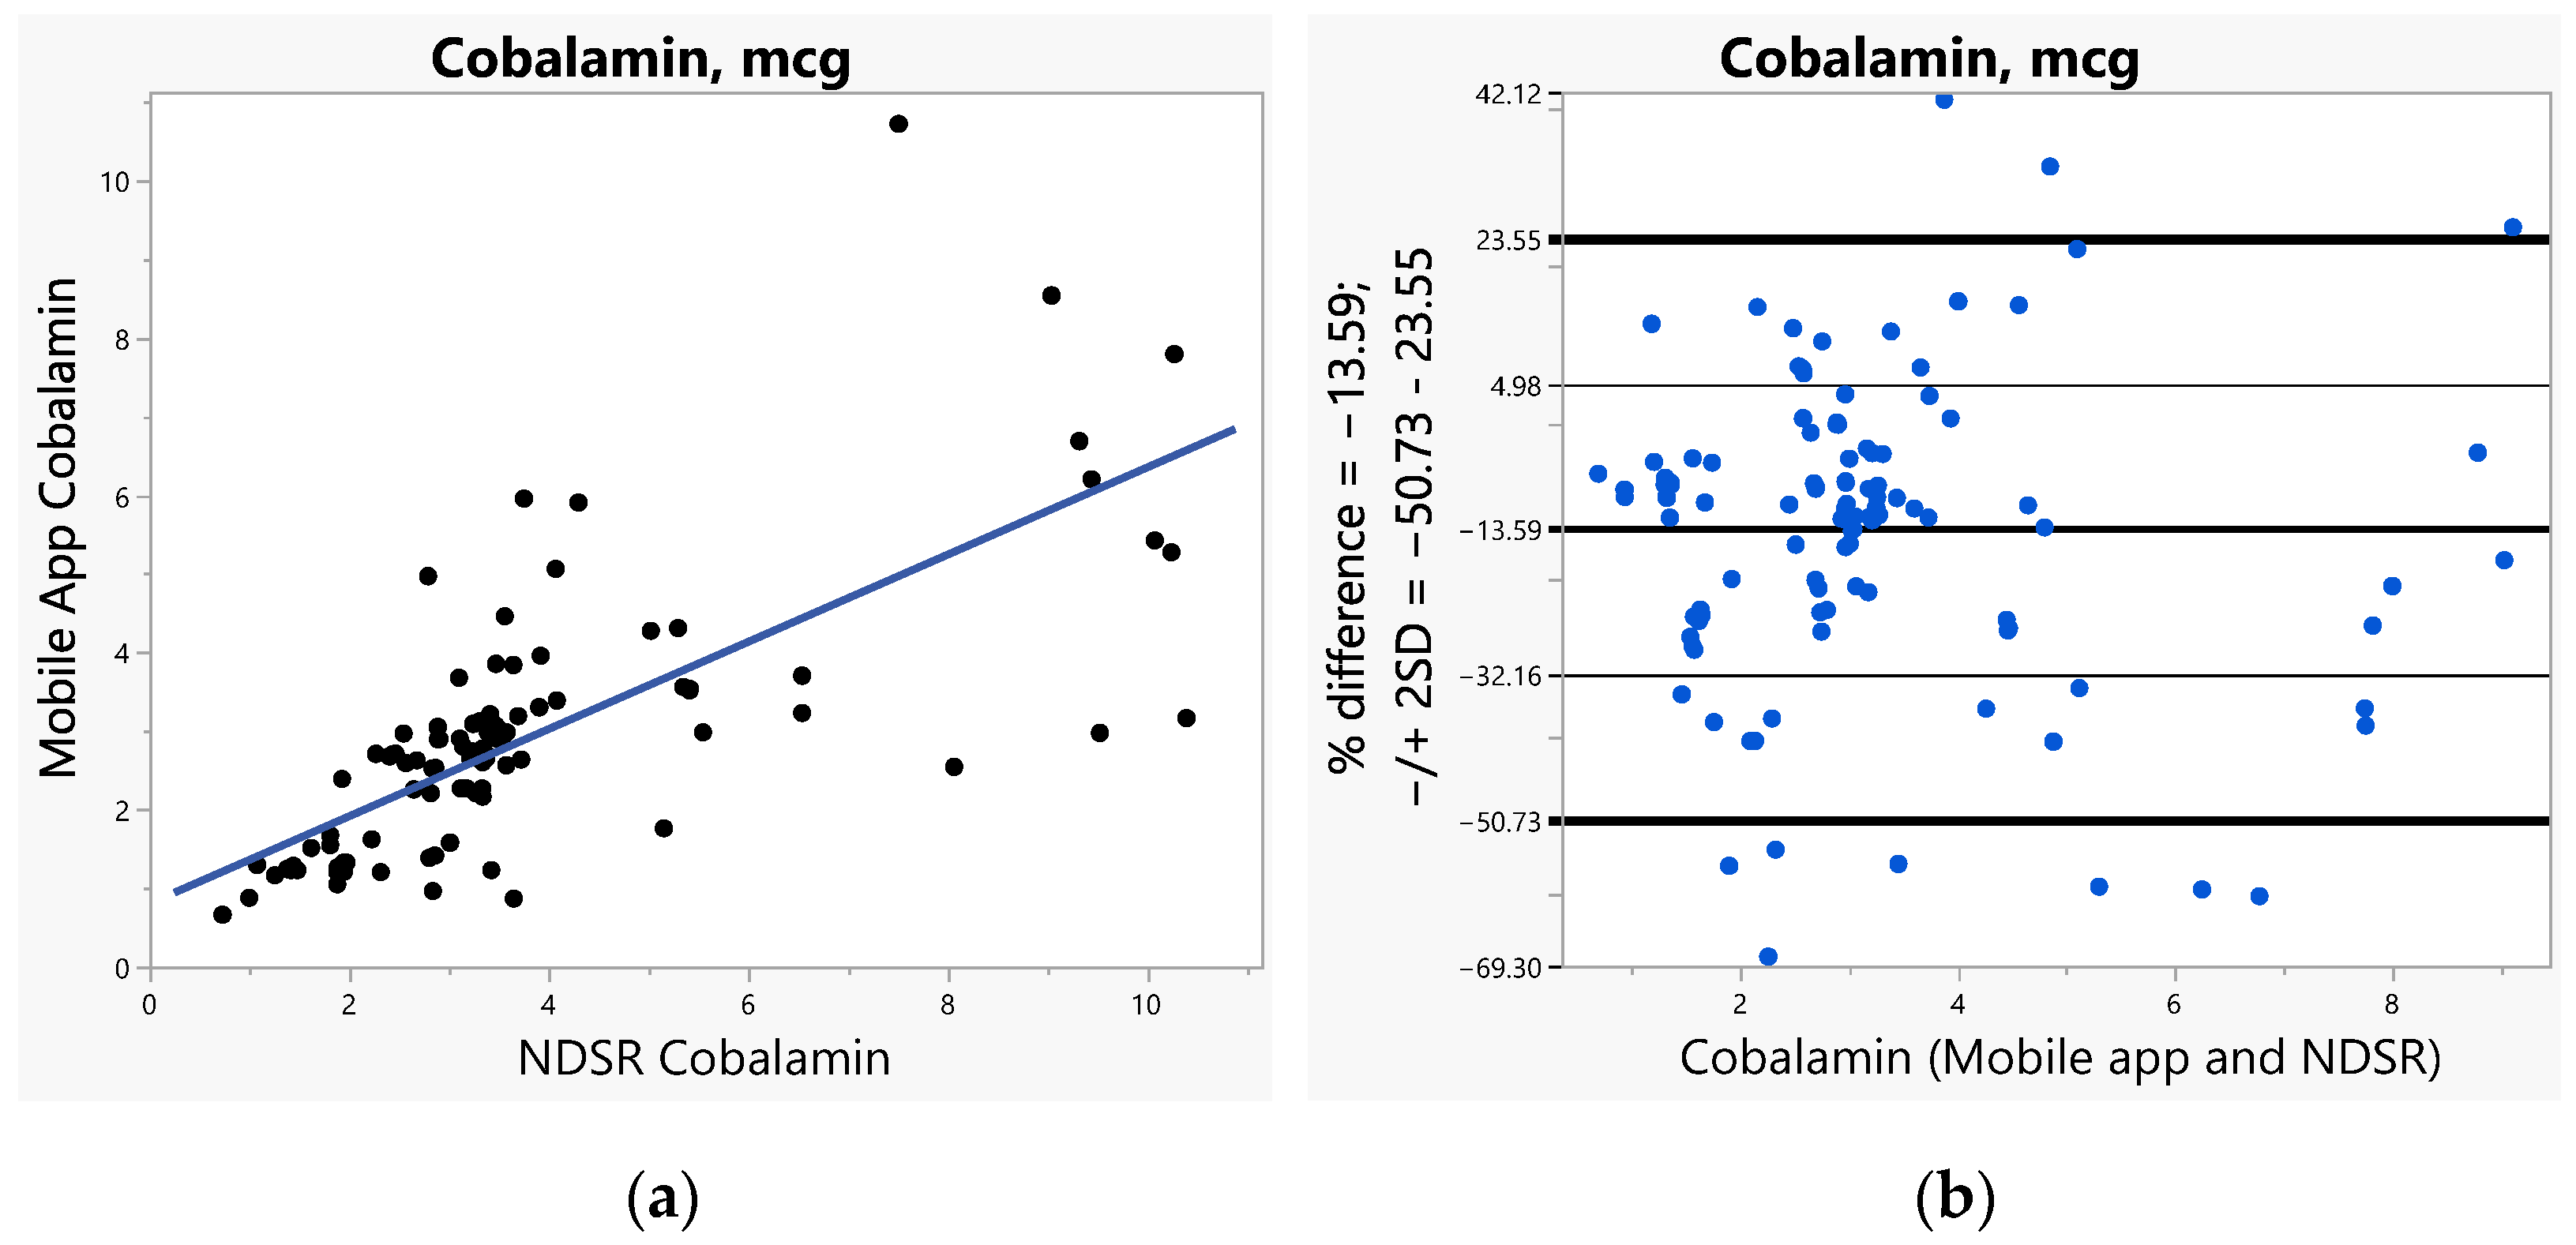
3. Results
3.1. Agreement and Difference: The Bland-Altman Method
3.2. Predictive Modeling for the Difference between the Internet-Based App against NDSR: Generalized Regression Analysis
4. Discussion
Supplementary Materials
Author Contributions
Funding
Institutional Review Board Statement
Informed Consent Statement
Acknowledgments
Conflicts of Interest
References
- Bruins, M.J.; Van Dael, P.; Eggersdorfer, M. The role of nutrients in reducing the risk for noncommunicable diseases during aging. Nutrients 2019, 11, 85. [Google Scholar] [CrossRef] [PubMed]
- Kwon, Y.-J.; Lee, H.S.; Park, J.-Y.; Lee, J.-W. Associating Intake Proportion of Carbohydrate, Fat, and Protein with All-Cause Mortality in Korean Adults. Nutrients 2020, 12, 3208. [Google Scholar] [CrossRef] [PubMed]
- Cappuccilli, M.; Bergamini, C.; Giacomelli, F.A.; Cianciolo, G.; Donati, G.; Conte, D.; Natali, T.; La Manna, G.; Capelli, I. Vitamin B Supplementation and Nutritional Intake of Methyl Donors in Patients with Chronic Kidney Disease: A Critical Review of the Impact on Epigenetic Machinery. Nutrients 2020, 12, 1234. [Google Scholar] [CrossRef] [PubMed]
- Zeng, J.; Gu, Y.; Fu, H.; Liu, C.; Zou, Y.; Chang, H. Association Between One-carbon Metabolism-related Vitamins and Risk of Breast Cancer: A Systematic Review and Meta-analysis of Prospective Studies. Clin. Breast Cancer 2020, 20, e469–e480. [Google Scholar] [CrossRef] [PubMed]
- Kohlmeier, M.; De Caterina, R.; Ferguson, L.R.; Görman, U.; Allayee, H.; Prasad, C.; Kang, J.X.; Nicoletti, C.F.; Martinez, J.A. Guide and Position of the International Society of Nutrigenetics/Nutrigenomics on Personalized Nutrition: Part 2—Ethics, Challenges and Endeavors of Precision Nutrition. Lifestyle Genom. 2016, 9, 28–46. [Google Scholar] [CrossRef] [PubMed] [Green Version]
- Cunha, C.A.S.; Duarte, R.P. Multi-Device Nutrition Control. Sensors 2022, 22, 2617. [Google Scholar] [CrossRef]
- Shiao, S.P.K.; Grayson, J.; Lie, A.; Yu, C.H. Personalized nutrition—genes, diet, and related interactive parameters as predictors of cancer in multiethnic colorectal cancer families. Nutrients 2018, 10, 795. [Google Scholar] [CrossRef] [Green Version]
- Myte, R.; Gylling, B.; Schneede, J.; Ueland, P.M.; Häggström, J.; Hultdin, J.; Hallmans, G.; Johansson, I.; Palmqvist, R.; Van Guelpen, B. Components of one-carbon metabolism other than folate and colorectal cancer risk. Epidemiology 2016, 27, 787–796. [Google Scholar] [CrossRef] [Green Version]
- Niculescu, M.D.; Zeisel, S.H. Diet, methyl donors and DNA methylation: Interactions between dietary folate, methionine and choline. J. Nutr. 2002, 132, 2333S–2335S. [Google Scholar] [CrossRef] [PubMed]
- Amenyah, S.D.; Hughes, C.F.; Ward, M.; Rosborough, S.; Deane, J.; Thursby, S.-J.; Walsh, C.P.; Kok, D.E.; Strain, J.J.; McNulty, H.; et al. Influence of nutrients involved in one-carbon metabolism on DNA methylation in adults—A systematic review and meta-analysis. Nutr. Rev. 2020, 78, 647–666. [Google Scholar] [CrossRef]
- Anderson, O.S.; Sant, K.E.; Dolinoy, D.C. Nutrition and epigenetics: An interplay of dietary methyl donors, one-carbon metabolism and DNA methylation. J. Nutr. Biochem. 2012, 23, 853–859. [Google Scholar] [CrossRef] [PubMed] [Green Version]
- Kusuma, J.D.; Yang, H.-L.; Yang, Y.-L.; Chen, Z.-F.; Shiao, S.-Y.P.K. Validating Accuracy of a Mobile Application against Food Frequency Questionnaire on Key Nutrients with Modern Diets for mHealth Era. Nutrients 2022, 14, 537. [Google Scholar] [CrossRef] [PubMed]
- Lin, A.W.; Morgan, N.; Ward, D.; Tangney, C.; Alshurafa, N.; Van Horn, L.; Spring, B. Comparative Validity of Mostly Unprocessed and Minimally Processed Food Items Differs Among Popular Commercial Nutrition Apps Compared with a Research Food Database. J. Acad. Nutr. Diet. 2021, 122, 825–832.e1. [Google Scholar] [CrossRef]
- Shinozaki, N.; Murakami, K. Evaluation of the Ability of Diet-Tracking Mobile Applications to Estimate Energy and Nutrient Intake in Japan. Nutrients 2020, 12, 3327. [Google Scholar] [CrossRef] [PubMed]
- Verma, M.; Hontecillas, R.; Tubau-Juni, N.; Abedi, V.; Bassaganya-Riera, J. Challenges in Personalized Nutrition and Health. Front. Nutr. 2018, 5, 117. [Google Scholar] [CrossRef] [PubMed] [Green Version]
- McMahon, E.J.; Jaenke, R.; Brimblecombe, J. A Mobile App to Rapidly Appraise the In-Store Food Environment: Reliability, Utility, and Construct Validity Study. JMIR mHealth uHealth 2020, 8, e16971. [Google Scholar] [CrossRef] [PubMed]
- Celis-Morales, C.; Livingstone, K.M.; Marsaux, C.F.; Macready, A.L.; Fallaize, R.; O’Donovan, C.B.; Woolhead, C.; Forster, H.; Walsh, M.C.; Navas-Carretero, S.; et al. Effect of personalized nutrition on health-related behaviour change: Evidence from the Food4Me European randomized controlled trial. Int. J. Epidemiol. 2016, 46, 578–588. [Google Scholar] [CrossRef] [PubMed] [Green Version]
- Titcomb, T.J.; Bisht, B.; Moore, D.D.; Chhonker, Y.S.; Murry, D.J.; Snetselaar, L.G.; Wahls, T.L. Eating Pattern and Nutritional Risks among People with Multiple Sclerosis Following a Modified Paleolithic Diet. Nutrients 2020, 12, 1844. [Google Scholar] [CrossRef] [PubMed]
- Griffiths, C.; Harnack, L.; Pereira, M. Assessment of the accuracy of nutrient calculations of five popular nutrition tracking applications. Public Health Nutr. 2018, 21, 1495–1502. [Google Scholar] [CrossRef] [Green Version]
- Ferrara, G.; Kim, J.; Lin, S.; Hua, J.; Seto, E. A Focused Review of Smartphone Diet-Tracking Apps: Usability, Functionality, Coherence With Behavior Change Theory, and Comparative Validity of Nutrient Intake and Energy Estimates. JMIR mHealth uHealth 2019, 7, e9232. [Google Scholar] [CrossRef]
- Waldfogel, J. Dining out as cultural trade. J. Cult. Econ. 2020, 44, 309–338. [Google Scholar] [CrossRef]
- Chen, J.; Berkman, W.; Bardouh, M.; Ng, C.Y.K.; Allman-Farinelli, M. The use of a food logging app in the naturalistic setting fails to provide accurate measurements of nutrients and poses usability challenges. Nutrition 2019, 57, 208–216. [Google Scholar] [CrossRef] [PubMed]
- Fallaize, R.; Franco, R.Z.; Pasang, J.; Hwang, F.; Lovegrove, J.A. Popular Nutrition-Related Mobile Apps: An Agreement Assessment Against a UK Reference Method. JMIR mHealth uHealth 2019, 7, e9838. [Google Scholar] [CrossRef] [PubMed]
- Medicine LibreTexts. Diets around the World. 2020. Available online: https://med.libretexts.org/@go/page/21470 (accessed on 1 April 2022).
- Kupka, R.; Siekmans, K.; Beal, T. The diets of children: Overview of available data for children and adolescents. Glob. Food Secur. 2020, 27, 100442. [Google Scholar] [CrossRef]
- Li, L.; Sun, N.; Zhang, L.; Xu, G.; Liu, J.; Hu, J.; Zhang, Z.; Lou, J.; Deng, H.; Shen, Z.; et al. Fast food consumption among young adolescents aged 12–15 years in 54 low- and middle-income countries. Glob. Health Action 2020, 13, 1795438. [Google Scholar] [CrossRef]
- Abikusno, N. Importance of nutrition and lifestyle for elderly during the COVID-19 pandemic. J. Biomedika Dan Kesehat. 2020, 3, 109–111. [Google Scholar] [CrossRef]
- Batchelor-Murphy, M.K.; Steinberg, F.M.; Young, H.M. Dietary and feeding modifications for older adults. AJN Am. J. Nurs. 2019, 119, 49–57. [Google Scholar] [CrossRef]
- Stoker, D.; Durward, C. Smoothies-Helpful or Harmful? Available online: https://digitalcommons.usu.edu/cgi/viewcontent.cgi?article=2856&context=extension_curall (accessed on 1 April 2022).
- Gellrich, N.-C.; Handschel, J.; Holtmann, H.; Krüskemper, G. Oral cancer malnutrition impacts weight and quality of life. Nutrients 2015, 7, 2145–2160. [Google Scholar] [CrossRef] [PubMed]
- Brown, W.V.; Carson, J.A.S.; Johnson, R.K.; Kris-Etherton, P. JCL Roundtable: Fast Food and the American Diet. J. Clin. Lipidol. 2015, 9, 3–10. [Google Scholar] [CrossRef]
- Sprietsma, J. Modern diets and diseases: NO–zinc balance. Med. Hypotheses 1999, 53, 6–16. [Google Scholar] [CrossRef] [PubMed]
- Zhang, C.-M.; Zhao, W.-Y.; Gao, A.X.; Su, T.-T.; Wang, Y.-K.; Zhang, Y.-Q.; Zhou, X.-B.; He, X.-H. How could agronomic biofortification of rice be an alternative strategy with higher cost-effectiveness for human iron and zinc deficiency in China? Food Nutr. Bull. 2018, 39, 246–259. [Google Scholar] [CrossRef] [PubMed] [Green Version]
- Liu, J.; Micha, R.; Li, Y.; Mozaffarian, D. Trends in food sources and diet quality among US children and adults, 2003–2018. JAMA Netw. Open 2021, 4, e215262. [Google Scholar] [CrossRef] [PubMed]
- Abdollahi, S.; Soltani, S.; de Souza, R.J.; Forbes, S.C.; Toupchian, O.; Salehi-Abargouei, A. Associations between Maternal Dietary Patterns and Perinatal Outcomes: A Systematic Review and Meta-Analysis of Cohort Studies. Adv. Nutr. 2021, 12, 1332–1352. [Google Scholar] [CrossRef] [PubMed]
- Mozaffarian, D. Diets from around the world—quality not quantity. Lancet 2011, 378, 759. [Google Scholar] [CrossRef]
- Felando, M.; Rasmussen, H.; Karmally, W.; Guyton, J.R. JCL roundtable: Healthy ethnic diets. J. Clin. Lipidol. 2020, 14, 274–281. [Google Scholar] [CrossRef]
- Evenepoel, C.; Clevers, E.; Deroover, L.; Van Loo, W.; Matthys, C.; Verbeke, K. Accuracy of Nutrient Calculations Using the Consumer-Focused Online App MyFitnessPal: Validation Study. J. Med. Internet Res. 2020, 22, e18237. [Google Scholar] [CrossRef]
- Saravia, L.; Miguel-Berges, M.L.; Iglesia, I.; Nascimento-Ferreira, M.V.; Perdomo, G.; Bove, I.; Slater, B.; Moreno, L.A. Relative validity of FFQ to assess food items, energy, macronutrient and micronutrient intake in children and adolescents: A systematic review with meta-analysis. Br. J. Nutr. 2020, 125, 792–818. [Google Scholar] [CrossRef]
- Sierra-Ruelas, É.; Bernal-Orozco, M.F.; Macedo-Ojeda, G.; Márquez-Sandoval, Y.F.; Altamirano-Martínez, M.B.; Vizmanos, B. Validation of semiquantitative FFQ administered to adults: A systematic review. Public Health Nutr. 2020, 24, 3399–3418. [Google Scholar] [CrossRef]
- Tosi, M.; Radice, D.; Carioni, G.; Vecchiati, T.; Fiori, F.; Parpinel, M.; Gnagnarella, P. Accuracy of applications to monitor food intake: Evaluation by comparison with 3-d food diary. Nutrition 2021, 84, 111018. [Google Scholar] [CrossRef]
- Shiao, S.P.K.; Grayson, J.; Lie, A.; Yu, C.H. Predictors of the healthy eating index and glycemic index in multi-ethnic colorectal cancer families. Nutrients 2018, 10, 674. [Google Scholar] [CrossRef] [Green Version]
- Chmurzynska, A.; Mlodzik-Czyzewska, M.A.; Malinowska, A.M.; Czarnocinska, J.; Wiebe, D.J. Use of a Smartphone Application Can Improve Assessment of High-Fat Food Consumption in Overweight Individuals. Nutrients 2018, 10, 1692. [Google Scholar] [CrossRef] [PubMed] [Green Version]
- Ravelli, M.N.; Schoeller, D.A. Traditional Self-Reported Dietary Instruments Are Prone to Inaccuracies and New Approaches Are Needed. Front. Nutr. 2020, 7, 90. [Google Scholar] [CrossRef] [PubMed]
- Zhang, L.; Nawijn, E.; Boshuizen, H.; Ocké, M. Evaluation of the Recipe Function in Popular Dietary Smartphone Applications, with Emphasize on Features Relevant for Nutrition Assessment in Large-Scale Studies. Nutrients 2019, 11, 200. [Google Scholar] [CrossRef] [Green Version]
- Warren, J.; Bhalla, V.; Cresci, G. Postoperative Diet Advancement: Surgical Dogma vs. Evidence-Based Medicine. Nutr. Clin. Pract. 2011, 26, 115–125. [Google Scholar] [CrossRef]
- National Institute of Health. Nutrient Recommendations: Dietary Reference Intakes (DRI). Available online: https://ods.od.nih.gov/Health_Information/Dietary_Reference_Intakes.aspx (accessed on 1 April 2022).
- Palos Lucio, A.G.; Sansores Martínez, D.N.; Olvera Miranda, C.; Quezada Méndez, L.; Tolentino-Mayo, L. Nutritional Quality of Fast Food Kids Meals and Their Contribution to the Diets of School-Aged Children. Nutrients 2020, 12, 612. [Google Scholar] [CrossRef] [PubMed] [Green Version]
- Saito, A.; Okada, E.; Matsumoto, M.; Takimoto, H. Impact of updated standard tables of food composition on nutrient intakes in Japan. J. Food Compos. Anal. 2019, 79, 5–11. [Google Scholar] [CrossRef]
- Whitton, C.; Rebello, S.A.; Lee, J.; Tai, E.S.; van Dam, R.M. A Healthy Asian A Posteriori Dietary Pattern Correlates with A Priori Dietary Patterns and Is Associated with Cardiovascular Disease Risk Factors in a Multiethnic Asian Population. J. Nutr. 2018, 148, 616–623. [Google Scholar] [CrossRef] [PubMed]
- Salomonsen, S.J.C.; Berland, A.; Bentsen, S.B. High-energy smoothies for patients in nursing homes. Nor. J. Clin. Nurs./Sykepl. Forsk. 2017, 12, e-62986. [Google Scholar] [CrossRef]
- Marchetti, B.S.; Steluti, J.; Fisberg, R.M.; Marchioni, D.M.L. Performance of the Brazilian version of GloboDiet software for dietary intake assessment. Nutrire 2018, 43, 13. [Google Scholar] [CrossRef]
- Mehta, S.; Ruth Dugas, L.; Choo-Kang, C.; Bovet, P.; Forrester, T.; Bedu-Addo, K.; Lambert, E.V.; Plange-Rhule, J.; Riesen, W.; Korte, W.; et al. Consumption of Monounsaturated Fatty Acids Is Associated with Improved Cardiometabolic Outcomes in Four African-Origin Populations Spanning the Epidemiologic Transition. Nutrients 2021, 13, 2442. [Google Scholar] [CrossRef]
- Yip, P.S.P.; Chan, T.F.J.; He, Z.; Leung, L.K.; Leung, S.F.S.; Chen, Z.-Y. Quantification of breast milk trans fatty acids and trans fat intake by Hong Kong lactating women. Eur. J. Clin. Nutr. 2020, 74, 765–774. [Google Scholar] [CrossRef] [PubMed]
- Harmouche-Karaki, M.; Mahfouz, M.; Obeyd, J.; Salameh, P.; Mahfouz, Y.; Helou, K. Development and validation of a quantitative food frequency questionnaire to assess dietary intake among Lebanese adults. Nutr. J. 2020, 19, 65. [Google Scholar] [CrossRef] [PubMed]
- GB Health Watch. Available online: https://www.gbhealthwatch.com/ (accessed on 1 June 2022).
- Nutrition Coordianting Center. Nutrition Data System for Research. Available online: http://www.ncc.umn.edu/food-and-nutrient-database/ (accessed on 1 April 2022).
- Grayson, J.; Gardner, S.; Stephens, M. Building Better Models with JMP® Pro; SAS Press: Cary, NC, USA, 2015. [Google Scholar]
- Klimberg, R.; McCullough, B. Fundamentals of Predictive Analytics with JMP, 2nd ed.; SAS Press: Cary, NC, USA, 2016. [Google Scholar]
- SAS Institute. Overview of the Generalized Regression Personality. Available online: https://www.jmp.com/support/help/en/16.0/index.shtml#page/jmp/overview-of-the-generalized-regression-personality.shtml (accessed on 20 June 2022).
- National Coalition for Health Professional Education in Genetics. Family History Educational Aids. NCHPEG. Available online: http://www.nchpeg.org/index.php?option=com_content&view=article&id=145&Itemid=64 (accessed on 10 October 2021).
- Bzikowska-Jura, A.; Sobieraj, P.; Raciborski, F. Low Comparability of Nutrition-Related Mobile Apps against the Polish Reference Method—A Validity Study. Nutrients 2021, 13, 2868. [Google Scholar] [CrossRef] [PubMed]
- Beck, K.L.; Houston, Z.L.; McNaughton, S.A.; Kruger, R. Development and evaluation of a food frequency questionnaire to assess nutrient intakes of adult women in New Zealand. Nutr. Diet. 2020, 77, 253–259. [Google Scholar] [CrossRef] [Green Version]
- Lin, P.-I.; Bromage, S.; Mostofa, M.; Allen, J.; Oken, E.; Kile, M.L.; Christiani, D.C. Validation of a dish-based semiquantitative food questionnaire in rural Bangladesh. Nutrients 2017, 9, 49. [Google Scholar] [CrossRef] [PubMed] [Green Version]
- Erkkilä, A.T.; Järvinen, R.; Karvonen, H.; Keronen, L.; Tuppurainen, M.T. Validation of a semi-quantitative FFQ using food records as a reference in older women in the Kuopio Fracture Prevention Study (OSTPRE-FPS). Public Health Nutr. 2012, 15, 635–639. [Google Scholar] [CrossRef]
- Pakseresht, M.; Sharma, S. Validation of a quantitative food frequency questionnaire for Inuit population in Nunavut, Canada. J. Hum. Nutr. Diet. 2010, 23, 67–74. [Google Scholar] [CrossRef]
- Kowalkowska, J.; Slowinska, M.A.; Slowinski, D.; Dlugosz, A.; Niedzwiedzka, E.; Wadolowska, L. Comparison of a full food-frequency questionnaire with the three-day unweighted food records in young Polish adult women: Implications for dietary assessment. Nutrients 2013, 5, 2747–2776. [Google Scholar] [CrossRef] [Green Version]
- Wu, Y. Elastic net for Cox’s proportional hazards model with a solution path algorithm. Stat. Sin. 2012, 22, 271–294. [Google Scholar] [CrossRef] [Green Version]
- Shiao, S.P.K.; Grayson, J.; Yu, C.H.; Wasek, B.; Bottiglieri, T. Gene Environment Interactions and Predictors of Colorectal Cancer in Family-Based, Multi-Ethnic Groups. J. Pers. Med. 2018, 8, 10. [Google Scholar] [CrossRef] [Green Version]
- Cheng, H.; Garrick, D.J.; Fernando, R.L. Efficient strategies for leave-one-out cross validation for genomic best linear unbiased prediction. J. Anim. Sci. Biotechnol. 2017, 8, 38. [Google Scholar] [CrossRef] [PubMed] [Green Version]
- SAS Institute. Fitting Linear Models, 2nd ed.; SAS Institute Inc.: Cary, NC, USA, 2017. [Google Scholar]


| Parameters | r (95% CI) ** | % Difference M ± SD | NDSR M ± SD | App M ± SD | SE | ±2 SD% |
|---|---|---|---|---|---|---|
| Calories (kcal) | 0.85 (0.80, 0.89) | −5.20 ** ± 13.86 | 1333 ± 891.8 | 1215 ± 853.6 | 1.21 | 95.42 |
| <1000 (n = 63) | 0.75 (0.62, 0.84) | −4.26 ** ± 10.01 | 806.5 ± 147.1 | 756.6 ± 162.5 | 1.26 | 95.65 |
| 1000–2000 (n = 50) | 0.76 (0.60, 0.85) | −4.10 * ± 11.67 | 1330 ± 302.9 | 1255 ± 346.3 | 1.65 | 92.31 |
| >2000 (n = 18) | 0.57 (0.14, 0.82) | −11.56 * ± 25.71 | 3183 ± 1042 | 2708 ± 1410 | 6.06 | 95.00 |
| Carbohydrate (g) | 0.85 (0.80, 0.89) | 0.93 ± 16.22 | 180.60 ± 141.0 | 178.4 ± 136.1 | 1.42 | 92.37 |
| Protein (g) | 0.85 (0.80, 0.89) | −5.82 ** ± 13.05 | 52.20 ± 33.25 | 47.35 ± 33.10 | 1.14 | 93.89 |
| Fat (g) | 0.81 (0.75, 0.86) | −12.78 ** ± 16.73 | 47.88 ± 33.56 | 37.76 ± 29.57 | 1.46 | 93.13 |
| Sat Fat (g) | 0.84 (0.79, 0.89) | −13.77 ** ± 16.70 | 14.26 ± 9.81 | 11.54 ± 9.35 | 1.46 | 94.66 |
| Cholesterol (mg) | 0.88 (0.84, 0.91) | −4.86 ** ± 15.57 | 184.2 ± 117.3 | 175.4 ± 121.7 | 1.36 | 93.89 |
| Fiber (g) | 0.85 (0.80, 0.89) | 6.70 ** ± 20.93 | 17.99 ± 19.30 | 18.46 ± 18.91 | 1.83 | 92.37 |
| Thiamin (mg) | 0.85 (0.80, 0.89) | 6.48 ** ± 14.00 | 1.04 ± 0.71 | 1.12 ± 0.73 | 1.22 | 94.66 |
| Riboflavin (mg) | 0.86 (0.81, 0.90) | 0.19 ± 13.72 | 1.26 ± 0.85 | 1.23 ± 0.81 | 1.20 | 93.89 |
| Niacin (mg) | 0.86 (0.80, 0.90) | 0.51 ± 14.15 | 14.43 ± 9.52 | 14.34 ± 10.40 | 1.24 | 93.13 |
| Pyridoxine (mg) | 0.86 (0.80, 0.90) | −4.38 ** ± 15.17 | 1.74 ± 1.46 | 1.60 ± 1.42 | 1.33 | 94.66 |
| Folate (mcg) | 0.87 (0.81, 0.90) | 9.06 ** ± 18.74 | 280.2 ± 219.6 | 302.3 ± 215.9 | 1.64 | 92.37 |
| Cobalamin (mcg) | 0.73 (0.64, 0.80) | −13.59 ** ± 18.57 | 3.42 ± 2.05 | 2.70 ± 1.56 | 1.62 | 92.37 |
| Methionine (g) | 0.84 (0.79, 0.89) | −8.76 ** ± 13.20 | 1.17 ± 0.72 | 1.03 ± 0.74 | 1.15 | 93.89 |
| Choline (mg) | 0.82 (0.76, 0.87) | −4.51 ** ± 18.55 | 263.4 ± 177.0 | 240.1 ± 161.9 | 1.62 | 95.42 |
| Glycine (g) | 0.83 (0.76, 0.87) | −10.47 ** ± 14.80 | 2.26 ± 1.42 | 1.93 ± 1.45 | 1.29 | 92.37 |
| Vitamin A (IU) | 0.86 (0.81, 0.90) | 28.00 ** ± 31.32 | 13,294 ± 17,265 | 16,373 ± 16,564 | 2.74 | 96.95 |
| Vitamin C (mcg) | 0.88 (0.83, 0.91) | 2.41 ± 24.76 | 149.4 ± 158.3 | 149.1 ± 167.3 | 2.16 | 93.13 |
| Vitamin D (mcg) | 0.89 (0.84, 0.92) | 0.72 ± 14.53 | 3.90 ± 2.14 | 3.91 ± 2.20 | 1.27 | 95.42 |
| Vitamin E (mcg) | 0.82 (0.75, 0.87) | −0.10 ± 24.31 | 6.68 ± 5.34 | 6.13 ± 4.91 | 2.12 | 92.37 |
| Zinc (mg) | 0.83 (0.77, 0.88) | −12.49 ** ± 15.82 | 7.64 ± 4.55 | 6.19 ± 3.92 | 1.38 | 92.37 |
| Calcium (mg) | 0.51 (0.37, 0.62) | 1.46 ± 31.82 | 548.4 ± 335.5 | 570.8 ± 389.0 | 2.78 | 93.13 |
| Magnesium (mg) | 0.86 (0.81, 0.90) | 1.40 ± 15.69 | 211.6 ± 162.7 | 210.3 ± 159.6 | 1.37 | 93.89 |
| Iron (mg) | 0.86 (0.81, 0.90) | 3.11 ± 18.52 | 8.98 ± 6.02 | 8.99 ± 5.66 | 1.62 | 94.66 |
| Sodium (mg) | 0.75 (0.67, 0.82) | −19.78 ** ± 18.84 | 2867 ± 1869 | 2002 ± 1266 | 1.65 | 94.66 |
| Parameters (n) | Calories, kcal %Diff M ± SD | Carb, g %Diff M ± SD | Protein, g %Diff M ± SD | Fat, g %Diff M ± SD | Folate, mcg %Diff M ± SD | Cobalamin, mcg %Diff M ± SD |
|---|---|---|---|---|---|---|
| Caloric range | ||||||
| <1000 (63) | −4.26 **± 10.01 | −0.70 ** ± 12.55 | −6.27 ** ± 11.35 | −10.58 **± 13.73 | 12.79 **± 18.86 | −13.43 **± 18.61 |
| 1000–2000 (50) | −4.10 **± 11.67 | 5.15 **± 11.60 | −3.03 **± 9.04 | −14.34 **± 17.19 | 9.54 **± 10.94 | −12.27 **± 15.28 |
| >2000 (18) | −11.56 ± 25.71 | −9.98 ± 29.51 | −12.03 * ± 23.09 | −16.16 **± 23.74 | −5.35 ± 27.79 | −17.83 * ± 26.04 |
| Diet types | ||||||
| Pure Liquid (8) | −0.38 ± 7.32 | 2.88 ± 4.52 | −9.53 ± 17.28 | −0.66 ± 17.65 | 20.05 ± 38.13 | −22.04 ** ± 23.39 |
| Convenient Diet (30) | −8.30 ** ± 12.81 | 4.18 ** ± 9.94 | 1.85 ± 10.41 | −23.65 ** ± 20.16 | 20.47 ** ± 15.55 | −8.11 ** ± 12.91 |
| Canned Food (10) | −6.83 * ± 9.16 | 5.60 ** ± 4.15 | 3.84 ** ± 4.35 | −27.27 ** ± 17.56 | 30.51 ** ± 15.86 | −8.96 ** ± 1.84 |
| High School (10) | 0.55 ± 3.84 | 5.50 ** ± 2.64 | 0.42 ± 8.33 | −5.32 * ± 5.35 | 19.10 ** ± 6.64 | −12.51 * ± 15.18 |
| Fast Food (10) | −18.61 ** ± 14.93 | 1.43 ± 16.78 | 1.30 ± 15.94 | −38.36 ** ± 18.54 | 11.81 ** ± 16.93 | −2.87 ± 15.82 |
| Ethnic Food (71) | −3.22 ** ± 9.90 | 2.01 ± 13.96 | −7.40 ** ± 8.35 | −9.14 ** ± 8.53 | 7.10 ** ± 9.35 | −13.62 ** ± 16.05 |
| Western Diet (38) | −1.90 ± 9.66 | 2.86 *± 14.24 | −5.15 ** ± 7.57 | −6.53 **± 9.03 | 7.78 ** ± 9.60 | −12.82 **± 14.22 |
| Mexican (10) | 3.40 ± 11.83 | 13.04 * ± 17.65 | −5.01 ** ± 3.45 | −6.59 ± 11.83 | 11.94 ** ± 9.62 | −14.35 ** ± 4.66 |
| Italian (10) | −1.31 ± 3.10 | 4.46 ** ± 1.98 | −2.95 ± 7.29 | −8.11 ** ± 3.76 | 5.02 ** ± 2.75 | −9.77 * ± 10.05 |
| Mediterranean (9) | −6.80 ± 8.68 | −3.11 ± 8.65 | −10.10 ± 9.10 | −8.94 ± 10.88 | 8.68 ** ± 6.48 | −27.93 ** ± 16.92 |
| American (9) | −3.53 ± 11.07 | −4.27 ± 16.67 | −2.81 ± 8.34 | −2.28 ± 7.41 | 5.32 ± 15.27 | 0.58 ± 6.08 |
| Eastern Diet (33) | −4.75 ** ± 10.10 | 1.03 ± 13.78 | −9.99 ± 8.57 | −12.15 ± 6.88 | 6.31 ** ± 9.14 | −14.55 ** ± 18.11 |
| Japanese (10) | −3.13 ** ± 2.20 | 1.92 * ± 2.86 | −4.57 ** ± 1.61 | −8.34 ** ± 3.76 | 9.44 ** ± 2.95 | 8.90 ** ± 3.65 |
| Chinese (10) | −6.85 ** ± 2.31 | 1.83 * ± 2.87 | −10.74 ** ± 1.57 | −16.71 ** ± 2.09 | 3.65 ** ± 0.83 | −20.62 ** ± 4.73 |
| Korean (13) | −4.38 ± 16.07 | −0.26 ± 22.16 | −13.57 ** ± 12.38 | −11.57 ** ± 9.09 | 5.94 * ± 14.20 | −27.91 ** ± 12.88 |
| Smoothie (22) | −9.13 ± 23.79 | −7.70 ± 27.16 | −9.86 * ± 21.40 | −14.12 ** ± 23.53 | −4.18 ± 25.22 | −17.89 ** ± 27.84 |
| Parameters | Logistic Regression Original Model | Generalized Regression Elastic Net Model Validation | ||
|---|---|---|---|---|
| Estimate (95% CI) | p (χ2) | Estimate (95% CI) | p (χ2) | |
| (Intercept) | 3.1970 (1.8086, 4.5855) | <0.0001 | 3.1367 (1.7804, 4.4933) | <0.0001 |
| <1000 caloric range | −1.4626 (−2.7979, −0.1274) | 0.0318 | −1.4136 (−2.7006, −0.1265) | 0.0313 |
| Fat % Difference | −3.3411 (−4.6729, −2.009) | <0.0001 | −3.2879 (−4.5876, −1.9883) | <0.0001 |
| Protein % Difference | −1.3791 (−2.4530, −0.3052) | 0.0118 | −1.3600 (−2.4073, −0.3127) | 0.0109 |
| MR | 0.1852 | 0.1852 | ||
| AICc | 30.29 | 30.29 | ||
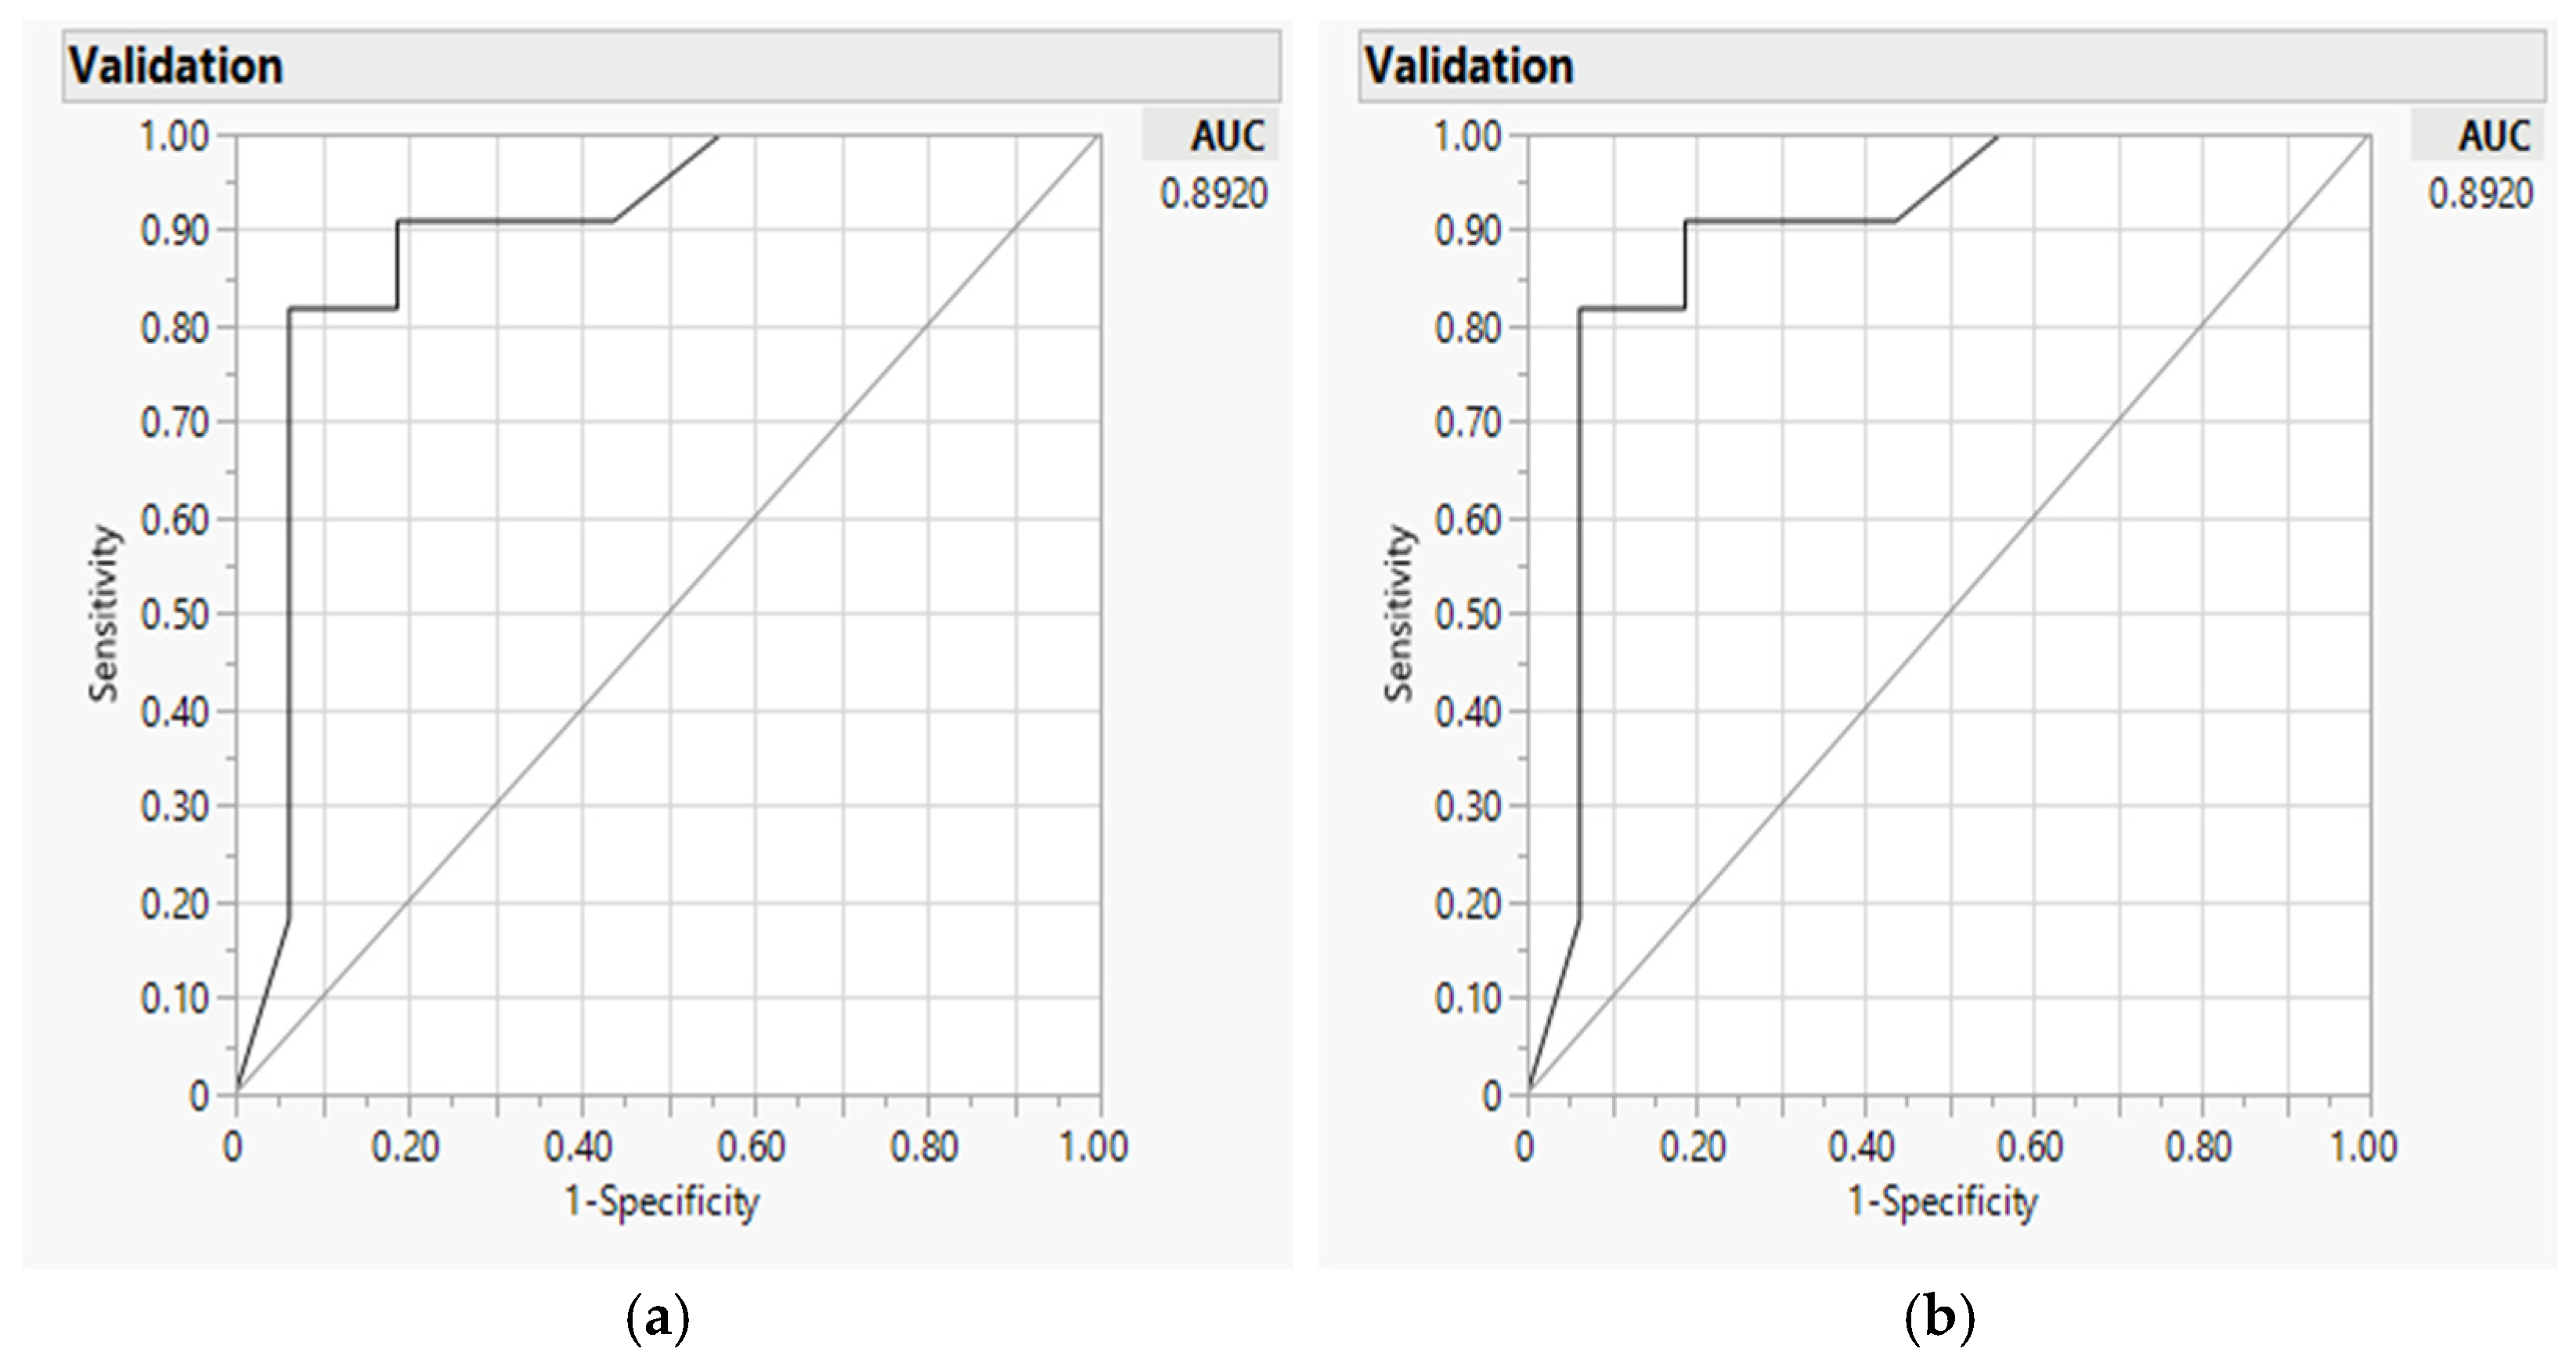
| AUC | 0.8920 | 0.8920 | ||
| Parameters | Logistic Regression Original Model | Generalized Regression Elastic Net Model Validation | ||
|---|---|---|---|---|
| Estimate (95% CI) | p (χ2) | Estimate (95% CI) | p (χ2) | |
| (Intercept) | 11.4831 (−139.76, 162.72) | 0.8817 | 10.3903 (9.0613, 11.7193) | <0.0001 |
| <1000 caloric range | 1.4607 (0.4860, 2.4354) | 0.0033 | 1.4604 (0.4854, 2.4354) | 0.0033 |
| Carbohydrate, % difference | −1.1903 (−2.9901, −0.9379 | 0.0001 | −1.9187 (−2.8978, −0.9395) | 0.0001 |
| Italian diet | −11.2367 (−162.48, 140.00) | 0.8842 | −10.1439 (−11.3112, −8.9767) | <0.0001 |
| MR | 0.2963 | 0.2963 | ||
| AICc | 38.52 | 38.52 | ||
| AUC | 0.9046 | 0.9046 | ||
| Parameters | Logistic Regression Original Model | Generalized Regression Elastic Net Model Validation | ||
|---|---|---|---|---|
| Estimate (95% CI) | p (χ2) | Estimate (95% CI) | p (χ2) | |
| (Intercept) | −23.3204 (−314.45, 267.81) | 0.8752 | −5.0243 (−6.7635, 3.2852) | <0.0001 |
| Protein, % difference | −3.2596 (−4.4292, −2.0901) | <0.0001 | −2.6890 (−3.6172, 1.7607) | <0.0001 |
| American diet | 12.3545 (−207.66, 232.37) | 0.9124 | 2.8874 (1.3699, 4.4048) | 0.0002 |
| Japanese diet | −23.3204 (−117.56, 203.75) | 0.8752 | 3.8314 (2.7588, 4.9040) | <0.0001 |
| MR | 0.2593 | 0.2593 | ||
| AICc | 37.73 | 37.42 | ||
| AUC | 0.8083 | 0.8083 | ||
Publisher’s Note: MDPI stays neutral with regard to jurisdictional claims in published maps and institutional affiliations. |
© 2022 by the authors. Licensee MDPI, Basel, Switzerland. This article is an open access article distributed under the terms and conditions of the Creative Commons Attribution (CC BY) license (https://creativecommons.org/licenses/by/4.0/).
Share and Cite
Yang, Y.-L.; Yang, H.-L.; Kusuma, J.D.; Shiao, S.-Y.P.K. Validating Accuracy of an Internet-Based Application against USDA Computerized Nutrition Data System for Research on Essential Nutrients among Social-Ethnic Diets for the E-Health Era. Nutrients 2022, 14, 3168. https://doi.org/10.3390/nu14153168
Yang Y-L, Yang H-L, Kusuma JD, Shiao S-YPK. Validating Accuracy of an Internet-Based Application against USDA Computerized Nutrition Data System for Research on Essential Nutrients among Social-Ethnic Diets for the E-Health Era. Nutrients. 2022; 14(15):3168. https://doi.org/10.3390/nu14153168
Chicago/Turabian StyleYang, Ya-Ling, Hsiao-Ling Yang, Joyce D. Kusuma, and Shyang-Yun Pamela Koong Shiao. 2022. "Validating Accuracy of an Internet-Based Application against USDA Computerized Nutrition Data System for Research on Essential Nutrients among Social-Ethnic Diets for the E-Health Era" Nutrients 14, no. 15: 3168. https://doi.org/10.3390/nu14153168