Article

Regulation of Dietary Protein Solubility Improves Ruminal Nitrogen Metabolism In Vitro: Role of Bacteria–Protozoa Interactions

1
College of Animal Science and Technology, Yangzhou University, Yangzhou 225009, China
2
State Key Laboratory of Sheep Genetic Improvement and Healthy Production, Xinjiang Academy of Agricultural Reclamation Sciences, Shihezi 832000, China
3
College of Animal Science, Xinjiang Agricultural University, Urumqi 830001, China
4
Mammalian Nutrition Physiology Genomics, Department of Animal Sciences and Division of Nutritional Sciences, University of Illinois, Urbana, IL 61801, USA
*
Authors to whom correspondence should be addressed.
Nutrients 2022, 14(14), 2972; https://doi.org/10.3390/nu14142972
Submission received: 27 June 2022 / Revised: 17 July 2022 / Accepted: 18 July 2022 / Published: 20 July 2022

Abstract

:
Precision dietary interventions (e.g., altering proportions of dietary protein fractions) has significant implications for the efficiency of nutrient use in ruminants, as well as lowering their environmental footprint, specifically nitrogen (N) emissions. Soluble protein (SP) is defined as the protein fraction that is rapidly degraded in the rumen (e.g., non-protein N and true protein), and our previous study found that regulating SP levels could improve N efficiency in Hu sheep. Thus, the present study was conducted to explore in vitro how protein fractions with different SP levels modulate the rumen microbial community and its association with N metabolism. Four dietary treatments with different SP proportions and similar crude protein (CP) content (~14%) were formulated (% of CP): 20 (S20), 30 (S30), 40 (S40) and 50 (S50). Results showed that NH3-N content increased with increasing SP levels at 4, 12 and 24 h; TVFA, acetate, propionate and valerate were higher in S30 and S40 (p < 0.05) and had quadratic effects (p < 0.05). Moreover, dry matter digestibility (DMD) and N digestibility (ND) were all decreased with S20 and S50 (p < 0.05). The S30 and S40 treatments increased the abundance of Bacteroidetes and Prevotella (Prevotella_ruminicola) but decreased the abundance of Firmicutes and Proteobacteria (p < 0.05). Bacterial pathways related to amino acid and fatty acid metabolism also were enriched with S30 and S40. The abundance of Entodinium was increased with S30 and S40 and had a positive correlation with Prevotella, and these two genera also played an important role in N metabolism and VFA synthesis of this study. In conclusion, bacterial and protozoal communities were altered by the level of SP (% of CP), with higher SP levels (~50% of CP) increasing the microbial diversity but being detrimental to rumen N metabolism.

1. Introduction

With the rapid development of the modern economy, the demand for high-protein food sources is increasing year by year, and beef, mutton, and dairy products (especially ruminant products) seem to be the first choice for most consumers [1,2]. However, ruminant production is one of the main drivers of global environmental degradation, and the contribution to environmental pollution is much greater compared with non-ruminants [3,4]. Ruminants account for over 70% of global livestock ammonia (NH3) emissions and around 30% of total anthropogenic NH3 emissions, resulting in significant economic losses and negative human health impacts [5,6]. In China, 55–59% of total nitrogen (N) emissions in the past decade (2004–2014) have been emitted into the air in gaseous form, with agricultural and livestock production accounting for the largest amount (62–69%) [7]. Hence, reducing the environmental impact of N emissions while meeting the growing demand for ruminant products is one of the main goals of current sustainable food production systems.
Feed nutrient composition is considered an important reference strategy to improve N retention and reduce N emission in ruminant production, e.g., using low-protein diets [8] or adjusting the rumen degradable to non-degradable protein ratio with a non-soluble to soluble carbohydrates ratio in diets [9]. Our previous study on Hu sheep indicated that when reducing crude protein (CP) content as well as adjusting soluble protein (SP) to 25–30%, N efficiency was increased [10]. Stefanski et al., isolated different protein fractions from rapeseed meal and demonstrated a different efficiency of ruminal N metabolism of these fractions in vivo [11]. Undeniably, feed protein fractions play an important role in nutrient absorption of ruminants, specifically the efficiency of N utilization.
Current research on SP in ruminant production has been mainly focused on establishing models of rumen metabolism, typically fractions PA1 (non-protein nitrogen, NPN) and PA2 (true protein) described by the latest CNCPS version 6.5 [12]. However, diet-microbiome interactions in the context of SP are rarely reported. Our previous research indicated that altering dietary SP levels to ~25–30% with decreasing CP increased the relative abundance of Prevotellaceae and Prevotella_1 in the rumen [10]. Ciliate protozoa accounting for an estimated 25% to 50% of microbial biomass in the rumen are also involved in the breakdown of nitrogenous substances, especially insoluble proteins [13]. Despite the antagonism of predation in protozoa–bacteria interactions, positive interactions (e.g., metabolic exchange) have also been demonstrated [14,15]. For instance, ciliate protozoa convert a small amount of insoluble protein that cannot be used in the rumen into SP for bacterial growth and utilization, thus contributing to dietary protein degradation [16]. Solomon et al., reported the existence of protozoa-mediated enrichment of the Gammaproteobacteria family and genera and increased the overall diversity of the genera Prevotella and Treponema, which resulted in significant individual variation in end-product metabolites including methane [17].
Rumen bacteria–bacteria interactions have attracted considerable attention in recent years, and our previous work has investigated the relationship between rumen bacteria, metabolites and phenotype when feeding Hu sheep low-protein diets with different SP. However, there is a paucity of information on how bacteria–protozoa interactions play a role in the rumen degradation of SP. In this study, we aimed to evaluate rumen bacterial communities, protozoal communities, and bacteria–protozoa interactions, as well as their associations with N metabolism in response to different SP levels in vitro. We hypothesized that altering SP levels could regulate rumen bacterial and protozoal communities, which result in different efficiency of N metabolism in vitro.

2. Materials and Method

2.1. Ethical Statement

All of the procedures performed on the animals followed the Guidelines of the Animal Welfare Committee of Yangzhou Veterinarians of the Agriculture Ministry of China under approved permit number SYXK (Su) 2021-0026.

2.2. Substrate Preparation and Determination of Protein Fractions

The substrate components consisted of six feeds, including rice straw, corn, soybean meal, wheat bran, corn protein meal and urea. The rice straw was harvested after maturity in the autumn of 2020 from the experimental farm of Yangzhou University. It was then dried naturally in the field. The other five concentrates were purchased through local commercial suppliers. All feeds were sampled by quartering and drying at 65 °C to a constant weight, and then they were ground to pass through a screen (1 mm) by a Retsch ZM 100 Wiley mill (Retsch GmbH, Haan, Germany) and stored. The SP content of six feeds was determined by following buffer-soluble N protocols in the standardization of procedures for N fractionation [18], which was described concretely in our previous study [10], and specific protein fractions (CP and SP values) are reported in Table S1.

2.3. Animal Management and Experimental Design

Ruminal fluid used for the experiment was selected from 3 male Hu sheep (body weight 59.7 ± 4.8 kg; age 18 ± 1 months) with permanent ruminal fistulas (Yangzhou University). Animals were raised in single pens and equipped with automatic drinking devices and feed troughs. The diet was fed (dry matter (DM) basis) to approximately 3% body weight, and water was available for ad libitum consumption. The diet was a total mixed diet consisting of 60% rice straw, 30% corn, 6% soybean meal, 2.5% wheat bran, and 1.5% premix, with daily feeding at 7:00 and 19:00 in equal amounts.
The feed ingredients described in Section 2.2 were used to configure the four dietary treatments, which consisted of a fixed amount of rice straw (50%) combined with concentrates in order to achieve the different SP proportions (as % of CP) of 20, 30, 40 and 50%, namely S20, S30, S40 and S50, respectively. The CP content of the substrates in each group was relatively consistent (~14%), and the modification in SP (% of CP) was mainly achieved by manipulation of the ingredient’s inclusion in the concentrate portion. The substrate composition and nutrient levels are shown in Table 1.

2.4. Rumen Fluid Inoculation and In Vitro Fermentation

Methods of ruminal fluid collection and in vitro culture referred to the protocols of our previous publication [19]. Briefly, a vacuum plastic catheter (internal diameter: 10 mm) was used to collect rumen fluid from three different points (vestibule, rucksack, abdominal sac) in the rumen before morning feeding. The rumen fluid filtrate was mixed and put into a thermos bottle (preheated to 39 °C and filled with CO2 to ensure anaerobic conditions) after filtering through four layers of gauze, then the bottle cap was immediately closed and quickly returned to the laboratory. Artificial buffer solution was prepared according to the method of Menke and Steingass [20] in which the chemical reagent of buffer solution was dissolved in 1 L of distilled water and included NaHCO3, NH4HCO3, Na2HPO4, KH2PO4, MgSO4·7H2O, Na2S, MnCl2·4H2O, CoCl2·6H2O, FeCl3·6H2O, CaCl2·2H2O and resazurin. Before inoculation, buffer solution was preheated in a water bath oscillator (SHA-A, Hengfeng Instrument, Jintan, China) at 39 °C, and high-purity CO2 was continuously introduced to adjust the pH to 6.8 until the solution was colorless. Then, the filtered rumen fluid and buffer solution were thoroughly mixed at a volume ratio of 1:2 under anaerobic conditions. A total of 60 mL of the mixed solution was used as a culture medium to dispense into a 200 mL fermentation flask with substrate (1.0000 ± 0.1000 g), shaken and placed at 39 °C for a 24 h incubation.
A total of 120 fermentation flasks (4 treatments × 5 sampling times × 6 replicates each time) were used and sampled at different time points for the determination of fermentation parameters, substrate digestibility and microbial communities (bacteria and protozoa).

2.5. Sample Collection and Analysis

The fermentation flasks were taken out quickly at 2, 4, 8, 12, and 24 h, and placed on ice to terminate the fermentation. In total, 5 mL of each culture medium was collected, and the pH value was measured immediately with a pH meter (pHS-3C, Shanghai, China). Ammonia N (NH3-N) concentration was measured according to Broderick and Kang (phenol-hypochlorite system) [21], microbial protein (MCP) content was determined by the purine prediction method [22]; gas chromatography (GC-14B, Kyoto, Japan) was used for determination of volatile fatty acids (VFAs), with crotonic acid as the internal standard [23], and specific procedure settings referred to our previous publication [10]. The substrate residues at each time point were collected to detect dry matter digestibility (DMD) and N digestibility (ND). The residue of the substrate was filtered through a nylon bag (20 μm pore size), then dried at 65 °C to constant weight, and the DMD was finally calculated by the weight of the disappearance. ND at 24 h was determined and calculated via a Kjeldahl analyzer (FoodALYT D4000, Bremen, Germany).

2.6. DNA Extraction, Library Construction, 16S/18S rRNA Sequencing and Data Processing

The fecal genomic DNA extraction kit (DP328-02, Tiangen Biochemical Technology Co., Ltd., Beijing, China) was used to extract the total genomic DNA of culture media samples at 24 h. DNA concentration and purity were monitored on 1% agarose gels. According to the concentration, DNA was diluted to 1 ng/μL with sterile water. 16S/18S rRNA genes in distinct regions were amplified with specific primer (e.g., 16S V3–V4: 341F(5′-CCTAYGGGRBGCASCAG-3′)-806R(5′-GGACTACNNGGGTATCTAAT-3′), 18S V4: 316F (5′-GCTTTCGWTGGTAGTGTATT-3′)-539R (5′-CTTGCCCTCYAATCGTWCT-3′)) and barcodes [24]. All PCR mixtures contained 15 μL of Phusion® High-Fidelity PCR Master Mix (New England Biolabs), 0.2 μM of each primer and 10 ng target DNA, and cycling conditions consisted of a first denaturation step at 98 °C for 1 min, followed by 30 cycles at 98 °C (10 s), 50 °C (30 s) and 72 °C (30 s) and a final 5 min extension at 72 °C. An equal volume of 1× loading buffer (contained SYB green) was mixed with PCR products and electrophoresis was performed on a 2% agarose gel for DNA detection. The PCR products were mixed in equal proportions, and then Qiagen Gel Extraction Kit (Qiagen, Germany) was used to purify the mixed PCR products.
Following the manufacturer’s recommendations (Novogene Co., Ltd., Tianjin, China), sequencing libraries were generated with NEBNext® Ultra™ IIDNA Library Prep Kit (Cat No. E7645). The library quality was evaluated on the Qubit@ 2.0 Fluorometer (Thermo Scientific, Wilmington, DE, USA) and Agilent Bioanalyzer 2100 system. Lastly, the library was sequenced on an Illumina NovaSeq platform and 250 bp paired-end reads were generated. Paired-end reads were merged using FLASH (Version 1.2.11) [25], whereas quality filtering on the raw tags was performed using the fastp (Version 0.20.0) software [26] to obtain high-quality Clean Tags. The Clean Tags were compared with the reference database (Silva database https://www.arbsilva.de/ for 16S/18S, (accessed on 11 February 2022)) using Vsearch (Version 2.15.0) to detect the chimera sequences, and then the chimera sequences were removed to obtain the Effective Tags [27]. Denoise was performed with the DADA2 module in the QIIME2 software (Version 202006) to obtain initial ASVs (Amplicon Sequence Variants), and then ASVs with an abundance less than 5 were filtered out [28]. Species annotation was performed using QIIME2 based on the Silva Database, and the relative abundance of 7 classification levels (domain, phylum, class, order, family, genus and species) was obtained. Alpha diversity (Chao1 and Shannon index) and beta diversity (PCoA) based on the Bray–Curtis dissimilarity matrix were calculated in QIIME2 and visualized via the “ggplot2 package” in an R program (v 3.6.1). The Wilcoxon rank-sum test was used to analyze differences between treatments at the phylum and genus levels for bacteria and protozoa and visualized via “ggtree” and “ggplot2” packages.
Bacterial function predictions were performed via the PICRUSt 2 package (https://github.com/picrust/picrust2/wiki, (accessed on 11 February 2022)) [29] with pathways annotated in the Kyoto Encyclopedia of Genes and Genomes (KEGG) database. Principal component analysis (PCA) was performed on the absolute abundance results of pathway annotation. Linear discriminant analysis (LDA) effect size (LEfSe) was used to compare the marker pathways among SP treatments (LDA score > 2.5, p < 0.05).

2.7. Statistical Analysis

Data for pH, NH3-N, MCP and DMD were analyzed using PROC MIXED of SAS software (version 9.3, SAS Institute Inc., Cary, NC, USA), and analytical models included fixed effects (treatment, sampling time, treatment × sampling time) and random effects (sample replicates). PROC GLM procedure was performed for NH3-N, VFAs, ND, bacterial/protozoal alpha diversity and species level of bacteria. Tukey’s method was applied for multiple comparisons among treatments. Linear and quadratic effects were tested by orthogonal polynomial contrasts, with significance declared at p ≤ 0.05 and tendency at 0.05 < p ≤ 0.1. Spearman’s rank correlation analysis was performed for the interaction of rumen bacteria, protozoa and fermentation, and the rank coefficient and q value (FDR-adjusted p-value) were calculated via the “Psych” package in an R program, with the threshold declared at q < 0.05 or |r| > 0.5. The correlation heatmaps were visualized by the “ggcorrplot” R package.

3. Results

3.1. In Vitro Rumen Fermentation and Digestibility

Table 2 shows that the sampling time and the interaction between time and treatment had significant effects on pH value (p < 0.05), which decreased over time. However, there was no difference among treatments at different sampling times (p > 0.05).
The sampling time and SP treatments had significant effects on NH3-N content (Table 3, p < 0.05), which showed first a decrease and then an increase. S50 were all highest at 4, 12 and 24 h compared with other treatments (p < 0.05).
Since significant differences among SP treatments were observed above, trend analysis (Table S2) at each time point was performed, NH3-N content showed significant linear and quadratic effects at 4 h (p < 0.05), while at 12 and 24 h, NH3-N content linearly increased with increasing substrate SP (p < 0.05).
Table 4 showed that sampling time had significant effects on MCP content (p < 0.05), which fluctuated irregularly with time, while SP treatments and the interaction between time and treatment had no significant effects (p > 0.05).
As shown in Table 5, VFA concentrations differed with TVFA, acetate and propionate, being higher in S30 and S40 (p < 0.05), while valerate was increased in S30 compared with S20 and S50 (p < 0.05). With the increase in SP (% of CP), they showed quadratic effects (p < 0.05).
Sampling time and SP treatments had significant effects on DMD (Figure 1A), and S30 was the highest at 24 h compared with the other three treatments (p < 0.05), while as shown in Figure 1B, ND in S30 and S40 was higher than S20 and S50 at 24 h (p < 0.05).

3.2. Bacterial Diversity and Taxonomic Differences In Vitro

A total of 2,598,686 raw reads were obtained from in vitro rumen samples for bacterial 16S rRNA genes, and 51,654 effective tags on average were achieved after quality control. Lastly, 5,010 ASVs were generated from all samples. A Venn diagram (Figure 2A) revealed that the intersection ASVs of four treatments were 538, which accounted for 13.41% of the total ASVs, the numbers of unique ASVs for the S20, S30, S40 and S50 were 316 (7.88%), 418 (10.42%), 453 (11.29%), and 1230 (30.67%), respectively. The PCoA results (Figure 2B) revealed significant differences in the bacterial communities (PERMANOVA: p = 0.001). In alpha diversity (Figure 2C,D), the Chao 1 index with the S30 and S50 was higher than S20 (p < 0.05), while the Shannon index with S30 was higher than S20 and S40 (p < 0.05).
Bacteroidetes, Firmicutes and Proteobacteria were the dominant phyla (Figure 2E) and Prevotella, Rikenellaceae_RC9_gut_group and Ruminococcus were the dominant genus (Figure 2F), multiple comparisons (Figure 2G) found that S30 and S40 increased the abundance of Bacteroidetes and Prevotella but decreased the abundance of Firmicutes and Proteobacteria (p < 0.05); meanwhile, they showed quadratic effects (Figure 2H, p < 0.05). At the species level (Table 6), Prevotella_ruminicola was increased in S30 and S40 (p < 0.05), S50 increased Fibrobacter_succinogenes compared with S30, and bacterium_AC2043 in S40 was lower than S20 and S50 (p< 0.05).

3.3. Predicted Ruminal Microbial Functions via PICRUSt2

KEGG pathway annotation results (Figure 3A) showed that the main functions of bacterial genes were concentrated in metabolism, genetic information processing and environmental information processing (level 1), especially carbohydrate metabolism, amino acid metabolism and energy metabolism (level 2). PCA results (Figure 3B) showed significant differences in bacterial gene function among SP treatments (PERMANOVA: p = 0.001). At level 3 metabolic pathways (Figure 3C), we found many functions were enriched on S30 and S40 (LDA > 2.5, p < 0.05), especially carbohydrate metabolism and amino acid metabolism: amino-acid-related enzymes (S30); alanine, aspartate, and glutamate metabolism (S30); cysteine and methionine metabolism (S30); galactose metabolism (S30); lysine degradation (S40); valine, leucine and isoleucine degradation (S40); propanoate metabolism (S40); and butanoate metabolism (S40).

3.4. Protozoal Diversity and Taxonomic Differences In Vitro

In total, 2,724,311 raw tags were derived from the protozoa 18S rRNA gene sequencing, with 84,079 effective tags on average achieved from all samples after quality control. Based on the effective tags of all samples, OTUs (Operational Taxonomic Units) clustering with 97% identity resulted in 590 OTUs. A Venn diagram (Figure 4A) revealed that the intersection OTUs of four treatments was 112 (19.11% of total), and the numbers of unique OTUs for the S20, S30, S40 and S50 were 87 (14.85%), 80 (13.65%), 59 (10.07%), and 68 (11.60%), respectively. The PCoA results (Figure 4B) revealed significant differences in the protozoal communities among SP treatments (PERMANOVA: p = 0.001). However, no difference was found in protozoal alpha diversity (Figure 4C,D).
Thirty-one taxa were identified at the genus level and had an evolutionary relationship between genera and taxonomic phyla (Figure 4E), which mainly belong to Ciliophora (>99%). Entodinium was the dominant genus, which accounted for 79.1%~88.5% (relative abundance), followed by Isotricha (1.2%~2.5%). By comparing the four treatments (Figure 4F), S30 and S40 increased the abundance of Entodinium but decreased the abundance of Dasytricha (p < 0.05), which also had quadratic effects (Figure 4H, p < 0.05). In addition, S50 up-regulated the abundance of Isotricha and Ophryoscolex compared with S30 and S40 (p < 0.05).

3.5. The Interaction of Rumen Bacteria, Protozoa and Fermentation

Spearman’s rank correlations between rumen bacteria genus and protozoa genus showed that Prevotella had strong positive correlations with Entodinium, while negative correlations with Isotricha, Ostracodinium and Dasytricha (Figure 5A). On the other hand, different rumen microbiota had strong correlations with TVFA, acetate, propionate, DMD and ND, especially Bacteroidetes, Prevotella, Prevotella_ruminicola and Entodinium, which had strong positive correlations with them (Figure 5B).

4. Discussion

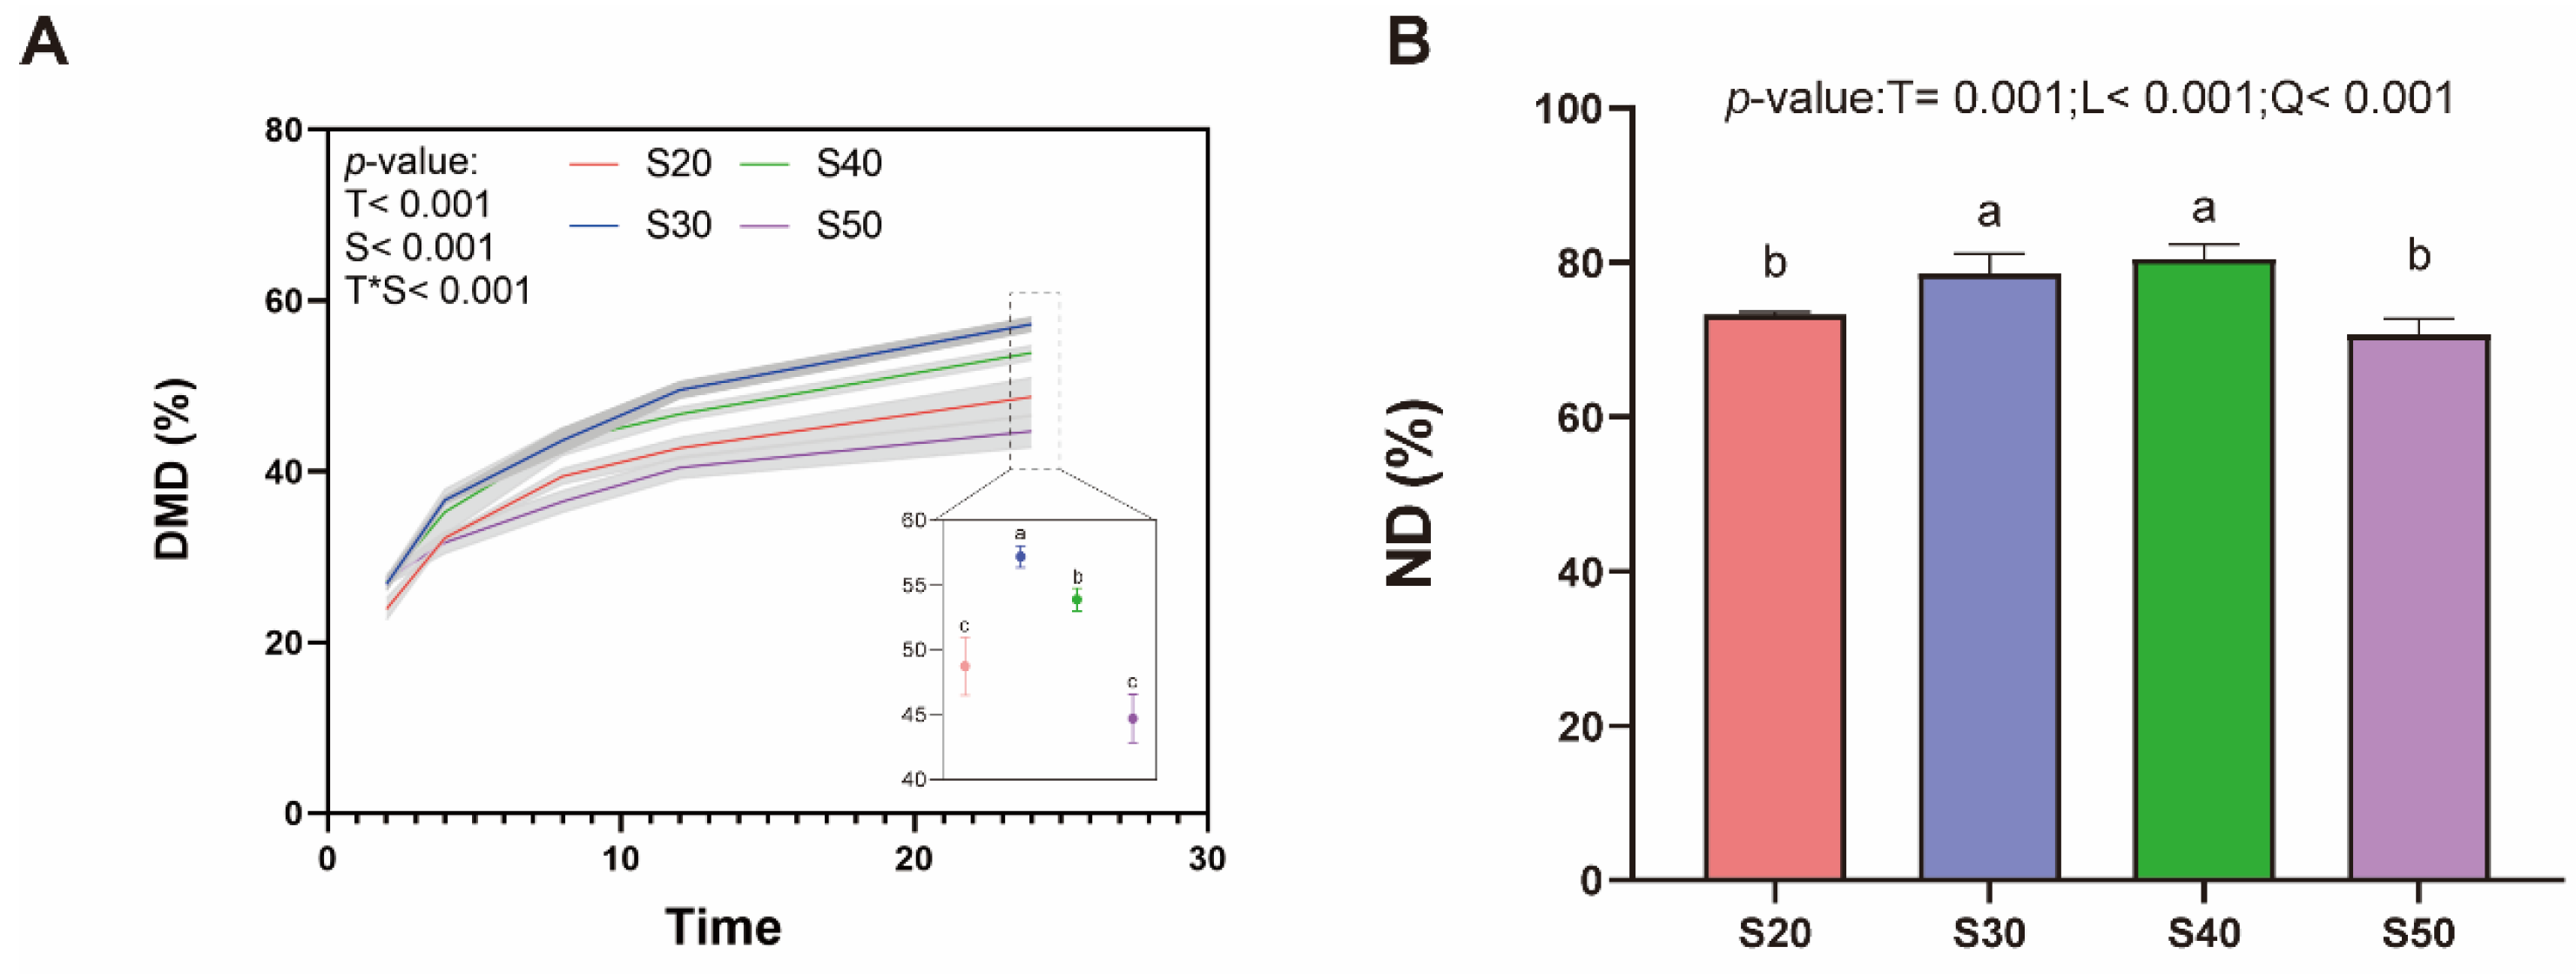
Regulation of dietary protein fractions is one of the important nutritional intervention strategies to improve nutritional metabolism in ruminants. Our previous in vivo experiments have shown that SP levels (% of CP) of ∼25–30% have higher N efficiency with dietary CP content decreased by∼10% in Hu sheep [10]. In this study, as time progressed, the pH value of each treatment gradually decreased and fluctuated from 6.85 to 5.90, which was mainly due to the decomposition and utilization of substrate nutrients by rumen microorganisms and the accumulation of organic acids [30]. It is worth noting that the urea addition level of the substrate gradually increased (0~1.6% DM). Tian et al. [31] showed that the hydrolysis of urea is alkaline; thus, with the increase in urea addition, the pH value also increased. However, the change in pH was not obvious among treatments in this study, which may be related to the urea addition levels.
The fluctuation of NH3-N concentration in the rumen reflects the degradation of dietary N and the utilization of NH3-N by rumen microorganisms. Generally, the optimal NH3-N concentration of rumen microorganisms is 6.3–27.5 mg/dL [32]. In our study, the NH3-N concentration of each treatment fluctuated from 9.6 to 24.5 mg/dL, which was within the normal range. However, SP treatments significantly changed the NH3-N concentration, especially in the S50, in which it was at a high level from 4 h of in vitro fermentation, which may be mainly related to the higher SP level (50% of CP) in the substrate. A large amount of SP in the substrate was rapidly decomposed in the rumen to generate ammonia, polypeptides and amino acids, while excess ammonia could not be utilized by rumen microorganisms [33]. The above results were also consistent with the in vivo study. Similarly, Wilson et al. [34] reported that the NH3-N concentration in the rumen was significantly up-regulated with increasing dietary SP (% of CP) from 34.4% to 44.9%. At 24 h, as the substrate SP (% of CP) was 30, the NH3-N concentration was lower, which may reflect the balance of substrate carbon and N degradation, and the rumen microorganisms could utilize the generated NH3-N to a greater extent.
Stern et al. [35] found that substrate protein solubility (22.7 vs. 36% of CP) had no significant effect on MCP synthesis in vitro, and high SP substrates (36% of CP) seemed to reduce the DM digestibility, which was similar to our results of decreased DM digestibility in S50, the reason might be that the release of substrate energy and N in S50 was asynchronous, which led to the decline of fermentation efficiency [36]. Moreover, Hume et al. [37] reported that the maximum synthesis of MCP was related to the NH3-N concentration (8.8 mg/dL), which is comparable to the concentration in the S30 at 8 h (10.93 mg/dL), and the MCP content at this time point was indeed the highest numerically. In addition, our previous in vivo study also found that with the increase in SP levels (21.2–29.4%), no difference was found in MCP content.
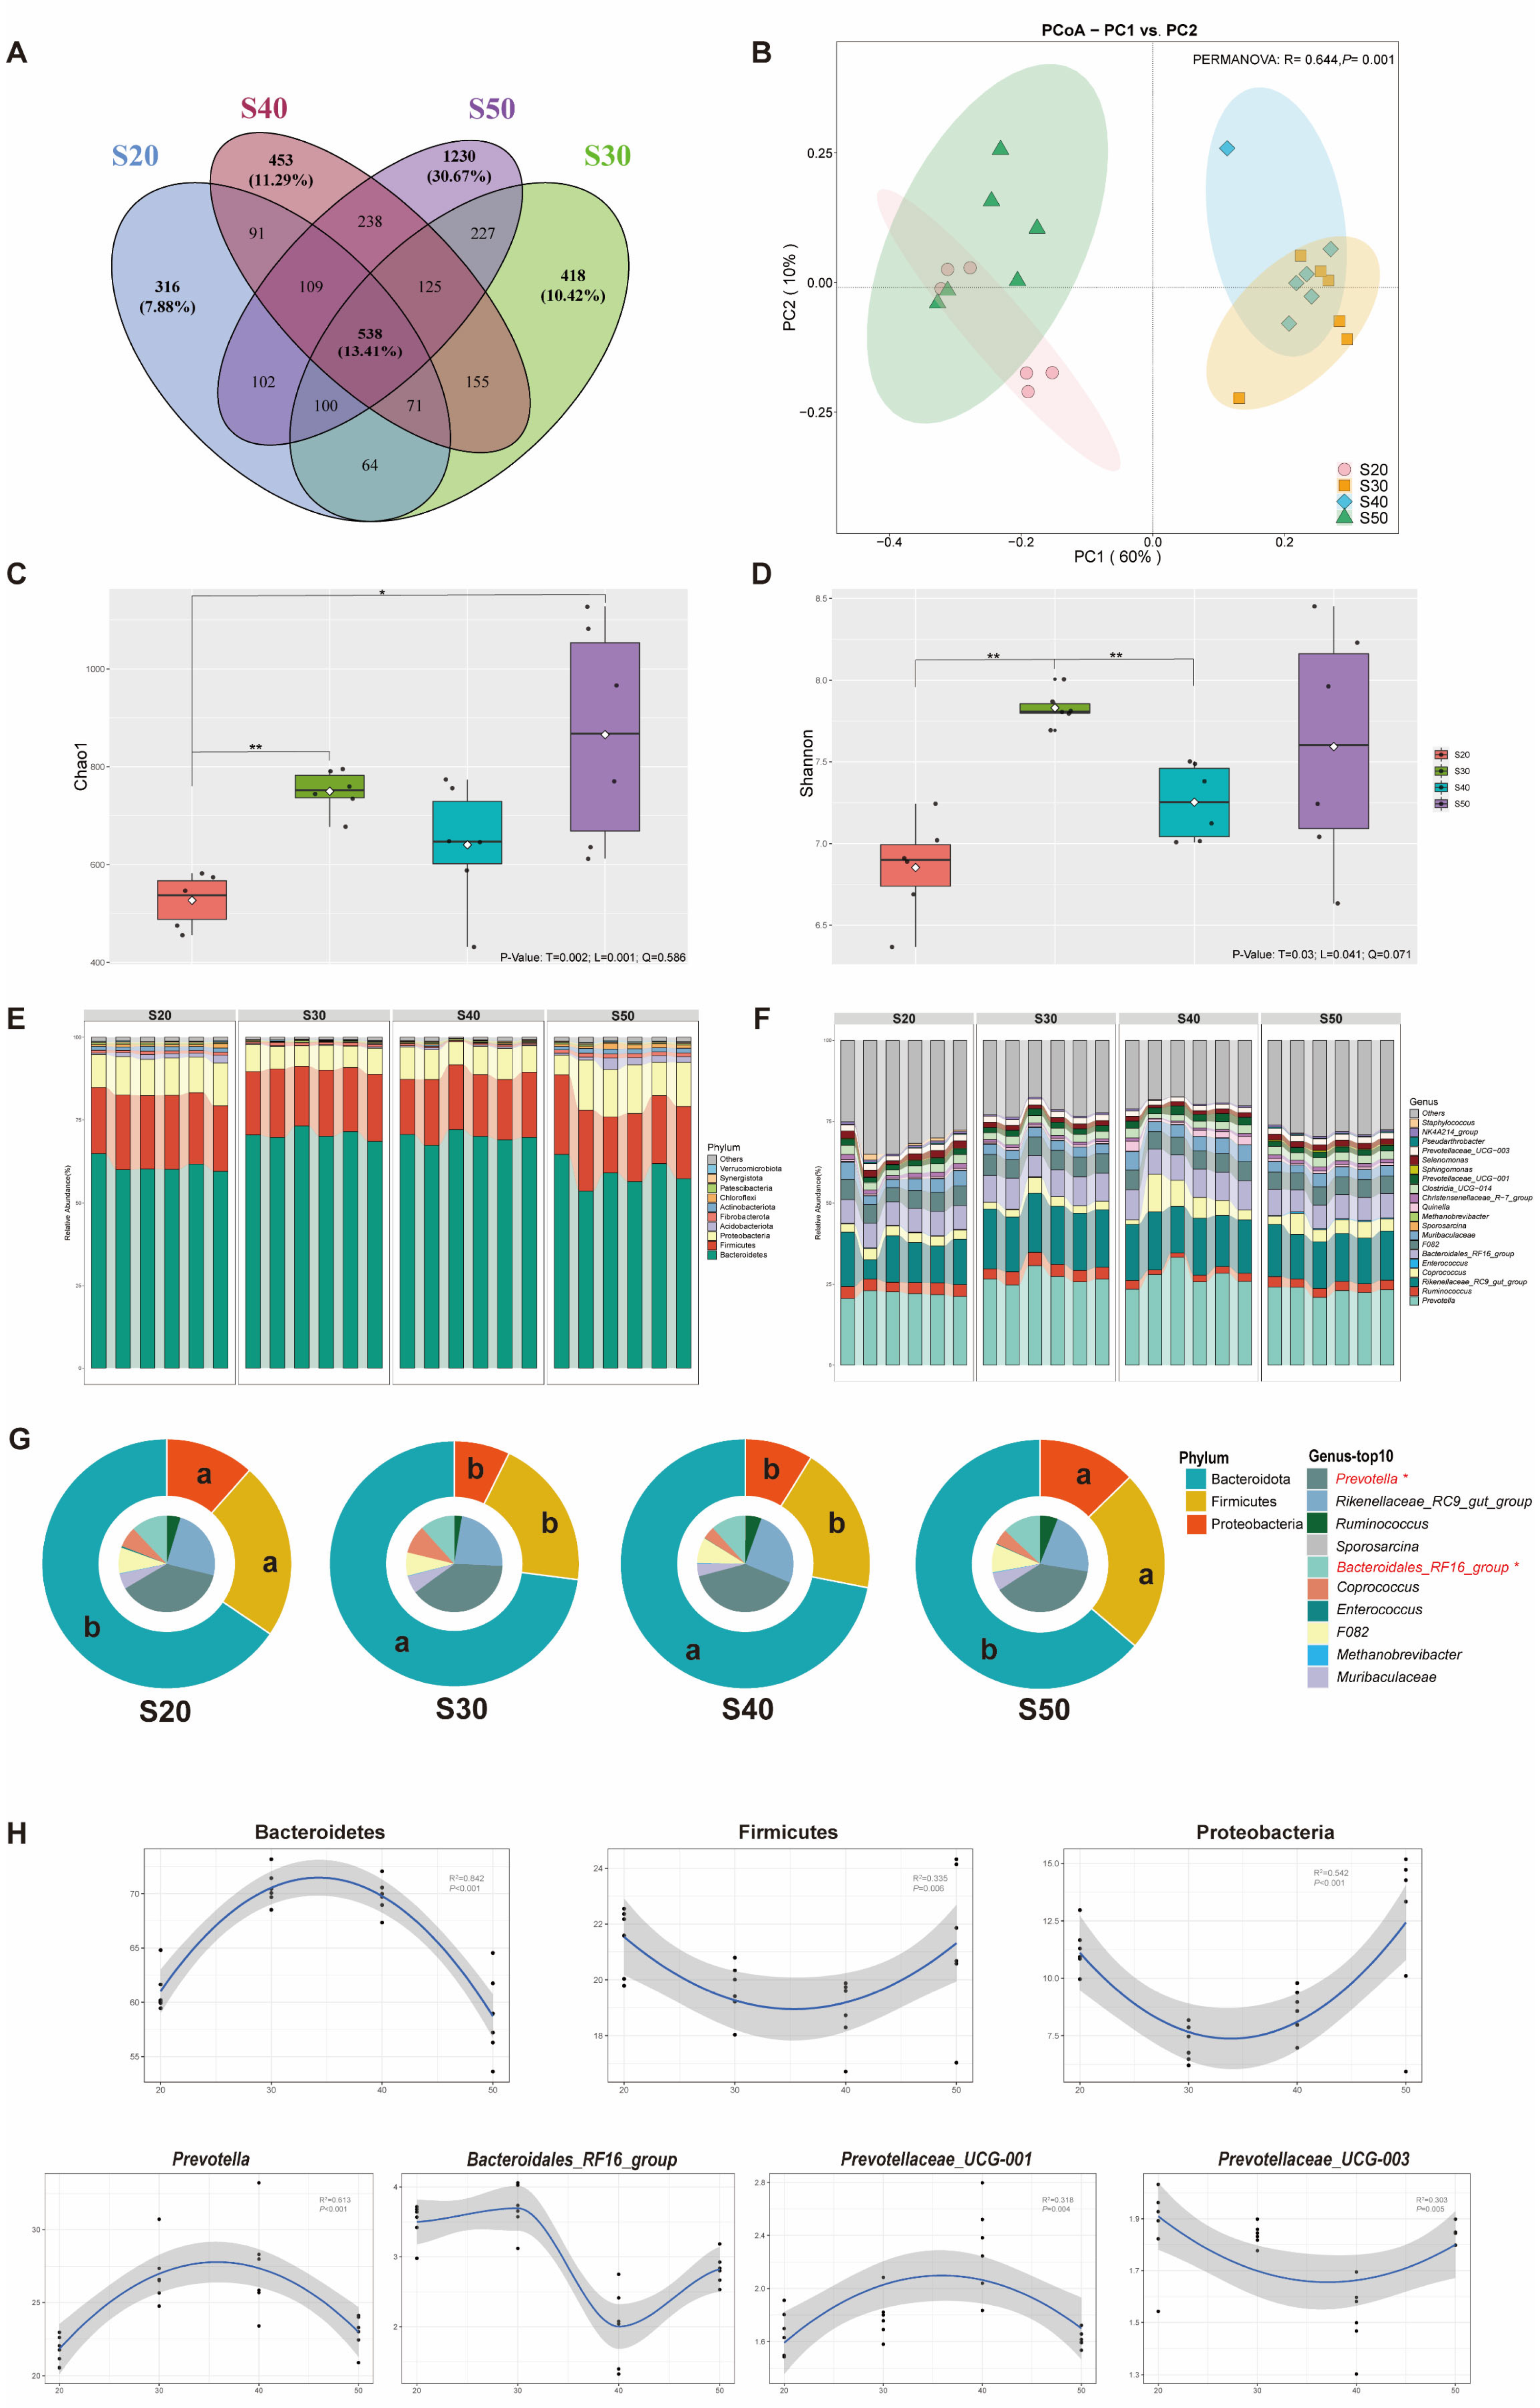
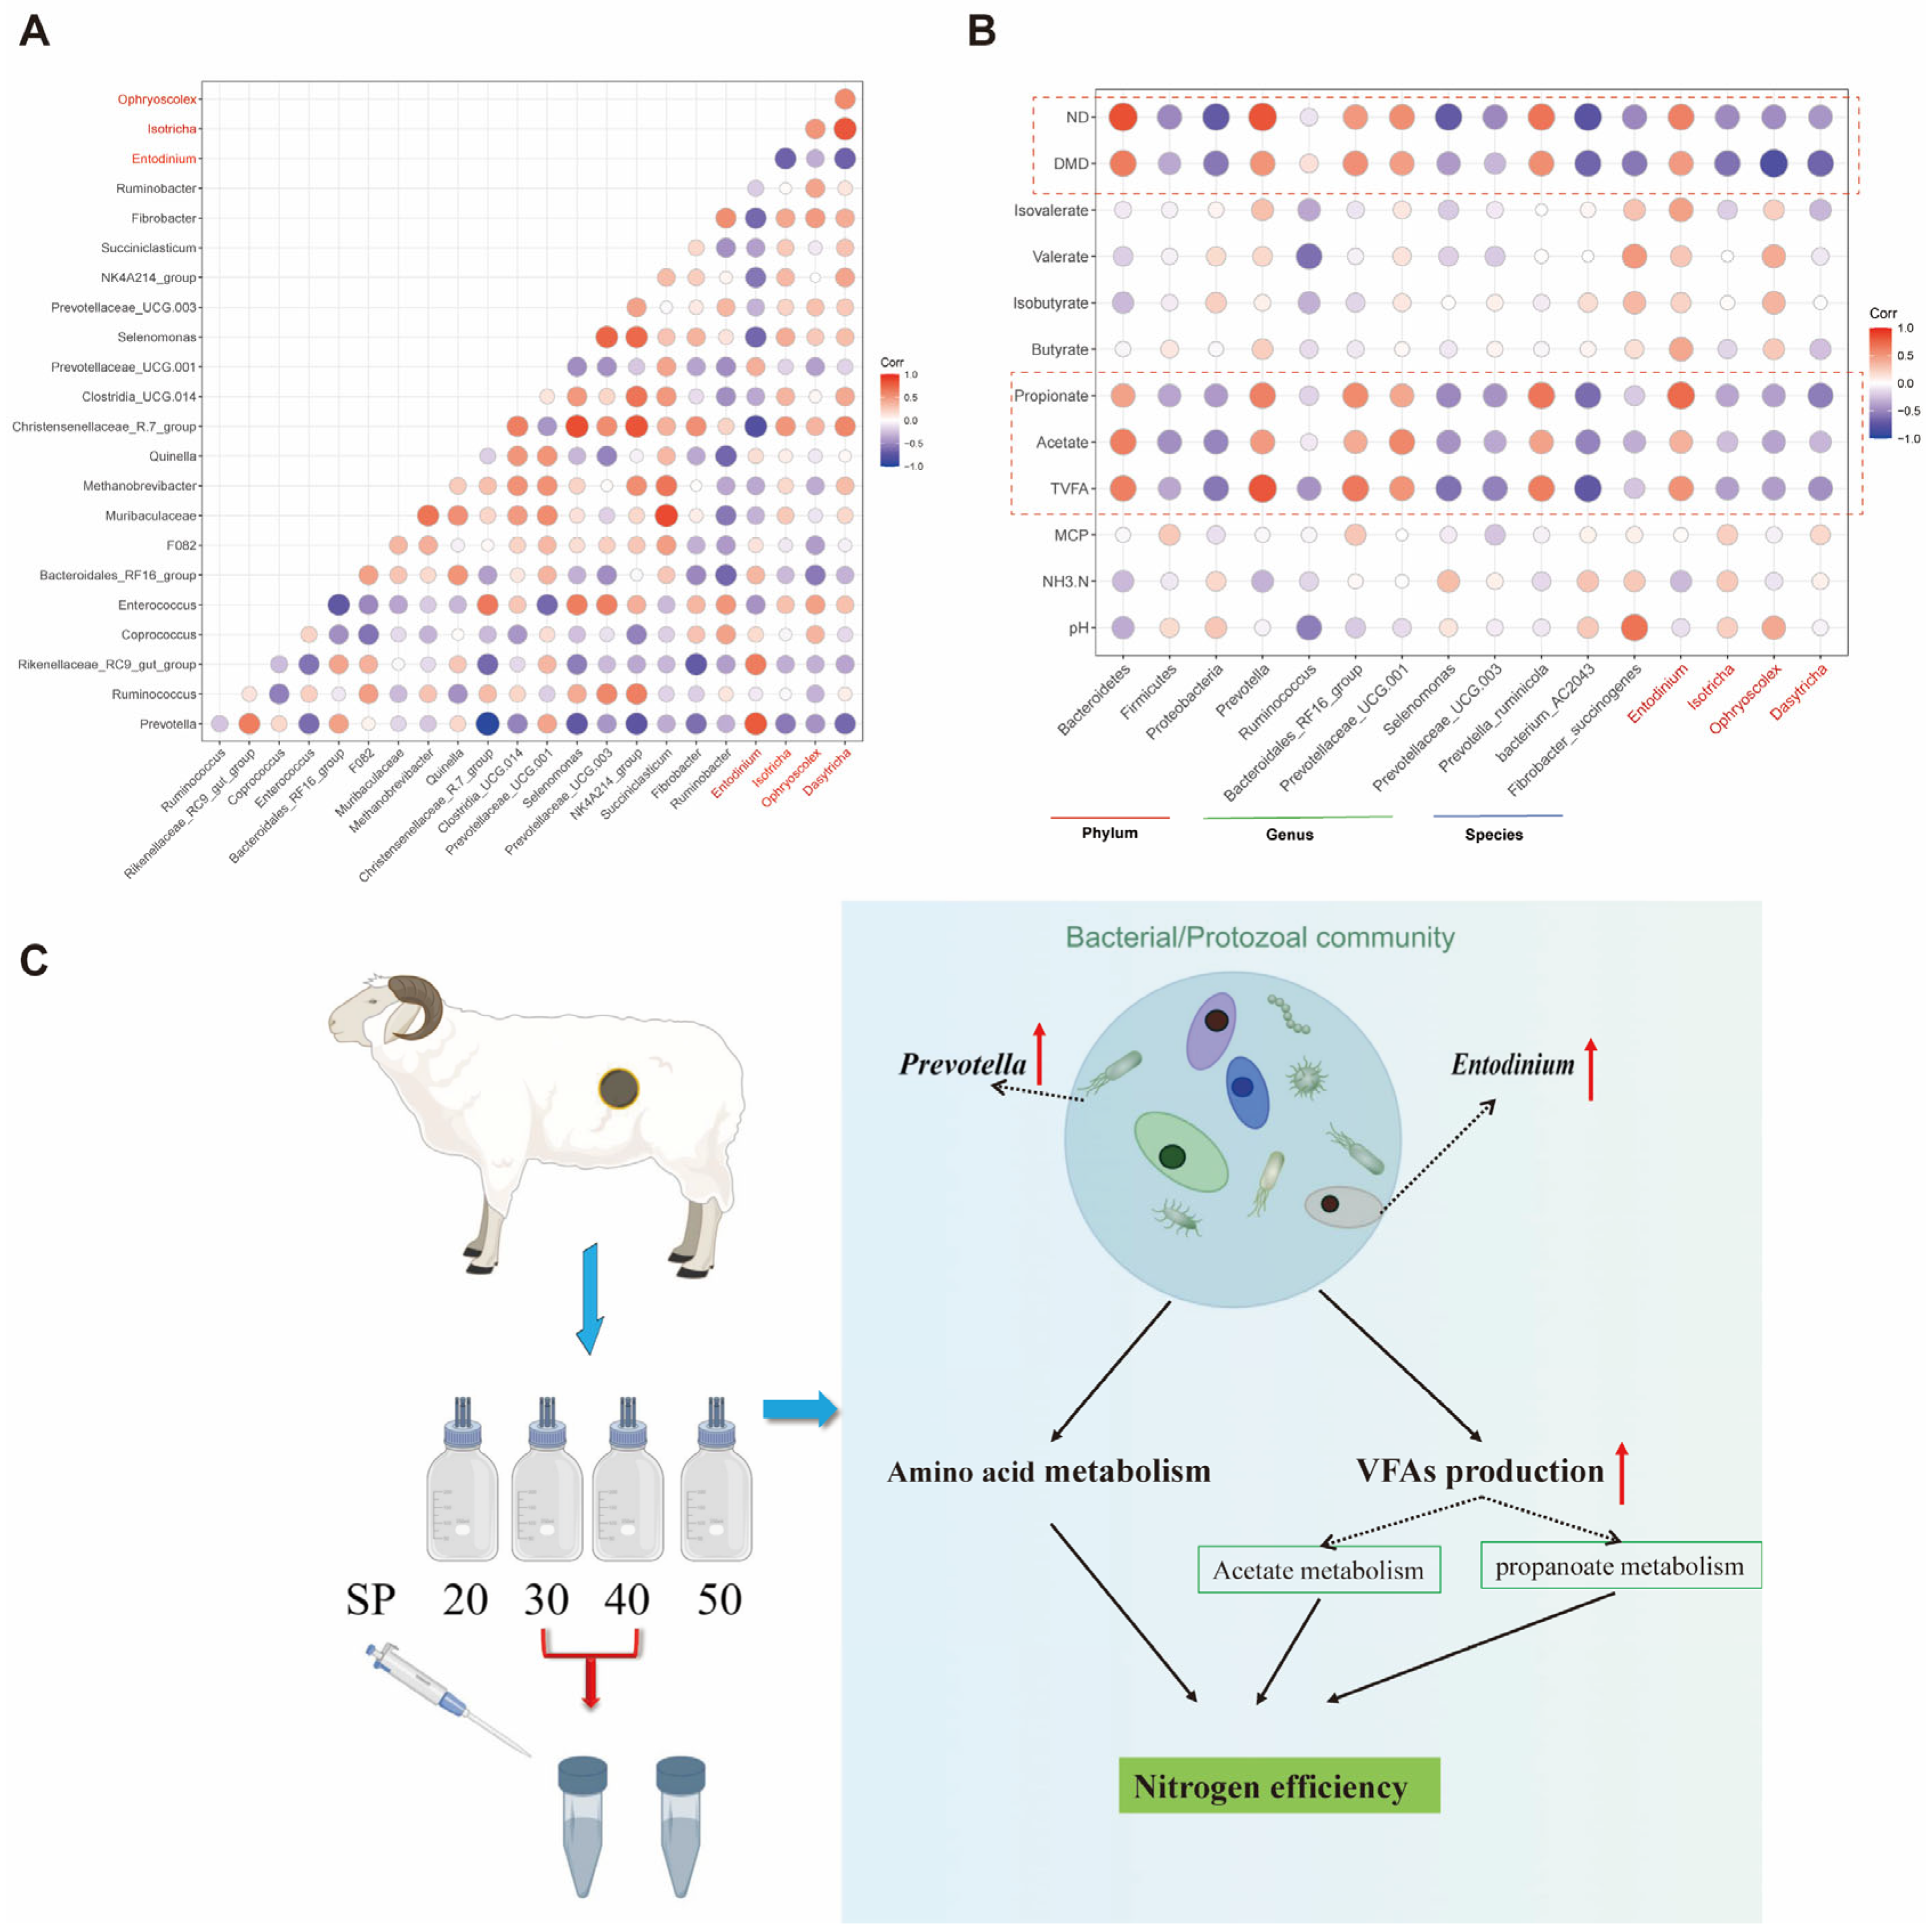
From the view of the rumen microbiome, the abundance of Bacteroidetes was improved, and Firmicutes and Proteobacteria were decreased as SP (% of CP) was 30 and 40. The total relative abundance of these three bacterial phyla in this study was over 80%. The host digests plant feed primarily through fermentation mediated by the microorganisms in these three phyla levels [38]. In addition, VFA, acetate, propionate and valerate were also elevated with S30 and S40, which may be attributed to the enrichment of Prevotella, which was the core genus of Bacteroidetes. The functions of this microbe include the fermentation of carbohydrates, the utilization of nitrogenous substances, and the biotransformation of bile acids and other steroids; the main by-products of anaerobic respiration are acetate, isovalerate, and succinate, which are closely related to VFA biosynthesis [39,40]. Moreover, propionate is a major substrate of gluconeogenesis, and a recent study also showed that it is closely related to ruminal N metabolism [41]. Unsurprisingly, bacteria functional annotations were also enriched in fatty acid metabolism and propanoate metabolism (
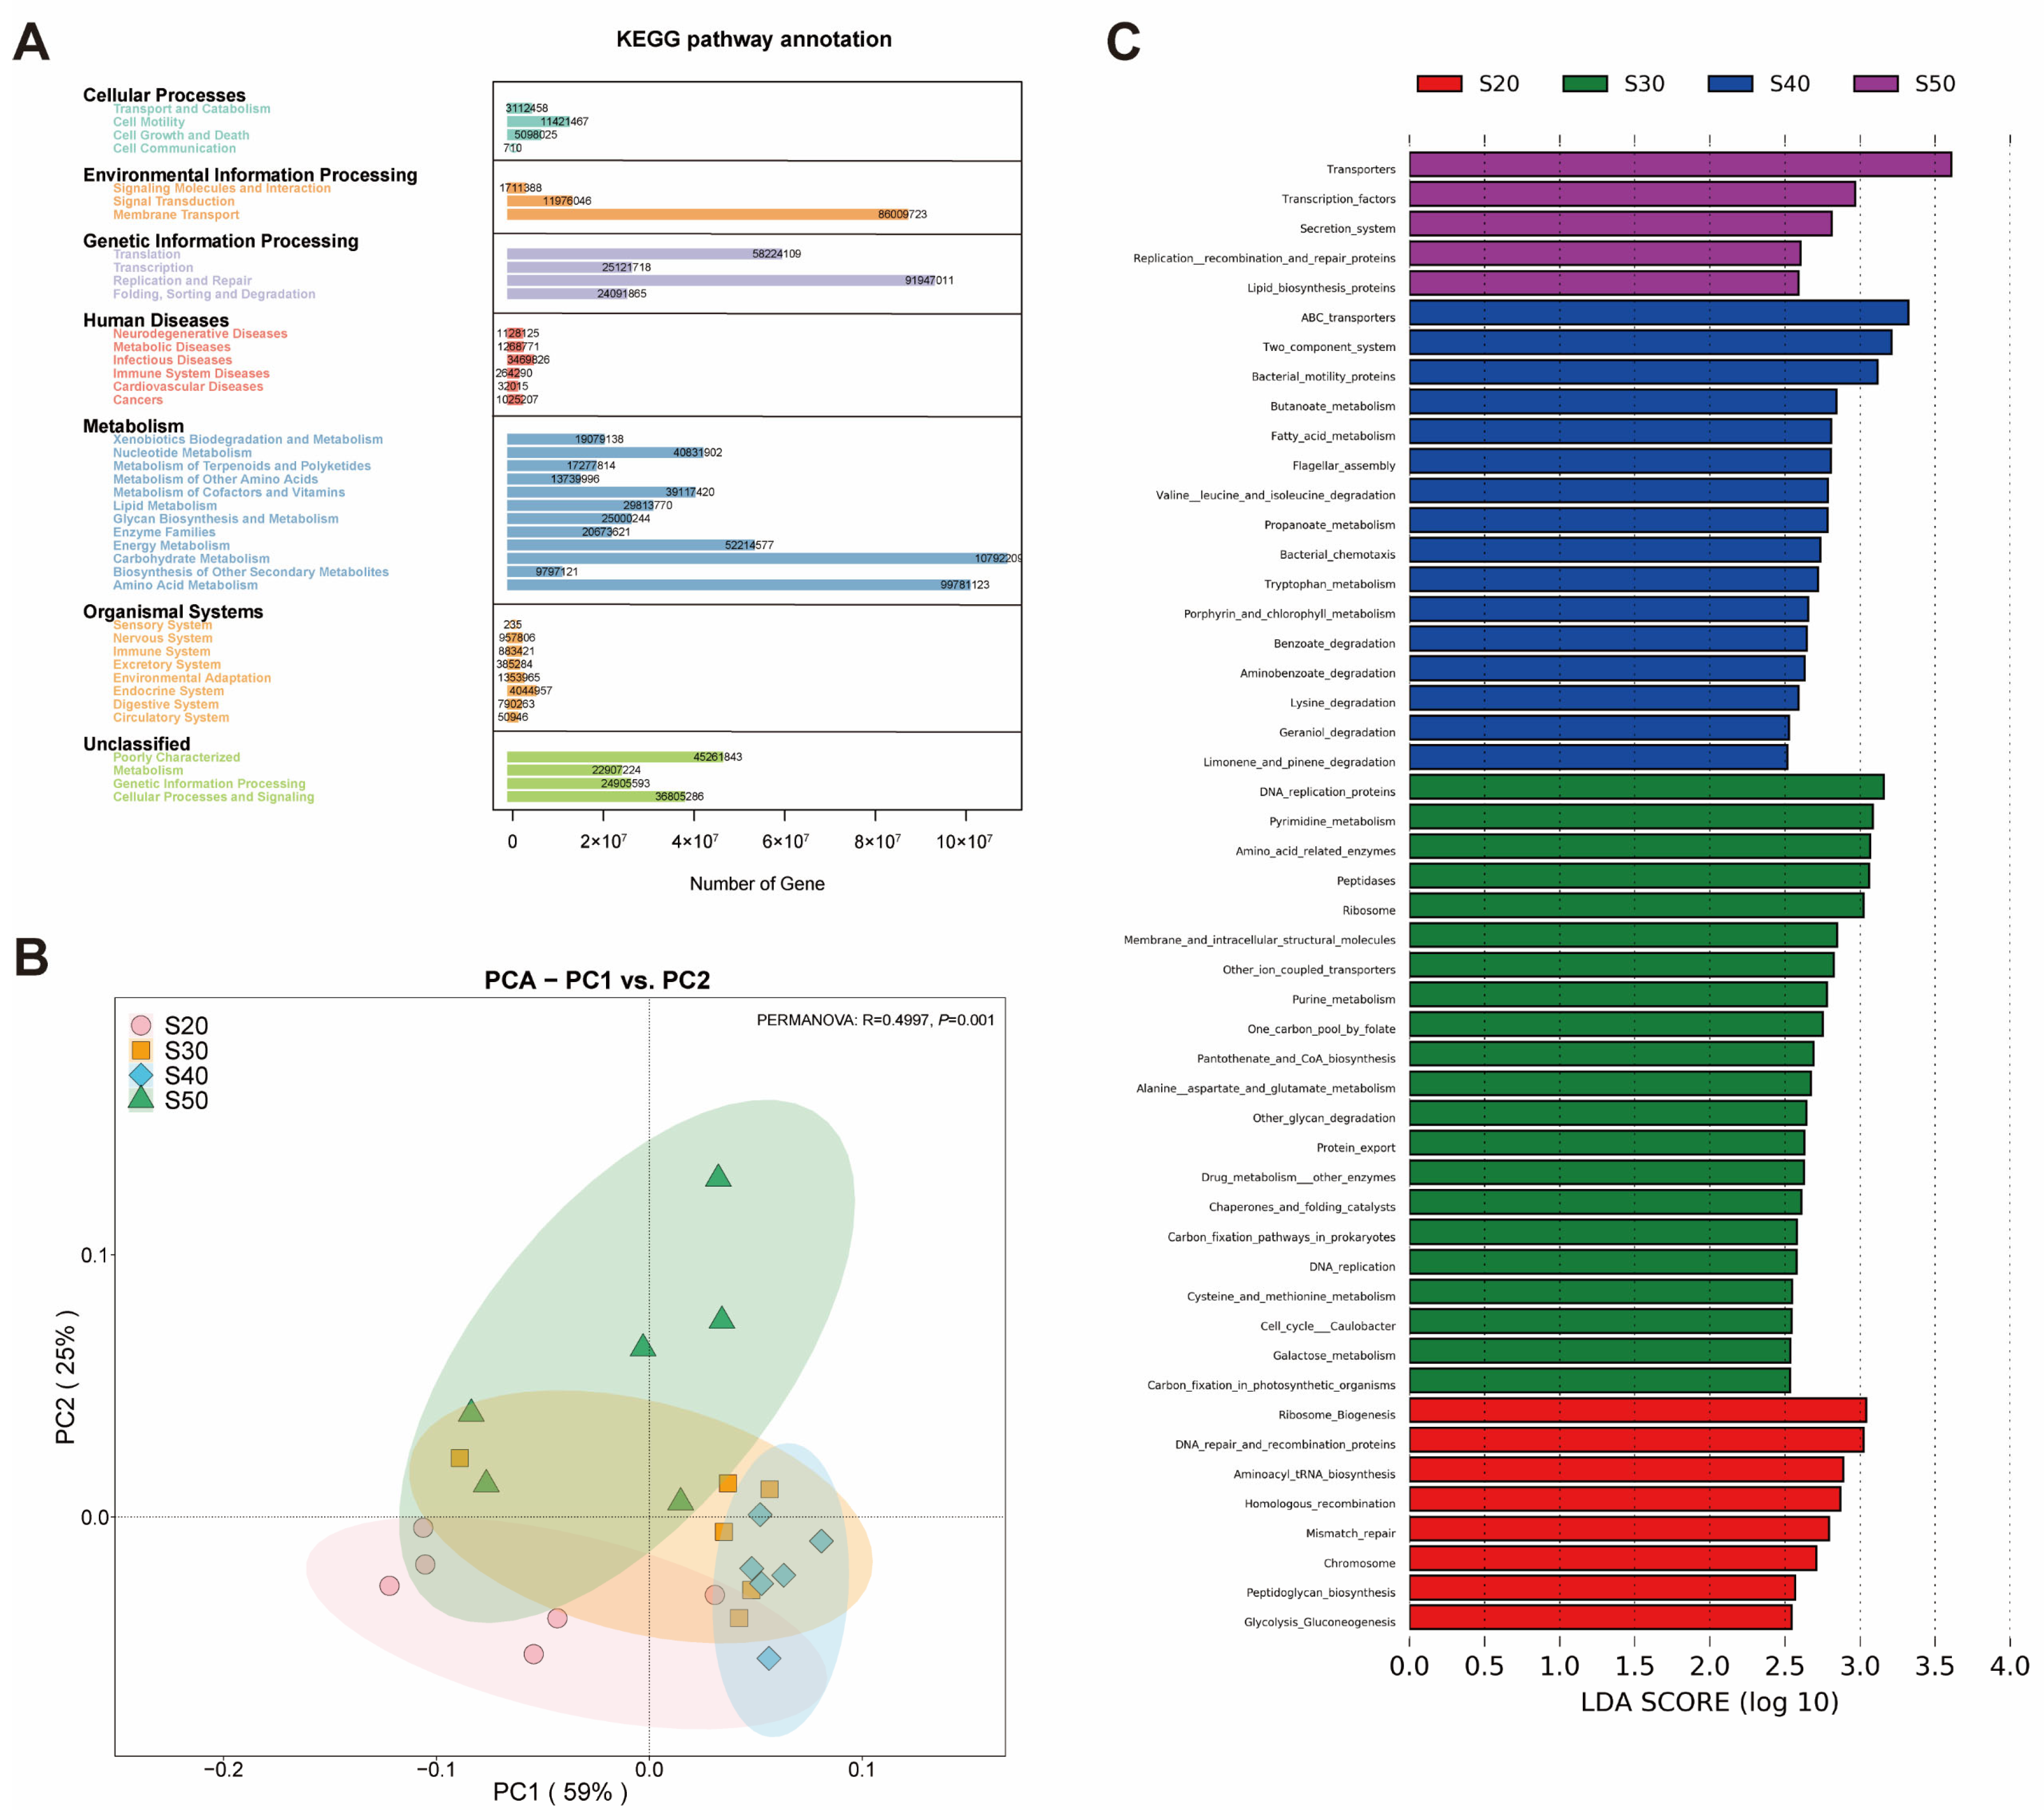
Figure 3C), which was consistent with our findings in vivo.
Prevotella_ruminicola (P. ruminicola) plays an important role in the metabolism of proteins and peptides in the rumen [42]. P. ruminicola has the greatest range and activity of dipeptidyl peptidases, which release dipeptides from the N-terminus of peptides [43] and may be the main reason for the higher substrate N digestibility in S30 and S40 and also the strong positive correlation of this microbe with ND (Figure 5B). A recent study [44] showed that lower methane emissions and higher feed conversion efficiency were associated with a higher abundance of P. ruminicola, which was also validated from the results that substrates DMD and ND were increased in S30 and S40, while methane production requires subsequent experiments to verify. Furthermore, it was observed that the abundance of Fibrobacter_succinogenes (F. succinogenes), which is considered to be a key cellulolytic bacterium that promotes the metabolism of other microbiota members by degrading cellulose into soluble sugars and succinate [45], was up-regulated in S30 and S40. In spite of the weak peptidolytic activity, studies have reported that when P. ruminicola was co-cultured with F. succinogenes, the substrate nutrition digestibility was increased compared with culturing F. succinogenes alone [46]. In addition, the bacterial functions were enriched in related amino acid metabolism and carbohydrate metabolism at SP (% of CP) of 30 and 40, which also verified the higher substrate nutrient utilization obtained in S30 and S40 in our study.
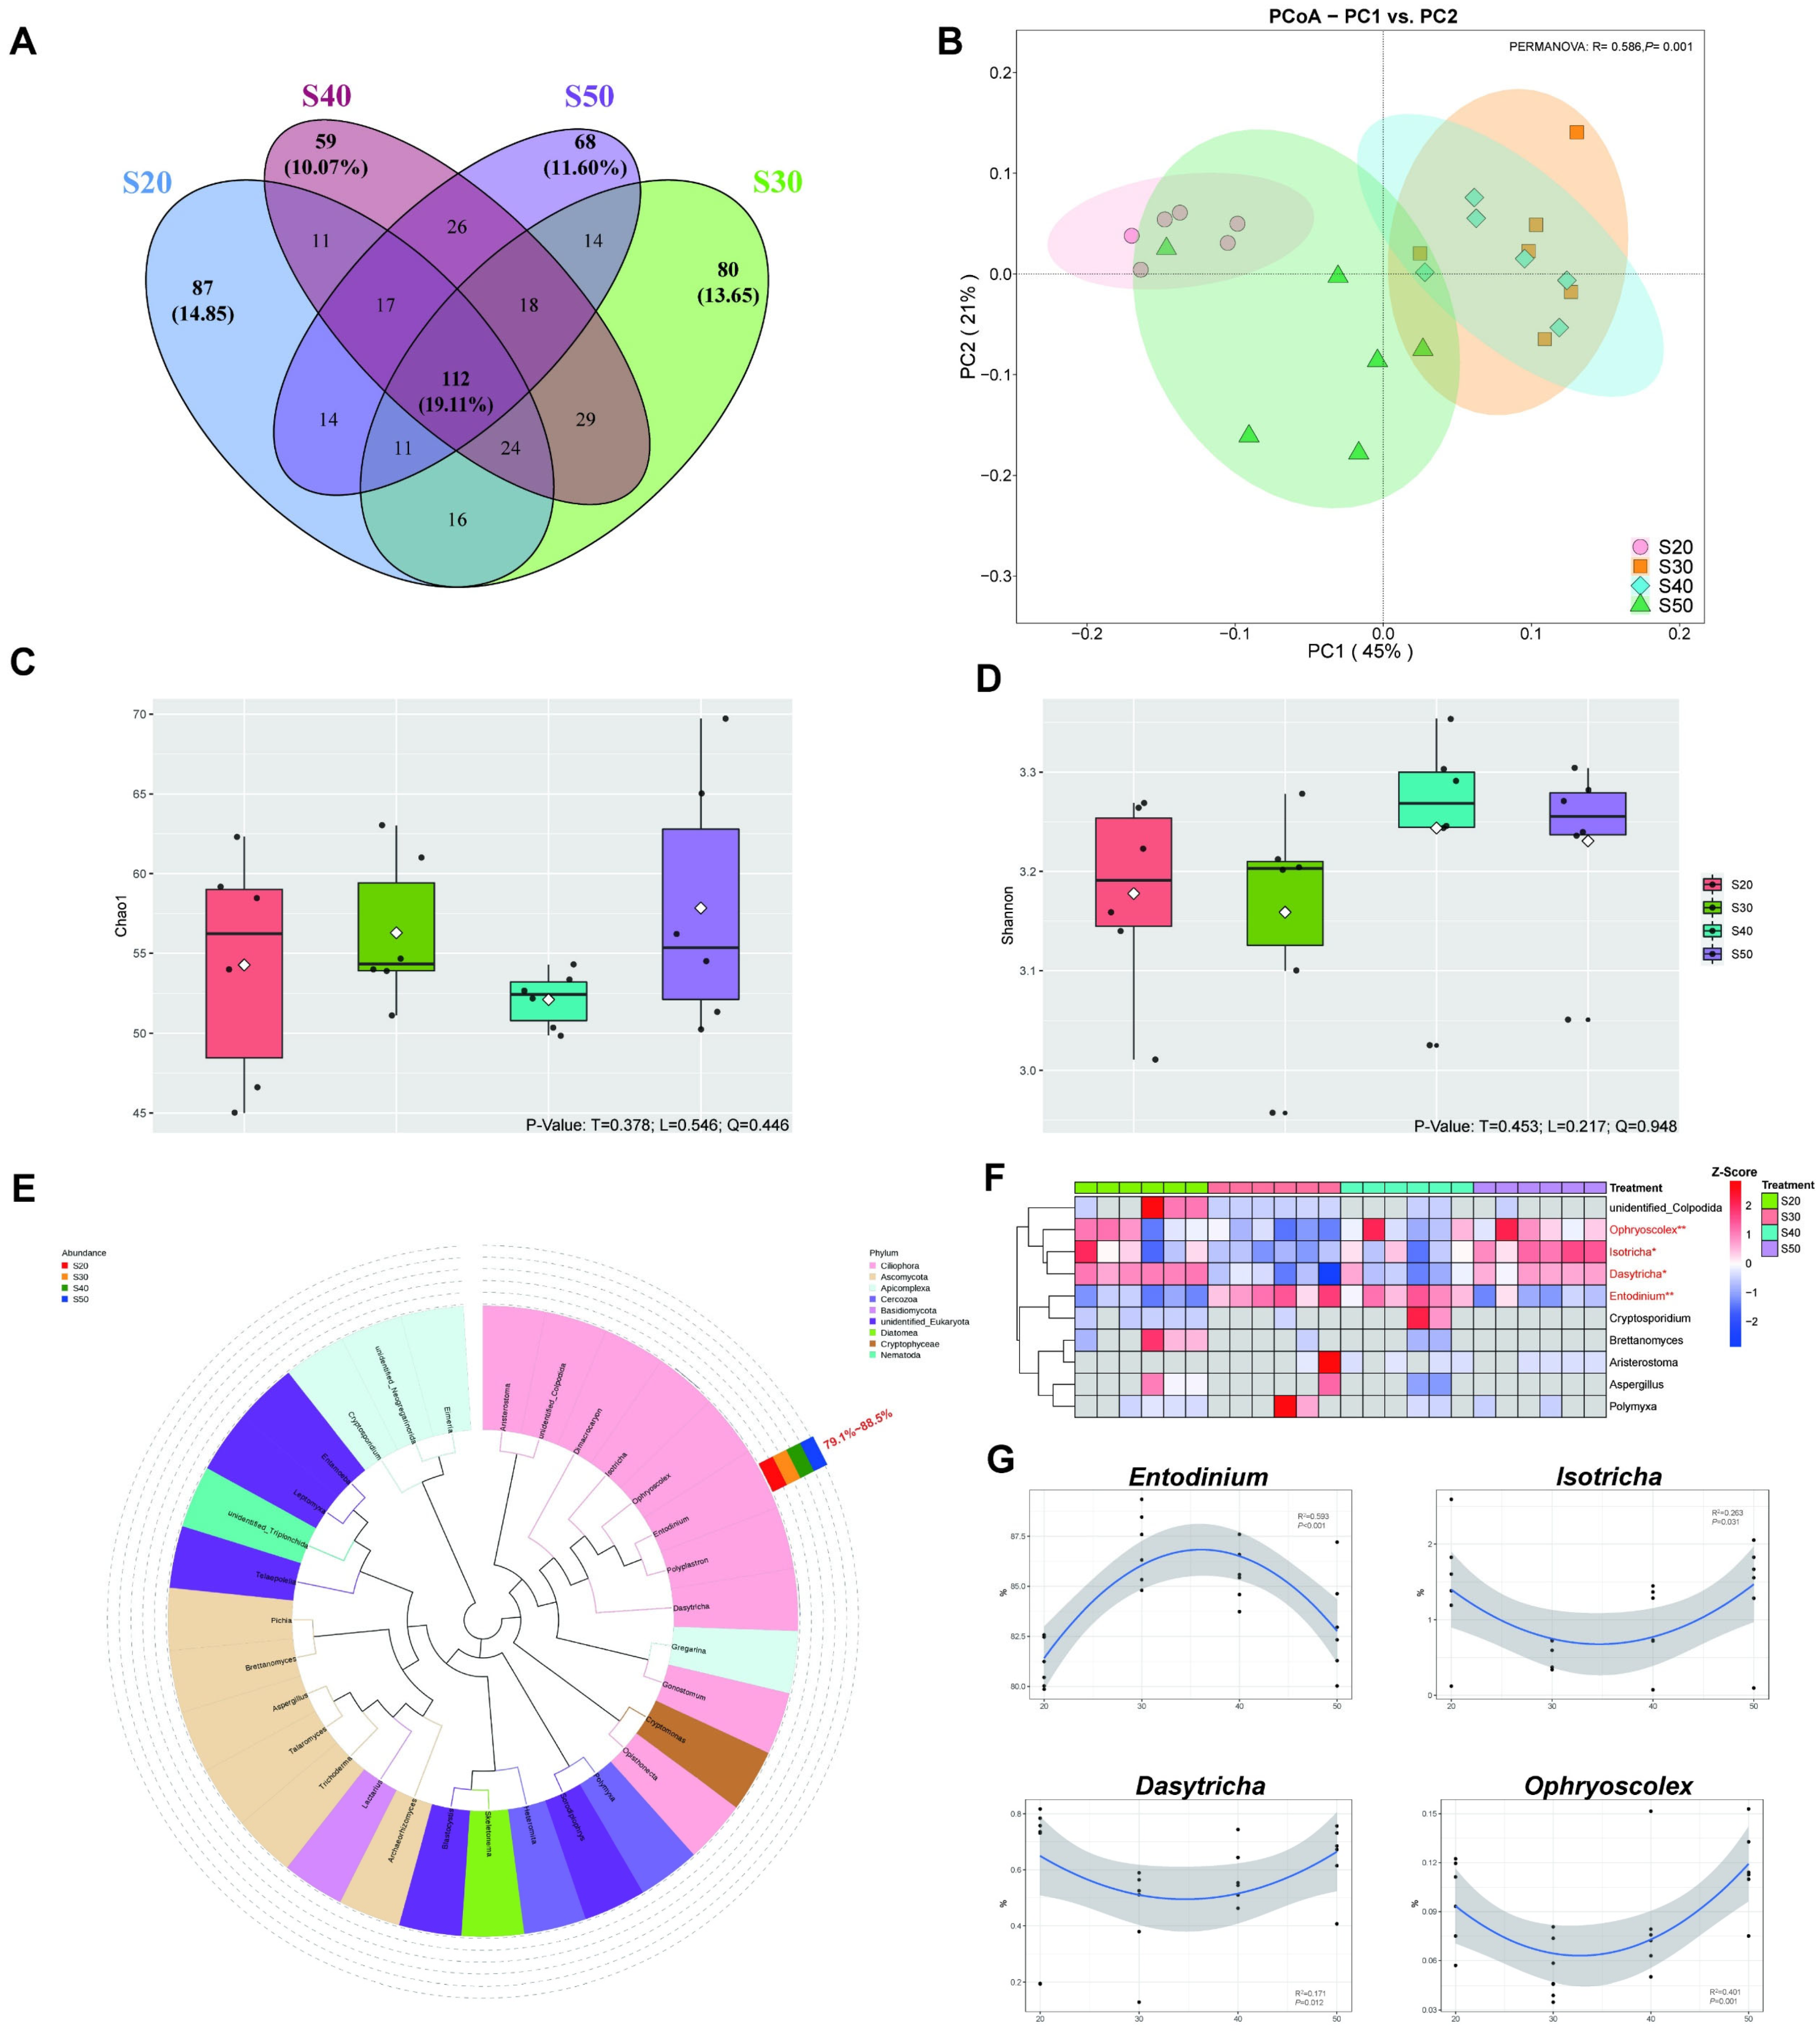
Similar to most studies on rumen protozoa [47,48], Entodinium was the most abundant genus of ciliate protozoa, occupying an average of 83.8% in this study. Polyorach et al. [49] and Chanjula et al. [50] found that different dietary N sources had no effect on the number of ruminal protozoa, which may lead to different protozoa species composition. In our study, SP levels were modified by the addition of different proportions of N, while Entodinium was up-regulated when SP (% of CP) was 30 and 40. Entodinium could rapidly hydrolyze true protein (e.g., casein) and has high dipeptidase activity, with peptides and amino acids as main products [51,52]. However, it has been proposed that urea plays a minor role in the N metabolism of Entodinium when used as a substrate [53], which indicates that the change in the addition of urea as a substrate in our study might not be the reason for affecting the abundance of Entodinium. On the other hand, the abundance of Isotricha and Ophryoscolex was reduced with S30 and S40, and the species members in this group of microbes exhibit lower proteolytic activity [54]. Although the abundance of these protozoa genera was relatively lower, more experiments are required to reveal the association with SP levels in the future.
The interaction of bacteria and protozoa plays an important role in the degradation of substrates in this experiment, with Prevotella and Entodinium being strongly and positively correlated (Figure 5A). Similarly, Elsayed Mickdam et al. [55] reported that the relative abundance of Prevotella and Entodinium was elevated in the presence of feed-induced subacute ruminal acidosis in vitro, which might be related to lower ruminal pH, while Prevotella could be used as a probiotic to prevent acidosis [56]. Importantly, the synergistic effect of the two genera resulted in higher N efficiency of substrates, while Prevotella was negatively correlated with Isotricha and Ophryoscolex, which may be a result of phagocytosis of protozoa and bacteria or the autolysis of protozoa [57].
Last but not least, a limitation of this study is that the diets were not configured with constant soluble carbohydrates content, which could potentially affect the N retention of the ruminal SP. Different soluble carbohydrate levels may exacerbate differences between treatments, such as NH3-N production and MCP synthesis. Therefore, the consistency of soluble carbohydrates needs to be refined in subsequent experiments by configuring the SP gradient.

5. Conclusions

Regulating substrate SP levels could modify bacterial and protozoal communities in vitro, especially the abundance of Prevotella and Entodinium, which were up-regulated as SP (% of CP) was 30 or 40 and ultimately led to higher nutrient utilization efficiency (e.g., N efficiency). Similar to our previous in vivo study, NH3-N concentration was increased with increasing SP levels. Furthermore, TVFA, acetate, propionate and valerate all increased with S30 and S40, and bacterial pathways were also enriched in related amino acid and fatty acid metabolism (Figure 5C). Overall, these results enhance our knowledge of the role of dietary SP level on the regulation of rumen microbiome and N efficiency. Although higher SP levels (~50% of CP) increased microbial diversity, they were detrimental to rumen N metabolism, underscoring the importance of the balance of carbon and N degradation in the rumen.

Supplementary Materials

The following supporting information can be downloaded at: https://www.mdpi.com/article/10.3390/nu14142972/s1, Table S1: Protein fractions of the feed samples; Table S2: Trend analysis of each treatment’s NH3-N content at different time points in vitro.

Author Contributions

Conceptualization, M.W. and Z.Z.; data curation, Z.Z., W.W., S.Y. and Z.H.; investigation, Z.Z., W.W., S.Y., Z.H., C.L. X.Y. and R.Q.; methodology, Z.Z., W.W. and S.Y.; funding acquisition, M.W.; project administration, M.W. and X.Z.; supervision, M.W. and J.J.L.; writing—original draft, Z.Z; writing—review and editing, M.W., X.Z., W.L. and J.J.L. All authors have read and agreed to the published version of the manuscript.

Funding

This study was supported by the National 14th and 13th Five-Year Plan Key Research and Development Program (2021YFD1600702, 2018YFD0502100), the key program of the State Key Laboratory of Sheep Genetic Improvement and Healthy Production (2021ZD07, NCG202232), Jiangsu Province Graduate Research and Innovation Project (KYCX22_3532), and the Priority Academic Program Development of Jiangsu Higher Education Institutions (PAPD), China.

Institutional Review Board Statement

This study was conducted followed the Guidelines of the Animal Welfare Committee of Yangzhou Veterinarians of the Agriculture Ministry of China under approved permit number SYXK (Su) 2021-0026.

Informed Consent Statement

Not applicable.

Data Availability Statement

The sequencing data were deposited in the National Center for Biotechnology Information (NCBI) under BioProject accession number: PRJNA780247 (BioSample ID SAMN28162086).

Conflicts of Interest

The authors declare that the research was conducted in the absence of any commercial or financial relationships that could be construed as a potential conflict of interest.

References

  1. Godfray, H.C.J.; Aveyard, P.; Garnett, T.; Hall, J.W.; Key, T.J.; Lorimer, J.; Pierrehumbert, R.T.; Scarborough, P.; Springmann, M.; Jebb, S.A. Meat consumption, health, and the environment. Science 2018, 361, eaam5324. [Google Scholar] [CrossRef] [PubMed] [Green Version]
  2. Tilman, D.; Clark, M. Global diets link environmental sustainability and human health. Nature 2014, 515, 518–522. [Google Scholar] [CrossRef] [PubMed]
  3. Du, Y.; Ge, Y.; Chang, J. Global Strategies to Minimize Environmental Impacts of Ruminant Production. Annu. Rev. Anim. Biosci. 2022, 10, 227–240. [Google Scholar] [CrossRef] [PubMed]
  4. Ripple, W.; Smith, P.; Haberl, H.; Montzka, S.; McAlpine, C.; Boucher, D. COMMENTARY: Ruminants, climate change and climate policy. Nat. Clim. Change 2013, 4, 2–5. [Google Scholar] [CrossRef]
  5. Tan, P.; Liu, H.; Zhao, J.; Gu, X.; Wei, X.; Zhang, X.; Ma, N.; Johnston, L.J.; Bai, Y.; Zhang, W.; et al. Amino acids metabolism by rumen microorganisms: Nutrition and ecology strategies to reduce nitrogen emissions from the inside to the outside. Sci. Total Environ. 2021, 800, 149596. [Google Scholar] [CrossRef] [PubMed]
  6. Du, Y.; Ge, Y.; Ren, Y.; Fan, X.; Pan, K.; Lin, L.; Wu, X.; Min, Y.; Meyerson, L.A.; Heino, M.; et al. A global strategy to mitigate the environmental impact of China’s ruminant consumption boom. Nat. Commun. 2018, 9, 4133. [Google Scholar] [CrossRef] [Green Version]
  7. Xian, C.; Zhang, X.; Zhang, J.; Fan, Y.; Zheng, H.; Salzman, J.; Ouyang, Z. Recent patterns of anthropogenic reactive nitrogen emissions with urbanization in China: Dynamics, major problems, and potential solutions. Sci. Total Environ. 2019, 656, 1071–1081. [Google Scholar] [CrossRef]
  8. Zhu, W.; Xu, W.; Wei, C.; Zhang, Z.; Jiang, C.; Chen, X. Effects of Decreasing Dietary Crude Protein Level on Growth Performance, Nutrient Digestion, Serum Metabolites, and Nitrogen Utilization in Growing Goat Kids (Capra hircus). Animals 2020, 10, 151. [Google Scholar] [CrossRef] [Green Version]
  9. López-Soto, M.A.; Rivera-Méndez, C.R.; Aguilar-Hernández, J.A.; Barreras, A.; Calderón-Cortés, J.F.; Plascencia, A.; Dávila-Ramos, H.; Estrada-Angulo, A.; Valdes-García, Y.S. Effects of Combining Feed Grade Urea and a Slow-release Urea Product on Characteristics of Digestion, Microbial Protein Synthesis and Digestible Energy in Steers Fed Diets with Different Starch:ADF Ratios. Asian-Australas. J. Anim. Sci. 2014, 27, 187–193. [Google Scholar] [CrossRef] [Green Version]
  10. Zhang, Z.; Shahzad, K.; Shen, S.; Dai, R.; Lu, Y.; Lu, Z.; Li, C.; Chen, Y.; Qi, R.; Gao, P.; et al. Altering Dietary Soluble Protein Levels with Decreasing Crude Protein May Be a Potential Strategy to Improve Nitrogen Efficiency in Hu Sheep Based on Rumen Microbiome and Metabolomics. Front. Nutr. 2021, 8, 815358. [Google Scholar] [CrossRef]
  11. Stefanski, T.; Ahvenjarvi, S.; Vanhatalo, A.; Huhtanen, P. Ruminal metabolism of ammonia N and rapeseed meal soluble N fraction. J. Dairy Sci. 2020, 103, 7081–7093. [Google Scholar] [CrossRef] [PubMed]
  12. Van Amburgh, M.E.; Collao-Saenz, E.A.; Higgs, R.J.; Ross, D.A.; Recktenwald, E.B.; Raffrenato, E.; Chase, L.E.; Overton, T.R.; Mills, J.K.; Foskolos, A. The Cornell Net Carbohydrate and Protein System: Updates to the model and evaluation of version 6.5. J. Dairy Sci. 2015, 98, 6361–6380. [Google Scholar] [CrossRef] [PubMed]
  13. Hartinger, T.; Gresner, N.; Südekum, K.-H. Does intra-ruminal nitrogen recycling waste valuable resources? A review of major players and their manipulation. J. Anim. Sci. Biotechnol. 2018, 9, 33. [Google Scholar] [CrossRef] [PubMed] [Green Version]
  14. D’Souza, G.; Shitut, S.; Preussger, D.; Yousif, G.; Waschina, S.; Kost, C. Ecology and evolution of metabolic cross-feeding interactions in bacteria. Nat. Prod. Rep. 2018, 35, 455–488. [Google Scholar] [CrossRef] [Green Version]
  15. Gast, R.; Sanders, R.; Caron, D. Ecological strategies of protists and their symbiotic relationships with prokaryotic microbes. Trends Microbiol. 2009, 17, 563–569. [Google Scholar] [CrossRef]
  16. Ushida, K.; Jouany, J.P. Effect of protozoa on rumen protein degradation in sheep. Reprod. Nutr. Dev. 1985, 25, 1075–1081. [Google Scholar] [CrossRef]
  17. Solomon, R.; Wein, T.; Levy, B.; Eshed, S.; Dror, R.; Reiss, V.; Zehavi, T.; Furman, O.; Mizrahi, I.; Jami, E. Protozoa populations are ecosystem engineers that shape prokaryotic community structure and function of the rumen microbial ecosystem. ISME J. 2022, 16, 1187–1197. [Google Scholar] [CrossRef]
  18. Licitra, G.; Hernandez, T.M.; Van Soest, P.J. Standardization of procedures for nitrogen fractionation of ruminant feeds. Anim. Feed Sci. Technol. 1996, 57, 347–358. [Google Scholar] [CrossRef]
  19. Zhang, Z.; Wang, S.; Wang, M.; Shahzad, K.; Zhang, X.; Qi, R.; Shi, L. Effects of Urtica cannabina to Leymus chinensis Ratios on Ruminal Microorganisms and Fiber Degradation In Vitro. Animals 2020, 10, 335. [Google Scholar] [CrossRef] [Green Version]
  20. Menke, K.H.; Steingass, H. Estimation of the energetic feed value obtained by chemical analysis and in vitro gas production using rumen fluid. Anim. Res. Develop. 1988, 28, 7–55. [Google Scholar]
  21. Broderick, G.A.; Kang, J.H. Automated simultaneous determination of ammonia and total amino acids in ruminal fluid and in vitro media. J. Dairy Sci. 1980, 63, 64–75. [Google Scholar] [CrossRef]
  22. Firkins, J. Maximizing Microbial Protein Synthesis in the Rumen. J. Nutr. 1996, 126, 1347S–1354S. [Google Scholar] [CrossRef]
  23. Erwin, E.; Marco, G.; Emery, E. Volatile Fatty Acid Analyses of Blood and Rumen Fluid by Gas Chromatography. J. Dairy Sci. 1961, 44, 1768–1771. [Google Scholar] [CrossRef]
  24. Wallace, R.J.; Sasson, G.; Garnsworthy, P.C.; Tapio, I.; Gregson, E.; Bani, P.; Huhtanen, P.; Bayat, A.R.; Strozzi, F.; Biscarini, F.; et al. A heritable subset of the core rumen microbiome dictates dairy cow productivity and emissions. Sci. Adv. 2019, 5, eaav8391. [Google Scholar] [CrossRef] [Green Version]
  25. Magoc, T.; Salzberg, S.L. FLASH: Fast length adjustment of short reads to improve genome assemblies. Bioinformatics 2011, 27, 2957–2963. [Google Scholar] [CrossRef] [PubMed]
  26. Chen, S.; Zhou, Y.; Chen, Y.; Gu, J. Fastp: An ultra-fast all-in-one FASTQ preprocessor. Bioinformatics 2018, 34, i884–i890. [Google Scholar] [CrossRef] [PubMed]
  27. Haas, B.J.; Gevers, D.; Earl, A.M.; Feldgarden, M.; Ward, D.V.; Giannoukos, G.; Ciulla, D.; Tabbaa, D.; Highlander, S.K.; Sodergren, E.; et al. Chimeric 16S rRNA sequence formation and detection in Sanger and 454-pyrosequenced PCR amplicons. Genome Res. 2011, 21, 494–504. [Google Scholar] [CrossRef] [Green Version]
  28. Caporaso, J.; Lauber, C.; Walters, W.; Berg-Lyons, D.; Huntley, J.; Fierer, N.; Owens, S.; Betley, J.; Fraser, L.; Bauer, M.; et al. Ultra-high-throughput microbial community analysis on the Illumina HiSeq and MiSeq platformsOpen. ISME J. 2012, 6, 1621–1624. [Google Scholar] [CrossRef] [Green Version]
  29. Douglas, G.M.; Maffei, V.J.; Zaneveld, J.R.; Yurgel, S.N.; Brown, J.R.; Taylor, C.M.; Huttenhower, C.; Langille, M.G.I. PICRUSt2 for prediction of metagenome functions. Nat. Biotechnol. 2020, 38, 685–688. [Google Scholar] [CrossRef]
  30. Ma, Y.; Wang, C.; Elmhadi, M.; Zhang, H.; Liu, F.; Gao, X.; Wang, H. Dietary supplementation of thiamine enhances colonic integrity and modulates mucosal inflammation injury in goats challenged by lipopolysaccharide and low pH. Br. J. Nutr. 2022, 1–11. [Google Scholar] [CrossRef]
  31. Tian, H.; Fotidis, I.A.; Kissas, K.; Angelidaki, I. Effect of different ammonia sources on aceticlastic and hydrogenotrophic methanogens. Bioresour. Technol. 2018, 250, 390–397. [Google Scholar] [CrossRef] [Green Version]
  32. Erdman, R.A.; Proctor, G.H.; Vandersall, J.H. Effect of rumen ammonia concentration on in situ rate and extent of digestion of feedstuffs. J. Dairy Sci. 1986, 69, 2312–2320. [Google Scholar] [CrossRef]
  33. Lobley, G.; Bremner, D.; Holtrop, G. Effects of diet quality on urea fates in sheep as assessed by refined, non-invasive [15N15N]urea kinetics. Br. J. Nutr. 2000, 84, 459–468. [Google Scholar] [CrossRef] [PubMed] [Green Version]
  34. Wilson, R.C.; Overton, T.R.; Clark, J.H. Effects of Yucca shidigera extract and soluble protein on performance of cows and concentrations of urea nitrogen in plasma and milk. J. Dairy Sci. 1998, 81, 1022–1027. [Google Scholar] [CrossRef]
  35. Stern, M.D.; Hoover, W.H.; Sniffen, C.J.; Crooker, B.A.; Knowlton, P.H. Effects of Nonstructural Carbohydrate, Urea and Soluble Protein Levels on Microbial Protein Synthesis in Continuous Culture of Rumen Contents. J. Anim. Sci. 1978, 47, 944–956. [Google Scholar] [CrossRef]
  36. Sinclair, L.A.; Garnsworthy, P.C.; Newbold, J.R.; Buttery, P.J. Effects of synchronizing the rate of dietary energy and nitrogen release in diets with a similar carbohydrate composition on rumen fermentation and microbial protein synthesis in sheep. J. Agric. Sci. 1995, 124, 463–472. [Google Scholar] [CrossRef]
  37. Hume, I.D.; Moir, R.J.; Somers, M. Synthesis of microbial protein in the rumen. I. Influence of the level of nitrogen intake. Aust. J. Agric. Res. 1970, 21, 283–296. [Google Scholar] [CrossRef]
  38. Stewart, R.D.; Auffret, M.D.; Warr, A.; Wiser, A.H.; Press, M.O.; Langford, K.W.; Liachko, I.; Snelling, T.J.; Dewhurst, R.J.; Walker, A.W.; et al. Assembly of 913 microbial genomes from metagenomic sequencing of the cow rumen. Nat. Commun. 2018, 9, 870. [Google Scholar] [CrossRef] [Green Version]
  39. Xue, M.-Y.; Wu, J.-J.; Xie, Y.-Y.; Zhu, S.-L.; Zhong, Y.-F.; Liu, J.-X.; Sun, H.-Z. Investigation of fiber utilization in the rumen of dairy cows based on metagenome-assembled genomes and single-cell RNA sequencing. Microbiome 2022, 10, 11. [Google Scholar] [CrossRef]
  40. Xue, M.-Y.; Sun, H.-Z.; Wu, X.-H.; Liu, J.-X.; Guan, L.L. Multi-omics reveals that the rumen microbiome and its metabolome together with the host metabolome contribute to individualized dairy cow performance. Microbiome 2020, 8, 64. [Google Scholar] [CrossRef]
  41. Li, M.; Zhong, H.; Li, M.; Zheng, N.; Wang, J. Contribution of Ruminal Bacteriome to the Individual Variation of Nitrogen Utilization Efficiency of Dairy Cows. Front. Microbiol. 2022, 13, 815225. [Google Scholar] [CrossRef] [PubMed]
  42. Wallace, R.J.; McKain, N.; Broderick, G.A.; Rode, L.M.; Walker, N.D.; Newbold, C.J.; Kopecny, J. Peptidases of the rumen bacterium, Prevotella ruminicola. Anaerobe 1997, 3, 35–42. [Google Scholar] [CrossRef] [PubMed]
  43. Patra, A.; Yu, Z. Genomic Insights into the Distribution of Peptidases and Proteolytic Capacity among Prevotella and Paraprevotella Species. Microbiol. Spectr. 2022, 10, e02185-21. [Google Scholar] [CrossRef] [PubMed]
  44. Aguilar, S.; Betancur, C.; Mesa, H.; Isaza, G.; Jovel, J. Lower methane emissions were associated with higher abundance of ruminal Prevotella in a cohort of Colombian buffalos. BMC Microbiol. 2020, 20, 16. [Google Scholar] [CrossRef] [PubMed]
  45. Arntzen, M.O.; Varnai, A.; Mackie, R.I.; Eijsink, V.G.H.; Pope, P.B. Outer membrane vesicles from Fibrobacter succinogenes S85 contain an array of carbohydrate-active enzymes with versatile polysaccharide-degrading capacity. Environ. Microbiol. 2017, 19, 2701–2714. [Google Scholar] [CrossRef] [Green Version]
  46. Fondevila, M.; Dehority, B. Interactions between Fibrobacter succinogenes, Prevotella ruminicola, and Ruminococcus flavefaciens in the Digestion of Cellulose from Forages. J. Anim. Sci. 1996, 74, 678–684. [Google Scholar] [CrossRef] [Green Version]
  47. Zhang, J.; Shi, H.; Wang, Y.; Li, S.; Cao, Z.; Ji, S.; He, Y.; Zhang, H. Effect of Dietary Forage to Concentrate Ratios on Dynamic Profile Changes and Interactions of Ruminal Microbiota and Metabolites in Holstein Heifers. Front. Microbiol. 2017, 8, 2206. [Google Scholar] [CrossRef] [Green Version]
  48. Mao, S.Y.; Huo, W.J.; Zhu, W.Y. Microbiome-metabolome analysis reveals unhealthy alterations in the composition and metabolism of ruminal microbiota with increasing dietary grain in a goat model. Environ. Microbiol. 2016, 18, 525–541. [Google Scholar] [CrossRef]
  49. Polyorach, S.; Wanapat, M.; Cherdthong, A. Influence of Yeast Fermented Cassava Chip Protein (YEFECAP) and Roughage to Concentrate Ratio on Ruminal Fermentation and Microorganisms Using In vitro Gas Production Technique. Asian-Australas. J. Anim. Sci. 2014, 27, 36–45. [Google Scholar] [CrossRef] [Green Version]
  50. Pin, C.; Wanapat, M.; Wachirapakorn, C.; Rowlinson, P. Effect of Synchronizing Starch Sources and Protein (NPN) in the Rumen on Feed Intake, Rumen Microbial Fermentation, Nutrient Utilization and Performance of Lactating Dairy Cows. Asian-Australas. J. Anim. Sci. 2004, 17, 1400–1410. [Google Scholar] [CrossRef]
  51. Newbold, C.; McKain, N.; Wallace, J. The role of protozoa in ruminal peptide metabolism. In Biochemistry and Molecular Biology of “Anaerobic” Protozoa; Lloyd, D., Coombs, G., Paget, T.A., Eds.; Harwood Academic Press: London, UK, 1989; pp. 42–55. [Google Scholar]
  52. Akkada, A.; Howard, B. The biochemistry of rumen protozoa. 5. The nitrogen metabolism of Entodinium. Biochem. J. 1962, 82, 313–320. [Google Scholar] [CrossRef] [Green Version]
  53. Cook, A.R. Urease activity in the rumen of sheep and the isolation of ureolytic bacteria. J. Gen. Microbiol. 1976, 92, 32–48. [Google Scholar] [CrossRef] [PubMed] [Green Version]
  54. Lockwood, B.C.; Coombs, G.H.; Williams, A.G. Proteinase activity in rumen ciliate protozoa. J. Gen. Microbiol. 1988, 134, 2605–2614. [Google Scholar] [CrossRef] [PubMed] [Green Version]
  55. Mickdam, E.; Khiaosa-Ard, R.; Metzler-Zebeli, B.U.; Klevenhusen, F.; Chizzola, R.; Zebeli, Q. Rumen microbial abundance and fermentation profile during severe subacute ruminal acidosis and its modulation by plant derived alkaloids in vitro. Anaerobe 2016, 39, 4–13. [Google Scholar] [CrossRef] [PubMed]
  56. Khafipour, E.; Krause, D.; Plaizier, J. Alfalfa pellet-induced subacute ruminal acidosis in dairy cows increases bacterial endotoxin in the rumen without causing inflammation. J. Dairy Sci. 2009, 92, 1712–1724. [Google Scholar] [CrossRef] [Green Version]
  57. Wang, M.Z.; Wang, H.R.; Yu, L.H. Effects of NDF Content on Protozoal Community and Grazing Rate in Rumen. J. Anim. Vet. Adv. 2009, 8, 1746–1752. [Google Scholar]
Figure 1. Substrate digestibility under different SP treatments (n = 6). (A) Substrate dry matter digestibility (DMD) changes at different sampling times, different letters indicate significant differences among SP treatments at p < 0.05. T: treatment; S: sampling time; T × S: interaction between T and S. (B) Substrate nitrogen digestibility (ND) at 24 h of culture. Bar charts with different letters indicate a significant difference at p < 0.05. Treatments: S20, S30, S40 and S50 are ~14% CP, SP proportion (% of CP) 20, 30, 40 and 50, respectively. T: treatment; L: linear; Q: quadratic.
Nutrients 14 02972 g001
Figure 2. Bacterial diversity, taxonomic differences and changing tendency (n = 6). (A) Venn diagram showing shared and unique bacterial OTU numbers of four SP treatments. (B) Principal coordinate analysis (PCoA) of bacteria based on Bray–Curtis dissimilarity matrix of four SP treatments. (C,D) Alpha diversity of bacteria in four SP treatments, * represents p < 0.05 and ** represents p < 0.01. Bacterial compositions of four SP treatments at the phylum (E) and genus (F) levels. (G) Pie chart of differential microbes in four SP treatments, different letters indicate significant difference of SP treatments at p < differential microbes in four SP treatments, different letters indicate significant difference of SP treatments at p < 0.05. (H) The trend of differential microbes changing with SP. Treatments: S20, S30, S40 and S50 are ~14% CP, SP proportion (% of CP) 20, 30, 40 and 50, respectively.
Nutrients 14 02972 g002
Figure 3. Bacterial function prediction based on the KEGG database via PICRUSt2. (A) Statistical histogram of KEGG pathway prediction results based on the 16S gene copy number. (B) Principal Component Analysis (PCA) of absolute abundance of functional annotations based on the KEGG database. (C) Linear discriminant analysis (LDA) plus effect size of function prediction, LDA score ≥ 2.5 with p < 0.05 was marked. Treatments: S20, S30, S40 and S50 are ~14% CP, SP proportion (% of CP) 20, 30, 40 and 50, respectively.
Nutrients 14 02972 g003
Figure 4. Protozoa composition diversity, taxonomic differences and changing tendency (n = 6). (A) Venn diagram showing shared and unique protozoal OTU numbers of four SP treatments. (B) Principal coordinate analysis (PCoA) of protozoa based on Bray–Curtis dissimilarity matrix of four SP treatments. (C,D) Alpha diversity of protozoa in four SP treatments. (E) Protozoa genus evolutionary tree, different colors represent the classification phylum level. (F) Heatmap of the top-10 protozoa genera in relative abundance, * represents p < 0.05 and ** represents p < 0.01. (G) The trend of differential protozoa changing with SP. Treatments: S20, S30, S40 and S50 are ~14% CP, SP proportion (% of CP) 20, 30, 40 and 50, respectively.
Nutrients 14 02972 g004
Figure 5. The interaction of rumen bacteria, protozoa and fermentation. (A) Spearman’s rank correlations between rumen bacteria and protozoa at the genus level. (B) Spearman’s correlations between rumen microbiota and fermentation. Based on the color key on the right, the degree of each correlation is displayed in the shade of the color; the blue circle represents negative correlations, and the red circle represents positive correlations. The red fonts represent the protozoa genus. (C) Integrative diagram showing the regulatory role of bacteria–protozoa interactions in rumen nitrogen metabolism as SP (% of CP) set as 30 or 40 in vitro.
Nutrients 14 02972 g005
Table 1. Substrate composition and nutrient levels.
ItemTreatments
S20S30S40S50
Ingredient, %
Rice straw50505050
Corn35343333.4
Soybean meal56.56.91
Wheat bran46.459.2514
Corn protein meal62.65--
Urea-0.40.851.6
Total100100100100
Nutritive level, g/kg
DM888.75887.53886.63886.86
CP137.91137.22137.89138.93
SP (% of CP)20.4330.1239.9549.50
EE43.0043.1043.2642.08
Ash65.7566.2766.8565.86
NDF350.23358.3366.62380.67
ADF199.88198.86199.06205.46
Ca1.021.021.030.98
P2.442.472.532.58
DM, dry matter; CP, crude protein; SP, soluble protein; EE, ether extract; NDF, neutral detergent fiber; ADF, acid detergent fiber; Ca, calcium; P, phosphorus. Treatments: S20, S30, S40 and S50 are ~14% CP, SP proportions (% of CP) 20, 30, 40 and 50, respectively.
Table 2. The effect of substrate SP (% of CP) levels on pH value at different sampling times in vitro.
Sampling Time/hTreatmentSEMp-Value
S20S30S40S50STS × T
26.77 6.78 6.74 6.76 0.004<0.0010.408<0.001
46.67 6.63 6.68 6.65
86.55 6.54 6.56 6.52
126.32 6.33 6.35 6.46
245.90 5.94 6.00 6.02
Treatments: S20, S30, S40 and S50 are ~14% CP, SP proportion (% of CP) 20, 30, 40 and 50, respectively; SEM: standard error of the mean; S: sampling time; T: treatment; S × T: interaction between S and T.
Table 3. The effect of substrate SP (% of CP) levels on NH3-N content at different sampling times in vitro (mg/100 mL).
Sampling Time/hTreatmentSEMp-Value
S20S30S40S50STS × T
218.6517.5217.2119.240.2570.0020.0020.037
411.79 b12.17 b12.66 b20.96 a
811.8210.9312.6513.78
1211.67 c12.26 c14.48 b19.16 a
2415.61 c15.85 c16.20 bc20.45 a
a–c values with different superscripts differ significantly at p ≤ 0.05 among SP treatments. Treatments: S20, S30, S40 and S50 are ~14% CP, SP proportion (% of CP) 20, 30, 40 and 50, respectively; SEM: standard error of the mean; S: sampling time; T: treatment; S × T: interaction between S and T.
Table 4. The effect of substrate SP (% of CP) levels on MCP content at different sampling times in vitro (mg/mL).
Sampling Time/hTreatmentSEMp-Value
S20S30S40S50STS × T
21.401.371.361.260.043 <0.0010.2580.884
41.391.231.461.75
81.671.741.671.72
121.761.581.791.65
242.151.761.842.21
Treatments: S20, S30, S40 and S50 are ~14% CP, SP proportion (% of CP) 20, 30, 40 and 50, respectively; SEM: standard error of the mean; S: sampling time; T: treatment; S × T: interaction between S and T.
Table 5. The effect of substrate SP (% of CP) levels on volatile fatty acid (VFA) concentration at 24 h in vitro.
ItemTreatmentSEMp-Value
S20S30S40S50TLQ
TVFA, mM78.67 b91.69 a89.30 a80.04 b2.0650.0310.0500.017
Acetate, mM46.50 b53.88 a52.66 a47.58 b1.2050.0220.0150.005
Propionate, mM20.76 b24.56 a23.46 a21.19 b0.5650.0300.1810.036
Butyrate, mM9.3610.5810.399.880.2590.2530.1490.067
Isovalerate, mM0.840.980.950.850.0230.7120.6500.369
Valerate, mM0.69 b0.81 a0.78 ab0.70 b0.0190.0330.2230.045
Isobutyrate, mM0.530.590.550.530.0110.4110.3330.182
A/P2.242.192.252.240.0090.1080.3730.187
A/P: Acetate: Propionate; a,b values with different superscripts differ significantly at p ≤ 0.05 among SP treatments. Treatments: S20, S30, S40 and S50 are ~14% CP, SP proportion (% of CP) 20, 30, 40 and 50, respectively; SEM: standard error of the mean; T: treatment; L: linear; Q: quadratic.
Table 6. The effect of substrate SP (% of CP) levels on the relative abundance of bacterial species at 24 h of culture in vitro (%).
PhylumGenusSpeciesTreatmentSEMp-Value
S20S30S40S50TLQ
FirmicutesCoprococcusRumen_bacterium4.232.996.882.990.8520.3590.9840.446
BacteroidotaRikenellaceae_RC9_gut_groupBacteroidales_bacterium3.813.705.323.110.3920.2360.8850.178
BacteroidotaPrevotellaPrevotella_ruminicola1.48 b1.83 a1.95 a1.50 b0.0790.0440.7560.008
BacteroidotaBacteroidales_RF16_groupRumen_bacterium1.551.621.691.550.0570.8250.9010.417
FirmicutesSelenomonasSelenomonas_ruminantium1.111.010.791.210.0780.2810.9190.110
ProteobacteriaRuminobacterRuminobacter_amylophilus0.450.380.390.800.1010.4450.2670.266
FibrobacterotaFibrobacterFibrobacter_succinogenes0.51 ab0.72 a0.52 ab0.31 b0.0540.0340.0380.031
FirmicutesSelenomonasRumen_bacterium0.550.430.390.500.0300.1850.4380.048
BacteroidotaRikenellaceae_RC9_gut_groupRumen_bacterium0.250.280.380.310.0210.1650.1350.237
FirmicutesChristensenellaceae_R-7_groupBacterium_AC20430.12 a0.07 ab0.03 b0.13 a0.0140.0060.9610.001
a,b values with different superscripts differ significantly at p ≤ 0.05 among SP treatments. Treatments: S20, S30, S40 and S50 are ~14% CP, SP proportion (% of CP) 20, 30, 40 and 50, respectively; SEM: standard error of the mean; T: treatment; L: linear; Q: quadratic.
Publisher’s Note: MDPI stays neutral with regard to jurisdictional claims in published maps and institutional affiliations.

