
Preoperative Phase Angle as a Risk Indicator in Cardiac Surgery—A Prospective Observational Study

 and
and 
Abstract
: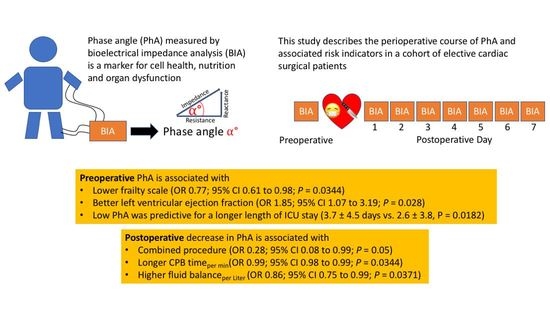
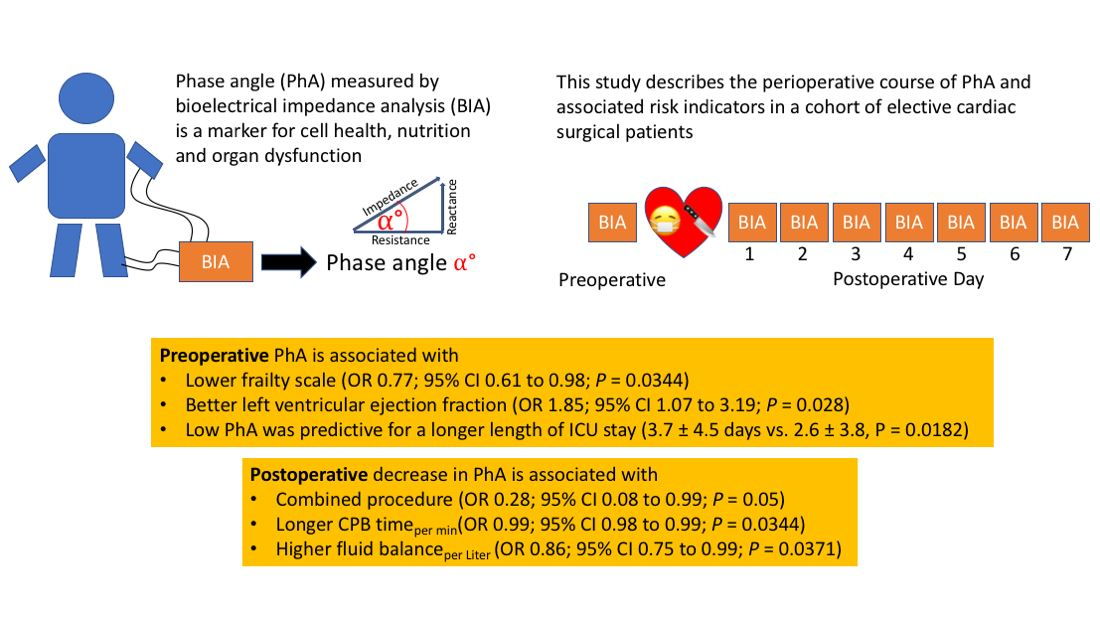
1. Introduction
2. Materials and Methods
2.1. Population Characteristics
2.2. Procedure, Data and Sample Collection
2.3. Bioelectrical Impedance Analysis
2.4. Statistical Analysis
3. Results
3.1. Patient Characteristics
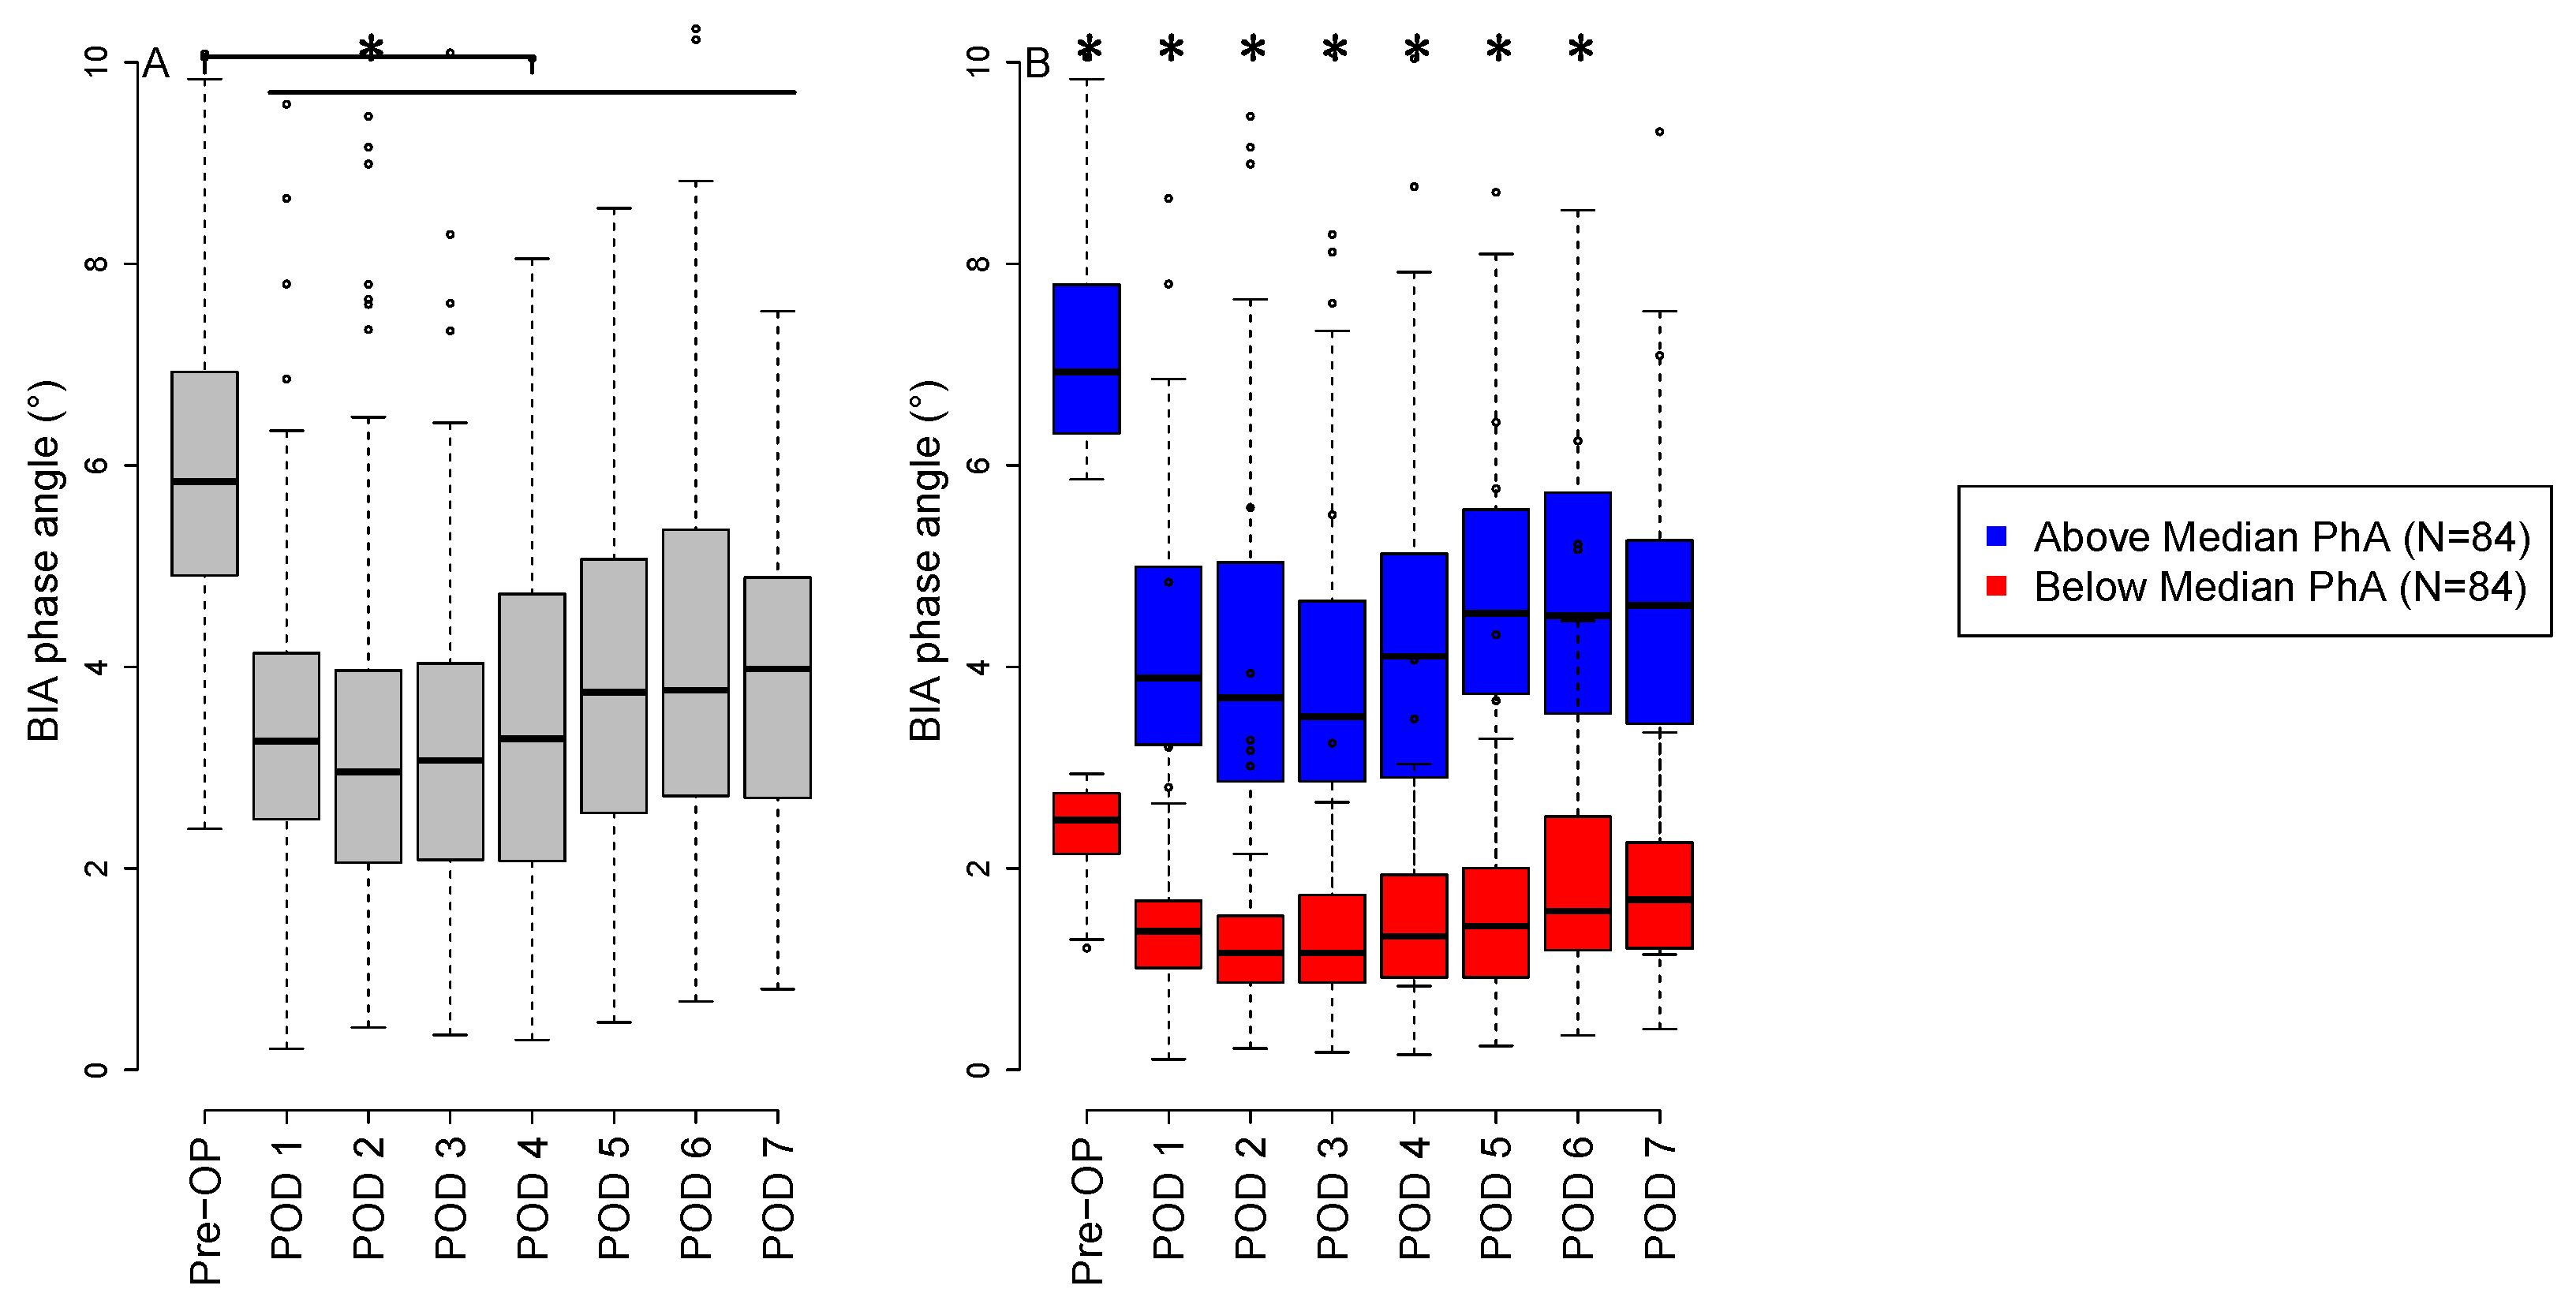
3.2. Phase Angle Measurements
3.3. Comparison of Low versus High Preoperative Phase Angle
3.4. Preoperative Risk Indicators on Preoperative Phase Angle
3.5. Intraoperative Risk Indicators on the Nadir Phase Angle
4. Discussion
Author Contributions
Funding
Institutional Review Board Statement
Informed Consent Statement
Data Availability Statement
Acknowledgments
Conflicts of Interest
References
- Mundi, M.S.; Patel, J.J.; Martindale, R. Body Composition Technology: Implications for the ICU. Nutr. Clin. Pract. 2019, 34, 48–58. [Google Scholar] [CrossRef] [PubMed] [Green Version]
- Marra, M.; Sammarco, R.; De Lorenzo, A.; Iellamo, F.; Siervo, M.; Pietrobelli, A.; Donini, L.M.; Santarpia, L.; Cataldi, M.; Pasanisi, F.; et al. Assessment of Body Composition in Health and Disease Using Bioelectrical Impedance Analysis (BIA) and Dual Energy X-Ray Absorptiometry (DXA): A Critical Overview. Contrast Media Mol. Imaging 2019, 2019, 1–9. [Google Scholar] [CrossRef] [PubMed]
- Ward, L.C. Bioelectrical Impedance Analysis for Body Composition Assessment: Reflections on Accuracy, Clinical Utility, and Standardisation. Eur. J. Clin. Nutr. 2019, 73, 194–199. [Google Scholar] [CrossRef] [PubMed]
- Wu, Z.-J.; Wang, Z.-Y.; Gao, H.-E.; Zhou, X.-F.; Li, F.-H. Impact of High-Intensity Interval Training on Cardiorespiratory Fitness, Body Composition, Physical Fitness, and Metabolic Parameters in Older Adults: A Meta-Analysis of Randomized Controlled Trials. Exp. Gerontol. 2021, 150, 111345. [Google Scholar] [CrossRef] [PubMed]
- Göz, M.; Sert, C.; Hazar, A.; Salih Aydın, M.; Kankılıç, N. Bioelectrical Impedance Analysis for Monitoring Fluid and Body Cell Mass Changes in Patients Undergoing Cardiopulmonary Bypass. Braz. J. Cardiovasc. Surg. 2020, 35, 16–21. [Google Scholar] [CrossRef]
- Kuriyan, R. Body Composition Techniques. Indian J. Med. Res. 2018, 148, 648. [Google Scholar] [CrossRef]
- Holmes, C.J.; Racette, S.B. The Utility of Body Composition Assessment in Nutrition and Clinical Practice: An Overview of Current Methodology. Nutrients 2021, 13, 2493. [Google Scholar] [CrossRef]
- Pandey, A.; Kitzman, D.; Reeves, G. Frailty Is Intertwined With Heart Failure. JACC Heart Fail. 2019, 7, 1001–1011. [Google Scholar] [CrossRef]
- Mullie, L.; Obrand, A.; Bendayan, M.; Trnkus, A.; Ouimet, M.; Moss, E.; Chen-Tournoux, A.; Rudski, L.G.; Afilalo, J. Phase Angle as a Biomarker for Frailty and Postoperative Mortality: The BICS Study. JAHA 2018, 7, e008721. [Google Scholar] [CrossRef]
- Lee, D.H.; Buth, K.J.; Martin, B.-J.; Yip, A.M.; Hirsch, G.M. Frail Patients Are at Increased Risk for Mortality and Prolonged Institutional Care After Cardiac Surgery. Circulation 2010, 121, 973–978. [Google Scholar] [CrossRef]
- Buja, A.; Claus, M.; Perin, L.; Rivera, M.; Corti, M.C.; Avossa, F.; Schievano, E.; Rigon, S.; Toffanin, R.; Baldo, V.; et al. Multimorbidity Patterns in High-Need, High-Cost Elderly Patients. PLoS ONE 2018, 13, e0208875. [Google Scholar] [CrossRef] [PubMed] [Green Version]
- Baldasseroni, S.; Pratesi, A.; Stefàno, P.; Del Pace, S.; Campagnolo, V.; Baroncini, A.C.; Lo Forte, A.; Marella, A.G.; Ungar, A.; Di Bari, M.; et al. Pre-Operative Physical Performance as a Predictor of in-Hospital Outcomes in Older Patients Undergoing Elective Cardiac Surgery. Eur. J. Intern. Med. 2021, 84, 80–87. [Google Scholar] [CrossRef] [PubMed]
- Janssen, D.P.B.; Noyez, L.; van Druten, J.A.M.; Skotnicki, S.H.; Lacquet, L.K. Predictors of Nephrological Morbidity after Coronary Artery Bypass Surgery. Cardiovasc. Surg. 2002, 10, 222–227. [Google Scholar] [CrossRef]
- Vujicic, B.; Dorcic, G.; Babic, V.; Rundic, A.; Devcic, B.; Simac, D.V.; Zaputovic, L.; Racki, S. Comparison of Clinical Assessment and Multifrequency Bioimpedance Analysis as Methods of Estimating Volume Status in Peritoneal Dialysis Patients—A Single-Center Experience. Clin. Nephrol. 2019, 91, 334–343. [Google Scholar] [CrossRef] [PubMed]
- Park, J.H.; Jo, Y.-I.; Lee, J.-H. Clinical Usefulness of Bioimpedance Analysis for Assessing Volume Status in Patients Receiving Maintenance Dialysis. Korean J. Intern. Med. 2018, 33, 660–669. [Google Scholar] [CrossRef]
- Tsaousi, G.; Panagidi, M.; Papakostas, P.; Grosomanidis, V.; Stavrou, G.; Kotzampassi, K. Phase Angle and Handgrip Strength as Complements to Body Composition Analysis for Refining Prognostic Accuracy in Cardiac Surgical Patients. J. Cardiothorac. Vasc. Anesth. 2021, 35, 2424–2431. [Google Scholar] [CrossRef]
- Alves, F.D.; Souza, G.C.; Clausell, N.; Biolo, A. Prognostic Role of Phase Angle in Hospitalized Patients with Acute Decompensated Heart Failure. Clin. Nutr. 2016, 35, 1530–1534. [Google Scholar] [CrossRef]
- Ringaitiene, D.; Puodziukaite, L.; Vicka, V.; Gineityte, D.; Serpytis, M.; Sipylaite, J. Bioelectrical Impedance Phase Angle—Predictor of Blood Transfusion in Cardiac Surgery. J. Cardiothorac. Vasc. Anesth. 2019, 33, 969–975. [Google Scholar] [CrossRef]
- Scicchitano, P.; Ciccone, M.M.; Iacoviello, M.; Guida, P.; De Palo, M.; Potenza, A.; Basile, M.; Sasanelli, P.; Trotta, F.; Sanasi, M.; et al. Respiratory Failure and Bioelectrical Phase Angle Are Independent Predictors for Long-Term Survival in Acute Heart Failure. Scand. Cardiovasc. J. 2022, 56, 28–34. [Google Scholar] [CrossRef]
- De Borba, E.L.; Ceolin, J.; Ziegelmann, P.K.; Bodanese, L.C.; Gonçalves, M.R.; Cañon-Montañez, W.; Mattiello, R. Phase Angle of Bioimpedance at 50 KHz Is Associated with Cardiovascular Diseases: Systematic Review and Meta-Analysis. Eur. J. Clin. Nutr. 2022. online ahead of print. [Google Scholar] [CrossRef]
- Rockwood, K.; Theou, O. Using the Clinical Frailty Scale in Allocating Scarce Health Care Resources. Can. Geriatr. J. 2020, 23, 254–259. [Google Scholar] [CrossRef] [PubMed]
- Lukaski, H.C.; Bolonchuk, W.W.; Hall, C.B.; Siders, W.A. Validation of Tetrapolar Bioelectrical Impedance Method to Assess Human Body Composition. J. Appl. Physiol. 1986, 60, 1327–1332. [Google Scholar] [CrossRef] [PubMed] [Green Version]
- da Silva, T.K.; Perry, I.D.S.; Brauner, J.S.; Wender, O.C.B.; Souza, G.C.; Vieira, S.R.R. Performance Evaluation of Phase Angle and Handgrip Strength in Patients Undergoing Cardiac Surgery: Prospective Cohort Study. Aust. Crit. Care 2018, 31, 284–290. [Google Scholar] [CrossRef] [PubMed]
- Bowdish, M.E.; D’Agostino, R.S.; Thourani, V.H.; Desai, N.; Shahian, D.M.; Fernandez, F.G.; Badhwar, V. The Society of Thoracic Surgeons Adult Cardiac Surgery Database: 2020 Update on Outcomes and Research. Ann. Thorac. Surg. 2020, 109, 1646–1655. [Google Scholar] [CrossRef]
- Chen, X.; Liao, H.; Gao, W.; Chen, Y.; Huang, J.; Wei, Y. Cardiopulmonary Bypass Duration and the Incidence of Pressure Injuries in Patients Undergoing Cardiovascular Surgery: A Retrospective Cohort Study. J. Wound Ostomy Cont. Nurs. 2020, 47, 343–348. [Google Scholar] [CrossRef]
- Zhang, K.; Pan, X.-D.; Dong, S.-B.; Zheng, J.; Xu, S.-D.; Liu, Y.-M.; Zhu, J.-M.; Sun, L.-Z. Cardiopulmonary Bypass Duration Is an Independent Predictor of Adverse Outcome in Surgical Repair for Acute Type A Aortic Dissection. J. Int. Med. Res. 2020, 48, 030006052096845. [Google Scholar] [CrossRef]
- Sun, L.Y.; Eddeen, A.B.; Mesana, T.G. Disability-Free Survival after Major Cardiac Surgery: A Population-Based Retrospective Cohort Study. cmajOPEN 2021, 9, E384–E393. [Google Scholar] [CrossRef]
- Denneman, N.; Hessels, L.; Broens, B.; Gjaltema, J.; Stapel, S.N.; Stohlmann, J.; Nijsten, M.W.; Oudemans-van Straaten, H.M. Fluid Balance and Phase Angle as Assessed by Bioelectrical Impedance Analysis in Critically Ill Patients: A Multicenter Prospective Cohort Study. Eur. J. Clin. Nutr. 2020, 74, 1410–1419. [Google Scholar] [CrossRef]
- Lopez, M.G.; Shotwell, M.S.; Morse, J.; Liang, Y.; Wanderer, J.P.; Absi, T.S.; Balsara, K.R.; Levack, M.M.; Shah, A.S.; Hernandez, A.; et al. Intraoperative Venous Congestion and Acute Kidney Injury in Cardiac Surgery: An Observational Cohort Study. Br. J. Anaesth. 2021, 126, 599–607. [Google Scholar] [CrossRef]
- Wang, Y.; Bellomo, R. Cardiac Surgery-Associated Acute Kidney Injury: Risk Factors, Pathophysiology and Treatment. Nat. Rev. Nephrol. 2017, 13, 697–711. [Google Scholar] [CrossRef]
- Borthwick, E.; Ferguson, A. Perioperative Acute Kidney Injury: Risk Factors, Recognition, Management, and Outcomes. BMJ 2010, 341, c3365. [Google Scholar] [CrossRef] [PubMed] [Green Version]
- Hirose, S.; Nakajima, T.; Nozawa, N.; Katayanagi, S.; Ishizaka, H.; Mizushima, Y.; Matsumoto, K.; Nishikawa, K.; Toyama, Y.; Takahashi, R.; et al. Phase Angle as an Indicator of Sarcopenia, Malnutrition, and Cachexia in Inpatients with Cardiovascular Diseases. JCM 2020, 9, 2554. [Google Scholar] [CrossRef] [PubMed]
- Lopez-Delgado, J.C.; Muñoz-del Rio, G.; Flordelís-Lasierra, J.L.; Putzu, A. Nutrition in Adult Cardiac Surgery: Preoperative Evaluation, Management in the Postoperative Period, and Clinical Implications for Outcomes. J. Cardiothorac. Vasc. Anesth. 2019, 33, 3143–3162. [Google Scholar] [CrossRef] [PubMed]
- Cederholm, T.; Bosaeus, I.; Barazzoni, R.; Bauer, J.; Van Gossum, A.; Klek, S.; Muscaritoli, M.; Nyulasi, I.; Ockenga, J.; Schneider, S.M.; et al. Diagnostic Criteria for Malnutrition—An ESPEN Consensus Statement. Clin. Nutr. 2015, 34, 335–340. [Google Scholar] [CrossRef]
- Norman, K.; Haß, U.; Pirlich, M. Malnutrition in Older Adults—Recent Advances and Remaining Challenges. Nutrients 2021, 13, 2764. [Google Scholar] [CrossRef]
- Tóth, K.; Szabó, A.; Nagy, Á.; Szabó, D.; Szécsi, B.; Eke, C.; Sándor, Á.; Susánszky, É.; Holndonner-Kirst, E.; Merkely, B.; et al. Preoperative Nutritional State Is Associated with Mid- and Long-Term Mortality after Cardiac Surgery. Ann. Palliat. Med. 2021, 10, 11333–11347. [Google Scholar] [CrossRef]
- Martínez-Ortega, A.J.; Piñar-Gutiérrez, A.; Serrano-Aguayo, P.; González-Navarro, I.; Remón-Ruíz, P.J.; Pereira-Cunill, J.L.; García-Luna, P.P. Perioperative Nutritional Support: A Review of Current Literature. Nutrients 2022, 14, 1601. [Google Scholar] [CrossRef]
- Kumar, S.; Dutt, A.; Hemraj, S.; Bhat, S.; Manipadybhima, B. Phase Angle Measurement in Healthy Human Subjects through Bio-Impedance Analysis. Iran. J. Basic Med. Sci. 2012, 15, 1180–1184. [Google Scholar]
- Bernardi, M.H.; Schmidlin, D.; Schiferer, A.; Ristl, R.; Neugebauer, T.; Hiesmayr, M.; Druml, W.; Lassnigg, A. Impact of Preoperative Serum Creatinine on Short- and Long-Term Mortality after Cardiac Surgery: A Cohort Study. Br. J. Anaesth. 2015, 114, 53–62. [Google Scholar] [CrossRef] [Green Version]
- Rothermel, L.D.; Lipman, J.M. Estimation of Blood Loss Is Inaccurate and Unreliable. Surgery 2016, 160, 946–953. [Google Scholar] [CrossRef]


| All | Phase Anglelow | Phase Anglehigh | p-Value | |
|---|---|---|---|---|
| Male | 111 (66.1) | 42 (50) | 69 (82.1) | 0.0227 |
| Female | 57 (33.9) | 42 (50) | 15 (17.9) | |
| Age (yrs) | 65.9 ± 11.8 | 71.0 ± 9.1 | 60.9 ± 12.0 | <0.0001 |
| BMI (kg/m2) | 27.8 ± 4.9 | 27.9 ± 5.4 | 27.7 ± 4.5 | 0.8058 |
| Frailty scale | 2.7 ± 1.3 | 3.1 ± 1.3 | 2.3 ± 1.1 | <0.0001 |
| Albumin (g/L) | 39.3 ± 3.9 | 38.3 ± 4.3 | 40.2 ± 3.1 | 0.0013 |
| Preoperative characteristics | ||||
| Resistance | 401.0 ± 80.1 | 419.2 ± 80.2 | 382.7 ± 76.0 | 0.0028 |
| Reactance | 42.0 ± 13.1 | 34.7 ± 9.3 | 49.2 ± 12.3 | <0.0001 |
| Phase angle | 6.1 ± 1.9 | 4.7 ± 0.8 | 7.4 ± 1.7 | <0.0001 |
| Comorbidities | ||||
| Asthma | 7 (4.2) | 5 (6.0) | 2 (2.4) | 0.44 |
| COPD | 22 (13.1) | 12 (14.3) | 10 (11.9) | 0.8191 |
| NIDDM | 26 (15.5) | 13 (15.5) | 13 (15.5) | 1.0 |
| IDDM | 8 (4.8) | 5 (6.0) | 3 (3.6) | 0.7171 |
| Chronic kidney disease | 14 (8.3) | 8 (9.5) | 6 (7.1) | 0.7801 |
| Cardiac decompensation | 1 (0.6) | 0 (0) | 1 (1.2) | 1.0 |
| PAOD | 11 (6.6) | 8 (9.5) | 3 (3.6) | |
| Atrial fibrillation | 40 (23.8) | 24 (28.6) | 16 (19.5) | |
| Angina pectoris | ||||
| Absent | 124 (73.8) | 65 (77.4) | 59 (70.2) | 0.4028 |
| Stable | 41 (24.4) | 17 (20.2) | 24 (28.6) | |
| Unstable | 3 (1.8) | 2 (2.4) | 1 (1.2) | |
| LVEF | ||||
| >50% | 133 (79.2) | 65 (77.4) | 68 (81.0) | 0.4501 |
| 30–50% | 29 (17.3) | 17 (20.2) | 12 (14.3) | |
| <30% | 6 (3.6) | 2 (2.4) | 4 (4.8) | |
| Surgical characteristics | ||||
| Procedure | ||||
| CABG | 28 (16.7) | 11 (13.1) | 17 (20.2) | 0.05506 |
| Combined | 43 (25.6) | 25 (29.8) | 18 (21.4) | |
| Valve | 92 (54.8) | 48 (57.1) | 44 (52.4) | |
| Others | 5 (3.0) | 0 (0) | 5 (6.0) | |
| Reoperation | 21 (12.5) | 13 (15.5) | 8 (9.5) | 0.3507 |
| Anesthesia duration (min) | 396 ± 92 | 399.4 ± 90.0 | 392.7 ± 93.9 | 0.6397 |
| Surgery (min) | 308 ± 86 | 310.4 ± 82.9 | 304.7 ± 90.2 | 0.6675 |
| CPB (min) | 149 ± 59 | 151.9 ± 54.7 | 145.1 ± 63.7 | 0.4554 |
| AoCC (min) | 96 ± 45 | 93.9 ± 43.4 | 98.9 ± 45.6 | 0.4722 |
| Balanceintraoperative (mL) | 4828 ± 2290 | 5145 ± 2556 | 4516 ± 1958 | 0.0765 |
| PRBC (units) | 0.7 ± 1.2 | 1.0 ± 1.4 | 0.4 ± 0.9 | 0.0014 |
| Platelets (units) | 0.2 ± 0.5 | 0.3 ± 0.6 | 0.1 ± 0.4 | 0.0470 |
| Fresh frozen plasma (units) | 0.1 ± 0.5 | 0.1 ± 0.5 | 0.1 ± 0.6 | 0.7659 |
| Fibrinogen (g) | 0.7 ± 1.2 | 0.9 ± 1.4 | 0.5 ± 0.9 | 0.0568 |
| Postoperative risk indicators | ||||
| Fluid balanceday of surgery (mL) | 7621 ± 2867 | 8388 ± 3168 | 7417 ± 2459 | 0.0287 |
| SAPS 3 | 40.6 ± 11.3 | 42.5 ± 12.7 | 38.8 ± 9.6 | 0.0391 |
| SOFA on ICU admission | 7.3 ± 2.2 | 7.7 ± 2.3 | 6.9 ± 2.0 | 0.0185 |
| Length of ICU stay (d) | 3.1 ±4.2 | 3.7 ± 4.5 | 2.6 ± 3.8 | 0.0182 |
| Univariable | Multivariable | |||
|---|---|---|---|---|
| Risk Indicator | OR (95% CI) | p-Value | OR (95% CI) | p-Value |
| Age (yrs) | 0.96 (0.94; 0.99) | 0.0024 | 0.98 (0.95; 1.02) | 0.0791 |
| BMI (kg/m2) | 0.97 (0.91; 1.02) | 0.288 | ||
| Frailty scale | 0.71 (0.57; 0.88) | 0.0018 | 0.77 (0.61; 0.98) | 0.0344 |
| Female | 0.41 (0.23; 0.73) | 0.0030 | 0.56 (0.31; 1.01) | 0.0558 |
| Albumin (g/L) | 1.07 (0.99; 1.15) | 0.0843 | ||
| Asthma | 0.52 (0.12; 2.15) | 0.365 | ||
| COPD | 0.65 (0.28; 1.52) | 0.326 | ||
| NIDDM | 0.93 (0.42; 2.05) | 0.855 | ||
| IDDM | 0.45 (0.12; 1.70) | 0.239 | ||
| Chronic kidney disease | 0.97 (0.34; 2.72) | 0.949 | ||
| Cardiac decompensation | 3.57 (0.09; 146.8) | 0.503 | ||
| PAOD | 0.43 (0.14; 1.36) | 0.154 | ||
| Angina pectoris | 1.05 (0.58; 1.88) | 0.881 | ||
| LVEF | 1.65 (0.94; 2.88) | 0.0834 | 1.85 (1.07; 3.19) | 0.0280 |
| Univariable | Multivariable | |||
|---|---|---|---|---|
| Risk Indicator | OR (95% CI) | p-Value | OR (95% CI) | p-Value |
| CABG | 1 | 1 | ||
| Valve procedure | 0.96 (0.33; 2.79) | 0.9397 | 0.79 (0.27; 2.33) | 0.6714 |
| Combined procedure | 0.27 (0.08; 0.90) | 0.0356 | 0.28 (0.08; 0.99) | 0.0500 |
| Other procedure | 3.35 (0.33; 33.94) | 0.3083 | 2.06 (0.21; 20.67) | 0.5400 |
| Reoperation | 0.76 (0.24; 2.45) | 0.649 | ||
| Surgery time (per min) | 0.99 (0.99; 0.99) | 0.0405 | ||
| CPB time (per min) | 1.0 (0.98; 1.00) | 0.118 | 0.99 (0.98; 0.99) | 0.0344 |
| AoCC time (per min) | 1.00 (0.99; 1.01) | 0.892 | 1.01 (1.00; 1.03) | 0.0514 |
| Fluid balanceday of surgery (per Liter) | 0.83 (0.73; 0.96) | 0.011 | 0.86 (0.75; 0.99) | 0.0371 |
Publisher’s Note: MDPI stays neutral with regard to jurisdictional claims in published maps and institutional affiliations. |
© 2022 by the authors. Licensee MDPI, Basel, Switzerland. This article is an open access article distributed under the terms and conditions of the Creative Commons Attribution (CC BY) license (https://creativecommons.org/licenses/by/4.0/).
Share and Cite
Ryz, S.; Nixdorf, L.; Puchinger, J.; Lassnigg, A.; Wiedemann, D.; Bernardi, M.H. Preoperative Phase Angle as a Risk Indicator in Cardiac Surgery—A Prospective Observational Study. Nutrients 2022, 14, 2491. https://doi.org/10.3390/nu14122491
Ryz S, Nixdorf L, Puchinger J, Lassnigg A, Wiedemann D, Bernardi MH. Preoperative Phase Angle as a Risk Indicator in Cardiac Surgery—A Prospective Observational Study. Nutrients. 2022; 14(12):2491. https://doi.org/10.3390/nu14122491
Chicago/Turabian StyleRyz, Sylvia, Larissa Nixdorf, Jürgen Puchinger, Andrea Lassnigg, Dominik Wiedemann, and Martin H. Bernardi. 2022. "Preoperative Phase Angle as a Risk Indicator in Cardiac Surgery—A Prospective Observational Study" Nutrients 14, no. 12: 2491. https://doi.org/10.3390/nu14122491