
Online Consumer Survey Comparing Different Front-of-Pack Labels in Greece

 ,
,  ,
,  , ,
, ,  ,
,
Abstract
:1. Introduction
2. Materials and Methods
2.1. Participants
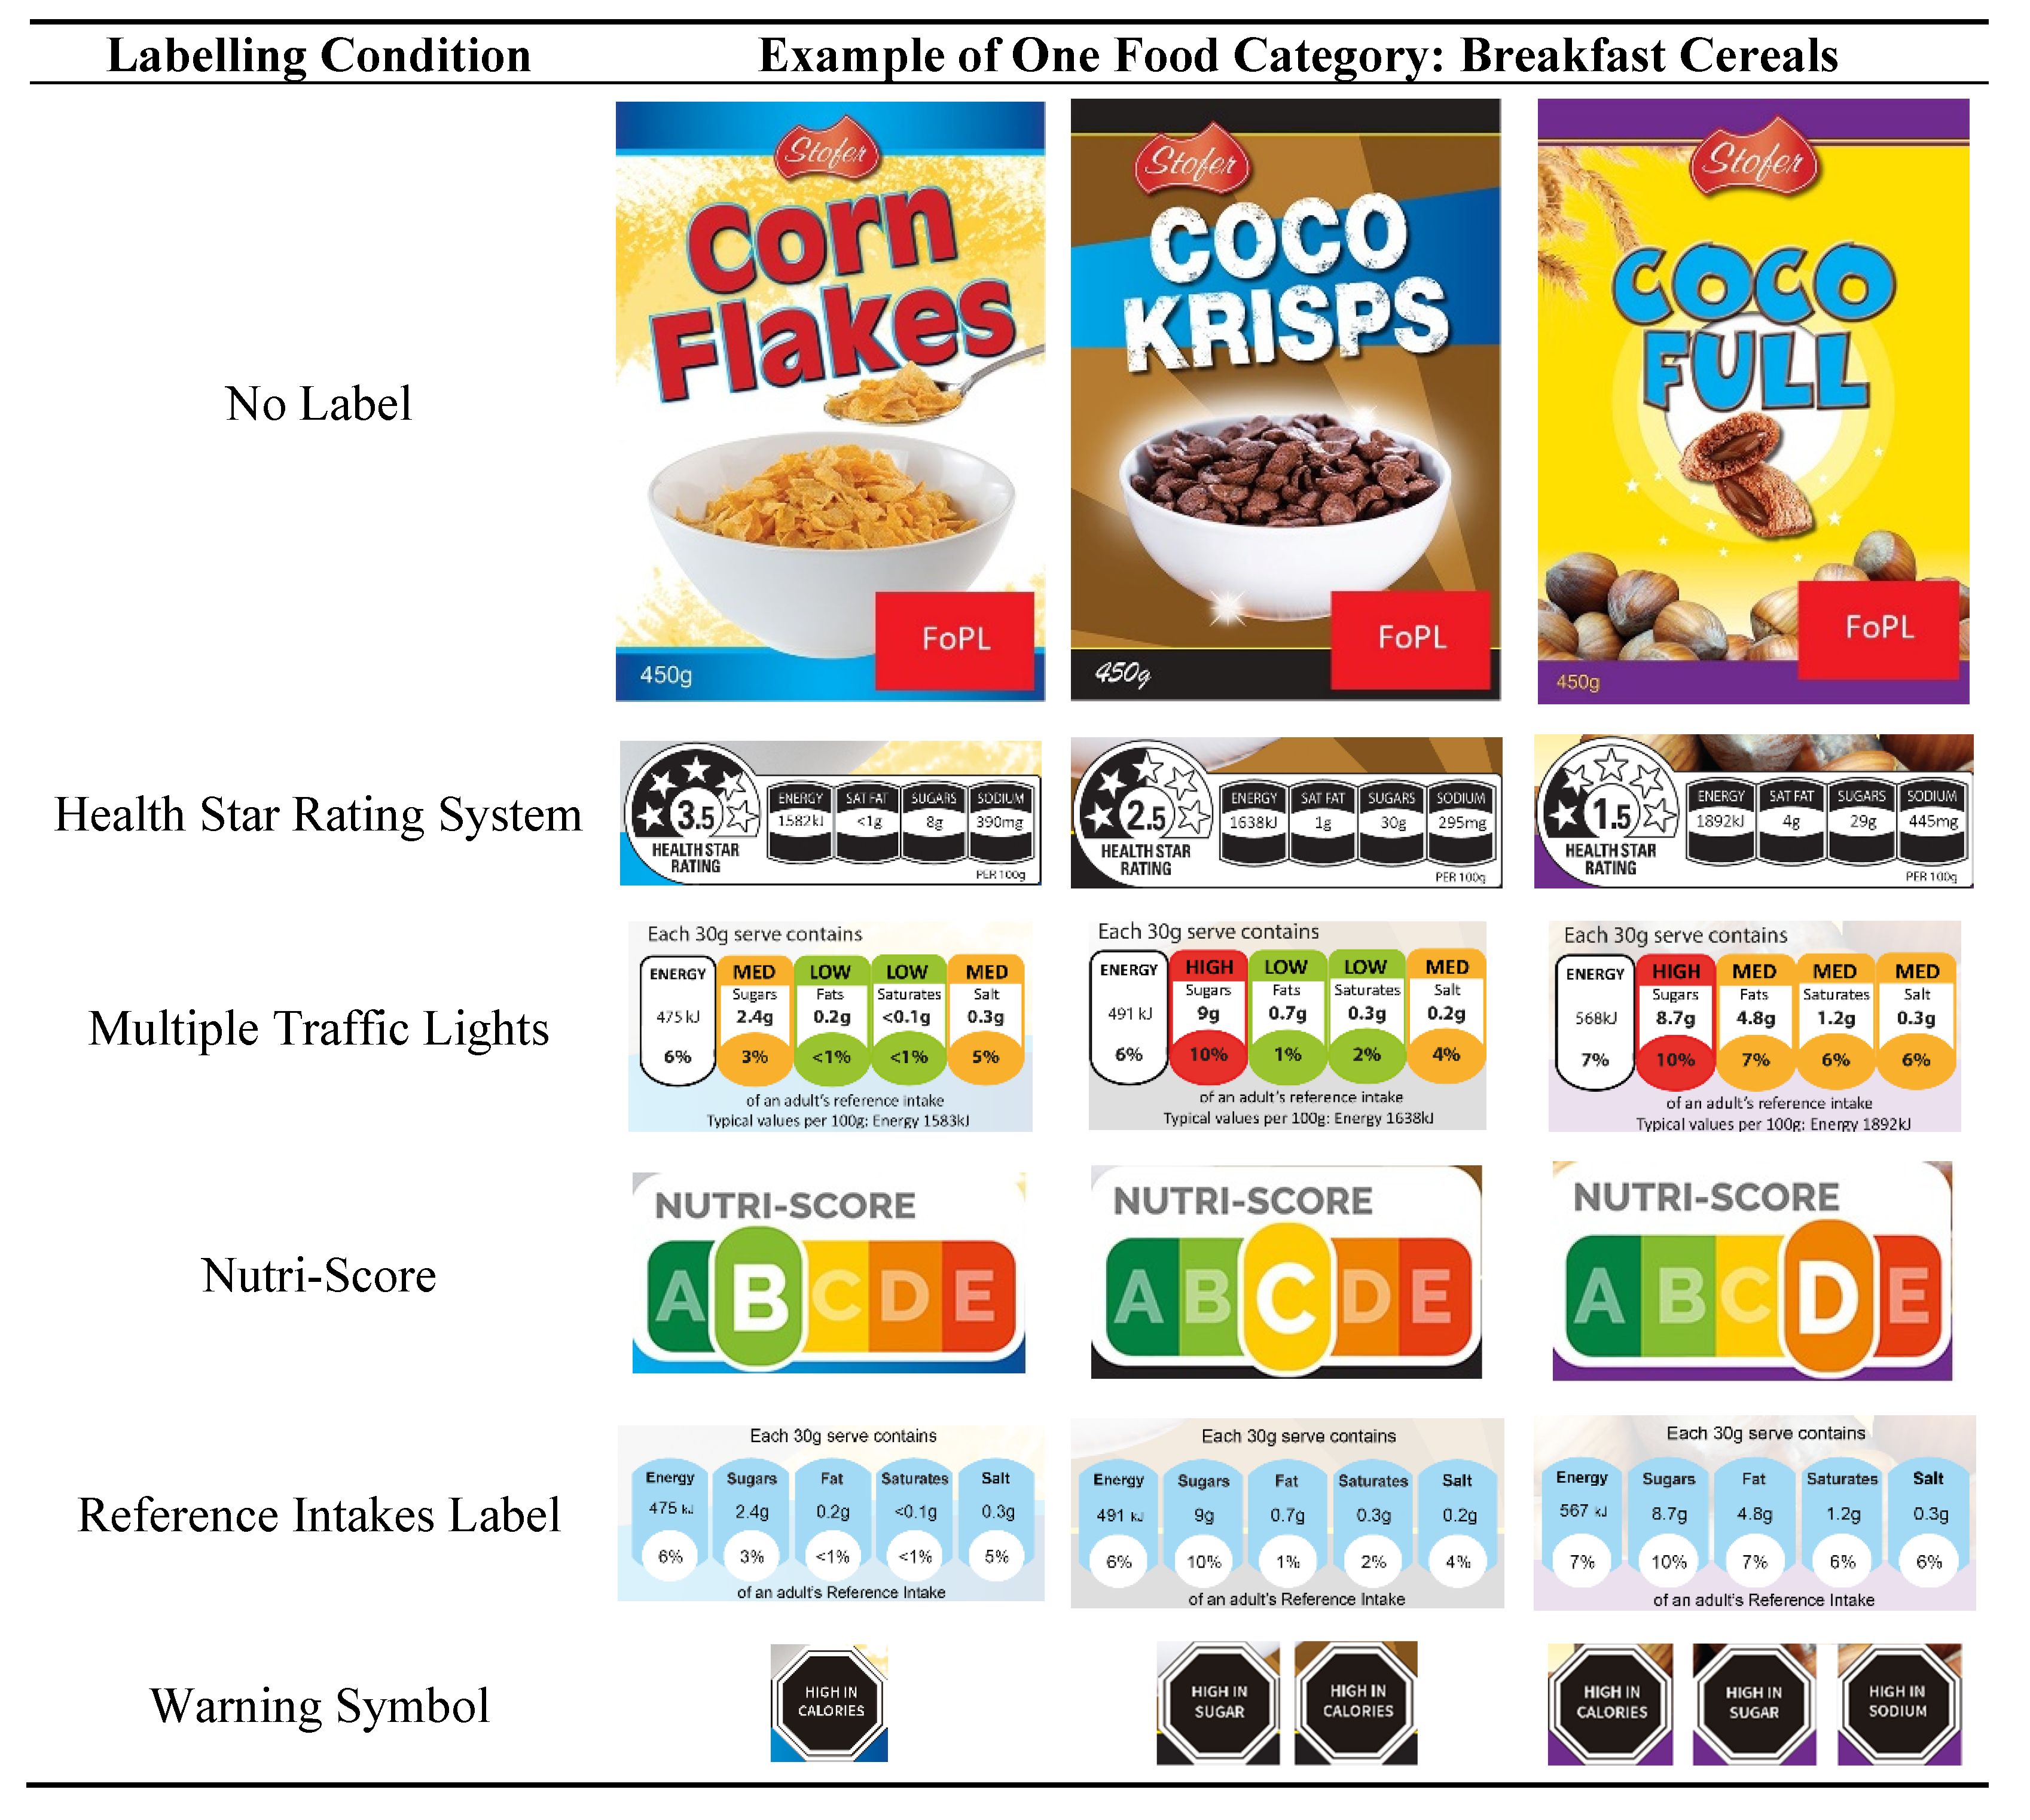
2.2. Procedure & Front-of-Pack Nutrition Labels
- Higher nutritional value
- Average nutritional value
- Lower nutritional value
2.3. Data Analysis
2.3.1. Food Choice
2.3.2. Objective Understanding
2.3.3. Perception
3. Results
3.1. Characteristics of the Population
3.2. Food Choices
3.3. Objective Understanding
3.4. Perception
4. Discussion
Limitation of Study
5. Conclusions
Author Contributions
Funding
Institutional Review Board Statement
Informed Consent Statement
Acknowledgments
Conflicts of Interest
References
- European Commission. The State of Health in the EU HELLAS Health Profile. 2019. Available online: https://ec.europa.eu/health/sites/default/files/state/docs/2019_chp_gr_english.pdf (accessed on 15 April 2021).
- Rosiek, A.; Maciejewska, N.F.; Leksowski, K.; Rosiek-Kryszewska, A.; Leksowski, Ł. Effect of Television on Obesity and Excess of Weight and Consequences of Health. Int. J. Environ. Res. Public Health 2015, 12, 9408–9426. [Google Scholar] [CrossRef] [PubMed] [Green Version]
- WHO; Regional Office for Europe. High Rates of Childhood Obesity Alarming Given Anticipated Impact of COVID-19 Pandemic. Available online: https://www.euro.who.int/en/media-centre/sections/pressreleases/2021/high-rates-of-childhood-obesity-alarming-given-anticipated-impact-of-covid-19-pandemic (accessed on 4 September 2021).
- Arroyo-Johnson, C.; Mincey, K.D. Obesity Epidemiology Trends by Race/Ethnicity, Gender, and Education. Gastroenterol. Clin. N. Am. 2016, 45, 571–579. [Google Scholar] [CrossRef] [Green Version]
- Bombak, A. Obesity, Health at Every Size, and Public Health Policy. Am. J. Public Health 2014, 104, 60–67. [Google Scholar] [CrossRef] [PubMed]
- WHO. Obesity and Overweight. Available online: https://www.who.int/news-room/fact-sheets/detail/obesity-and-overweight (accessed on 30 June 2021).
- WHO. Noncommunicable Diseases. Available online: https://www.who.int/news-room/fact-sheets/detail/noncommunicable-diseases (accessed on 19 April 2021).
- Jones, A.; Neal, B.; Reeve, B.; Ni Mhurchu, C.; Thow, A.M. Front-of-pack nutrition labelling to promote healthier diets: Current practice and opportunities to strengthen regulation worldwide. BMJ Glob. Health 2019, 4, 1–16. [Google Scholar] [CrossRef]
- WHO; Regional Office for Europe. Manual to Develop and Implement Front-of-Pack Nutrition Labelling. WHO/EURO 2020, 1569-41320-56234. Available online: https://apps.who.int/iris/handle/10665/336989 (accessed on 22 September 2021).
- WHO. Available online: https://www.who.int/health-topics/obesity#tab=tab_3 (accessed on 19 March 2021).
- Vandevijvere, S.; Vermote, M.; Egnell, M.; Galan, P.; Talati, Z.; Pettigrew, S.; Hercberg, S.; Julia, C. Consumers’ food choices, understanding and perceptions in response to different front-of-pack nutrition labelling systems in Belgium: Results from an online experimental study. Arch. Public Health 2020, 78, 1–9. [Google Scholar] [CrossRef] [PubMed] [Green Version]
- Crockett, R.A.; King, S.E.; Marteau, T.M.; Prevost, A.T.; Bignardi, G.; Roberts, N.W.; Stubbs, B.; Hollands, G.J.; Jebb, S.A. Nutritional labelling for healthier food or non-alcoholic drink purchasing and consumption. Cochrane Database Syst. Rev. 2018. [Google Scholar] [CrossRef] [Green Version]
- El-Abbadi, N.H.; Taylor, S.F.; Micha, R.; Blumberg, J.B. Nutrient Profiling Systems, Front of Pack Labeling, and Consumer Behavior. Curr. Atheroscler Rep. 2020, 22, 1–10. [Google Scholar] [CrossRef]
- Kanter, R.; Vanderlee, L.; Vandevijvere, S. Front-of-package nutrition labelling policy: Global progress and future directions. Public Health Nutr. 2018, 21, 1399–1408. [Google Scholar] [CrossRef] [Green Version]
- Press Release. Ministry of Rural Development and Food. An Advisory Team of Scientists is Set Up by Sp. Libanos for the Promotion of the “Greek Diet” and Prevention of the Nutriscore System. Athens, 14 April 2021. Available online: http://www.minagric.gr/index.php/el/the-ministry2/grafeiotypou/deltiatypou/11253-dt140421 (accessed on 10 September 2021).
- Ducrot, P.; Méjean, C.; Julia, C.; Kesse-Guyot, E.; Touvier, M.; Fezeu, L.; Hercberg, S.; Péneau, S. Effectiveness of Front-Of-Pack Nutrition Labels in French Adults: Results from the NutriNet-Santé Cohort Study. PLoS ONE 2015, 10, e0140898. [Google Scholar]
- Grunert, K.G.; Wills, J.M. A Review of European Research on Consumer Response to Nutrition Information on Food Labels. J. Public Health 2007, 15, 385–399. [Google Scholar] [CrossRef] [Green Version]
- Grunert, K.G.; Fernández-Celemín, L.; Wills, J.M.; Storcksdieck Genannt Bonsmann, S.; Nureeva, L. Use and Understanding of Nutrition Information on Food Labels in Six European Countries. Z Gesundh Wiss 2010, 18, 261–277. [Google Scholar] [CrossRef] [Green Version]
- European Commission; Joint Research Centre. Front-of-Pack Nutrition Labelling Schemes: A Comprehensive Review; Publications Office of the European Union: Luxembourg, 2020. [Google Scholar]
- Egnell, M.; Talati, Z.; Hercberg, S.; Pettigrew, S.; Julia, C. Objective Understanding of Front-of-Package Nutrition Labels: An International Comparative Experimental Study across 12 Countries. Nutrients 2018, 10, 1542. [Google Scholar] [CrossRef] [Green Version]
- Mejean, C.; Macouillard, P.; Péneau, S.; Hercberg, S.; Castetbon, K. Consumer Acceptability and Understanding of Front-of-Pack Nutrition Labels. J. Hum. Nutr. Diet. 2013, 26, 494–503. [Google Scholar] [CrossRef] [PubMed]
- Mejean, C.; Macouillard, P.; Peneau, S.; Hercberg, S.; Castetbon, K. Perception of Front-of-Pack Labels According to Social Characteristics, Nutritional Knowledge and Food Purchasing Habits. Public Health Nutr. 2013, 16, 392–402. [Google Scholar] [CrossRef] [Green Version]
- Ducrot, P.; Méjean, C.; Julia, C.; Kesse-Guyot, E.; Touvier, M.; Fezeu, L.K.; Hercberg, S.; Péneau, S. Objective Understanding of Front-of-Package Nutrition Labels among Nutritionally At-Risk Individuals. Nutrients 2015, 7, 7106–7125. [Google Scholar] [CrossRef] [PubMed] [Green Version]
- Press Release. Greek Statistical Authority. Economic Inequality. Income and Living Conditions Survey of Households: Year 2020 (Income Reporting Period: Year 2019) Piraeus, 22 June 2021. Available online: https://www.statistics.gr/documents/20181/afaf24ea-2210-3272-8f295506242319c4 (accessed on 20 August 2021).
- Vargas-Meza, J.; Jáuregui, A.; Pacheco-Miranda, S.; Contreras-Manzano, A.; Barquera, S. Front-of-pack nutritional labels: Understanding by low- And middle-income Mexican consumers. PLoS ONE 2019, 14, 1–16. [Google Scholar] [CrossRef] [PubMed]
- Packer, J.; Russell, S.J.; Ridout, D.; Hope, S.; Conolly, A.; Jessop, C.; Robinson, O.J.; Stoffel, S.T.; Viner, R.M.; Croker, H. Assessing the Effectiveness of Front of Pack Labels: Findings from an Online Randomised-Controlled Experiment in a Representative British Sample. Nutrients 2021, 13, 900. [Google Scholar] [CrossRef]
- Egnell, M.; Galan, P.; Farpour-Lambert, N.J.; Talati, Z.; Pettigrew, S.; Hercberg, S.; Julia, C. Compared to other front-of-pack nutrition labels, the Nutri-Score emerged as the most efficient to inform Swiss consumers on the nutritional quality of food products. PLoS ONE 2020, 15, 1–18. [Google Scholar] [CrossRef]
- Egnell, M.; Talati, Z.; Gombaud, M.; Galan, P.; Hercberg, S.; Pettigrew, S.; Julia, C. Consumers’ Responses to Front-of-Pack Nutrition Labelling: Results from a Sample from The Netherlands. Nutrients 2019, 11, 1817. [Google Scholar] [CrossRef] [Green Version]
- Egnell, M.; Talati, Z.; Pettigrew, S.; Galan, P.; Hercberg, S.; Julia, C. Vergleich von Front-of-Pack-Kennzeichnungen zur Aufklärung deutscher VerbraucherInnen über den Nährwert von Lebensmitteln: Farbkodierte Kennzeichnungen übertreffen alle anderen Systeme. Ernahrungs Umschau. 2019, 66, 76–84. [Google Scholar]
- Buyuktuncer, Z.; Ayaz, A.; Dedebayraktar, D.; Inan-Eroglu, E.; Ellahi, B.; Besler, H.T. Promoting a Healthy Diet in Young Adults: The Role of Nutrition Labelling. Nutrients 2018, 10, 1335. [Google Scholar] [CrossRef] [PubMed] [Green Version]
- Talati, Z.; Egnell, M.; Hercberg, S.; Julia, C.; Pettigrew, S. Consumers’ perceptions of five front-of-package nutrition labels: An experimental study across 12 countries. Nutrients 2019, 11, 1934. [Google Scholar] [CrossRef] [Green Version]
- Jáuregui, A.; Vargas-Meza, J.; Nieto, C.; Contreras-Manzano, A.; Alejandro, N.Z.; Tolentino-Mayo, L.; Hall, M.G.; Barquera, S. Impact of front-of-pack nutrition labels on consumer purchasing intentions: A randomized experiment in low- And middle-income Mexican adults. BMC Public Health 2020, 20, 1–13. [Google Scholar] [CrossRef] [PubMed]
- Dubois, P.; Albuquerque, P.; Allais, O.; Bonnet, C.; Bertail, P.; Combris, P.; Lahlou, S.; Rigal, N.; Ruffieux, B.; Chandon, P. Effects of front-of-pack labels on the nutritional quality of supermarket food purchases: Evidence from a large-scale randomized controlled trial. J. Acad. Mark. Sci. 2021, 49, 119–138. [Google Scholar] [CrossRef] [Green Version]
- Crosetto, P.; Lacroix, A.; Muller, L.; Ruffieux, B. Nutritional and Economic Impact of 5 Alternative Front-of-Pack Nutritional Labels: Experimental Evidence. HAL Id: Hal-01805431. 2018. Available online: https://hal.archives-ouvertes.fr/hal-01805431/document (accessed on 20 August 2021).
- Van Den Akker, K.; Bartelet, D.; Brouwer, L.; Luijpers, S.; Nap, T.; Havermans, R. The impact of the nutri-score on food choice: A choice experiment in a Dutch supermarket. Appetite 2021, 168, 105664. [Google Scholar] [CrossRef]
- Cecchini, M.; Warin, L. Impact of food labelling systems on food choices and eating behaviours: A systematic review and meta-analysis of randomized studies. Obes. Rev. 2016, 17, 201–210. [Google Scholar] [CrossRef] [PubMed]
- Shangguan, S.; Afshin, A.; Shulkin, M.; Ma, W.; Marsden, D.; Smith, J.; Saheb-Kashaf, M.; Shi, P.; Micha, R.; Imamura, F.; et al. Food PRICE (Policy Review and Intervention Cost-Effectiveness) Project. A Meta-Analysis of Food Labeling Effects on Consumer Diet Behaviors and Industry Practices. Am. J. Prev. Med. 2019, 56, 300–314. [Google Scholar] [CrossRef]
- Al-Jawaldeh, A.; Rayner, M.; Julia, C.; Elmadfa, I.; Hammerich, A.; McColl, K. Improving nutrition information in the eastern mediterranean region: Implementation of front-of-pack nutrition labelling. Nutrients 2020, 12, 330. [Google Scholar] [CrossRef]
- Aguenaou, H.; El Ammari, L.; Bigdeli, M.; El Hajjab, A.; Lahmam, H.; Labzizi, S.; Gamih, H.; Talouizte, A.; Serbouti, C.; El Kari, K.; et al. Comparison of appropriateness of Nutri-Score and other front-of-pack nutrition labels across a group of Moroccan consumers: Awareness, understanding and food choices. Arch. Public Health 2021, 79, 1–13. [Google Scholar] [CrossRef]
- Egnell, M.; Galan, P.; Fialon, M.; Touvier, M.; Péneau, S.; Kesse-Guyot, E.; Hercberg, S.; Julia, C. The impact of the Nutri-Score front-of-pack nutrition label on purchasing intentions of unprocessed and processed foods: Post-hoc analyses from three randomized controlled trials. Int. J. Behav. Nutr. Phys. Act. 2021, 18, 1–12. [Google Scholar] [CrossRef]
- Egnell, M.; Talati, Z.; Galan, P.; Andreeva, V.A.; Vandevijvere, S.; Gombaud, M.; Dréano-Trécant, L.; Hercberg, S.; Pettigrew, S.; Julia, C. Objective understanding of the Nutri-score front-of-pack label by European consumers and its effect on food choices: An online experimental study. Int. J. Behav. Nutr. Phys. Act. 2020, 17, 1–14. [Google Scholar] [CrossRef] [PubMed]
- Fialon, M.; Egnell, M.; Talati, Z.; Galan, P.; Dréano-Trécant, L.; Touvier, M.; Pettigrew, S.; Hercberg, S.; Julia, C. Effectiveness of Different Front-of-Pack Nutrition Labels among Italian Consumers: Results from an Online Randomized Controlled Trial. Nutrients 2020, 12, 2307. [Google Scholar] [CrossRef] [PubMed]


| N | % | ||
|---|---|---|---|
| Sex | Male | 626 | 49.0% |
| Female | 652 | 51.0% | |
| Age Groups | 18–30 | 427 | 33.4% |
| 31–50 | 445 | 34.8% | |
| >50 | 406 | 31.8% | |
| Income Groups | Low | 431 | 33.7% |
| Medium | 464 | 36.3% | |
| High | 383 | 30.0% | |
| Educational level | Primary education | 7 | 0.5% |
| Secondary education | 288 | 22.5% | |
| College certificate (IEK) | 71 | 5.6% | |
| University bachelor degree | 648 | 50.7% | |
| University postgraduate degree | 264 | 20.7% | |
| Responsible for grocery shopping | Yes | 404 | 31.6% |
| No | 436 | 34.1% | |
| Share shopping with another household member | 438 | 34.3% | |
| Self-estimated diet quality | I follow a very unhealthy diet | 20 | 1.6% |
| I follow an unhealthy diet | 165 | 12.9% | |
| I follow a healthy diet | 1036 | 81.1% | |
| I follow a very healthy diet | 57 | 4.5% | |
| Self-estimated nutrition knowledge | I have no nutrition knowledge | 5 | 0.4% |
| I have little nutrition knowledge | 500 | 39.1% | |
| I have adequate nutrition knowledge | 634 | 49.6% | |
| I have very good nutrition knowledge | 139 | 10.9% | |
| Did you see the FoP label during the survey? | No | 359 | 28.1% |
| I am not sure | 236 | 18.5% | |
| Yes | 683 | 53.4% | |
| Read the nutrition statement | No | 214 | 16.7% |
| On the back of the product | Sometimes | 535 | 41.9% |
| Packaging | Yes | 529 | 41.4% |
| Participants who recalled seeing the FoPL they were exposed to | MTL | 131 | 51.4% |
| GDA | 163 | 63.9% | |
| Warning Symbols | 127 | 49.0% | |
| Nutri-Score | 128 | 50.2% | |
| HSR | 134 | 52.8% | |
| FoPL | |||||
|---|---|---|---|---|---|
| Frequency | Percent | Valid Percent | Cumulative Percent | ||
| Valid | MTL | 255 | 19.9 | 19.9 | 20.0 |
| GDA | 255 | 19.9 | 19.9 | 39.9 | |
| Warning Symbols | 259 | 20.3 | 20.3 | 60.2 | |
| Nutri-Score | 255 | 19.9 | 19.9 | 80.1 | |
| HSR | 254 | 19.9 | 19.9 | 100.0 | |
| Total | 1278 | 100.0 | 100.0 | ||
| Food Category | N | MTL | Warning Symbols | Nutri-Score | HSR | ||||
|---|---|---|---|---|---|---|---|---|---|
| OR (95% CI) | p | OR (95% CI) | p | OR (95% CI) | p | OR (95% CI) | p | ||
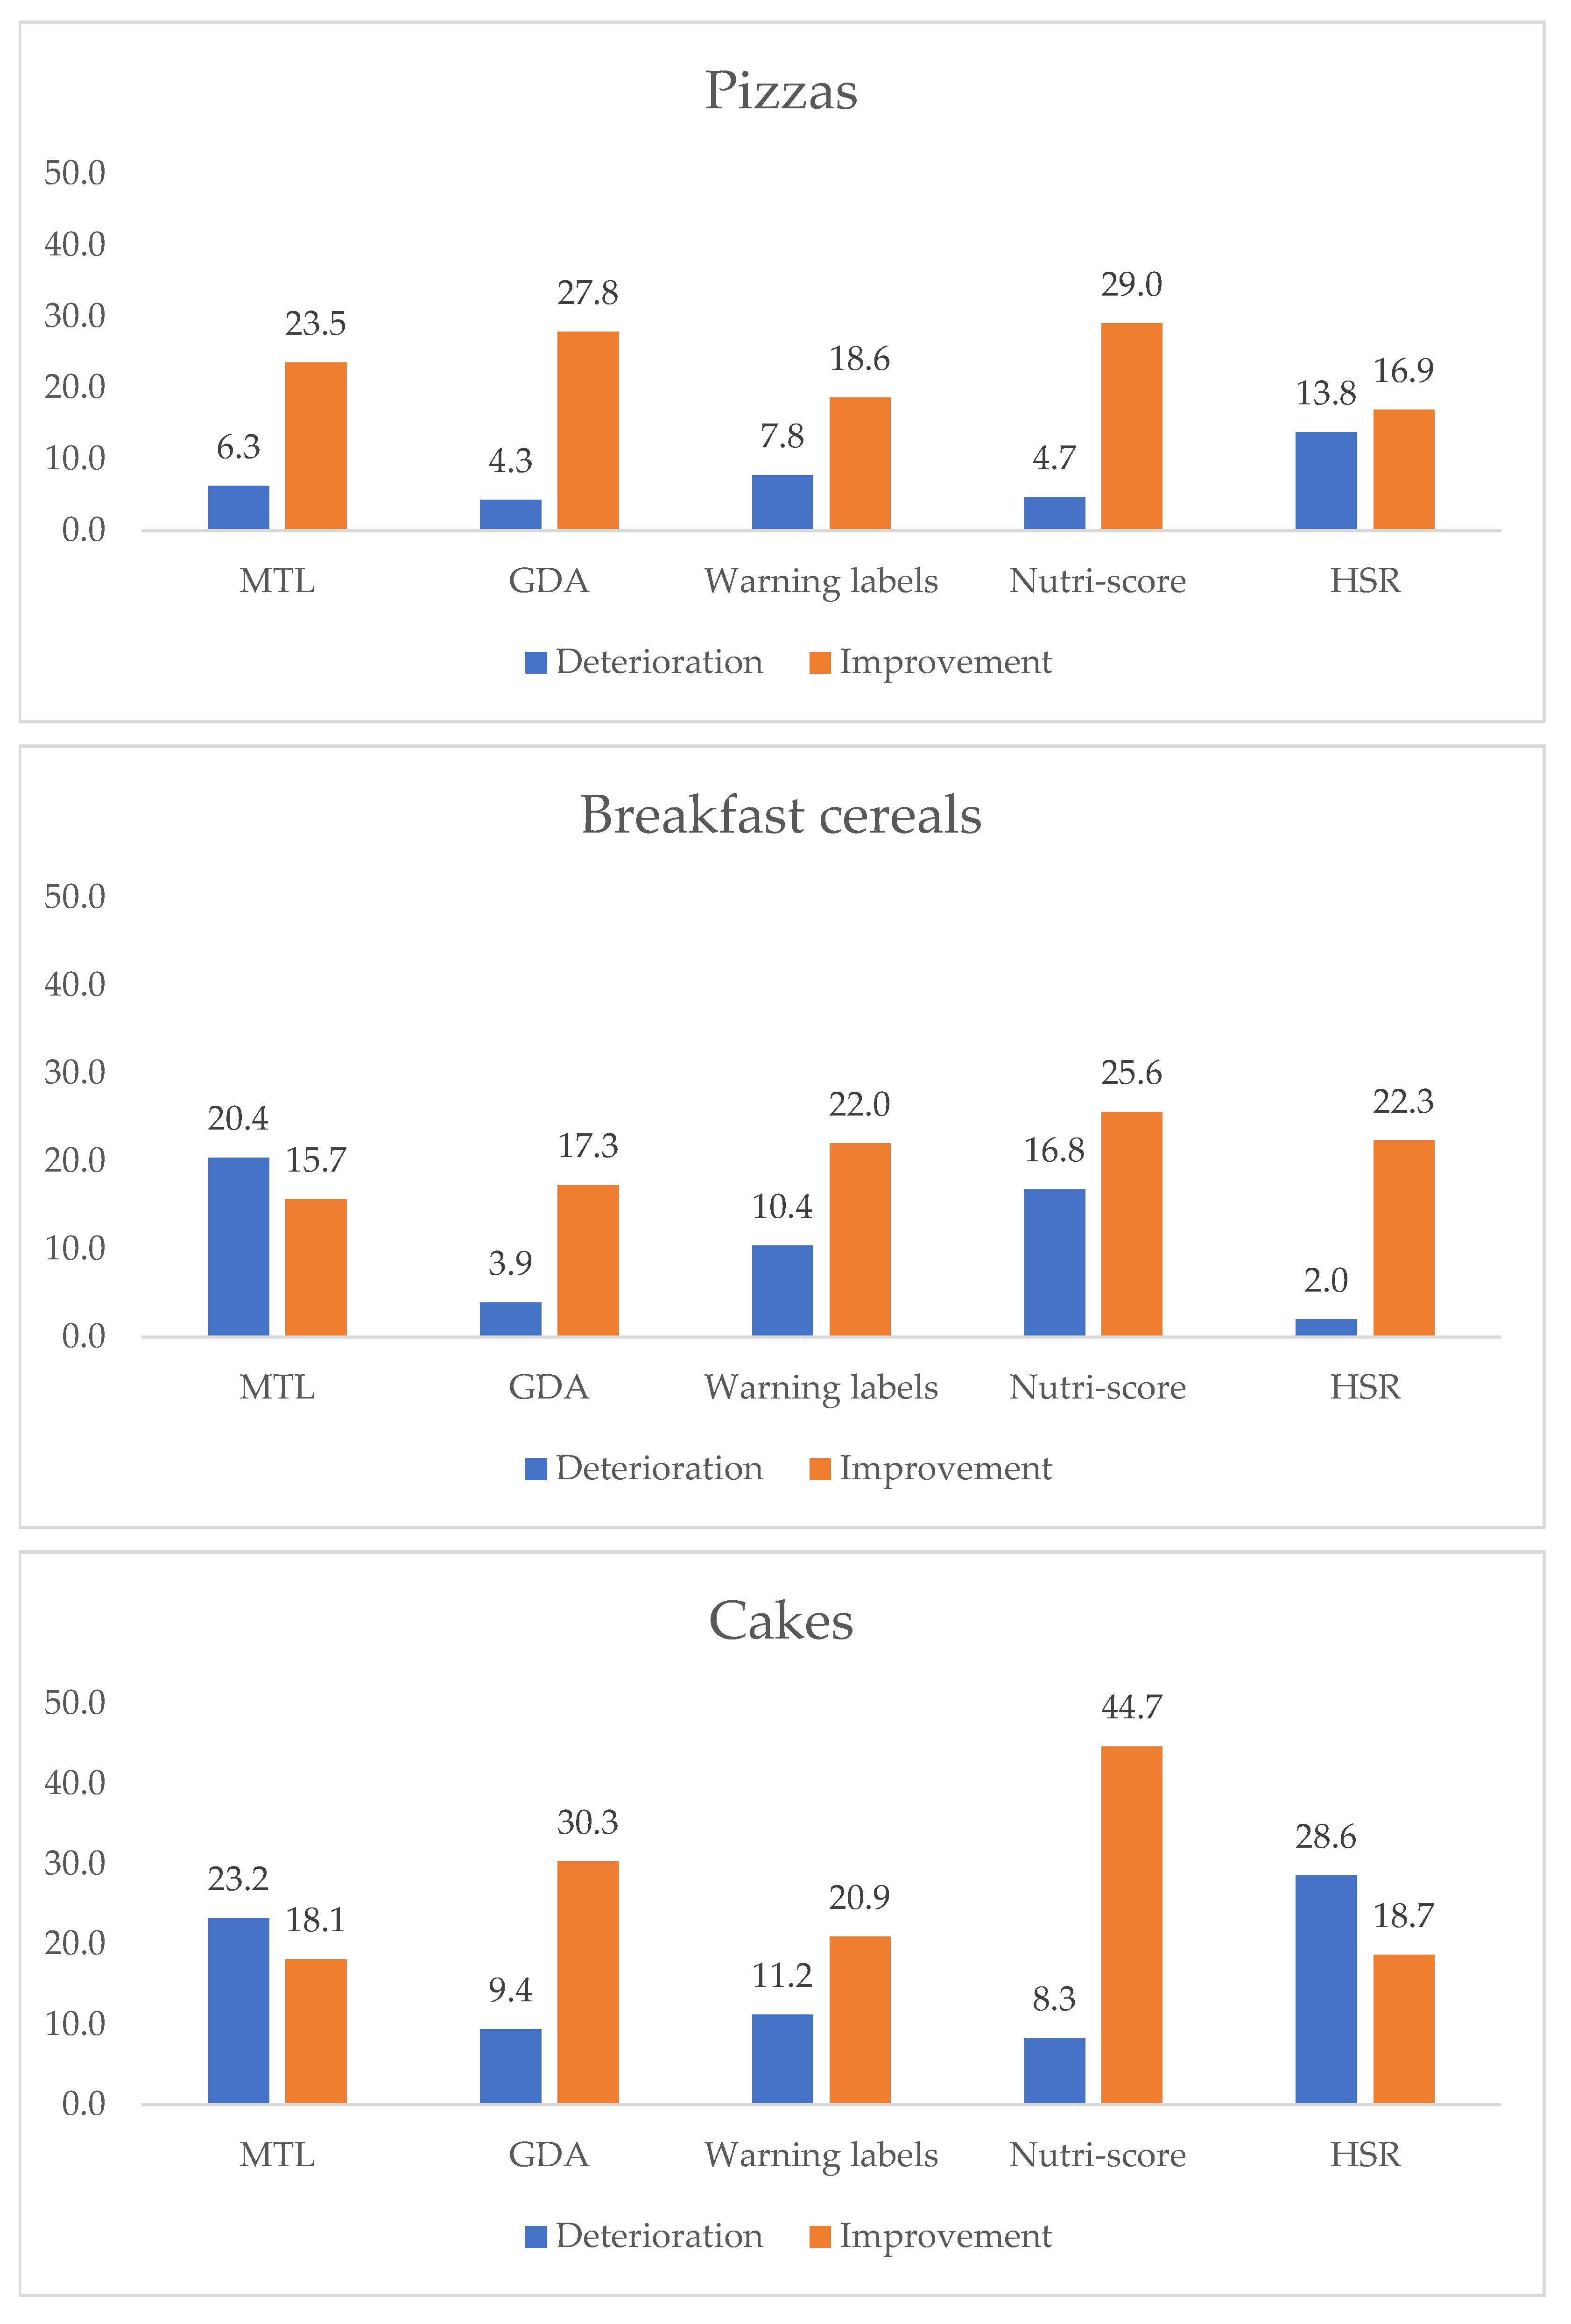
| All categories | 1265 | 0.71 [0.63–0.79] | <0.001 | 0.85 [0.76–0.96] | <0.01 | 1.07 [0.96–1.20] | 0.2 | 0.75 [0.67–0.84] | <0.001 |
| Pizza | 1277 | 0.90 [0.69–1.16] | 0.44 | 0.67 [0.51–0.87] | <0.01 | 1.06 [0.82–1.36] | 0.6 | 0.54 [0.41–0.72] | <0.001 |
| Cakes | 1271 | 0.55 [0.45–0.67] | <0.001 | 0.79 [0.65–0.96] | 0.02 | 1.17 [0.97–1.42] | 0.09 | 0.54 [0.45–0.66] | <0.001 |
| Breakfast Cereals | 1270 | 0.59 [0.46–0.75] | <0.001 | 1.00 [0.79–1.28] | 0.95 | 0.97 [0.76–1.24] | 0.84 | 1.22 [0.95–1.55] | 0.109 |
| Food Category | N | MTL | Warning Symbols | Nutri-Score | HSR | ||||
|---|---|---|---|---|---|---|---|---|---|
| OR (95% CI) | p | OR (95% CI) | p | OR (95% CI) | p | OR (95% CI) | p | ||
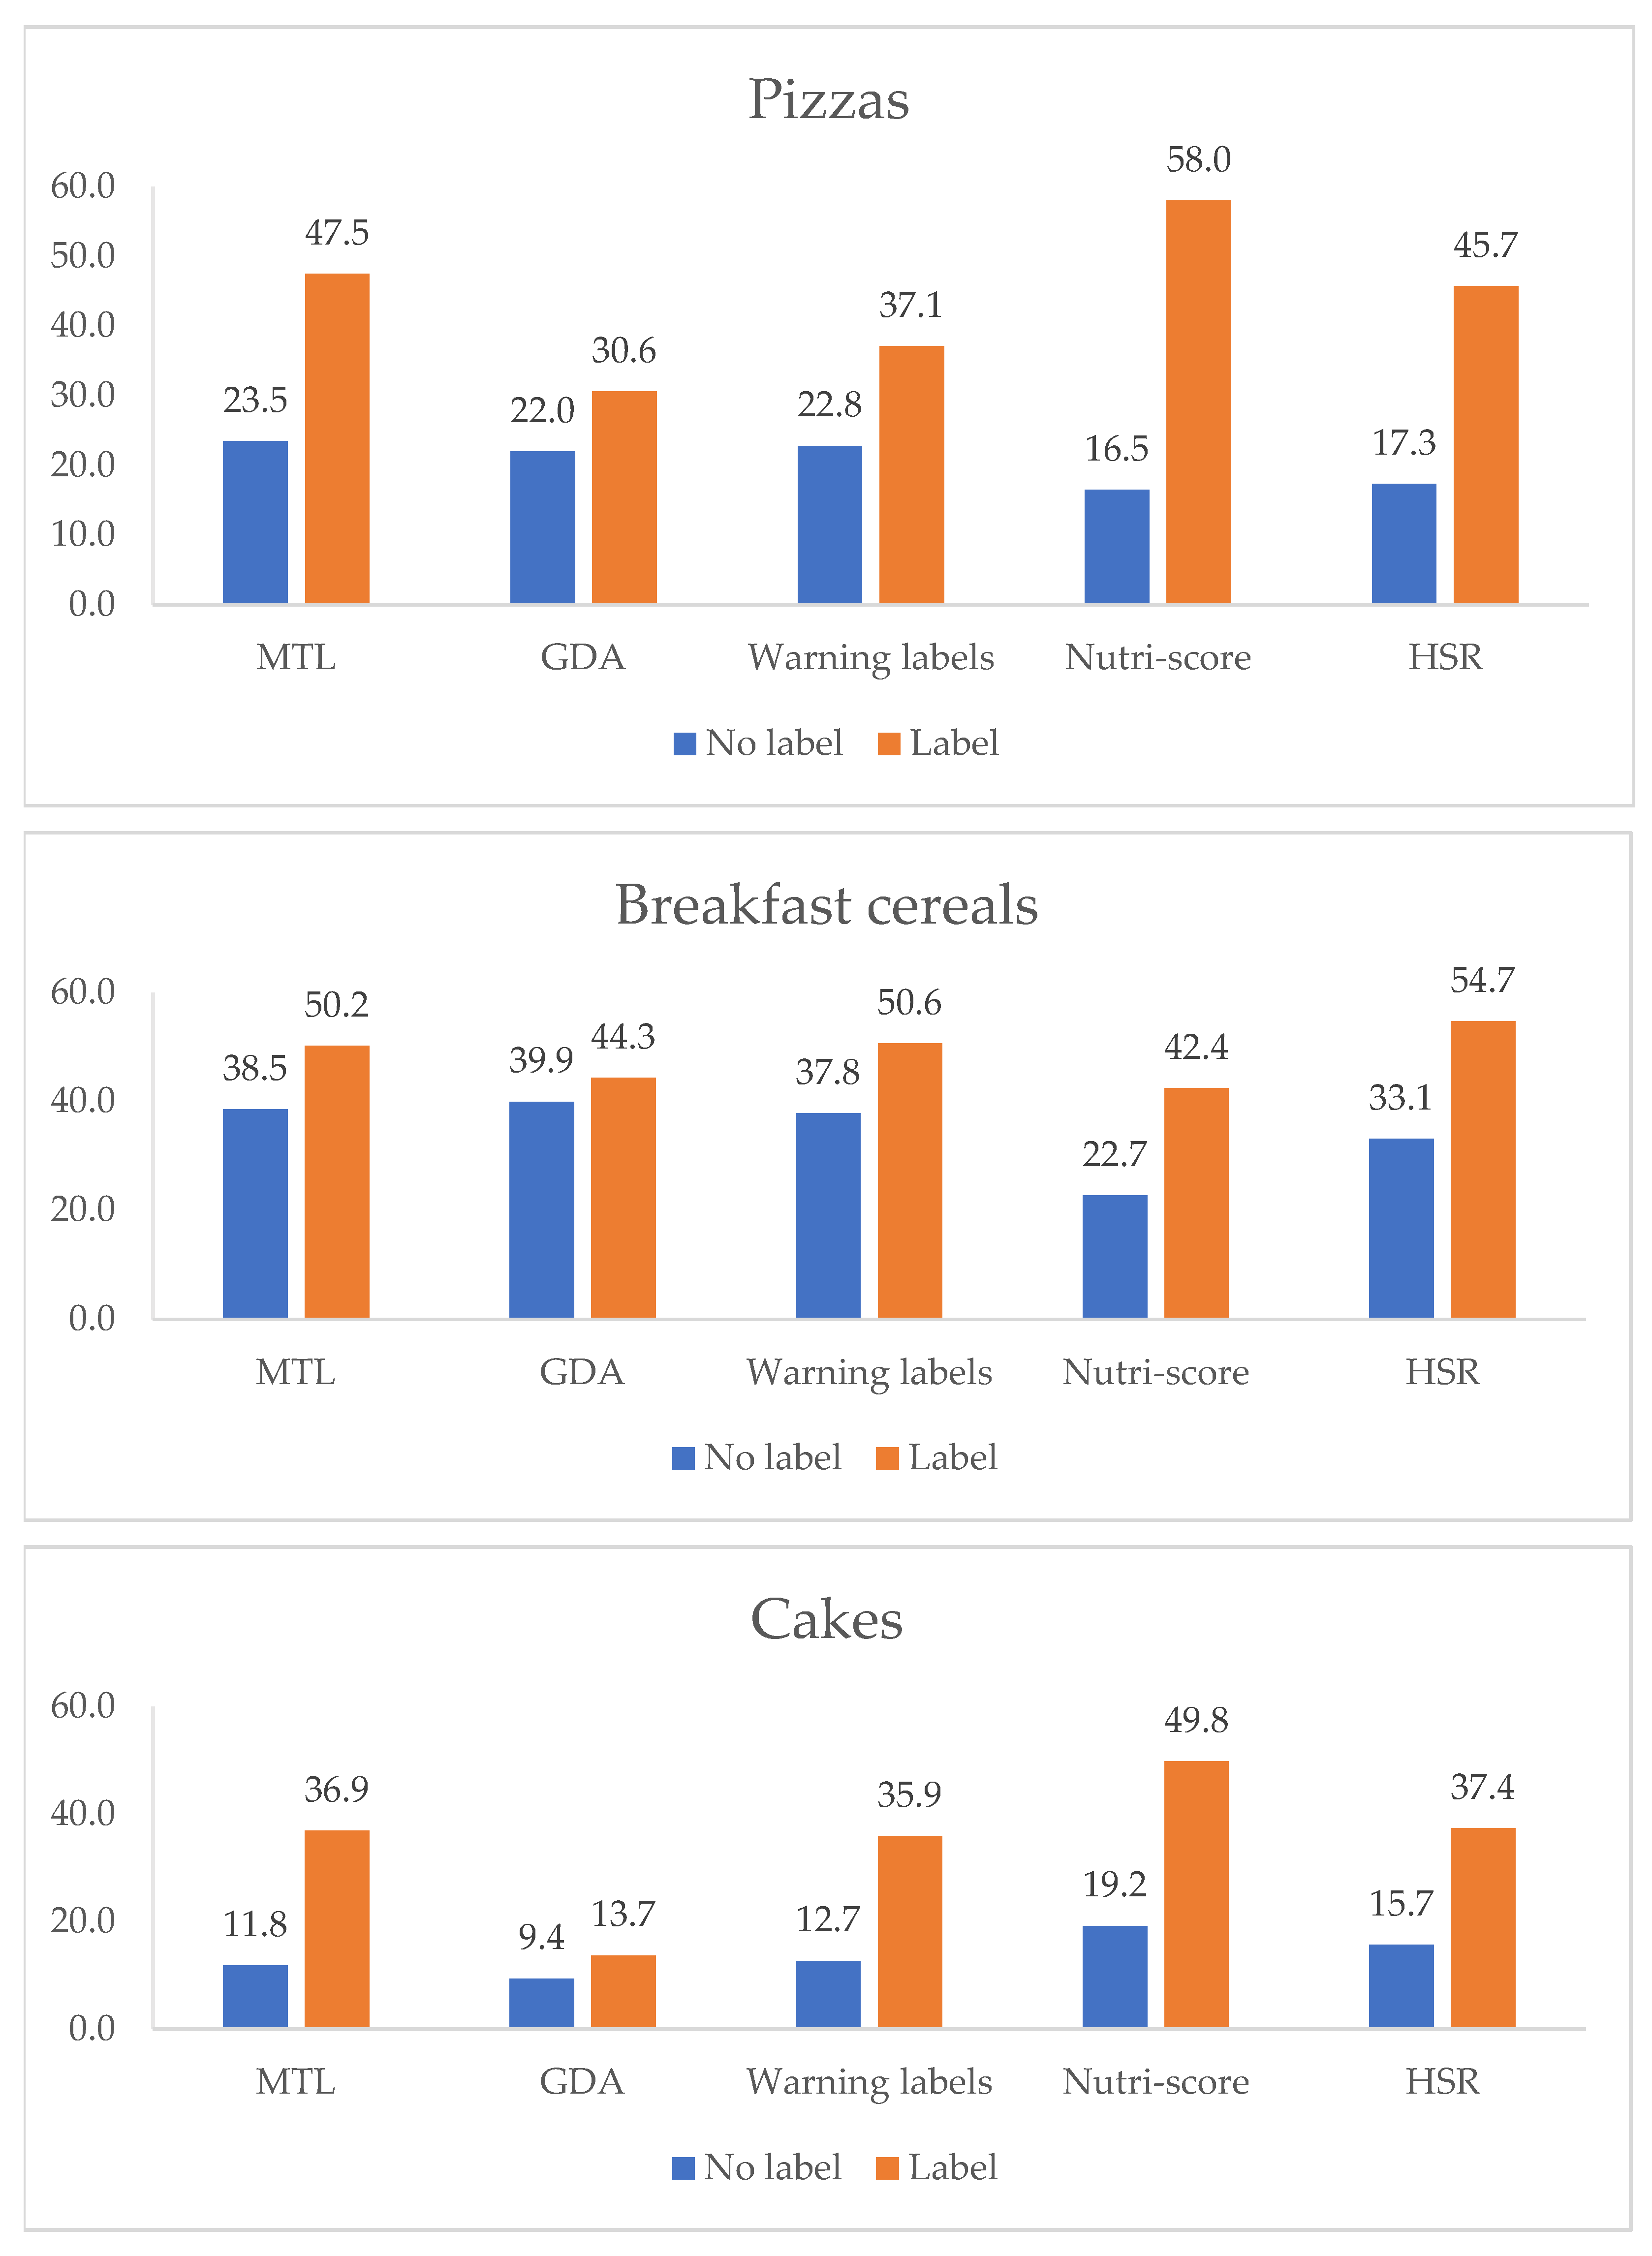
| All categories | 867 | 1.17 [1.05–1.29] | <0.01 | 1.09 [0.99–1.21] | 0.076 | 1.36 [1.23–1.50] | <0.001 | 1.23 [1.11–1.36] | <0.001 |
| Pizza | 987 | 1.29 [1.05–1.58] | 0.015 | 0.95 [0.77–1.17] | 0.674 | 1.69 [1.39–2.05] | <0.001 | 1.34 [1.09–1.64] | <0.01 |
| Cakes | 954 | 1.49 [1.23–1.80] | <0.001 | 1.37 [1.13–1.65] | <0.01 | 1.53 [1.28–1.83] | <0.001 | 1.53 [1.26–1.84] | <0.001 |
| Breakfast Cereals | 988 | 0.96 [0.79–1.16] | 0.68 | 1.08 [0.89–1.31] | 0.429 | 1.27 [1.05–1.53] | 0.013 | 1.17 [0.96–1.42] | 0.107 |
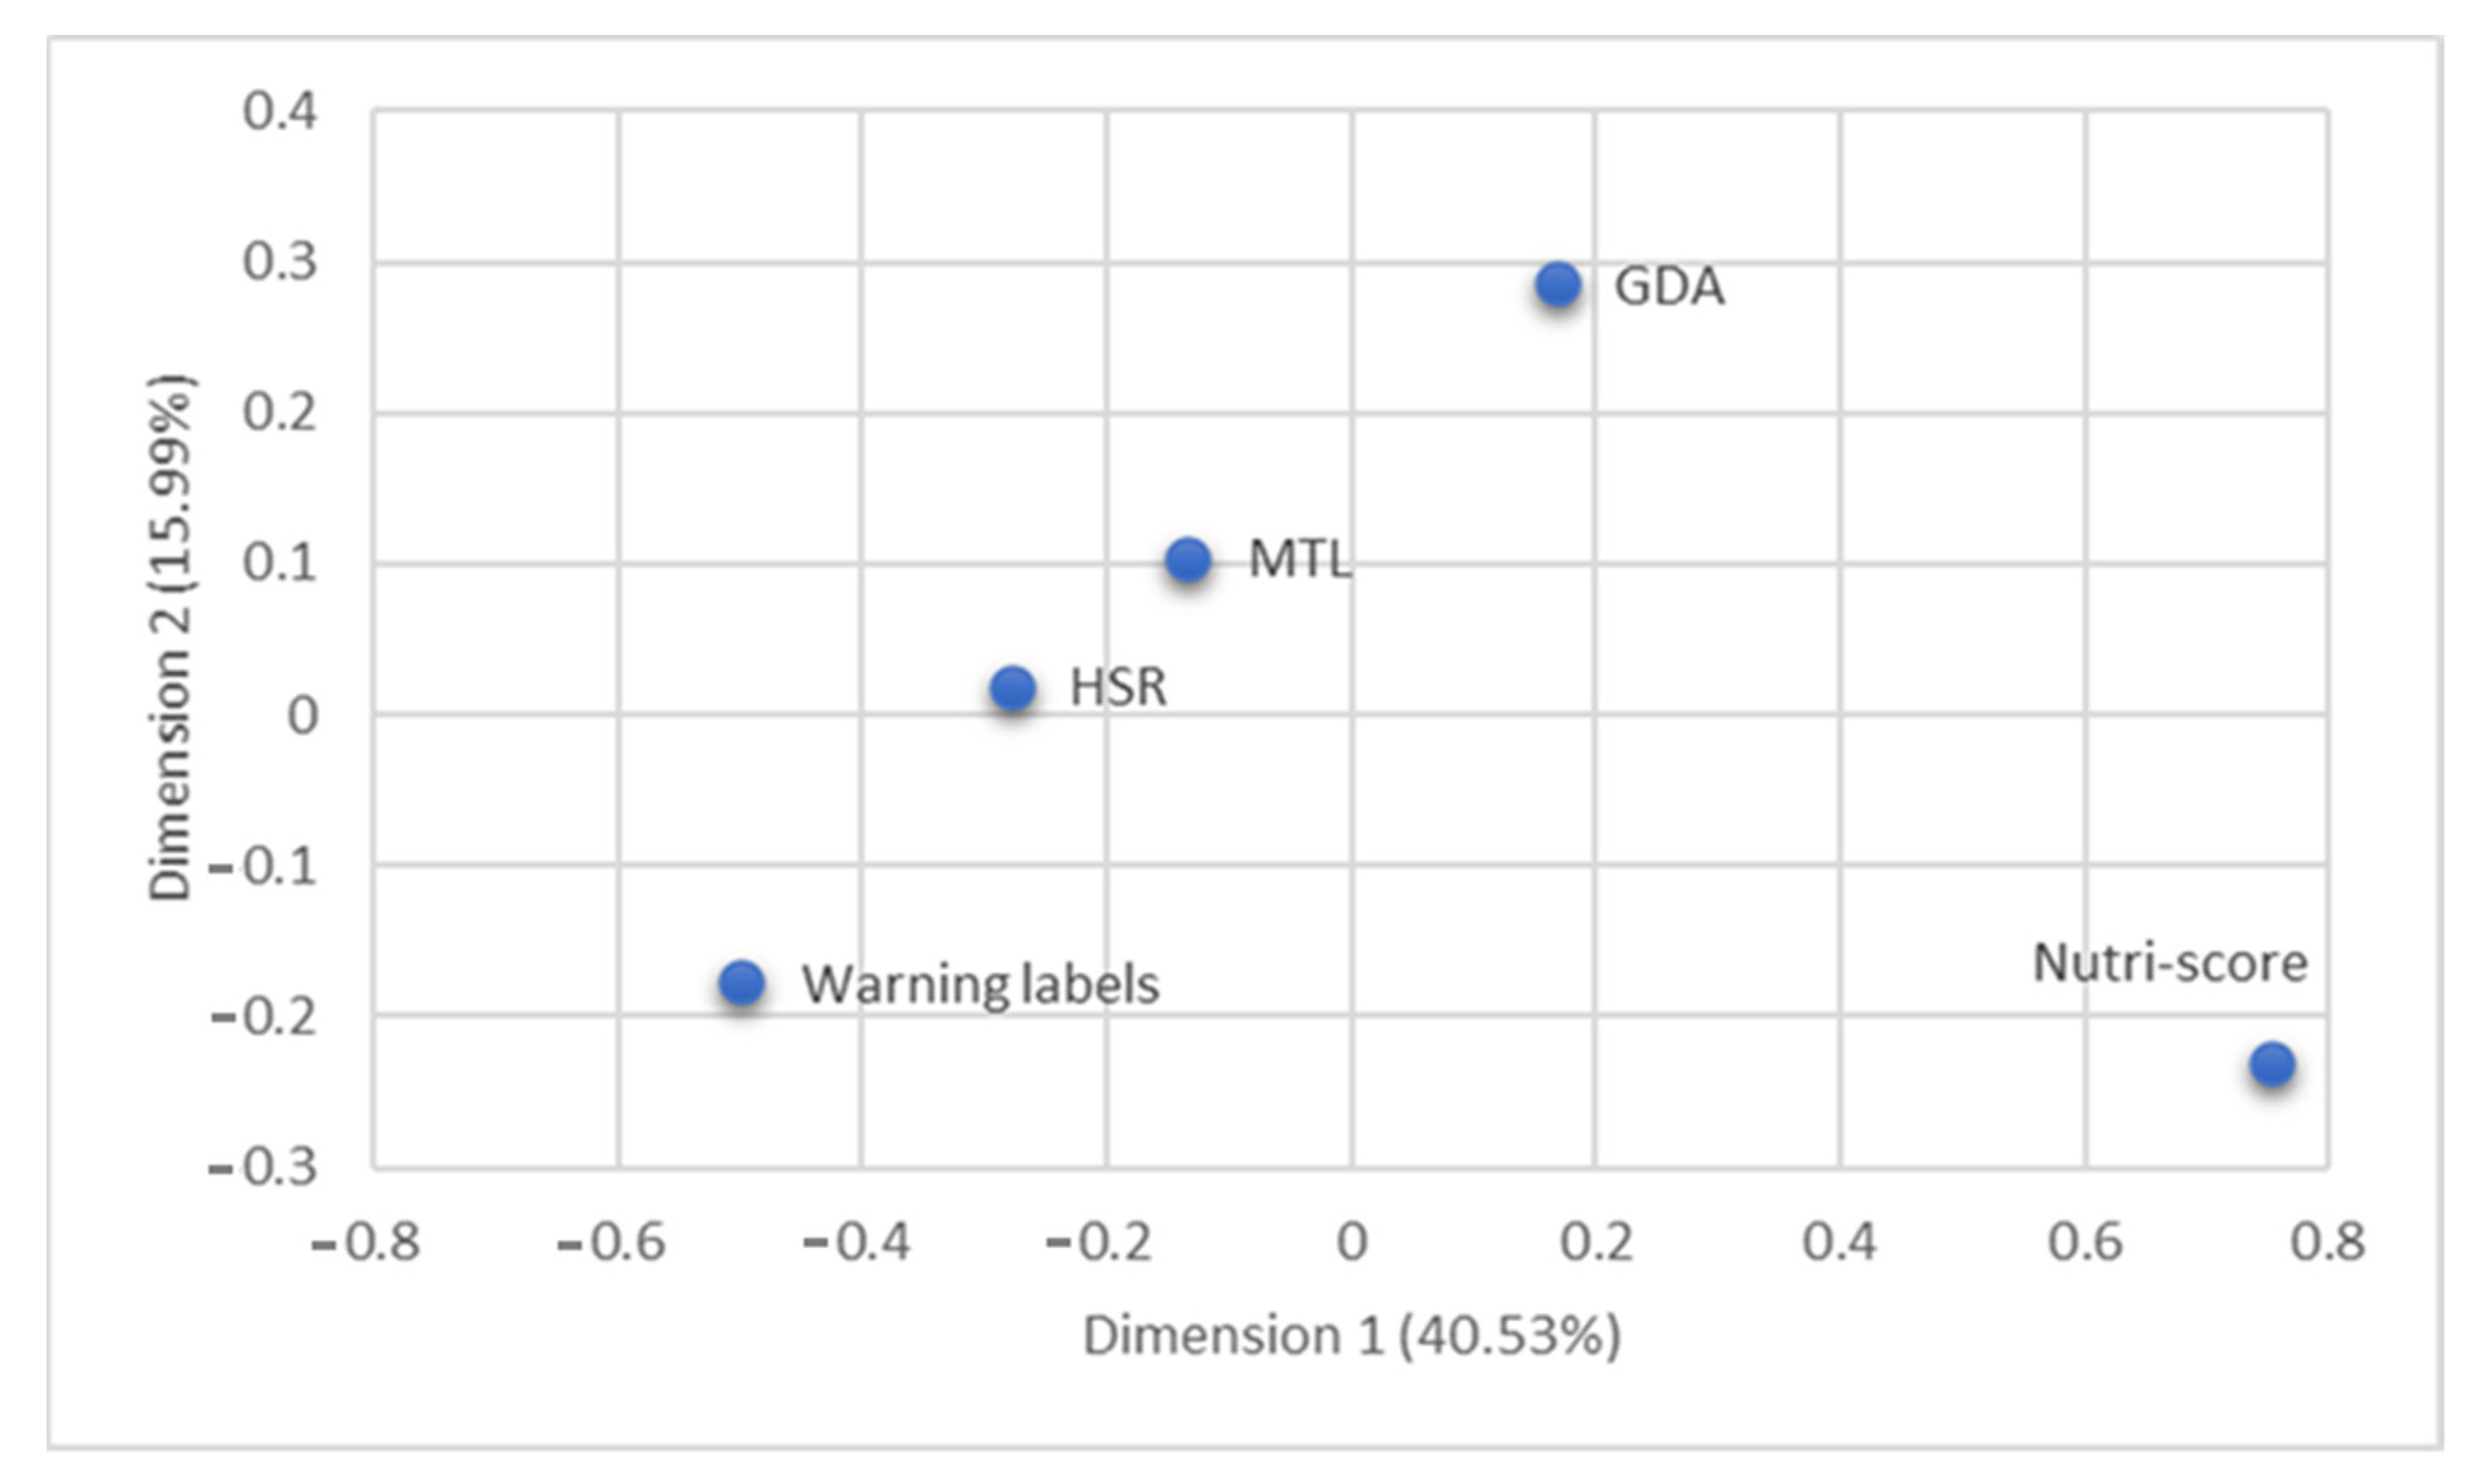
| Eigenvectors | ||
|---|---|---|
| Dimension 1 | Dimension 2 | |
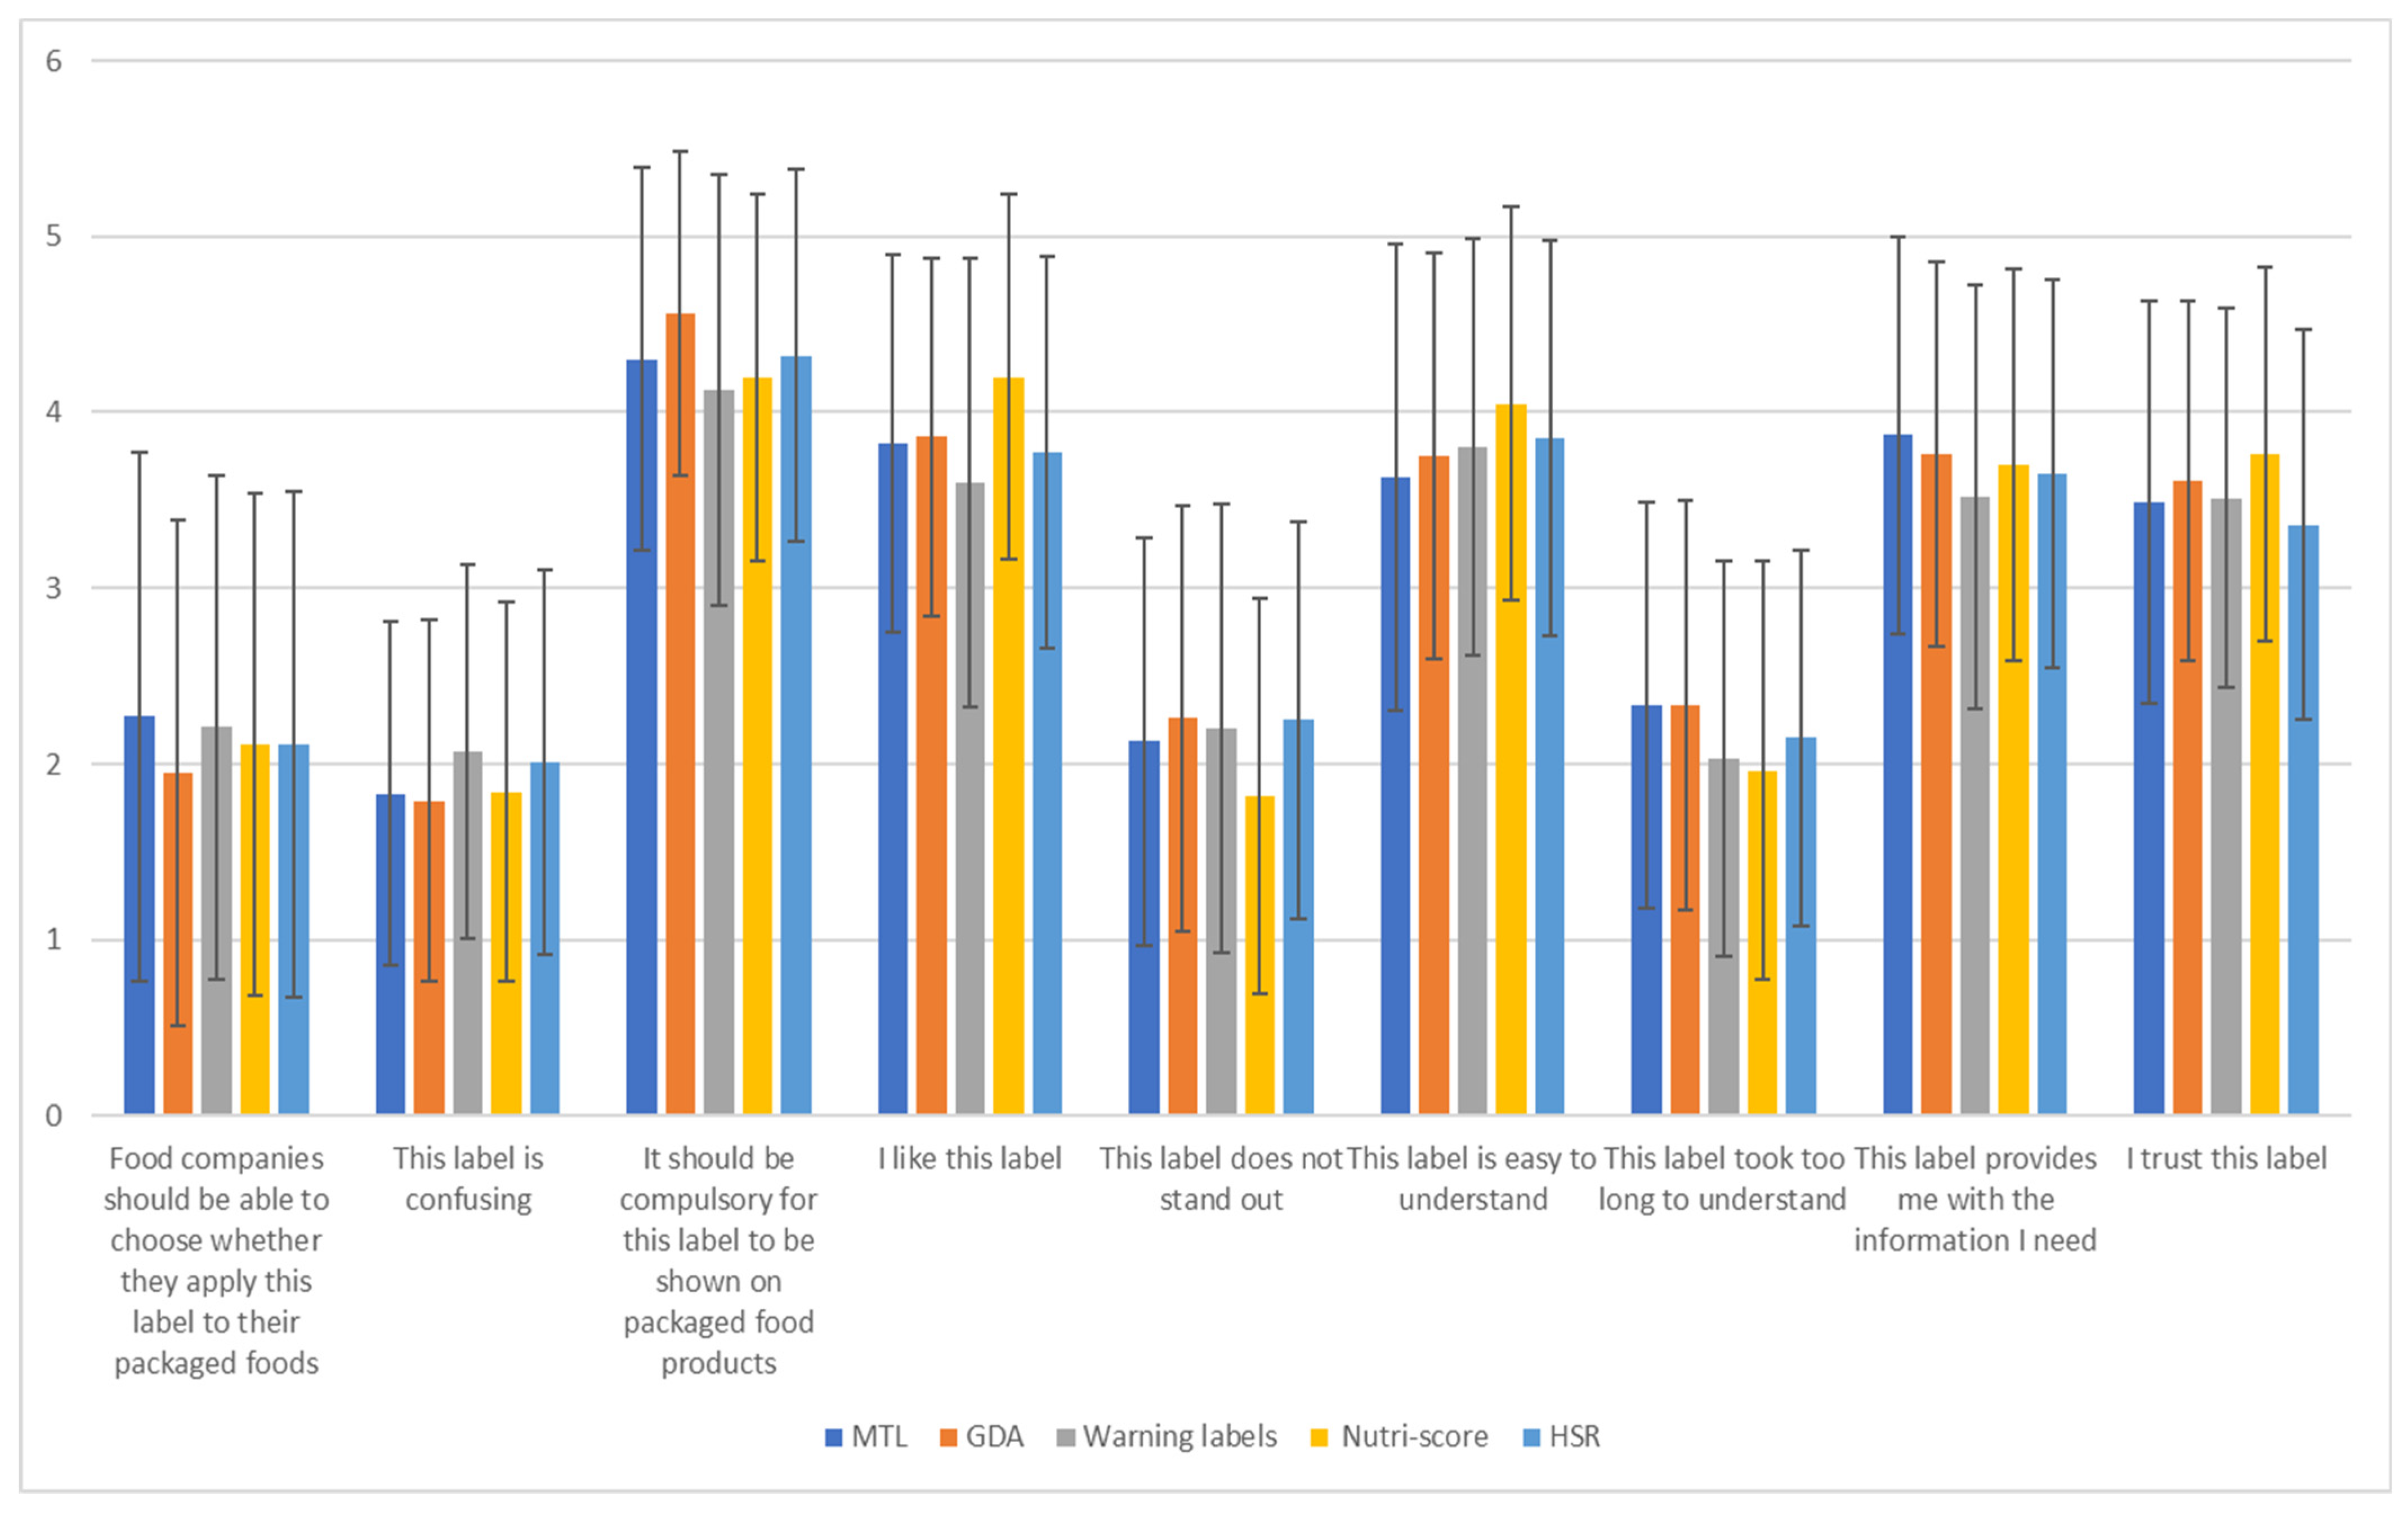
| Food companies should be able to choose whether they apply this label to their packaged foods | −0.366 | 0.021 |
| This label is confusing | −0.599 | 0.309 |
| It should be compulsory for this label to be shown on packaged food products | 0.594 | 0.480 |
| I like this label | 0.764 | 0.246 |
| This label does not stand out | −0.500 | 0.658 |
| This label is easy to understand | 0.783 | −0.053 |
| This label took too long to understand | −0.500 | 0.673 |
| This label provides me with the information I need | 0.743 | 0.298 |
| I trust this label | 0.744 | 0.275 |
Publisher’s Note: MDPI stays neutral with regard to jurisdictional claims in published maps and institutional affiliations. |
© 2021 by the authors. Licensee MDPI, Basel, Switzerland. This article is an open access article distributed under the terms and conditions of the Creative Commons Attribution (CC BY) license (https://creativecommons.org/licenses/by/4.0/).
Share and Cite
Kontopoulou, L.; Karpetas, G.; Fradelos, Ε.C.; Papathanasiou, I.V.; Malli, F.; Papagiannis, D.; Mantzaris, D.; Fialon, M.; Julia, C.; Gourgoulianis, K.I. Online Consumer Survey Comparing Different Front-of-Pack Labels in Greece. Nutrients 2022, 14, 46. https://doi.org/10.3390/nu14010046
Kontopoulou L, Karpetas G, Fradelos ΕC, Papathanasiou IV, Malli F, Papagiannis D, Mantzaris D, Fialon M, Julia C, Gourgoulianis KI. Online Consumer Survey Comparing Different Front-of-Pack Labels in Greece. Nutrients. 2022; 14(1):46. https://doi.org/10.3390/nu14010046
Chicago/Turabian StyleKontopoulou, Lamprini, George Karpetas, Εvangelos C. Fradelos, Ioanna V. Papathanasiou, Foteini Malli, Dimitrios Papagiannis, Dimitrios Mantzaris, Morgane Fialon, Chantal Julia, and Konstantinos I. Gourgoulianis. 2022. "Online Consumer Survey Comparing Different Front-of-Pack Labels in Greece" Nutrients 14, no. 1: 46. https://doi.org/10.3390/nu14010046