Article

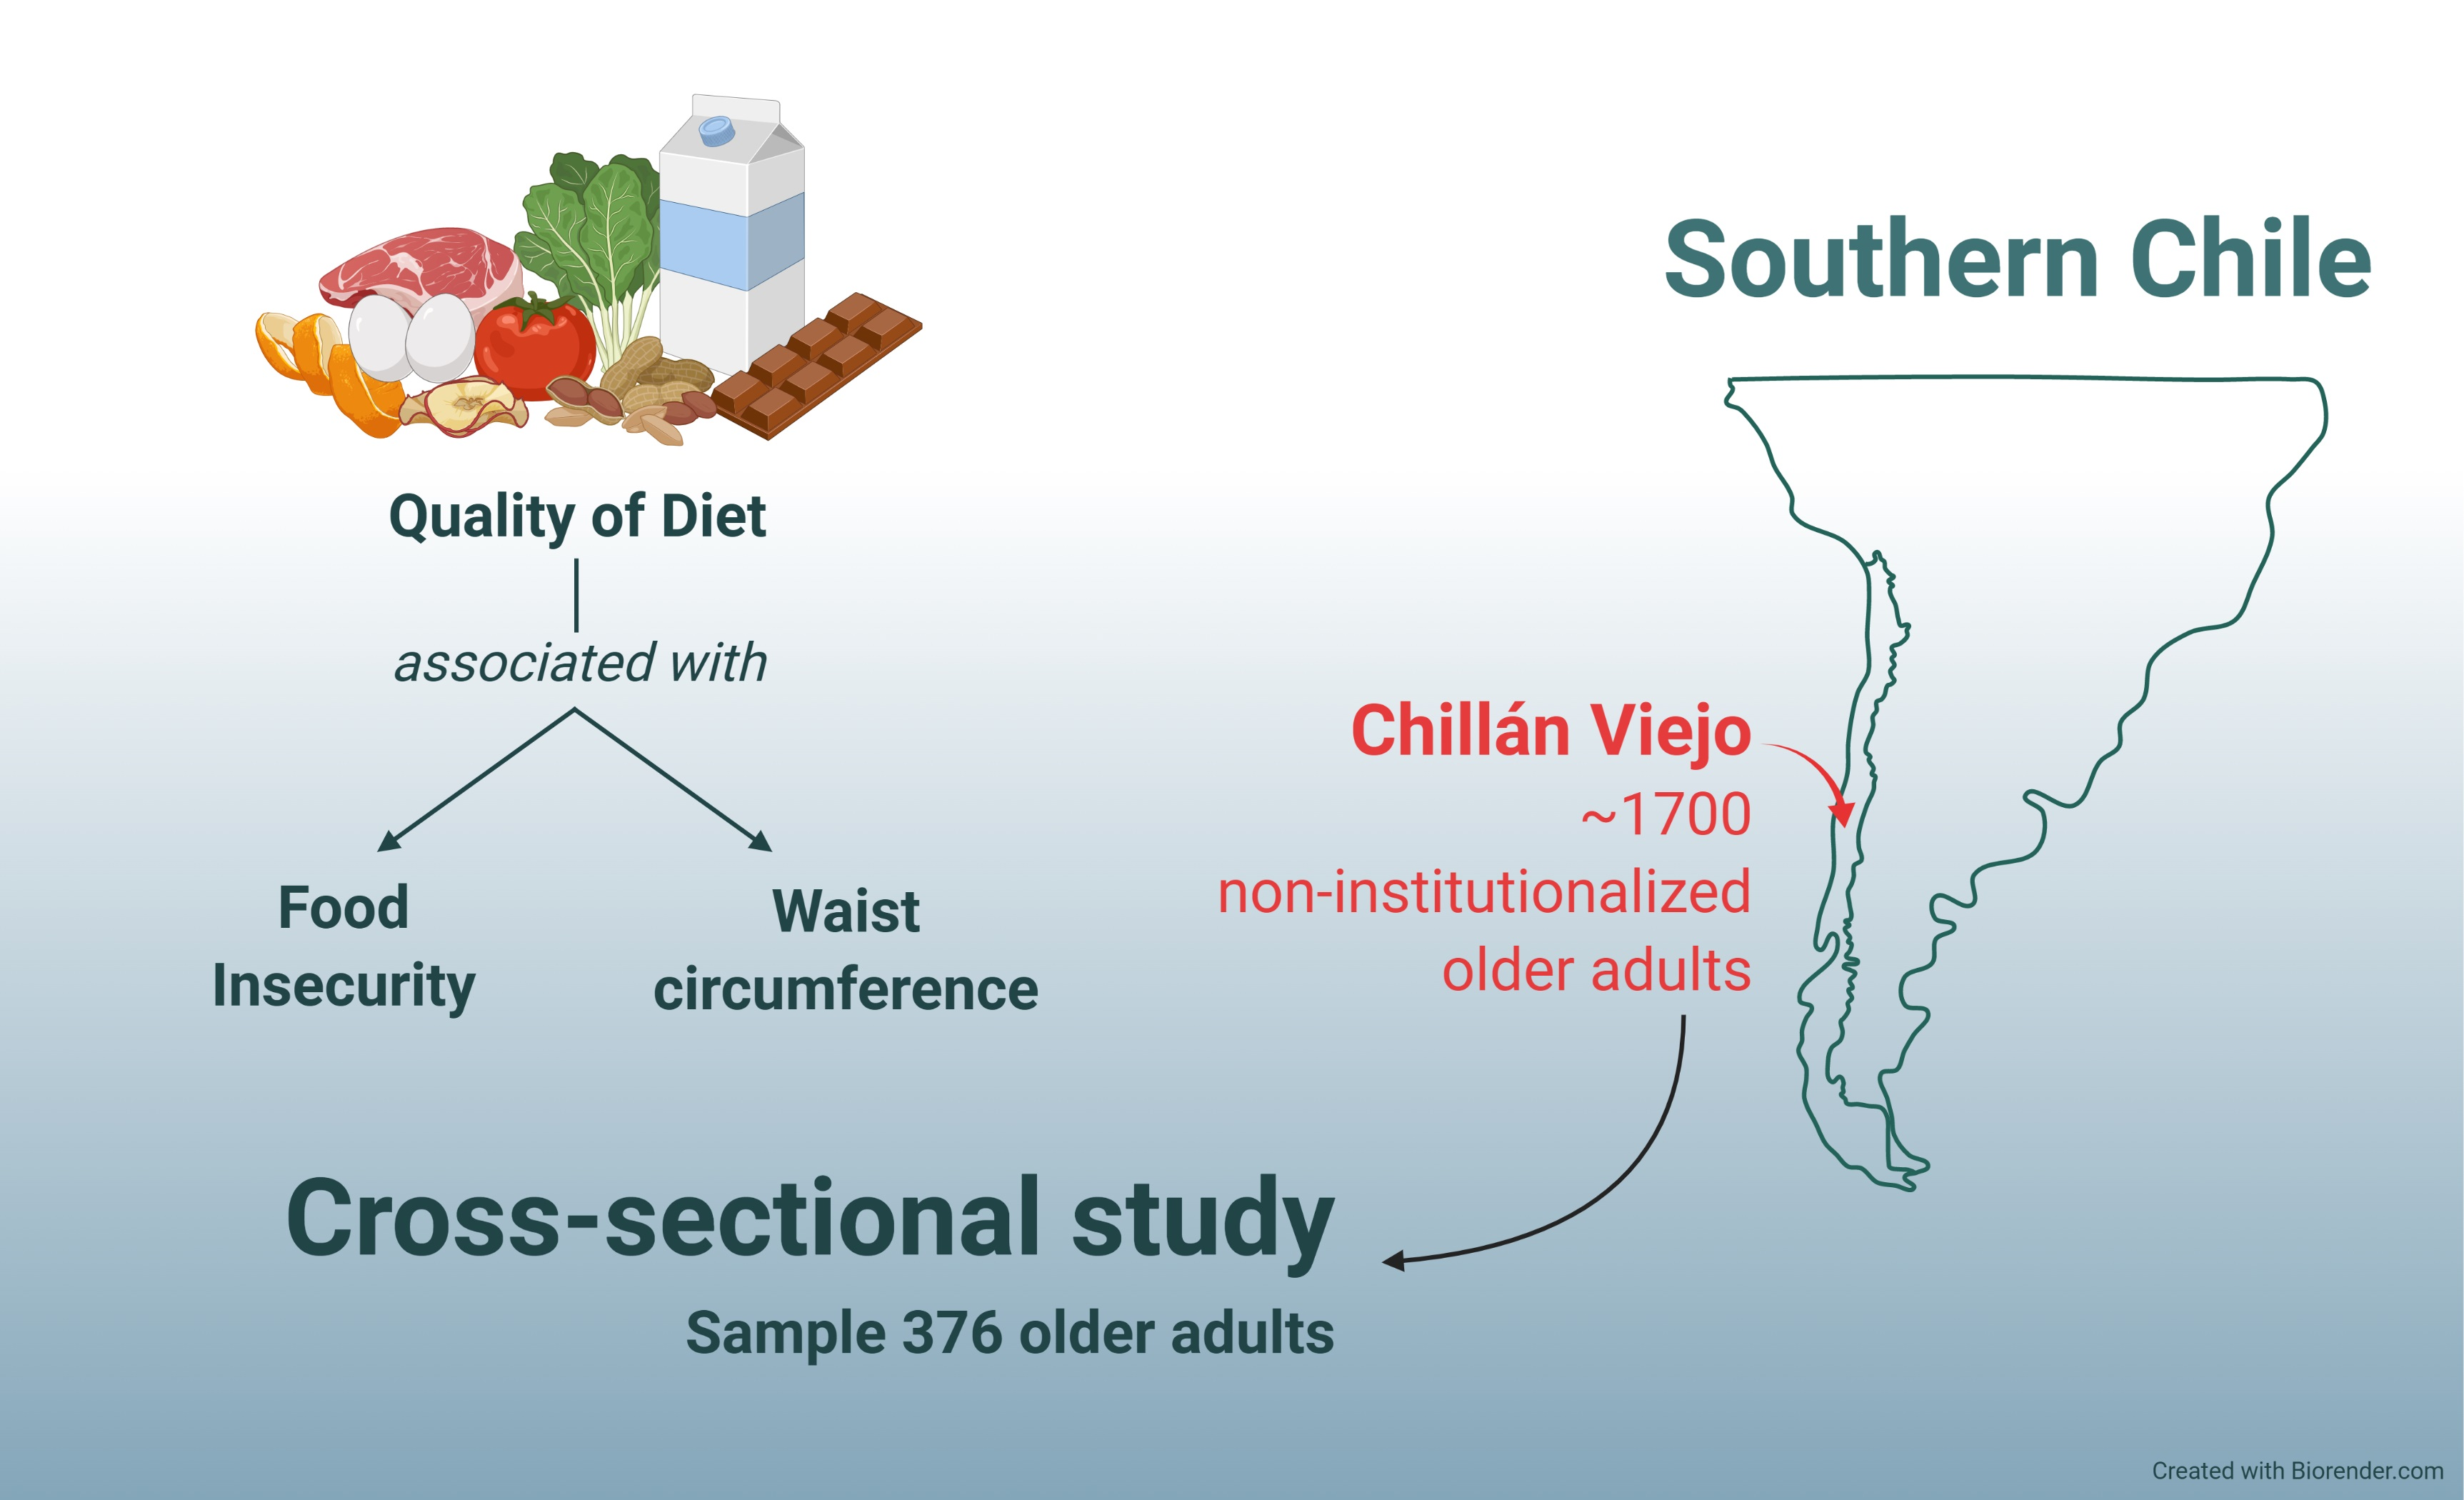
Food Insecurity Is Associated with the Quality of Diet of Non-Institutionalized Older Adults from a Southern Chilean Commune: A Cross-Sectional Study

by
Orietta Segura-Badilla
1,†,
Ashuin Kammar-García
2,3,†,
Addí Rhode Navarro-Cruz
4,
Jacqueline Araneda-Flores
5,
Javier Mancilla-Galindo
6,
Obdulia Vera-López
4,
Martin Lazcano-Hernández
4 and
Gladys Quezada-Figueroa
5,*
1
Programa UBB Saludable, Facultad de Ciencias de la Salud y de los Alimentos, Universidad del Bío-Bío, Chillan 3780000, Chile
2
Dirección de Investigación, Instituto Nacional de Geriatría, Mexico City 10200, Mexico
3
Sección de Estudios de Posgrado e Investigación, Escuela Superior de Medicina, Instituto Politécnico Nacional, Mexico City 11340, Mexico
4
Departamento de Bioquímica y Alimentos, Facultad de Ciencias Químicas, Benemérita Universidad Autónoma de Puebla, Puebla 72570, Mexico
5
Departamento de Nutrición y Salud Publica, Facultad de Ciencias de la Salud y de los Alimentos, Universidad del Bío-Bío, Chillan 3780000, Chile
6
Unidad de Investigación UNAM-INC, Instituto Nacional de Cardiología Ignacio Chávez, Mexico City 14080, Mexico
*
Author to whom correspondence should be addressed.
These authors contributed equally to this work.
Nutrients 2022, 14(1), 36; https://doi.org/10.3390/nu14010036
Submission received: 30 November 2021 / Revised: 21 December 2021 / Accepted: 21 December 2021 / Published: 23 December 2021
(This article belongs to the Special Issue Effect of Lifestyle and Diet for Older Persons' Health)

Abstract

:
As the population ages, greater attention to age-related health problems related to diet and lifestyles is needed. Here, we sought to evaluate the associations between demographic and clinical characteristics and food insecurity with the quality of diet of non-institutionalized elderly from a southern Chilean commune. We performed an analytical cross-sectional study in a sample of 376 older adults. Nutritional status was evaluated through anthropometric measurements. Quality of diet was determined by the healthy eating index (HEI), obtained through the frequency of consumption questionnaire. Socioeconomic, demographic, and lifestyle variables were also collected. Ordinal logistic and Poisson regression models were applied to study associations with quality of diet. The sample consisted of more women (81.6%) than men (18.4%). Most older adults were found to live in a situation of vulnerability or poverty (82.4%), with most having food security (65.7%). According to the HEI, only 14.1% had a good quality of diet, 83.8% had diet in need of improvement, and 2.1% had an unhealthy diet. There was an association of food insecurity and cardiovascular risk (according to waist circumference) with lower quality of diet categories. However, an association with the unhealthy quality of diet category was not confirmed with Poisson regression analysis, which was possibly due to the low number of subjects in that category (n = 8, 2.1%). Other modifiable factors like physical activity, hours of sleep, and polypharmacy were not associated with lower quality of diet categories. Socioeconomic status, which is a structural health determinant, was not associated with decreased quality of diet. Since this was a cross-sectional study performed on a small sample from a Chilean commune, directionality of associations cannot be discerned, and future longitudinal studies could aim to better characterize these associations in larger samples of elderly patients.

Graphical Abstract

1. Introduction

The increase in life expectancy has been one of the great achievements of humanity in this century. Life expectancy in Chile reached 80.04 years in 2018 [1]. However, an increase in lifespan is not necessarily accompanied by a better quality of life [2,3].
Old age is not a well-defined stage; the World Health Organization defines it as 60 years or more in developing countries, and as ≥65 years for developed countries, a classification that involves the economic and social situation of countries [4,5]. The elderly are characterized by having high rates of low income, decreased appetite, difficulty buying and preparing food [6], loneliness, dysphagia, and suboptimal nutritional states (8 out of 10 elderly have excess malnutrition) [7].
It can be stated that aging is a biological phenomenon that carries with it certain characteristic changes of advanced age [8]. Each stage of life has its own nutritional needs that respond to different biological, functional, cultural, and social characteristics. Therefore, with aging, it is necessary to adapt the diet to nutritional needs based on the specific situation of age, health status, and capacity [9,10]. Without doubt, the composition of diet influences the course of aging. This influence is clearly reflected by the role of nutrition in the development of age-related diseases like osteoporosis, type 2 diabetes, cardiovascular disease, and cancer [11,12,13].
Quality of diet and its relationship with health is a key challenge in nutritional epidemiology to detect nutritional problems. There are indicators or indices built from algorithms which are used to categorize how healthy the eating pattern is in the context of behaviors and eating habits of individuals [14]. The existing indices were developed based on dietary recommendations and guidelines for specific places or countries [15]. These indica can be based on nutrients, foods, or food groups, and can be combined into other indices. On this basis, there are 4 widely referenced and validated original indices: the Healthy Eating Index (HEI), the Diet Quality Index (DQI), the Healthy Diet Indicator (HDI) and the Mediterranean Diet Score (MDS) [16]. From these indicators, various adaptations are originated according to dietary and nutritional recommendations for each country. In Chile, there are few studies that assess the global quality of diet in older adults and the existing ones have adopted the methodology proposed by Kennedy [17], to assess the diet of schoolchildren and adults [18,19,20]. Therefore, the objective of this study was to evaluate the associations between demographic and clinical characteristics, and food insecurity with the quality of diet of non-institutionalized elderly from a southern Chilean commune.

2. Material and Methods

2.1. Study Design and Participants

This cross-sectional analytical study was carried out during the April–July, 2019 period in the Chilean commune of Chillán Viejo, where ~1700 non-institutionalized adults older than 60 years live. The sample size was calculated for the estimation of a proportion by considering the prevalence of food insecurity of 40.4% in older adults living in Chilean communes [21], with 95% significance and 5% precision, resulting in 369 participants. Adjustment for finite samples was used with the formula n a = n / [ 1 + ( n / N ) ] in which n is the sample size, and N the size of the population (N = 1700). This resulted in an adjusted sample size of 303 participants. A second adjustment for an estimated 20% exclusions after data collection was performed, resulting in a final sample size of 364 participants. The participants were part of the project “Food Insecurity and Quality of Diet of the elderly from a commune in southern Chile” and an open invitation for this study was made to them.
The inclusion criteria were men and women with an age >60 years, normal cognitive function according to the abbreviated Mini-Mental State Examination (MMSE) test (≥14 points), and those who provided their written informed consent to participate. Exclusion criteria were the presence of uncontrolled eating disorders and participants with incomplete information.
The study was approved by the Bioethics and Biosafety Committee of the Universidad del Bío-Bío (DIUBB 186620 2/I).

2.2. Data Collection and Measurements

All data were collected by a team composed of Nutritional Scientists and last-year students of the bachelor’s degree program in nutrition and dietetics, who received training on the standardization of anthropometric measurement collection and surveying; a Standardized Operating Procedures protocol was built for this. A survey was created for the purpose of this study, including 4 sections: (1) personal and sociodemographic data, (2) food insecurity [22,23], (3) nutritional status (anthropometric measurements), and (4) food consumption frequency questionnaire [24]. These four individual sections are described in subheadings bellow. The survey consisted of a total of 50 items within 7 sections (full questionnaire available in the Supplementary Materials).
The survey was validated by 10 experts in nutrition and public health in a pilot test, which consisted of the invitation of 30 persons older than 60 years from the commune, who were subsequently ineligible to be included in the sample of the main study and thus were not included for analyses, who provided their written informed consent to participate in the pilot study to validate the survey. The procedures of the validation involved linguistic and cultural adaptations and viability, by assessing the time employed in the application of the survey, easiness of the format, and the brevity and clarity of the questions. Items were adapted to include language understandable by the elderly, as well as to improve both the way of delivering questions by interviewers and the registration and codification of responses.
The survey was individually applied by previously trained personnel. All the questions were read to participants in the presence of a family member, when available.

2.2.1. Personal and Sociodemographic Data

Personal and sociodemographic data collected were age, sex, number of persons with whom living place is shared, household income, socioeconomic status, medications consumed, hours of sleep, and physical activity. Socioeconomic level was calculated from combinations between education and occupation of the main income provider within household, number of household members, and total income per average month. The classification of the Association of Market Researchers (AIM in Spanish) [25] was used, where: Upper Class (AB) has a median household income of $4386 USD; Wealthy Middle Class (C1a), $2070 USD; Emerging Middle Class (C1b), $1374 USD; Typical Middle Class (C2), $810 USD; Lower Middle Class (C3), $503 USD; Vulnerable Class (D), $307 USD; and Poor Class (E), $158 USD [25].

2.2.2. Sleep and Physical Activity

Recommendations for the duration of nocturnal sleep in the elderly from the National Sleep Foundation were used [26] to classify participants into three categories: below recommended (<5 h), recommended (5–7 h), and above recommended (>8 h). Physical activity was considered as the performance of any type of scheduled activity—such as walking, dancing, jogging, yoga, or others—performed outdoors for more than 30 min, more than 3 times a week [27]. Participants reporting full, occasional, or null compliance with this recommendation were classified as “physically active”, “irregularly active”, or “sedentary”, respectively.

2.2.3. Food Insecurity Assessment

Food insecurity refers to the limited/uncertain availability of nutritionally adequate and innocuous foods or the limited/uncertain ability to obtain them through socially acceptable means [22]. Food insecurity was assessed with the Household Food Insecurity Access Scale (HFIAS) [23], which includes nine questions about household food security in the last four weeks. These items assess worry related to obtention of foods, inability to consume desired foods, substitution for undesired foods, and limited variation of foods, among others. Responses to these items were used to classify respondents into four categories: food security (few or no worries about insufficient food at home), mild food insecurity (concerns about not having enough food, which influences the types of foods consumed), moderate food insecurity (in addition to the prior, they were forced to consume unwanted food), and severe food insecurity (feeling hungry but not eating, or not eating for an entire day, due to lack of money or other resources) [23]. A second variable was created by dichotomizing food insecurity (the categories of mild, moderate, and severe food insecurity were merged) and food security.

2.2.4. Nutritional Status by Anthropometry

Nutritional status was assessed by measuring weight, height, and waist circumference, using standardized anthropometric techniques. The weight in kg was obtained with a floor scale (SECA mod 714, Hamburg, Germany) with a precision of 100 g. For the determination of height in meters (m), a stadiometer (SECA mod 210, Hamburg, Germany) with a precision of 0.1 mm was used. Waist circumference (WC) was measured with a tape measure (SECA mod 201, Hamburg, Germany) placed above the upper border of iliac crests (approximately at the level of the navel). WC measurements were recorded in centimeters and classified as: female cardiovascular risk ≥ 88 cm; male cardiovascular risk ≥ 102 cm, which are the values considered in the ATPIII-NCEP 2001 definition of Metabolic Syndrome. The body mass index (BMI) was calculated from weight and height (kg/m2) and the following categories recommended for the elderly: underweight (<22.0 kg/m2), normal weight (22.0–26.9 kg/m2), overweight (27.0–29.9 kg/m2), and obesity (≥30 kg/m2) [28].

2.3. Food Consumption

Data were collected using the food consumption frequency questionnaire [24], since this questionnaire is used as part of the healthy eating index evaluation (see the following subheading). The food groups were: (1) cereals and derivatives, (2) vegetables, (3) fruit, (4) milk and dairy products, (5) fats and oils, (6) meat and fish, (7) legumes and nuts, (8) sausages and cold cuts, (9) sweets and pastry products, and (10) others (sugary drinks, snacks and fast food). For each of the reported food groups, the frequency of consumption was evaluated and categorized as: daily (≥1 time/day), weekly (≥4 times/day), occasional (≥3 times/month), and never or almost never (≤1 time/month). The amount of food consumption was classified according to the number of portions consumed from each food group into the following 3 categories: 1–3 portions, 3–5 portions, and >5 portions. Portions were calculated according to equivalences shown in Supplementary Table S1 [24,29].

2.4. Quality of Diet

To determine the quality of diet, the Healthy Eating Index (HEI) was used [30]. We adapted the questionnaire validated for the Spanish population according to food groups known by the Chilean people, and subsequently validated it in a pilot test, as previously described [31]. Using the frequencies of food consumption, the first 5 food groups were considered for daily consumption; groups 6 and 7 were considered for weekly consumption; and groups 8–10 were considered for occasional consumption. Each of these frequencies was assigned a score between 0 and 10, according to criteria shown in Supplementary Table S2. HEI was calculated by adding the score obtained for all variables, which allows a theoretical maximum of 100 points, where 80–100 points corresponds to healthy eating; 50–80 points corresponds to diet in need of improvement; and HEI < 50 points corresponds to unhealthy eating.

2.5. Statistical Analysis

The quantitative descriptive data are presented as means with standard deviation, and qualitative descriptive data are presented as frequency and percentage. For comparisons between HEI groups and quantitative variables, a one-way analysis of variance (ANOVA) was applied. For the variables that did not meet the assumption of homoscedasticity, Welch’s ANOVA was applied. For comparisons of qualitative variables, the chi-square analysis of linear trend was used.
Two regression models were applied to determine the degree of association of different anthropometric, demographic, or food consumption variables with quality of diet. The variables introduced into the model were sex, age (numerical scale), BMI (numerical scale), waist circumference (numerical scale), cardiovascular risk, Food Safety Scale (numerical scale), vulnerable or poor socioeconomic status, obesity (BMI ≥ 30), food insecurity, drugs, hours of sleep, and physical activity. The first regression model consisted of an ordinal logistic regression analysis considering the worst quality of diet category according to HEI as the greater ordinal category. The results of this model are presented as the regression coefficient (β), standard error, and 95% confidence interval (95% CI). The second was a Poisson regression model considering a HEI score < 50 as the outcome which corresponds to unhealthy eating. The results of this model are presented as prevalence ratios (PR) and 95% confidence intervals (95% CI). The variables were introduced by the enter method for both models. The statistical assumptions of each model were verified by residual analysis.
All analyses were performed in SPSS v.21 software. A value of p < 0.05 was considered a statistically significant difference.

3. Results

Out of 402 participants who responded to the invitation and were assessed for eligibility, 376 subjects were included for analysis, with a mean age of 73.5 (SD: 6.9) years. The descriptive data of the sample are shown in Table 1. Most of the subjects were women (81.6%, n = 307). Regarding socioeconomic level, 82.4% (n = 310) of the subjects were in a category of vulnerability (D) or poverty (E). Despite this, most subjects had food security (65.7%, n = 247), whereas 33.2% (n = 125) had some level of food insecurity. Only 14.1% (n = 53) of subjects had a good quality of diet, being classified as healthy eating according to the HEI, while 85.9% (n = 323) had unhealthy eating or the need to be improved. Most of the subjects had healthy habits such as more than 5 h of sleep (89.1%, n = 325), or being physically active (55.9%, n = 210). Despite this, 77.8 (n = 292) of participants were overweight or obese. Most of the subjects had polypharmacy, with an intake of more than 3 drugs per day (68.3%, n = 257). To determine possible differences in sociodemographic and personal characteristics, these were compared with the HEI classification groups, as shown in Table 2.
Table 3 and Table 4 show the comparisons of the food frequencies and food portions consumed among the different HEI groups. Cereals, vegetables, fruits, and fats were consumed more frequently by those with a healthy diet. Consumption of fats was infrequent in those with an unhealthy diet. Dairy foods were the most frequent source of protein on a daily basis, while meats and legumes had a weekly consumption pattern.
The results from ordinal logistic regression analyses showed that food insecurity and cardiovascular risk were the variables most strongly associated with a low quality of diet (Table 5). The results of the Poisson regression analyses suggest that none of the sociodemographic or anthropometric factors influenced the quality of diet in the elderly (Table 6).

4. Discussion

In this study, we sought to evaluate the associations between demographic and clinical characteristics and food insecurity with the quality of diet of non-institutionalized elderly from a southern Chilean commune. We found that most participants had a poor quality of diet, either with need of improvement (83.8%) or unhealthy eating (2.1%). Food insecurity and cardiovascular risk according to weight circumference were associated with worsening dietary habits in the ordinal logistic regression analysis. None of the variables showed association directly with the unhealthy diet category in the Poisson regression model; the absence of significance with an unhealthy diet could have been due to the low number of subjects in that category (n = 8, 2.1%), which suggests that the deterioration of quality of diet was not severe enough to classify subjects with an unhealthy diet, but instead with the need for improvement; this is one reason why it could be feasible to perform interventions to improve the quality of diet.
The main importance of these findings is that structural health determinants which are difficult to change through simple interventions like socioeconomic status known to affect quality of diet in younger adults [32] were not associated with quality of diet in our sample of elderly participants. Conversely, food insecurity can be readily addressed through nutritional interventions in diverse populations [33,34], which is one reason why our findings show that it could be worth evaluating the benefits of performing a nutritional community intervention to improve food insecurity, to study if doing so could improve quality of diet in the elderly.
In our sample, 82.4% of participants were found in a category of vulnerability or poverty. Despite this, more than half (65.7%) had food security. Due to the high proportion of participants with low socioeconomic status and suboptimal quality of diet, it could have been expected that these variables would have explained each other. However, after logistic regression analyses, food insecurity was associated with a diet in need of improvement or of poor quality, but not socioeconomic status. Nonetheless, poverty has been long considered an underlying cause of food insecurity, especially under circumstances of extreme poverty and malnutrition [35]. The population with the lowest socioeconomic status consumes significantly lower amounts of fruits, vegetables, and dairy foods that those in higher socioeconomic levels [36]. Since our sample of older adults was not characterized by extreme poverty, this could explain why there was not a strong association between lower socioeconomic status and quality of diet, whereas food insecurity did have an association with a lower quality of diet.
There are few studies evaluating HEI in samples composed solely of older people, which have shown a high prevalence of an unhealthy quality of diet or in need of improvement according to HEI scores [37]. In Mexican institutionalized older adults, a mean HEI score of 73 was reported [38], whereas in the US, the 2015 WWEIA/NHANES study showed that people over 65 years had an average HEI score of 64 [39]. In Spain, the mean HEI score was 77.2, and 89.6% of participants older than 65 years had a diet in need of improvement [7,38], which was comparable to our findings of a mean HEI = 79.1, and a higher proportion of older adults was found with a quality of diet in need of improvement (83.8%).
A high prevalence of food insecurity was only observed in the group of subjects with an HEI classification of diet in need of improvement (p = 0.02). As discussed earlier, food insecurity was associated with a trend towards lower quality of diet categories. It has been proposed also that people in food insecurity compensate for the lack of quality and variety with the palatability that they find in foods with low nutrient content but high in energy density [40,41]. The ELAN study (Latin American study of nutrition and health) demonstrated a large contribution of refined carbohydrates, foods and beverages rich in fats and sugars, and a limited intake of complex carbohydrates and fruits and vegetables in all ELAN countries [37].
The consumption of foods considered healthy such as vegetables, fruits and dairy products occurred on a daily basis in the group of subjects classified with a healthy diet. Despite this, this same group showed a higher proportion of daily fat intake. No daily consumption of meats, sausages or sweets was found.
Our sampling strategy resulted in a greater participation of women (81.6%) than men (18.4%), possibly reflecting the feminization that has been taking place in different countries; in Chile, the number of elderly women almost doubles that of the male population of the same age [42], which could be due to the greater longevity of women [43]. Also, women are usually more willing than men to participate in this kind of study [44].
The mean BMI of participants was 31 kg/m2, with only 25.8% of the population in a normal nutritional state. A total of 31.1% were overweight, 40.4% had obesity and 2.6% had low weight. These results are consistent with those obtained with other studies carried out in older people in Latin America [45,46,47,48,49]. The redistribution of subcutaneous fat with accumulation in the abdominal region, alongside the decrease in height renders the BMI an imprecise estimator of nutritional status in the elderly [50]. This situation is reflected in the waist circumference in our sample of patients, where 76.3% met the cardiovascular risk cutoff (79.1% of women and 44.9% of men). Even when waist circumference was not associated with quality of diet, cardiovascular risk determined by WC was associated with waist circumference in the logistic regression model, which is in line with findings by Tourlouki et al. [51]. In the Poisson regression model, cardiovascular risk was not associated with quality of diet.
Regarding other clinical characteristics, less than half of the sample reported meeting the recommended hours of sleep, while most were not physically active. Polypharmacy (consumption > 5 drugs) was reported in 30.3%. None of these variables were associated with the quality of diet in our sample.
The strengths of our study include the evaluation of multiple components that are known to affect quality of diet in diverse populations, through the application of surveys which have been validated in Hispanic populations. Furthermore, there was a good response rate to this survey from inhabitants of the commune. Lastly, our study shows that structural health determinants like socioeconomic status may not fully explain decreased quality of diet in the elderly. Although this would need to be confirmed in future studies, it signals that it may be feasible to improve quality of diet in the elderly by tackling modifiable factors like food insecurity through community-level interventions.
The limitations of our study include that we collected self-reported data which may convey subjective recall bias. Furthermore, these associations were derived form a cross-sectional study design, which is one reason why more robust longitudinal studies could aim to characterize the directionality of these associations. Also, most participants reported a quality of diet in need of improvement, with few having an unhealthy diet HEI score, which limited our ability to fully characterize associations towards the unhealthy diet category. Another limitation is that we used the food consumption frequency questionnaire instead of other methods that are used to obtain further information, like the estimation of nutrient intake (i.e., 24-h dietary recall). Furthermore, we did not collect working status in our survey, which could be an important determinant of socioeconomic status in the elderly, especially since only 20.3% of people older than 65 years are active workers in Chile [52]. Lastly, our study may have limited generalizability to men, since most participants included in the survey were women.

5. Conclusions

In this sample of older adults from a southern Chilean commune, suboptimal quality of diet was frequent (85.9%), with most participants having a diet in need of improvement. Food insecurity and cardiovascular risk (determined according to waist circumference measurement) were associated with lower quality of diet categories (unhealthy diet and diet in need of improvement). Nonetheless, a direct association of these variables with the category of unhealthy diet was not confirmed with Poisson regression analyses, which could be explained by the low number of subjects in this category (n = 8, 2.1%). Other modifiable factors like physical activity, hours of sleep, and polypharmacy were not associated with lower quality of diet categories. Socioeconomic status, which is a structural health determinant, was not associated with decreased quality of diet. This suggest that structural health determinants are possibly not the strongest determinants of quality of diet in the elderly. Studies in the future could seek to better characterize these associations through longitudinal study designs. In the future, evidence from such studies could allow to design interventions aiming to reduce food insecurity, which could possibly serve to improve the quality of diet in older adults.

Supplementary Materials

The following supporting information can be downloaded at: https://www.mdpi.com/article/10.3390/nu14010036/s1, Table S1: Equivalences of portions (grams) and homemade measures; Table S2: Score by food group of the Healthy Eating Index.

Author Contributions

O.S.-B. and A.K.-G. contributed equally to this work; conceptualization, A.R.N.-C., G.Q.-F., J.A.-F., O.V.-L.; data curation, A.K.-G. and J.A.-F.; formal analysis, A.K.-G. and J.M.-G.; funding acquisition, G.Q.-F.; investigation, J.A.-F.; methodology, O.V.-L.; project administration, J.A.-F.; resources, M.L.-H.; software, M.L.-H.; supervision, O.S.-B.; validation, O.S.-B.; visualization, O.S.-B.; writing—original draft, A.R.N.-C., A.K.-G. and G.Q.-F.; writing—review and editing, A.K.-G. and J.M.-G. All authors have read and agreed to the published version of the manuscript.

Funding

This research was funded by the Universidad del Bío Bío, in its regular project DIUBB 186620 2/I.

Institutional Review Board Statement

This study was conducted in accordance with the Declaration of Helsinki. All procedures were approved by the Bioethics and Safety Committee of Universidad del Bío Bío, with the approval number DIUBB 186620 2/I. All participants provided their written informed consent to participate in this study.

Informed Consent Statement

Informed consent was obtained from all subjects involved in the study.

Data Availability Statement

The data presented in this study are available on request from the corresponding author.

Conflicts of Interest

The authors declare no conflict of interest.

References

  1. Albala, C. El envejecimiento de la población chilena y los desafíos para la salud y el bienestar de las personas mayores. Rev. Méd. Clín. Condes 2020, 31, 7–12. [Google Scholar] [CrossRef]
  2. Netuveli, G.; Blane, D. Quality of life in older ages. Br. Med. Bull. 2008, 85, 113–126. [Google Scholar] [CrossRef] [Green Version]
  3. Brown, G.C. Living too long. EMBO Rep. 2015, 16, 137–141. [Google Scholar] [CrossRef] [Green Version]
  4. Orimo, H.; Ito, H.; Suzuki, T.; Araki, A.; Hosoi, T.; Sawabe, M. Reviewing the definition of “elderly”. Geriatr. Gerontol. Int. 2006, 6, 149–158. [Google Scholar] [CrossRef]
  5. De Freitas, M.C.; Queiroz, T.A.; de Sousa, J.A.V. O significado da velhice e da experiência de envelhecer para os idosos. Rev. Esc. Enferm. USP 2010, 44, 407–412. [Google Scholar] [CrossRef] [Green Version]
  6. Restrepo, S.L.M.; Morales, R.M.G.; Ramírez, M.C.G.; López, M.V.L.; Varela, L.E.L. Los hábitos alimentarios en el adulto mayor y su relación con los procesos protectores y deteriorantes en saud. Rev. Chil. Nutr. 2006, 33, 500–510. [Google Scholar] [CrossRef]
  7. Martínez Valero, A.P.; Amo-Saus, E.; Pardo-García, I.; Escribano-Sotos, F. Calidad de la dieta en mayores de 65 años y factores socioeconómicos relacionados. Atención Primaria 2021, 53, 27–35. [Google Scholar] [CrossRef] [PubMed]
  8. Carmona, J.J.; Michan, S. Biology of Healthy Aging and Longevity. Rev. Investig. Clin. 2016, 68, 7–16. [Google Scholar]
  9. Krondl, M.; Coleman, P.; Lau, D. Helping Older Adults Meet Nutritional Challenges. J. Nutr. Elder. 2008, 27, 205–220. [Google Scholar] [CrossRef]
  10. Shlisky, J.; Bloom, D.E.; Beaudreault, A.R.; Tucker, K.L.; Keller, H.H.; Freund-Levi, Y.; Fielding, R.A.; Cheng, F.W.; Jensen, G.L.; Wu, D.; et al. Nutritional Considerations for Healthy Aging and Reduction in Age-Related Chronic Disease. Adv. Nutr. 2017, 8, 17–26. [Google Scholar] [CrossRef] [PubMed] [Green Version]
  11. Everitt, A.V.; Hilmer, S.N.; Brand-Miller, J.C.; Jamieson, H.A.; Truswell, A.S.; Sharma, A.P.; Mason, R.S.; Morris, B.J.; Le Couteur, D.G. Dietary approaches that delay age-related diseases. Clin. Interv. Aging 2006, 1, 11–31. [Google Scholar] [CrossRef] [PubMed]
  12. Gille, D. Overview of the physiological changes and optimal diet in the golden age generation over 50. Eur. Rev. Aging Phys. Act. 2010, 7, 27–36. [Google Scholar] [CrossRef] [Green Version]
  13. Jaul, E.; Barron, J. Age-Related Diseases and Clinical and Public Health Implications for the 85 Years Old and Over Population. Front. Public Health 2017, 5, 335. [Google Scholar] [CrossRef] [PubMed] [Green Version]
  14. Mackerras, D.E.M. Diet Quality Indexes and Health. Nutr. Today 2020, 55, 62–74. [Google Scholar] [CrossRef]
  15. Guerrero, M.L.P.; Pérez-Rodríguez, F. Diet Quality Indices for Nutrition Assessment: Types and Applications. In Functional Food—Improve Health through Adequate Food; InTech: London, UK, 2017. [Google Scholar]
  16. Gil, Á.; Martinez de Victoria, E.; Olza, J. Indicators for the evaluation of diet quality. Nutr. Hosp. 2015, 31 (Suppl. 3), 128–144. [Google Scholar] [CrossRef]
  17. Kennedy, E.T.; Ohls, J.; Carlson, S.; Fleming, K. The Healthy Eating Index. J. Am. Diet. Assoc. 1995, 95, 1103–1108. [Google Scholar] [CrossRef]
  18. Pinheiro, A.C.F.; Atalah, E.S. Propuesta de una metodología de análisis de la calidad global de la alimentación. Rev. Med. Chil. 2005, 133, 175–182. [Google Scholar] [CrossRef] [Green Version]
  19. Pinto, V.; Landaeta-Díaz, L.; Castillo, O.; Villarroel, L.; Rigotti, A.; Echeverría, G. Assessment of Diet Quality in Chilean Urban Population through the Alternate Healthy Eating Index 2010: A Cross-Sectional Study. Nutrients 2019, 11, 891. [Google Scholar] [CrossRef] [Green Version]
  20. Pereyra, I.G.; Erazo, M.B. Evaluación de la alimentación en mujeres atendidas por el Sistema de Salud Público chileno. Arch. Latinoam. Nutr. 2011, 61, 254–261. [Google Scholar]
  21. Vargas Puello, V.; Alvarado Orellana, S.; Atalah Samur, E. Inseguridad alimentaria en adultos mayores en 15 comunas del gran Santiago; Un tema pendiente. Nutr. Hosp. 2013, 28, 1430–1437. [Google Scholar] [CrossRef] [PubMed]
  22. Castell, G.S.; Rodrigo, C.P.; de la Cruz, J.N.; Bartrina, J.A. Household Food Insecurity Access Scale (HFIAS). Nutr. Hosp. 2015, 31, 272–278. [Google Scholar] [CrossRef]
  23. Coates, J.; Swindale, A.; Blinsky, P. Escala del Componente de Acceso de la Inseguridad Alimentaria en el Hogar (HFIAS) para la Medición del Acceso a los Alimentos en el Hogar: Guía de Indicadores; Proyecto de Asistencia Técnica sobre Alimentos y Nutrición, Academia para el Desarrollo Educativo: Washington, DC, USA, 2007. [Google Scholar]
  24. Amigo, H.; Pizarro, M.; Bustos, P.; Castillo, E.; Cerda, R.; Jelvez, I.; Quijada, S.; Valencia, A. National Food Consumption Survey [Spanish]; Universidad de Chile: Santiago de Chile, Chile, 2010. [Google Scholar]
  25. Allan, V.; Camino, S.; Martínez, S.; Munita, C.; Pardo, J.; Seissus, D.; Silva, M.; Tapia, M. Clasificación Grupos Socioeconómicos y Manual de Aplicación: Actualización 2019; Asociación de Investigadores de Mercado y Opinión Pública de Chile: Santiago de Chile, Chile, 2020. [Google Scholar]
  26. Hirshkowitz, M.; Whiton, K.; Albert, S.M.; Alessi, C.; Bruni, O.; DonCarlos, L.; Hazen, N.; Herman, J.; Katz, E.S.; Kheirandish-Gozal, L.; et al. National Sleep Foundation’s sleep time duration recommendations: Methodology and results summary. Sleep Health 2015, 1, 40–43. [Google Scholar] [CrossRef] [PubMed]
  27. Health Ministry of Chile. Manual de Aplicación del Examen de Medicina Preventiva del Adulto Mayor; Servicio de Salud O’Higgins: Rancagua, Chile, 2010; Volume 2, pp. 1–16. [Google Scholar]
  28. Sociedad Española de Nutrición Parenteral y Enteral; Sociedad Española de Geriatría Y Gerontología. Valoración Nutricional del Anciano, 1st ed.; SENPE & SEGG: Galénitas-Nigra Trea, Spain, 2011; ISBN 978-84-95364-55-5. [Google Scholar]
  29. Ratner, R.; Aicardi, V.; Allende, J. Manual de Porciones de Intercambio para Chile, 2nd ed.; Universidad del Desarrollo: Santiago de Chile, Chile, 2021. [Google Scholar]
  30. Guenther, P.M.; Casavale, K.O.; Reedy, J.; Kirkpatrick, S.I.; Hiza, H.A.B.; Kuczynski, K.J.; Kahle, L.L.; Krebs-Smith, S.M. Update of the Healthy Eating Index: HEI-2010. J. Acad. Nutr. Diet. 2013, 113, 569–580. [Google Scholar] [CrossRef] [PubMed] [Green Version]
  31. Galiot, A.H.; Cambrodón, I.G. Calidad de la dieta de la población española mayor de 80 años no institucionalizada. Nutr. Hosp. 2015, 31, 2571–2577. [Google Scholar] [CrossRef]
  32. Kałucka, S.; Kaleta, D.; Makowiec-Dabrowska, T. Prevalence of dietary behavior and determinants of quality of diet among beneficiaries of government welfare assistance in Poland. Int. J. Environ. Res. Public Health 2019, 16, 501. [Google Scholar] [CrossRef] [PubMed]
  33. Rothman, J.; Kayigamba, F.; Hills, V.; Gupta, N.; Machara, F.; Niyigena, P.; Franke, M.F. The Impact of a Community-Based Intervention Including a Monthly Food Ration on Food Insecurity Among HIV-Positive Adults During the First Year of Antiretroviral Therapy. AIDS Behav. 2018, 22, 154–163. [Google Scholar] [CrossRef]
  34. Gomes, L.A.; Gregório, M.J.; Iakovleva, T.A.; De Sousa, R.D.; Bessant, J.; Oliveira, P.; Branco, J.C.; Canhão, H.; Rodrigues, A.M. A home-based ehealth intervention for an older adult population with food insecurity: Feasibility and acceptability study. J. Med. Internet Res. 2021, 23, e26871. [Google Scholar] [CrossRef] [PubMed]
  35. Food and Agriculture Organization; International Fund for Agricultural Development; UNICEF. The State of Food Security and Nutrition in the World 2021; Food and Agriculture Organization: Rome, Italy, 2021; ISBN 9789251343258. [Google Scholar]
  36. Kovalskys, I.; Cavagnari, B.M.; Zonis, L.N.; Favieri, A.L.; Guajardo, V.; Gerardi, A.; Fisberg, M. Poverty as a determinant of food quality in Argentina. Results of the Argentine Study of Nutrition and Health (EANS). Nutr. Hosp. 2020, 37, 114–122. [Google Scholar] [CrossRef]
  37. Kovalskys, I.; Fisberg, M.; Gómez, G.; Pareja, R.G.; Yépez García, M.C.; Cortés Sanabria, L.Y.; Herrera-Cuenca, M.; Rigotti, A.; Guajardo, V.; Zalcman Zimberg, I.; et al. Energy intake and food sources of eight Latin American countries: Results from the Latin American Study of Nutrition and Health (ELANS). Public Health Nutr. 2018, 21, 2535–2547. [Google Scholar] [CrossRef] [PubMed] [Green Version]
  38. Navarro Cruz, A.R. Ingesta de Energía y Nutrientes de un Grupo de Ancianos Institucionalizados de la Ciudad de Puebla, México. Ph.D. Thesis, Universidad Complutense de Madrid, Madrid, Spain, 2003. [Google Scholar]
  39. Reedy, J.; Lerman, J.L.; Krebs-Smith, S.M.; Kirkpatrick, S.I.; Pannucci, T.E.; Wilson, M.M.; Subar, A.F.; Kahle, L.L.; Tooze, J.A. Evaluation of the Healthy Eating Index-2015. J. Acad. Nutr. Diet. 2018, 118, 1622–1633. [Google Scholar] [CrossRef]
  40. Pan, L.; Sherry, B.; Njai, R.; Blanck, H.M. Food Insecurity Is Associated with Obesity among US Adults in 12 States. J. Acad. Nutr. Diet. 2012, 112, 1403–1409. [Google Scholar] [CrossRef] [Green Version]
  41. Dhurandhar, E.J. The food-insecurity obesity paradox: A resource scarcity hypothesis. Physiol. Behav. 2016, 162, 88–92. [Google Scholar] [CrossRef] [Green Version]
  42. Cannobbio, L.; Jeri, T. Estadísticas Sobre Las Personas Adultas Mayores: Un Análisis de Género—Informe Final; Servicio Nacional del Adulto Mayor: Santiago de Chile, Chile, 2008. [Google Scholar]
  43. Ginter, E.; Simko, V. Women live longer than men. Bratislava Med. J. 2013, 114, 45–49. [Google Scholar] [CrossRef] [Green Version]
  44. Ek, S. Gender differences in health information behaviour: A Finnish population-based survey. Health Promot. Int. 2015, 30, 736–745. [Google Scholar] [CrossRef] [Green Version]
  45. Acosta, R.S.; Clacagni, M.S.; Massobrio, E.; Gasparutti, G.; Gubiani, M.L.; Boillos, C.; Celton, D. Calidad dietaria, satisfacción vital y estados de malnutrición en ancianos, Córdoba, República Argentina, 2007. Rev. Salud Pública Nutr. 2010, 11, 1–13. [Google Scholar]
  46. Klee Oehlschlaeger, M.H.; Alberici Pastore, C.; Schüler Cavalli, A.; Gonzalez, M.C. Nutritional status, muscle mass and strength of elderly in southern Brazil. Nutr. Hosp. 2014, 31, 363–370. [Google Scholar] [CrossRef]
  47. Penny Montenegro, E. Obesidad en la tercera edad. An. Fac. Med. 2017, 78, 111. [Google Scholar] [CrossRef] [Green Version]
  48. Molina González, M.E. Análisis del índice de masa corporal (IMC) y el nivel de actividad física en adultos mayores de la ciudad de Barranquilla: Un estudio correlacional. Biociencias 2019, 14, 83–95. [Google Scholar] [CrossRef] [Green Version]
  49. Bauce, G. Evaluación antropométrica de un grupo de pacientes adultos mayores. Rev. Digit. Postgrado 2020, 9, e225. [Google Scholar] [CrossRef]
  50. Nevill, A.M.; Metsios, G.S. The need to redefine age- and gender-specific overweight and obese body mass index cutoff points. Nutr. Diabetes 2015, 5, e186. [Google Scholar] [CrossRef]
  51. Tourlouki, E.; Matalas, A.L.; Panagiotakos, D.B. Dietary habits and cardiovascular disease risk in middle-aged and elderly populations: A review of evidence. Clin. Interv. Aging 2009, 4, 319–330. [Google Scholar] [CrossRef] [Green Version]
  52. Ministerio de Desarrollo Social de Chile. Social Development Survey (CASEN); Ministerio de Desarrollo Social de Chile: Santiago de Chile, Chile, 2018; Available online: http://observatorio.ministeriodesarrollosocial.gob.cl/storage/docs/casen/2017/Resultados_trabajo_Casen_2017.pdf (accessed on 15 December 2021).
Table 1. Descriptive characteristics of participants.
Name of VariableTotal Sample
n = 376
Age, years *73.5 (6.9)
Sex, n (%) **
Women307 (81.6)
Man69 (18.4)
Weight, kg *73.9 (12.9)
Height, m *1.5 (0.1)
BMI, Kg/m2 *31.3 (5.2)
BMI by classification, n (%) **
<21.9 kg/m25 (1.3)
22–26.9 kg/m277 (20.5)
27–29.9 kg/m280 (21.3)
≥30 kg/m2212 (56.4)
Waist circumference, cm *99.6 (12.2)
Cardiovascular risk, n (%) **287 (76.3)
Food Safety Scale, score *0.9 (1.8)
Food Safety Scale Categories, n (%) **
Security247 (65.7)
Mild Insecurity90 (23.9)
Moderate Insecurity23 (6.1)
Severe Insecurity12 (3.2)
Number of people in the household *2.4 (1.3)
Median household income per month, n (%) **
$158 USD151 (40.2)
$307 USD142 (37.8)
$503 USD65 (17.3)
$810 USD11 (2.9)
$1374 USD4 (1.1)
$2070 USD1 (0.3)
$4386 USD2 (0.5)
Socioeconomic level, n (%) **
Upper class0 (0)
Wealthy Middle Class2 (0.5)
Emerging Middle class0 (0)
Typical Middle Class13 (3.5)
Medium-low class51 (13.6)
Vulnerable161 (42.8)
Poor149 (39.6)
Number of drugs, n (%) **
031 (8.2)
1 to 288 (23.4)
3 to 5143 (38.0)
6 to 867 (17.8)
>847 (12.5)
Hours of sleep per day, n (%) **
8 to 10164 (43.6)
5 to 7171 (45.5)
<541 (10.9)
Physical activity, n (%) **
Physically active86 (22.9)
Irregulary active124 (33.0)
Sedentary166 (44.1)
Healthy Eating Index, score *79.1 (10.1)
Healthy Eating Index Categories **
Healthy53 (14.1)
Needs improvement315 (83.8)
Unhealthy8 (2.1)
Data are presented as mean (SD) * or frequency (%) ** when specified. BMI: body mass index; kg: kilograms; m: meters; USD: United States dollars.
Table 2. Comparisons of demographic characteristics according to quality of diet groups.
Healthy Eating Index Categories
HealthyNeeds ImprovementUnhealthyp Value
Number of people in the household *2.4 (1.4)2.5 (1.3)2.3 (1.4)0.914 a
Age, years *75.1 (7.3)73.2 (6.9)75.3 (4.5)0.140 b
Sex, n (%) **
Women44 (83.0)257 (81.6)6 (1.9)0.794 c
Man9 (17.0)58 (18.4)2 (0.6)
Weight, kg *74.3 (13.1)73.8 (12.9)73.5 (13.0)0.973 b
Height, m *1.5 (0.1)1.5 (0.1)1.6 (0.1)0.437 b
BMI, kg/m2 *31.1 (5.5)31.3 (5.2)30.1 (5.3)0.789 b
BMI by classification, n (%) **
<21.90 (0.0)7 (2.2)0 (0.0)0.869 c
22–26.913 (24.5)62 (19.7)2 (0.6)
27–29.913 (24.5)63 (20.0)4 (1.3)
≥3027 (50.9)183 (58.1)2 (0.6)
Obesity, n (%) **27 (50.9)183 (58.1)2 (0.6)0.920 c
Waist circumference, cm *97.7 (12.0)99.9 (12.3)99.5 (11.5)0.488 b
Cardiovascular risk, n (%) **34 (64.2)247 (78.4)6 (1.9)0.045 c
Food insecurity, n (%) **9 (17.0)118 (37.5)2 (0.6)0.023 c
Socioeconomic level, n (%) **
Wealthy Middle Class1 (1.9)1 (0.3)0 (0.0)0.794 c
Typical Middle Class4 (7.5)9 (2.9)0 (0.0)
Medium-low class4 (7.5)46 (14.6)1 (0.3)
Vulnerable19 (35.8)139 (44.1)3 (1.0)
Poor25 (47.2)120 (38.1)4 (1.3)
Number of drugs, n (%) **
1 to 211 (20.8)72 (22.9)5 (1.6)0.110 c
3 to 519 (35.8)123 (39.0)1 (0.3)
6 a 8 10 (18.9)57 (18.1)0 (0.0)
>89 (17.0)37 (11.7)1 (0.3)
Hours of sleep, n (%) **
8 to 1023 (43.4)137 (43.5)4 (1.3)0.884 c
5 to 725 (47.2)142 (45.1)4 (1.3)
<55 (9.4)36 (11.4)0 (0.0)
Physical activity, n (%) **
Physically active12 (22.6)72 (22.9)2 (0.6)0.541 c
Irregulary active14 (26.4)109 (34.6)1 (0.3)
Sedentary27 (50.9)134 (42.5)5 (1.6)
Data are presented as mean (SD) * or frequency (%) **. Data were compared by: a: ANOVA one-way, b: Welch’s ANOVA, c: chi-square for trend. BMI: body mass index; kg: kilograms; m: meters; USD: United States dollars.
Table 3. Comparisons of food frequencies between the healthy eating index categories.
Healthy Eating Index Classification
TotalHealthyNeeds ImprovementUnhealthyp Value
Cereal consumption frequency
Never or almost never2 (0.5)0 (0.0)2 (0.6)0 (0.0)0.031
Occasional11 (2.9)0 (0.0)10 (3.2)1 (12.5)
Weekly40 (10.6)5 (9.4)32 (10.2)3 (37.5)
Daily consumption323 (85.9)48 (90.6)271 (86.0)4 (50.0)
Vegetable consumption frequency
Never or almost never4 (1.1)0 (0.0)3 (1.0)1 (12.5)<0.001
Occasional16 (4.3)1 (1.9)12 (3.8)3 (37.5)
Weekly75 (19.9)0 (0.0)72 (22.9)3 (37.5)
Daily consumption281 (74.8)52 (98.1)228 (72.4)1 (12.5)
Frequency of fruit consumption
Never or almost never6 (1.6)0 (0.0)5 (1.6)1 (12.5)<0.001
Occasional30 (8.0)0 (0.0)26 (8.3)4 (50.0)
Weekly95 (25.3)4 (7.5)90 (28.6)1 (12.5)
Daily consumption245 (65.2)49 (92.5)194 (61.6)2 (25.0)
Frequency milk products consumption
Never or almost never26 (6.9)0 (0.0)24 (7.6)2 (25.0)<0.001
Occasional51 (13.6)1 (1.9)47 (14.9)3 (37.5)
Weekly123 (32.7)14 (26.4)106 (33.7)3 (37.5)
Daily consumption176 (46.8)38 (71.7)138 (43.8)0 (0.0)
Fat consumption frequency
Never or almost never30 (8.0)0 (0.0)27 (8.6)3 (37.5)<0.001
Occasional39 (10.4)0 (0.0)36 (11.4)3 (37.5)
Weekly44 (11.7)1 (1.9)43 (13.7)0 (0.0)
Daily consumption263 (69.9)52 (98.1)209 (66.3)2 (25.0)
Frequency of meat consumption
Never or almost never4 (1.1)0 (0.0)4 (1.3)0 (0.0)0.671
Occasional47 (12.5)3 (5.7)41 (13.0)3 (37.5)
Weekly277 (73.7)50 (94.3)224 (71.1)3 (37.5)
Daily consumption48 (12.8)0 (0.0)46 (14.6)2 (25.0)
Legume consumption frequency
Never or almost never7 (1.9)0 (0.0)6 (1.9)1 (12.5)<0.001
Occasional33 (8.8)0 (0.0)28 (8.9)5 (62.5)
Weekly328 (87.2)53 (100.0)273 (86.7)2 (25.0)
Daily consumption8 (2.1)0 (0.0)8 (2.5)0 (0.0)
Sausage consumption frequency
Never or almost never214 (56.9)43 (81.1)169 (53.7)2 (25.0)<0.001
Occasional121 (32.2)10 (18.9)107 (34.0)4 (50.0)
Weekly37 (9.8)0 (0.0)36 (11.4)1 (12.5)
Daily consumption4 (1.1)0 (0.0)3 (1.0)1 (12.5)
Frequency of consumption of sweets
Never or almost never101 (26.9)35 (66.0)66 (21.0)0 (0.0<0.001
Occasional195 (51.9)17 (32.1)174 (55.2)4 (50.0
Weekly61 (16.2)1 (1.9)57 (18.1)3 (37.5
Daily consumption19 (5.1)0 (0.0)18 (5.7)1 (12.5
Data are presented as frequency and percentage. Data were compared by Chi-square for trend.
Table 4. Comparisons of food portion consumption between healthy eating index categories.
Healthy Eating Index Classification
TotalHealthyNeeds ImprovementUnhealthyp Value
Cereals servings
1 to 3 servings337 (89.6)50 (94.3)279 (88.6)8 (100)0.418
3 to 5 servings36 (9.6)3 (5.7)33 (10.5)0 (0.0)
>5 servings1 (0.3)0 (0.0)1 (0.3)0 (0.0)
Does not consume2 (0.5)0 (0.0)2 (0.6)0 (0.0)
Vegetables servings
1 to 3 servings361 (96)49 (92.5)304 (96.5)8 (100)0.530
3 to 5 servings12 (3.2)4 (7.5)8 (2.5)0 (0.0)
>5 servings0 (0.0)0 (0.0)0 (0.0)0 (0.0)
Does not consume3 (0.8)0 (0.0)3 (1)0 (0.0)
Fruits servings
1 to 3 servings303 (80.6)46 (86.8)251 (79.7)6 (75)0.107
3 to 5 servings66 (17.6)6 (11.3)59 (18.7)1 (12.5)
>5 servings3 (0.8)1 (1.9)2 (0.6)0 (0.0)
Does not consume4 (1.1)0 (0.0)3 (1)1 (12.5)
Milk products servings
1 to 3 servings349 (92.8)52 (98.1)290 (92.1)7 (87.5)0.050
3 to 5 servings10 (2.7)1 (1.9)9 (2.9)0 (0.0)
>5 servings1 (0.3)0 (0.0)1 (0.3)0 (0.0)
Does not consume16 (4.3)0 (0.0)15 (4.8)1 (12.5)
Fat servings
1 to 3 servings348 (98)53 (100)291 (98.0)6 (75.0)0.131
3 to 5 servings6 (1.7)0 (0.0)5 (1.7)2 (25.0)
>5 servings0 (0.0)0 (0.0)0 (0.0)0 (0.0)
Does not consume1 (0.3)0 (0.0)1 (0.3)0 (0.0)
Meat servings
1 to 3 servings309 (82.2)49 (92.5)252 (80.0)8 (100)0.136
3 to 5 servings57 (15.2)4 (7.5)53 (16.8)0 (0.0)
>5 servings8 (2.1)0 (0.0)8 (2.5)0 (0.0)
Does not consume2 (0.5)0 (0.0)2 (0.6)0 (0.0)
Legumes servings
1 to 3 servings350 (93.1)50 (94.3)293 (93.0)7 (87.5)0.159
3 to 5 servings20 (5.3)3 (5.7)17 (5.4)0 (0.0)
>5 servings0 (0.0)0 (0.0)0 (0.0)0 (0.0)
Does not consume6 (1.6)0 (0.0)5 (1.6)1 (12.5)
Sausages servings
1 to 3 servings220 (58.5)22 (41.5)190 (60.3)8 (100)0.001
3 to 5 servings1 (0.3)0 (0.0)1 (0.3)0 (0.0)
>5 servings0 (0.0)0 (0.0)0 (0.0)0 (0.0)
Does not consume155 (41.2)31 (58.5)124 (39.4)0 (0.0)
Sweets servings
1 to 3 servings293 (95.4)29 (96.7)256 (95.2)8 (100)0.572
3 to 5 servings12 (3.9)0 (0.0)12 (4.5)0 (0.0)
>5 servings2 (0.7)1 (3.3)1 (0.4)0 (0.0)
Does not consume0 (0.0)0 (0.0)0 (0.0)0 (0.0)
Data are presented as frequency and percentage. Data were compared by chi-square for trend.
Table 5. Results of the ordinal logistic regression analyses to determine the association between demographic and lifestyle variables with quality of diet.
βSE95% CIp Value
Sex (male)0.1620.371−0.560–0.8830.672
Age (years)−0.0310.020−0.071–0.0110.160
BMI (points)−0.0010.027−0.053–0.0510.967
Waist circumference (cm)0.0130.012−0.010–0.0360.271
Cardiovascular risk
AbsentReference
Present0.6310.3090.026–1.2360.041
Food Safety Scale (score)0.1900.0920.010–0.3700.038
Vulnerable or poor socioeconomic status
AbsentReference
Present0.0070.985−0.712–0.7250.985
Obesity (BMI ≥ 30)
AbsentReference
Present0.0530.281−0.498–0.6040.851
Food insecurity
AbsentReference
Present0.7820.3260.143–1.4210.017
Pharmaceuticals
1 to 2Reference
3 to 5−0.7290.488−1.686–0.2280.135
6 to 8−0.5740.453−1.463–0.3150.206
>8−0.4210.393−1.192–0.3500.284
Hours of Sleep
8 to 10Reference
5 to 7−0.0230.474−0.951–0.9060.962
<5−0.0490.296−0.629–0.5310.868
Physical Activity
Physically activeReference
Irregulary active−0.1220.358−0.824–0.5810.734
Sedentary0.0970.386−0.660–0.8540.802
β: regression coefficient, SE: standard error, 95% CI: 95% confidence interval, BMI: body mass index.
Table 6. Results of Poisson regression to determine the association between demographic and lifestyle variables with quality of diet.
βSEPR95% CIp Value
Sex (male)0.8110.8662.2500.412–12.2840.349
Age (years)0.0030.0601.0030.892–1.1270.961
BMI (points)−0.1520.0950.8590.713–1.0360.111
Waist circumference (cm)−0.0310.0380.9700.901–1.0440.414
Cardiovascular risk
AbsentReference
Present−0.5730.8660.5640.103–3.0790.508
Food Safety Scale, score0.0570.2011.0590.715–1.5680.776
Vulnerable or poor socioeconomic status
AbsentReference
Present0.1251.0951.1330.132–9.6990.909
Obesity (BMI ≥ 30)
AbsentReference
Present−1.9231.0950.1460.017–1.2510.079
Food insecurity
AbsentReference
Present−0.0570.8660.9450.173–5.1590.948
Hours of Sleep
8 to 10Reference
5 to 7−0.7130.8660.4900.090–2.6760.410
<5Not estimable
Physical Activity
Physically activeReference
Irregulary active0.8061.1182.2400.250–20.0410.471
Sedentary−0.2421.4140.7850.049–12.5510.864
β: regression coefficient, SE: standard error, 95% CI: 95% confidence interval, PR: prevalence ratio, BMI: body mass index.
Publisher’s Note: MDPI stays neutral with regard to jurisdictional claims in published maps and institutional affiliations.

