
Gut Microbiome Composition in Obese and Non-Obese Persons: A Systematic Review and Meta-Analysis

 , , , and
Abstract
:1. Introduction
2. Materials and Methods
2.1. Data Sources and Search Strategy
2.2. Exposures and Comparators
2.3. Outcome Measures
2.4. Inclusion and Exclusion Criteria
2.5. Study Selection and Data Extraction
2.6. Quality Assessment
2.7. Data Synthesis
3. Results
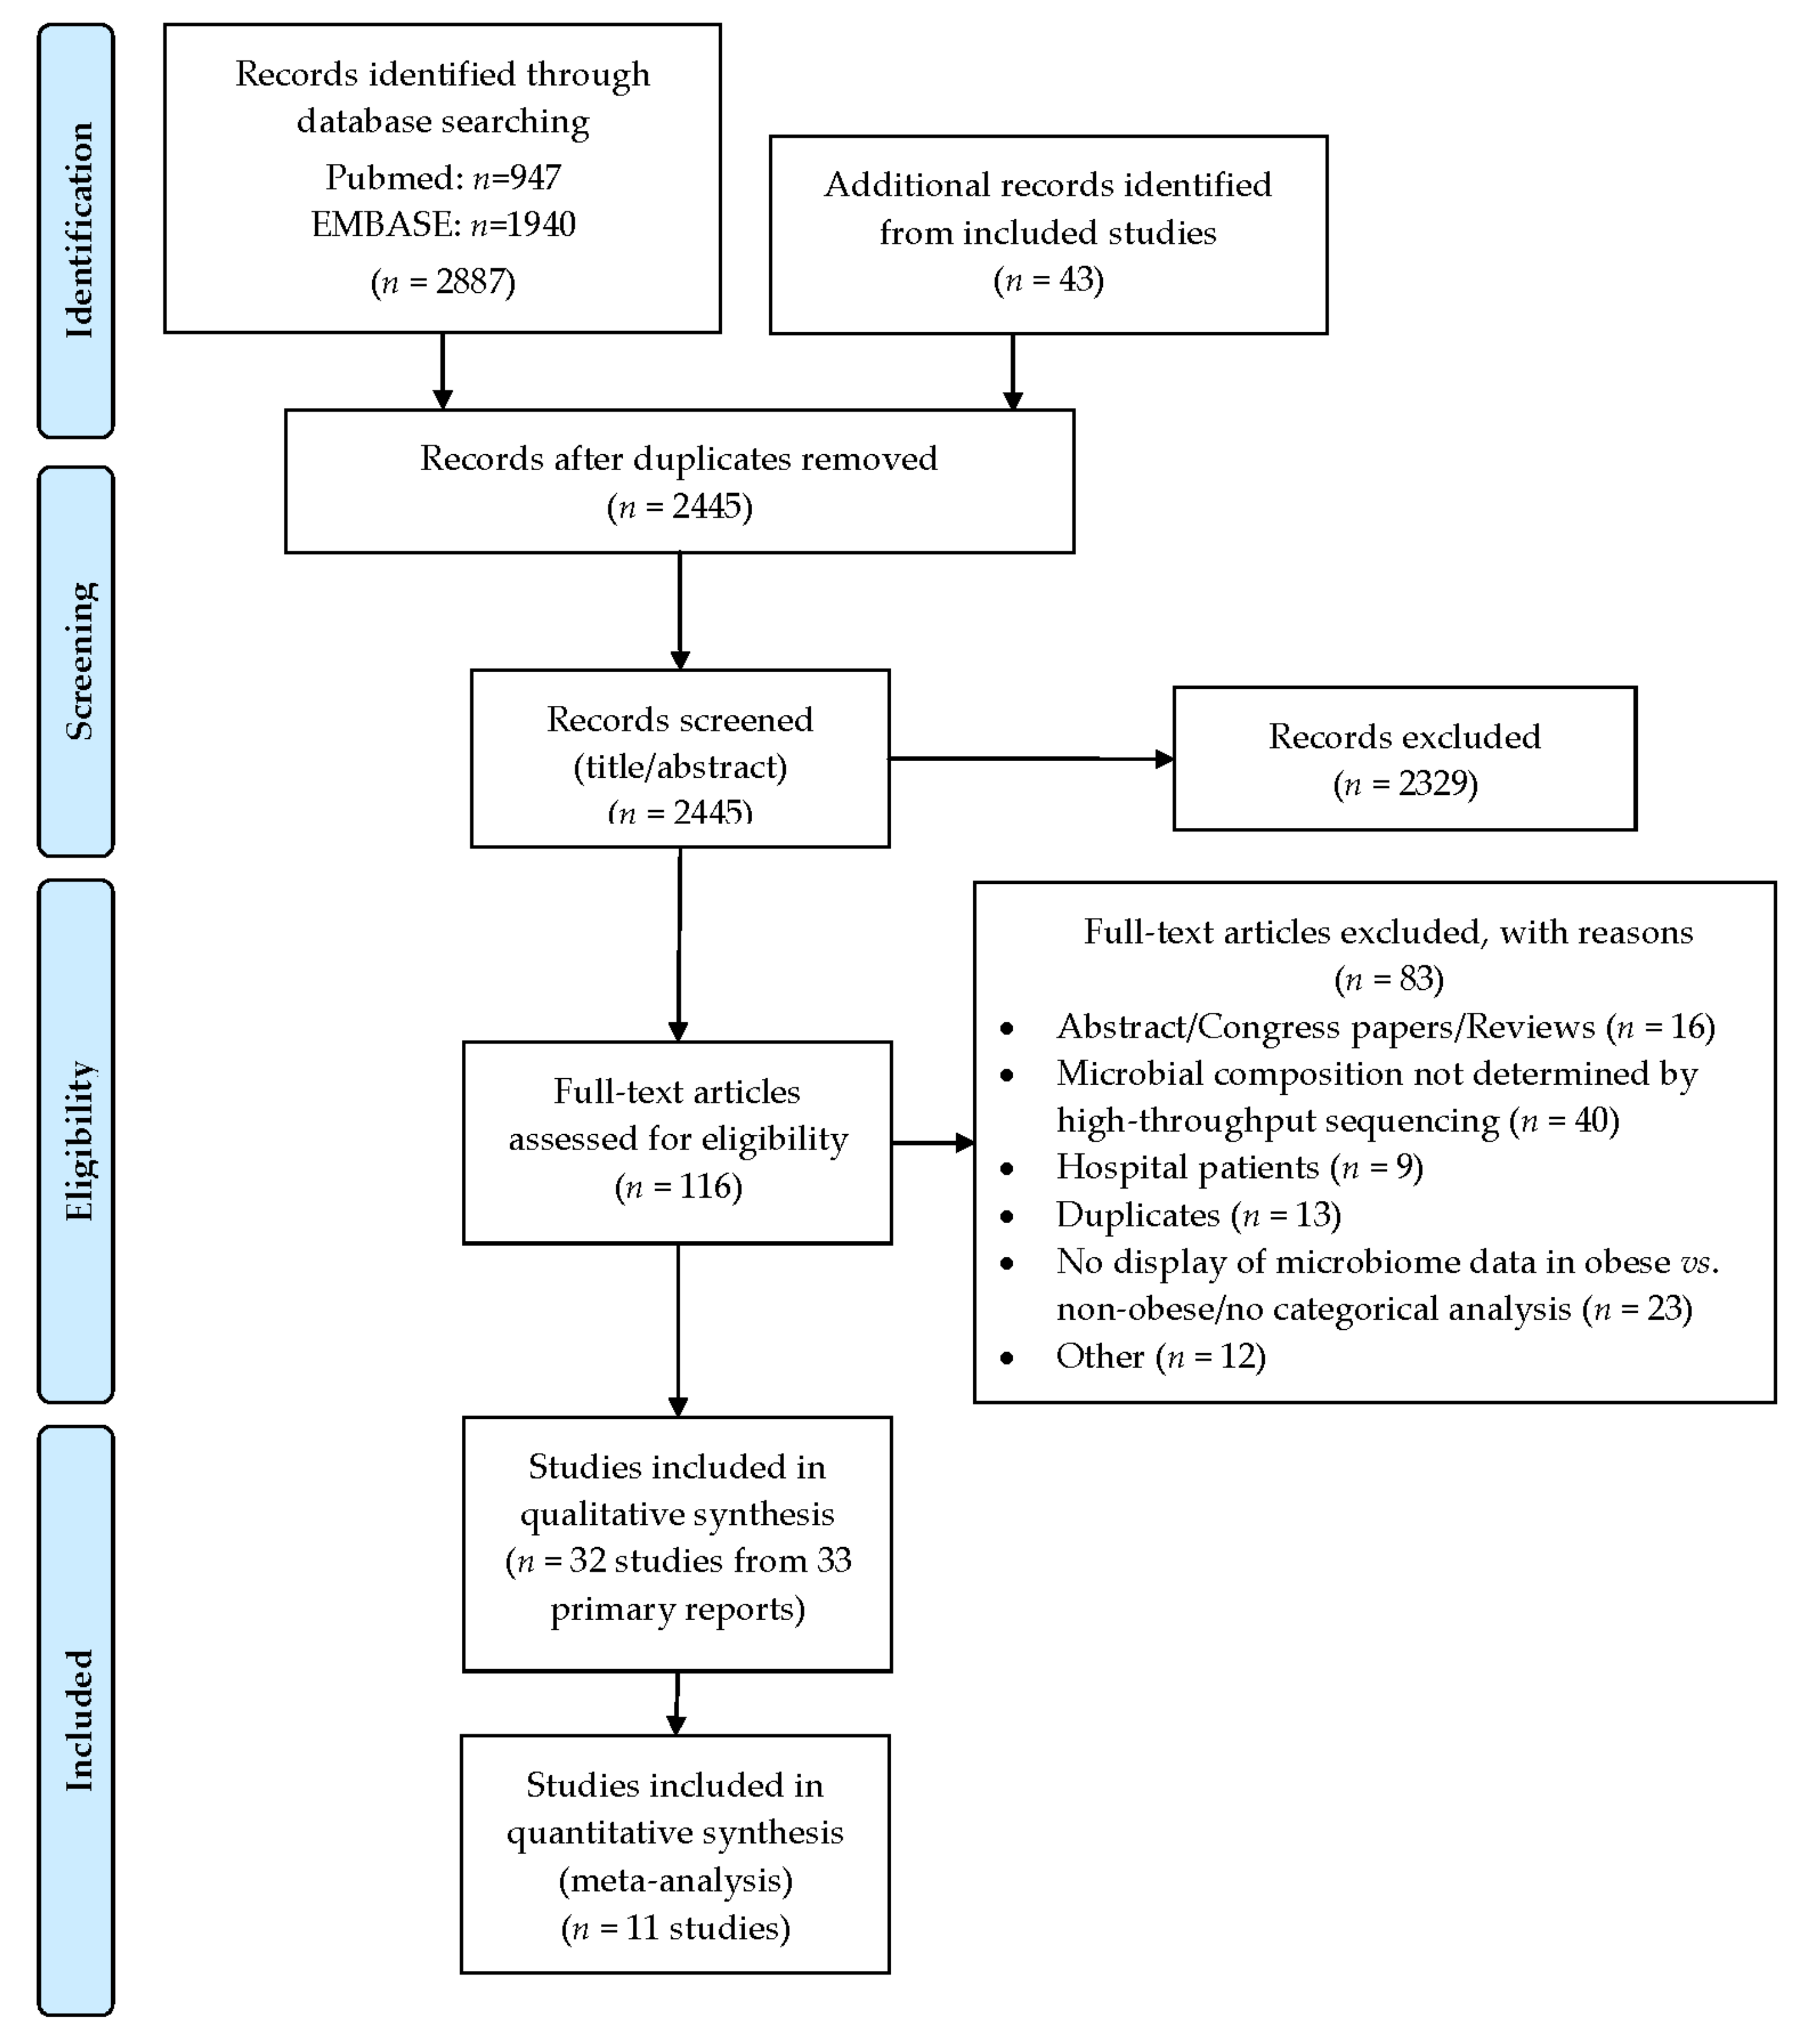
3.1. Search Flow and Studies Overview
3.2. Primary Outcomes
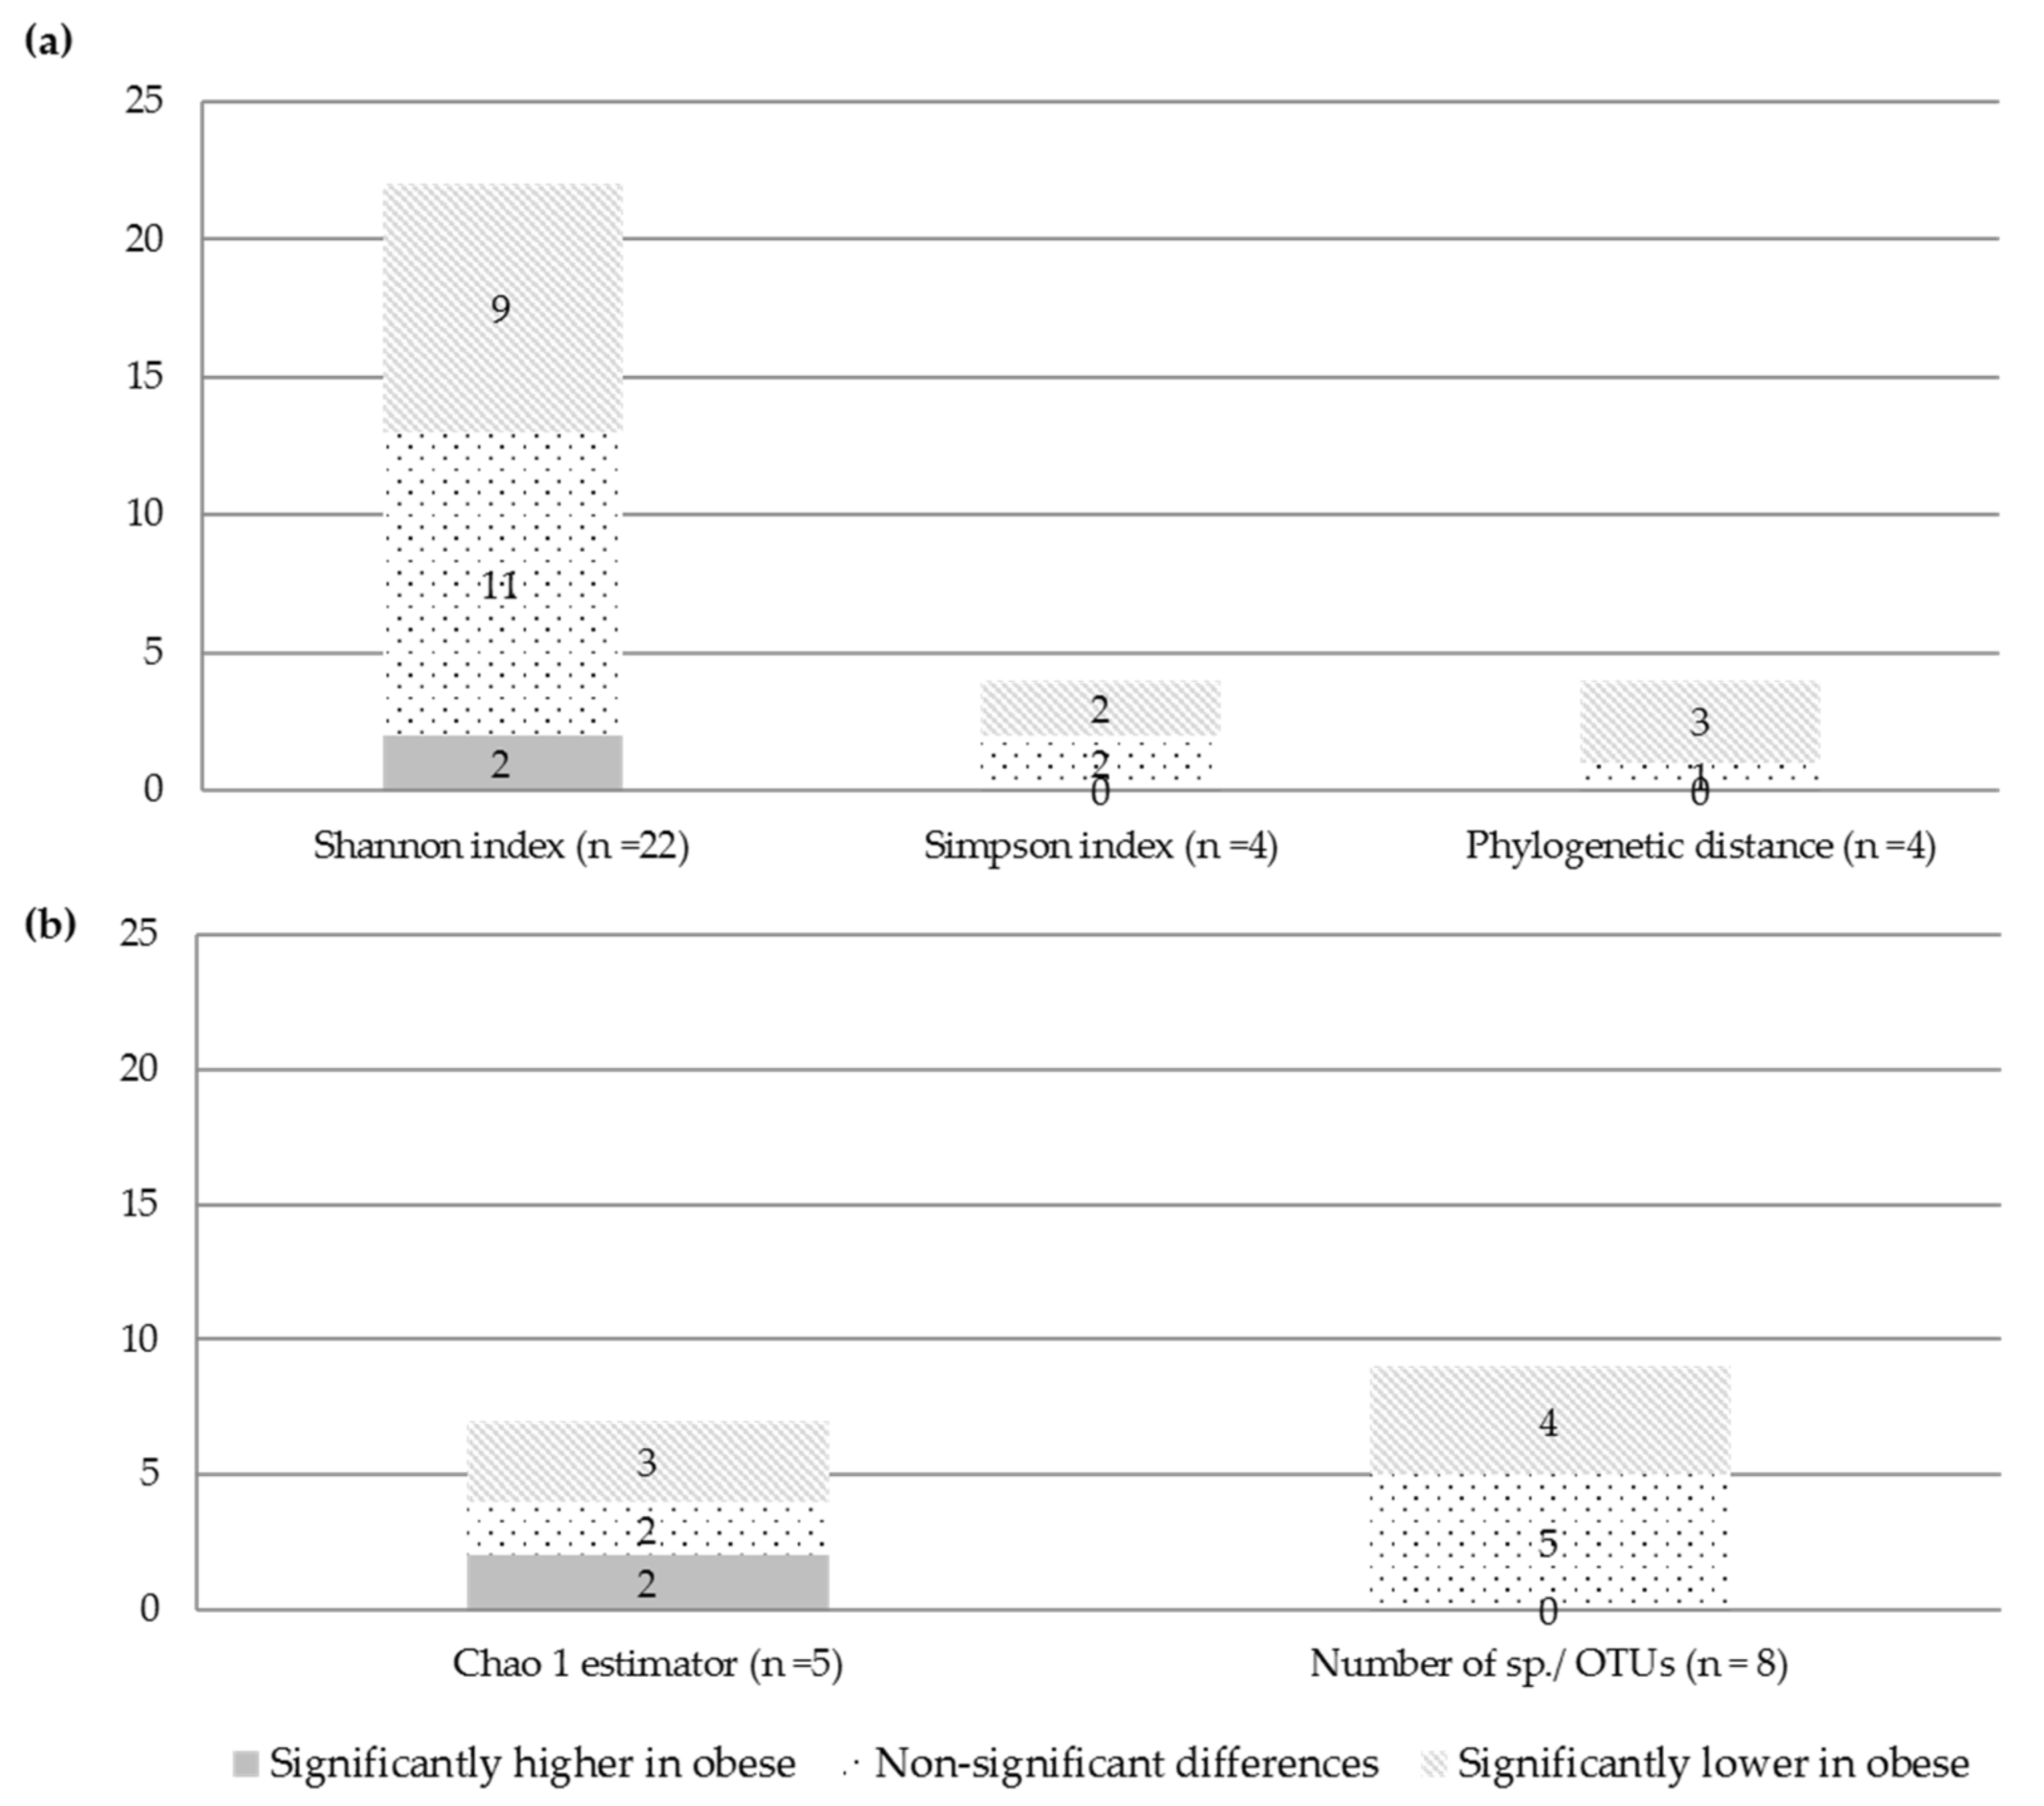
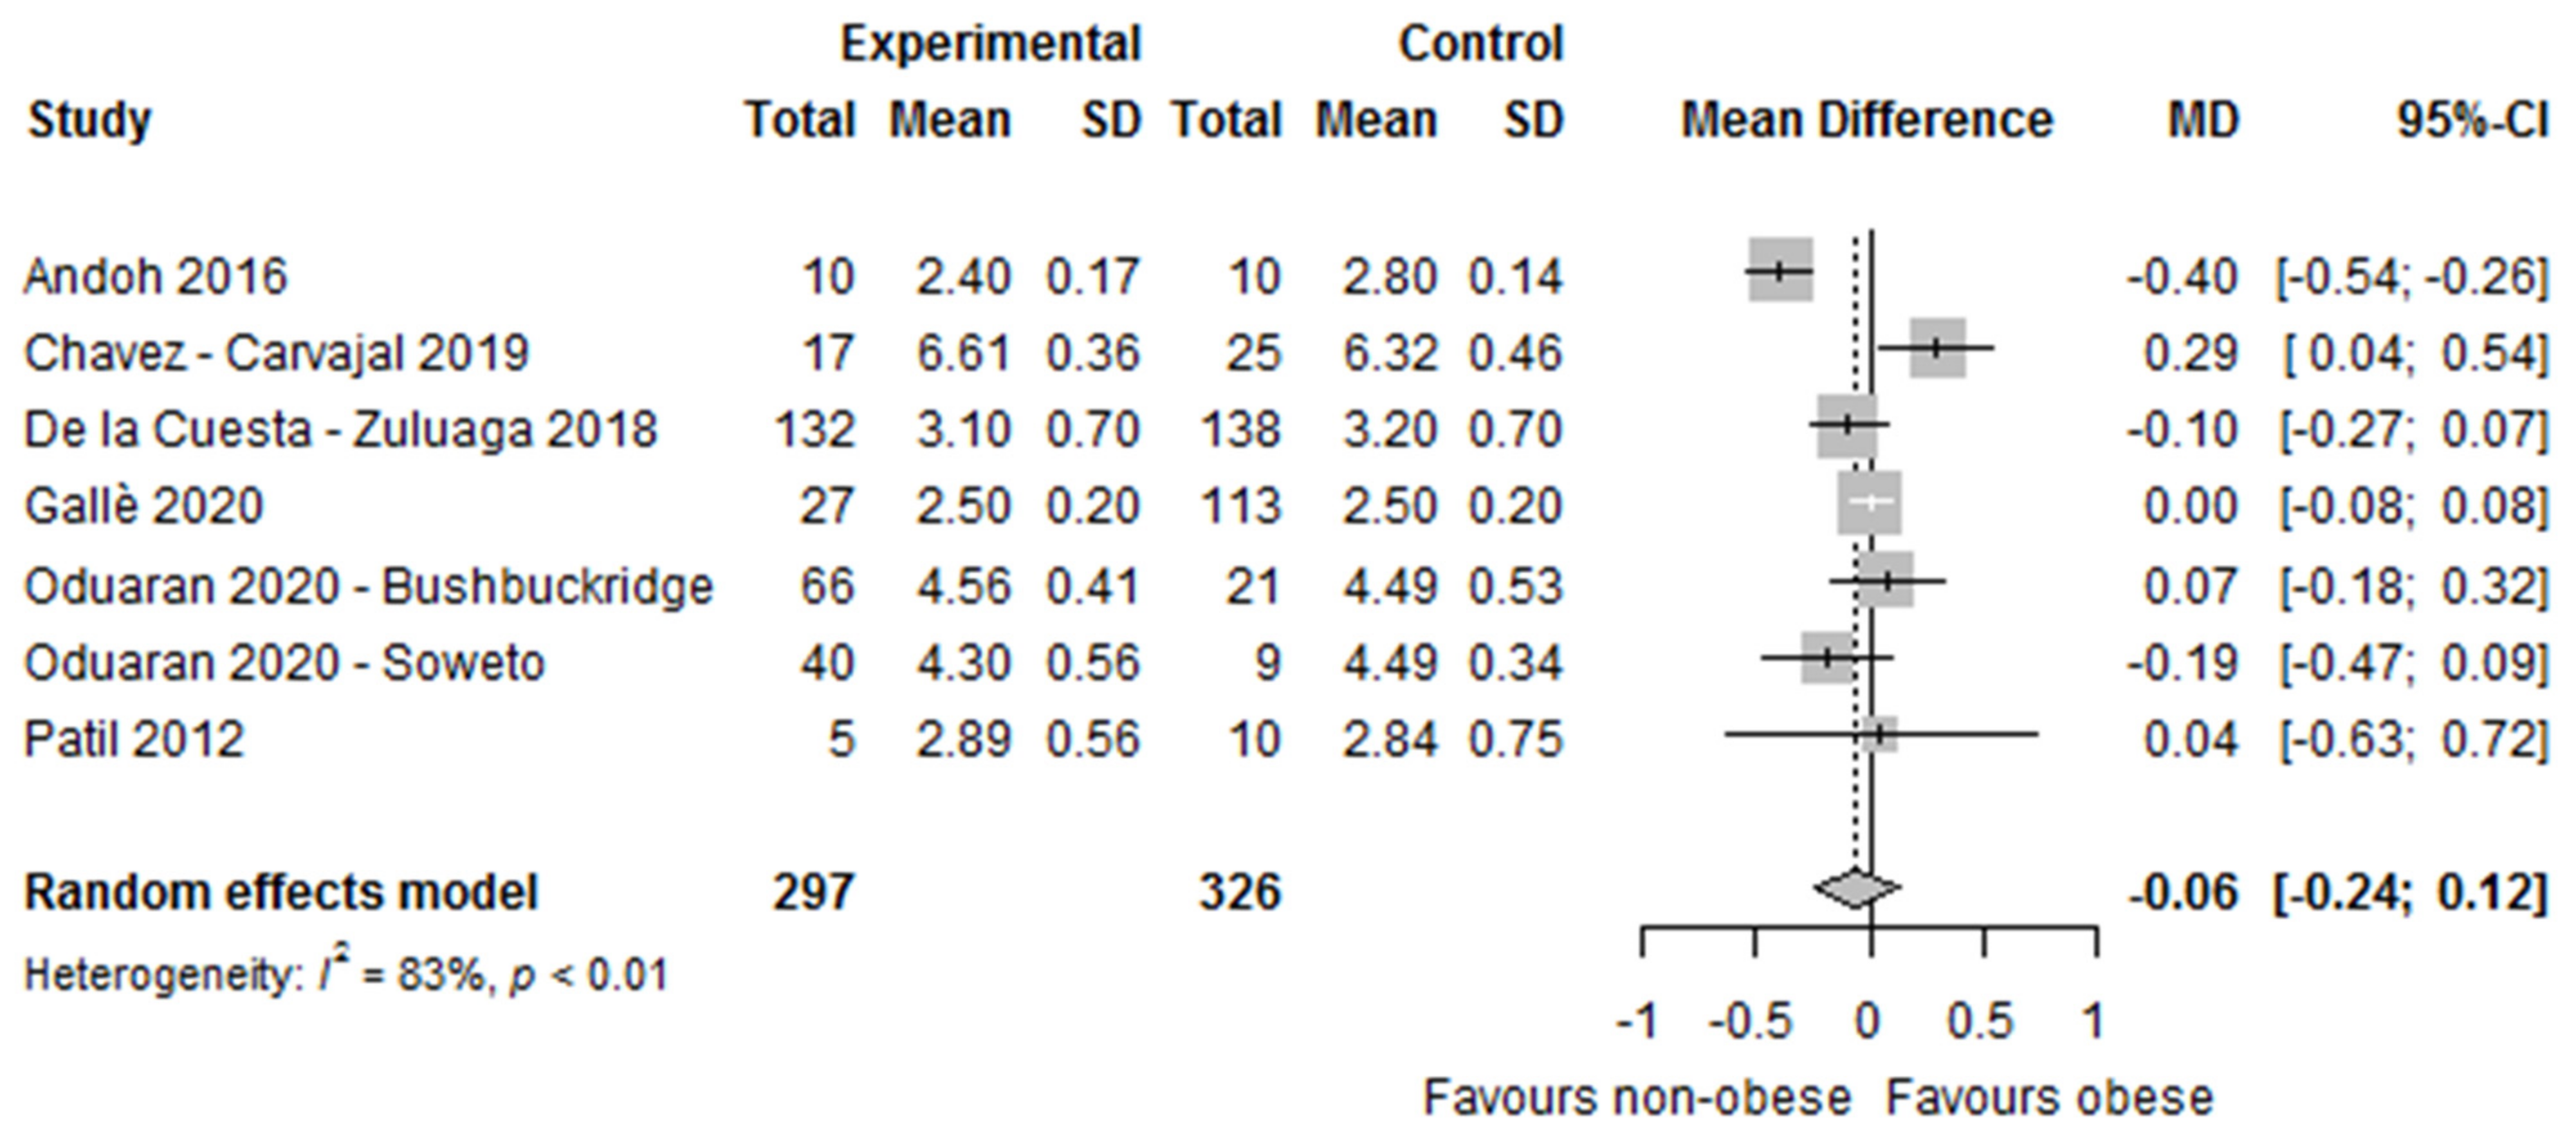
3.2.1. Alpha and Beta Diversity (Microbial Diversity and Richness, Microbial Dissimilarities)
3.2.2. Differences in The Microbial Composition
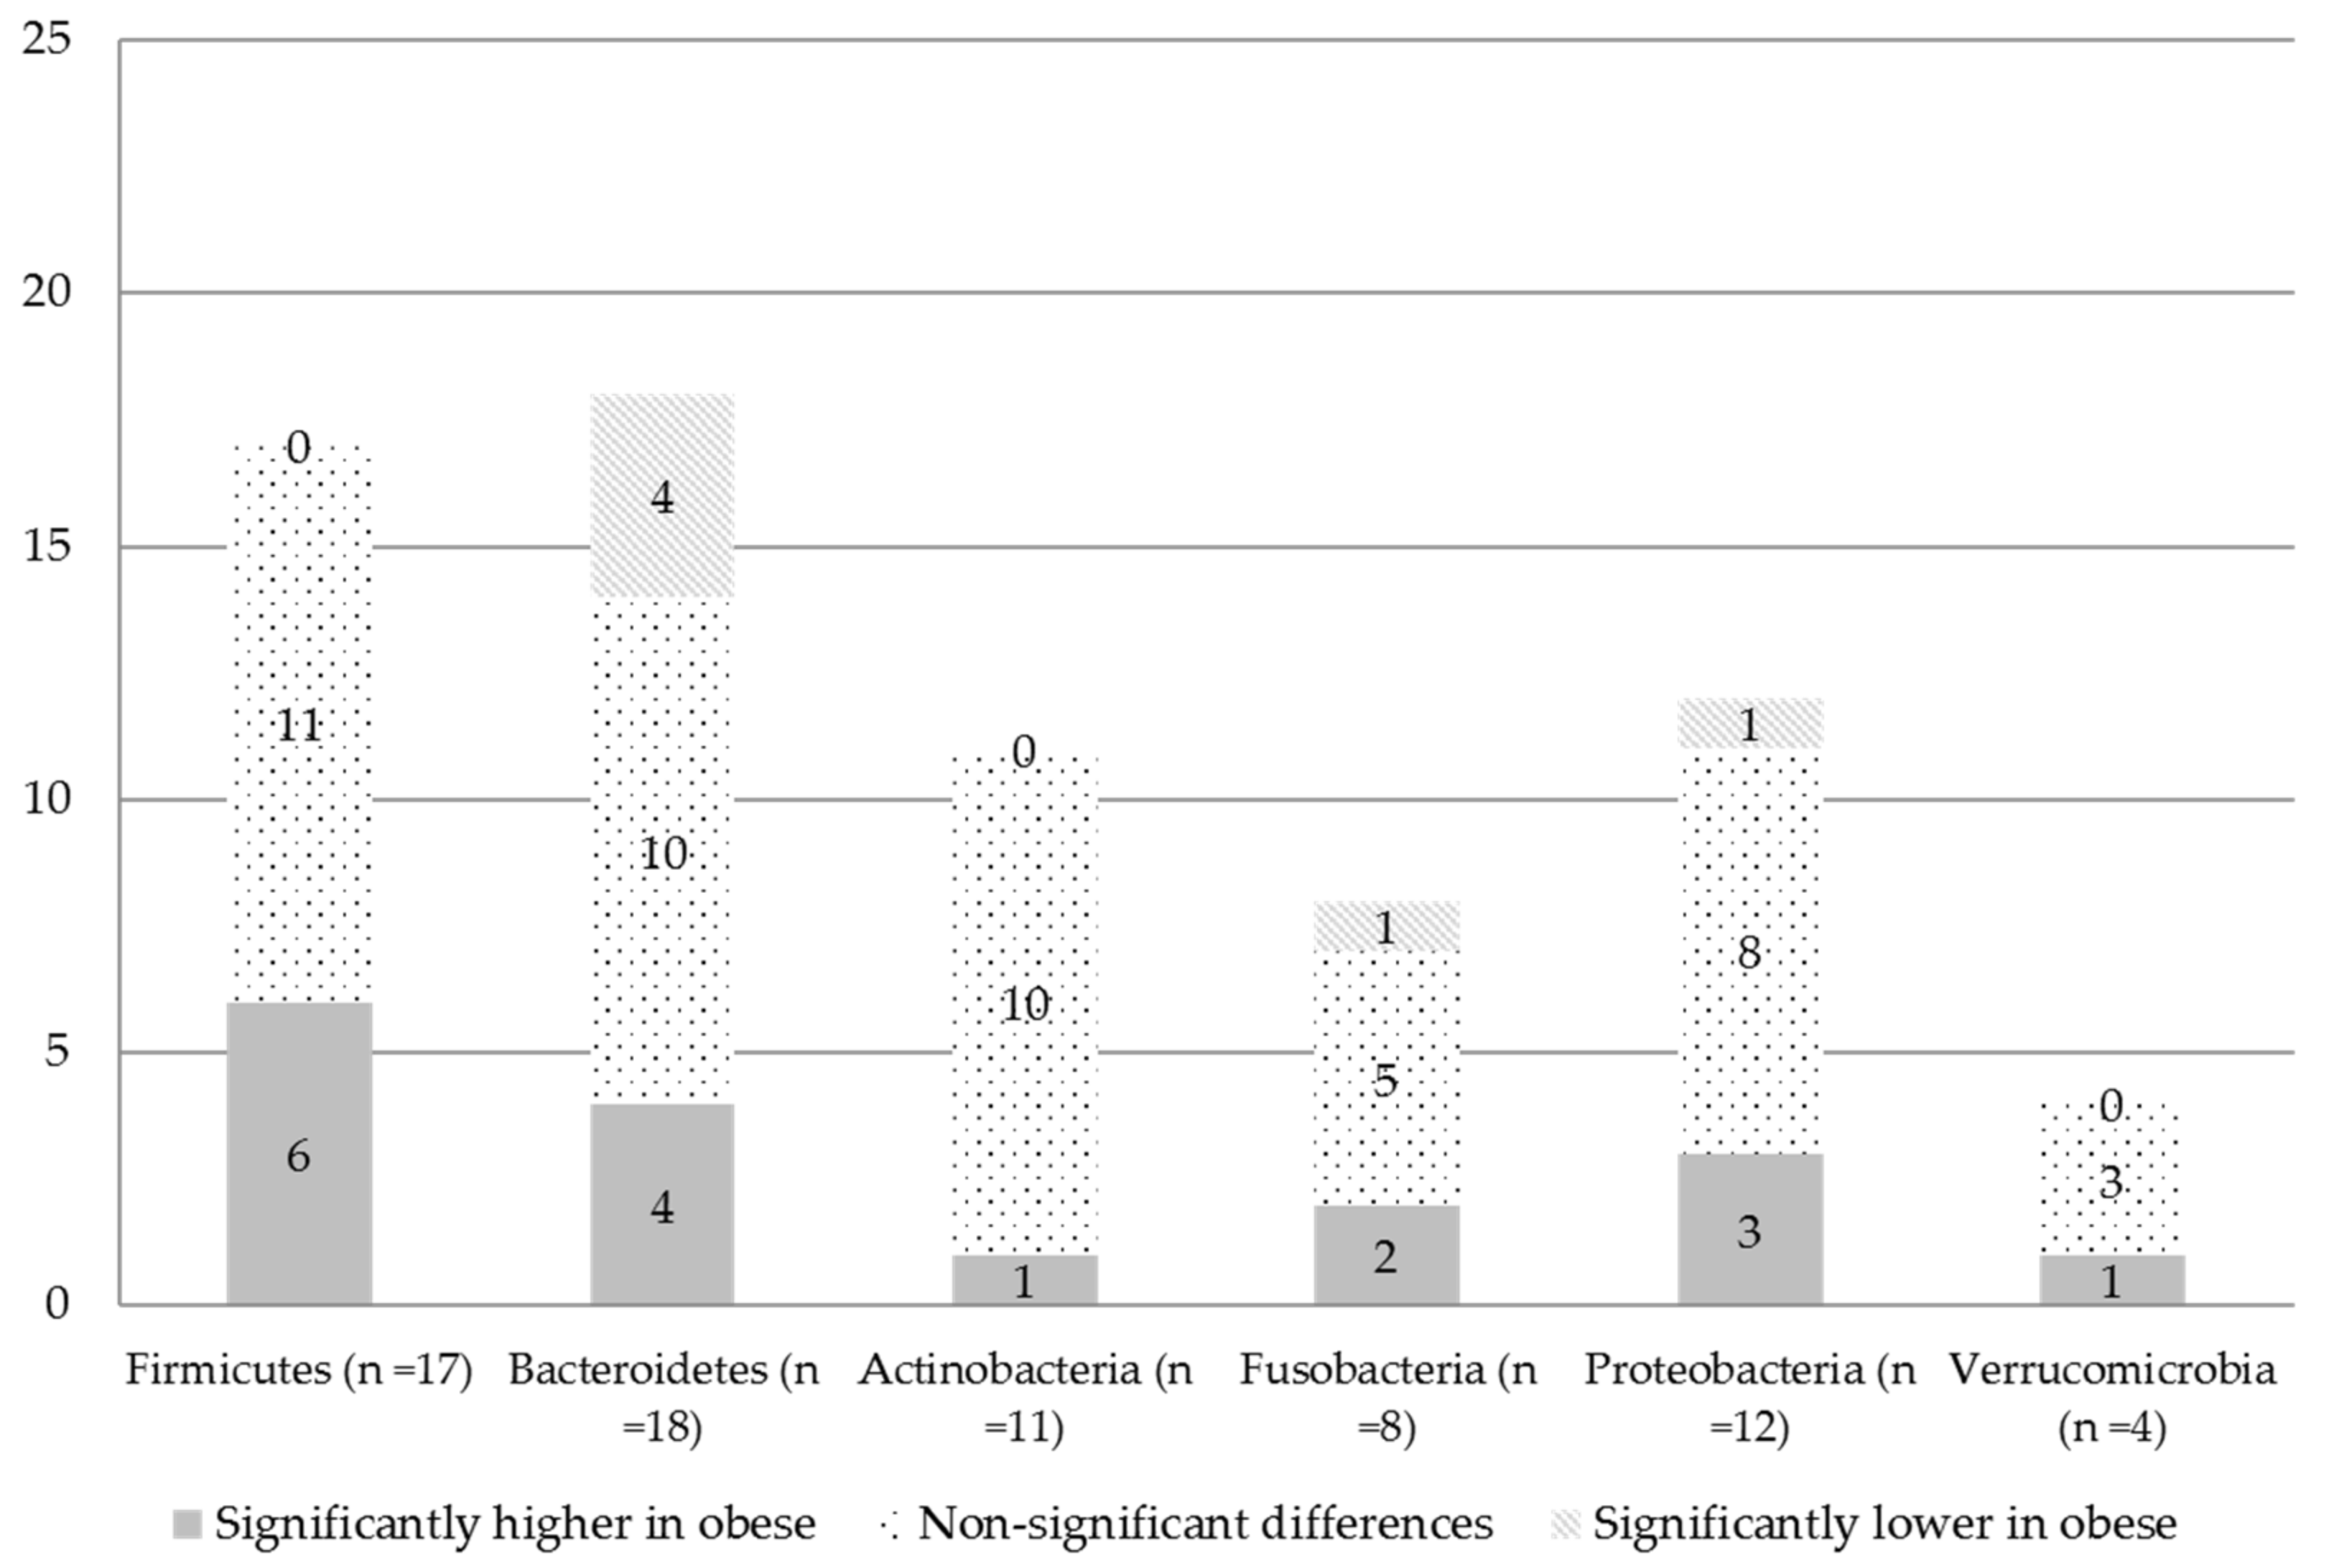
At the Phylum Level
At the Genus Level
Fungi
3.3. Secondary Outcomes
Microbial Taxonomic Signatures Associated with Obesity
3.4. Quality Assessment
4. Discussion
Strengths and Limitations
5. Conclusions
Supplementary Materials
Author Contributions
Funding
Institutional Review Board Statement
Informed Consent Statement
Data Availability Statement
Acknowledgments
Conflicts of Interest
References
- WHO. Obesity and Overweight. Available online: https://www.who.int/news-room/fact-sheets/detail/obesity-and-overweight (accessed on 16 September 2021).
- Kelly, T.; Yang, W.; Chen, C.S.; Reynolds, K.; He, J. Global burden of obesity in 2005 and projections to 2030. Int. J. Obes. 2008, 32, 1431–1437. [Google Scholar] [CrossRef] [PubMed] [Green Version]
- Carbone, S.; Canada, J.M.; Billingsley, H.E.; Siddiqui, M.S.; Elagizi, A.; Lavie, C.J. Obesity paradox in cardiovascular disease: Where do we stand? Vasc. Health Risk Manag. 2019, 15, 89–100. [Google Scholar] [CrossRef] [PubMed] [Green Version]
- De Pergola, G.; Silvestris, F. Obesity as a major risk factor for cancer. J. Obes. 2013, 2013, 291546. [Google Scholar] [CrossRef] [Green Version]
- Pischon, T.; Nimptsch, K. Obesity and Risk of Cancer: An Introductory Overview. Obes. Cancer 2016, 208, 1–15. [Google Scholar] [CrossRef]
- Kim, M.H.; Yun, K.E.; Kim, J.; Park, E.; Chang, Y.; Ryu, S.; Kim, H.L.; Kim, H.N. Gut microbiota and metabolic health among overweight and obese individuals. Sci. Rep. 2020, 10, 19417. [Google Scholar] [CrossRef]
- Romieu, I.; Dossus, L.; Barquera, S.; Blottière, H.M.; Franks, P.W.; Gunter, M.; Hwalla, N.; Hursting, S.D.; Leitzmann, M.; Margetts, B.; et al. Energy balance and obesity: What are the main drivers? Cancer Causes Control 2017, 28, 247–258. [Google Scholar] [CrossRef] [Green Version]
- Zeng, Q.; Yang, Z.; Wang, F.; Li, D.; Liu, Y.; Wang, D.; Zhao, X.; Li, Y.; Wang, Y.; Feng, X.; et al. Association between metabolic status and gut microbiome in obese populations. Microb. Genom. 2021, 7, 000639. [Google Scholar] [CrossRef] [PubMed]
- Davis, C.D. The Gut Microbiome and Its Role in Obesity. Nutr. Today 2016, 51, 167–174. [Google Scholar] [CrossRef] [PubMed] [Green Version]
- John, G.K.; Mullin, G.E. The Gut Microbiome and Obesity. Curr. Oncol. Rep. 2016, 18, 45. [Google Scholar] [CrossRef] [PubMed]
- Rinninella, E.; Raoul, P.; Cintoni, M.; Franceschi, F.; Miggiano, G.A.D.; Gasbarrini, A.; Mele, M.C. What is the Healthy Gut Microbiota Composition? A Changing Ecosystem across Age, Environment, Diet, and Diseases. Microorganisms 2019, 7, 14. [Google Scholar] [CrossRef] [Green Version]
- Ritari, J.; Salojärvi, J.; Lahti, L.; de Vos, W.M. Improved taxonomic assignment of human intestinal 16S rRNA sequences by a dedicated reference database. BMC Genom. 2015, 16, 1056. [Google Scholar] [CrossRef] [Green Version]
- Bäckhed, F.; Ding, H.; Wang, T.; Hooper, L.V.; Koh, G.Y.; Nagy, A.; Semenkovich, C.F.; Gordon, J.I. The gut microbiota as an environmental factor that regulates fat storage. Proc. Natl. Acad. Sci. USA 2004, 101, 15718–15723. [Google Scholar] [CrossRef] [Green Version]
- Ridaura, V.K.; Faith, J.J.; Rey, F.E.; Cheng, J.; Duncan, A.E.; Kau, A.L.; Griffin, N.W.; Lombard, V.; Henrissat, B.; Bain, J.R.; et al. Gut microbiota from twins discordant for obesity modulate metabolism in mice. Science 2013, 341, 1241214. [Google Scholar] [CrossRef] [Green Version]
- Ley, R.E.; Bäckhed, F.; Turnbaugh, P.; Lozupone, C.A.; Knight, R.D.; Gordon, J.I. Obesity alters gut microbial ecology. Proc. Natl. Acad. Sci. USA 2005, 102, 11070–11075. [Google Scholar] [CrossRef] [PubMed] [Green Version]
- Ley, R.E.; Turnbaugh, P.J.; Klein, S.; Gordon, J.I. Microbial ecology: Human gut microbes associated with obesity. Nature 2006, 444, 1022–1023. [Google Scholar] [CrossRef] [PubMed]
- Andoh, A.; Nishida, A.; Takahashi, K.; Inatomi, O.; Imaeda, H.; Bamba, S.; Kito, K.; Sugimoto, M.; Kobayashi, T. Comparison of the gut microbial community between obese and lean peoples using 16S gene sequencing in a Japanese population. J. Clin. Biochem. Nutr. 2016, 59, 65–70. [Google Scholar] [CrossRef] [PubMed] [Green Version]
- Borgo, F.; Garbossa, S.; Riva, A.; Severgnini, M.; Luigiano, C.; Benetti, A.; Pontiroli, A.E.; Morace, G.; Borghi, E. Body Mass Index and Sex Affect Diverse Microbial Niches within the Gut. Front. Microbiol. 2018, 9, 213. [Google Scholar] [CrossRef] [Green Version]
- Chávez-Carbajal, A.; Nirmalkar, K.; Pérez-Lizaur, A.; Hernández-Quiroz, F.; Ramírez-Del-Alto, S.; García-Mena, J.; Hernández-Guerrero, C. Gut Microbiota and Predicted Metabolic Pathways in a Sample of Mexican Women Affected by Obesity and Obesity Plus Metabolic Syndrome. Int. J. Mol. Sci. 2019, 20, 438. [Google Scholar] [CrossRef] [PubMed] [Green Version]
- Chen, J.; Ryu, E.; Hathcock, M.; Ballman, K.; Chia, N.; Olson, J.E.; Nelson, H. Impact of demographics on human gut microbial diversity in a US Midwest population. PeerJ 2016, 4, e1514. [Google Scholar] [CrossRef] [PubMed] [Green Version]
- Kasai, C.; Sugimoto, K.; Moritani, I.; Tanaka, J.; Oya, Y.; Inoue, H.; Tameda, M.; Shiraki, K.; Ito, M.; Takei, Y.; et al. Comparison of the gut microbiota composition between obese and non-obese individuals in a Japanese population, as analyzed by terminal restriction fragment length polymorphism and next-generation sequencing. BMC Gastroenterol. 2015, 15, 100. [Google Scholar] [CrossRef] [PubMed] [Green Version]
- Shreiner, A.B.; Kao, J.Y.; Young, V.B. The gut microbiome in health and in disease. Curr. Opin. Gastroenterol. 2015, 31, 69–75. [Google Scholar] [CrossRef] [PubMed]
- Bartolomaeus, T.U.P.; Birkner, T.; Bartolomaeus, H.; Löber, U.; Avery, E.G.; Mähler, A.; Weber, D.; Kochlik, B.; Balogh, A.; Wilck, N.; et al. Quantifying technical confounders in microbiome studies. Cardiovasc. Res. 2021, 117, 863–875. [Google Scholar] [CrossRef] [PubMed]
- Castaner, O.; Goday, A.; Park, Y.M.; Lee, S.H.; Magkos, F.; Shiow, S.T.E.; Schröder, H. The Gut Microbiome Profile in Obesity: A Systematic Review. Int. J. Endocrinol. 2018, 2018, 4095789. [Google Scholar] [CrossRef]
- Crovesy, L.; Masterson, D.; Rosado, E.L. Profile of the gut microbiota of adults with obesity: A systematic review. Eur. J. Clin. Nutr. 2020, 74, 1251–1262. [Google Scholar] [CrossRef]
- Barlow, G.M.; Yu, A.; Mathur, R. Role of the Gut Microbiome in Obesity and Diabetes Mellitus. Nutr. Clin. Pract. 2015, 30, 787–797. [Google Scholar] [CrossRef]
- Magne, F.; Gotteland, M.; Gauthier, L.; Zazueta, A.; Pesoa, S.; Navarrete, P.; Balamurugan, R. The Firmicutes/Bacteroidetes Ratio: A Relevant Marker of Gut Dysbiosis in Obese Patients? Nutrients 2020, 12, 1474. [Google Scholar] [CrossRef]
- Górowska-Kowolik, K.; Chobot, A. The role of gut microbiome in obesity and diabetes. World J. Pediatr. 2019, 15, 332–340. [Google Scholar] [CrossRef]
- Sierra, M.A.; Li, Q.; Pushalkar, S.; Paul, B.; Sandoval, T.A.; Kamer, A.R.; Corby, P.; Guo, Y.; Ruff, R.R.; Alekseyenko, A.V.; et al. The Influences of Bioinformatics Tools and Reference Databases in Analyzing the Human Oral Microbial Community. Genes 2020, 11, 878. [Google Scholar] [CrossRef] [PubMed]
- Moher, D.; Liberati, A.; Tetzlaff, J.; Altman, D.G. Preferred reporting items for systematic reviews and meta-analyses: The PRISMA statement. Int. J. Surg. 2010, 8, 336–341. [Google Scholar] [CrossRef] [Green Version]
- Sterne, J.A.; Hernán, M.A.; Reeves, B.C.; Savović, J.; Berkman, N.D.; Viswanathan, M.; Henry, D.; Altman, D.G.; Ansari, M.T.; Boutron, I.; et al. ROBINS-I: A tool for assessing risk of bias in non-randomised studies of interventions. BMJ 2016, 355, i4919. [Google Scholar] [CrossRef] [Green Version]
- Ozato, N.; Saito, S.; Yamaguchi, T.; Katashima, M.; Tokuda, I.; Sawada, K.; Katsuragi, Y.; Kakuta, M.; Imoto, S.; Ihara, K.; et al. Blautia genus associated with visceral fat accumulation in adults 20–76 years of age. NPJ Biofilms Microbiomes 2019, 5, 28. [Google Scholar] [CrossRef] [Green Version]
- Peters, B.A.; Shapiro, J.A.; Church, T.R.; Miller, G.; Trinh-Shevrin, C.; Yuen, E.; Friedlander, C.; Hayes, R.B.; Ahn, J. A taxonomic signature of obesity in a large study of American adults. Sci. Rep. 2018, 8, 9749. [Google Scholar] [CrossRef] [PubMed] [Green Version]
- Oduaran, O.H.; Tamburini, F.B.; Sahibdeen, V.; Brewster, R.; Gómez-Olivé, F.X.; Kahn, K.; Norris, S.A.; Tollman, S.M.; Twine, R.; Wade, A.N.; et al. Gut microbiome profiling of a rural and urban South African cohort reveals biomarkers of a population in lifestyle transition. BMC Microbiol. 2020, 20, 330. [Google Scholar] [CrossRef] [PubMed]
- Yasir, M.; Angelakis, E.; Bibi, F.; Azhar, E.I.; Bachar, D.; Lagier, J.C.; Gaborit, B.; Hassan, A.M.; Jiman-Fatani, A.A.; Alshali, K.Z.; et al. Comparison of the gut microbiota of people in France and Saudi Arabia. Nutr. Diabetes 2015, 5, e153. [Google Scholar] [CrossRef] [Green Version]
- Harrer, M.; Cuijpers, P.; Furukawa, T.A.; Ebert, D.D. Doing Meta-Analysis with R: A Hands-On Guide, 1st ed.; Chapman & Hall: Boca Raton, FL, USA; CRC Press: London, UK, 2021. [Google Scholar]
- Beaumont, M.; Goodrich, J.K.; Jackson, M.A.; Yet, I.; Davenport, E.R.; Vieira-Silva, S.; Debelius, J.; Pallister, T.; Mangino, M.; Raes, J.; et al. Heritable components of the human fecal microbiome are associated with visceral fat. Genome Biol. 2016, 17, 189. [Google Scholar] [CrossRef] [Green Version]
- Borges, F.M.; de Paula, T.O.; Sarmiento, M.R.A.; de Oliveira, M.G.; Pereira, M.L.M.; Toledo, I.V.; Nascimento, T.C.; Ferreira-Machado, A.B.; Silva, V.L.; Diniz, C.G. Fungal Diversity of Human Gut Microbiota among Eutrophic, Overweight, and Obese Individuals Based on Aerobic Culture-Dependent Approach. Curr. Microbiol. 2018, 75, 726–735. [Google Scholar] [CrossRef]
- Davis, J.A.; Collier, F.; Mohebbi, M.; Stuart, A.L.; Loughman, A.; Pasco, J.A.; Jacka, F.N. Obesity, Akkermansia muciniphila, and Proton Pump Inhibitors: Is there a Link? Obes. Res. Clin. Pract. 2020, 14, 524–530. [Google Scholar] [CrossRef]
- Davis, S.C.; Yadav, J.S.; Barrow, S.D.; Robertson, B.K. Gut microbiome diversity influenced more by the Westernized dietary regime than the body mass index as assessed using effect size statistic. Microbiologyopen 2017, 6, e00476. [Google Scholar] [CrossRef] [Green Version]
- De la Cuesta-Zuluaga, J.; Corrales-Agudelo, V.; Carmona, J.A.; Abad, J.M.; Escobar, J.S. Body size phenotypes comprehensively assess cardiometabolic risk and refine the association between obesity and gut microbiota. Int. J. Obes. 2018, 42, 424–432. [Google Scholar] [CrossRef]
- De la Cuesta-Zuluaga, J.; Corrales-Agudelo, V.; Velásquez-Mejía, E.P.; Carmona, J.A.; Abad, J.M.; Escobar, J.S. Gut microbiota is associated with obesity and cardiometabolic disease in a population in the midst of Westernization. Sci. Rep. 2018, 8, 11356. [Google Scholar] [CrossRef] [PubMed] [Green Version]
- Fei, N.; Bernabé, B.P.; Lie, L.; Baghdan, D.; Bedu-Addo, K.; Plange-Rhule, J.; Forrester, T.E.; Lambert, E.V.; Bovet, P.; Gottel, N.; et al. The human microbiota is associated with cardiometabolic risk across the epidemiologic transition. PLoS ONE 2019, 14, e0215262. [Google Scholar] [CrossRef] [Green Version]
- Finucane, M.M.; Sharpton, T.J.; Laurent, T.J.; Pollard, K.S. A taxonomic signature of obesity in the microbiome? Getting to the guts of the matter. PLoS ONE 2014, 9, e84689. [Google Scholar] [CrossRef] [Green Version]
- Gallè, F.; Valeriani, F.; Cattaruzza, M.S.; Gianfranceschi, G.; Liguori, R.; Antinozzi, M.; Mederer, B.; Liguori, G.; Romano Spica, V. Mediterranean Diet, Physical Activity and Gut Microbiome Composition: A Cross-Sectional Study among Healthy Young Italian Adults. Nutrients 2020, 12, 2164. [Google Scholar] [CrossRef] [PubMed]
- Gao, X.; Zhang, M.; Xue, J.; Huang, J.; Zhuang, R.; Zhou, X.; Zhang, H.; Fu, Q.; Hao, Y. Body Mass Index Differences in the Gut Microbiota Are Gender Specific. Front. Microbiol. 2018, 9, 1250. [Google Scholar] [CrossRef] [PubMed]
- Harakeh, S.; Angelakis, E.; Karamitros, T.; Bachar, D.; Bahijri, S.; Ajabnoor, G.; Alfadul, S.M.; Farraj, S.A.; Al Amri, T.; Al-Hejin, A.; et al. Impact of smoking cessation, coffee and bread consumption on the intestinal microbial composition among Saudis: A cross-sectional study. PLoS ONE 2020, 15, e0230895. [Google Scholar] [CrossRef]
- Kaplan, R.C.; Wang, Z.; Usyk, M.; Sotres-Alvarez, D.; Daviglus, M.L.; Schneiderman, N.; Talavera, G.A.; Gellman, M.D.; Thyagarajan, B.; Moon, J.Y.; et al. Gut microbiome composition in the Hispanic Community Health Study/Study of Latinos is shaped by geographic relocation, environmental factors, and obesity. Genome Biol. 2019, 20, 219. [Google Scholar] [CrossRef] [PubMed]
- Loftfield, E.; Herzig, K.H.; Caporaso, J.G.; Derkach, A.; Wan, Y.; Byrd, D.A.; Vogtmann, E.; Männikkö, M.; Karhunen, V.; Knight, R.; et al. Association of Body Mass Index with Fecal Microbial Diversity and Metabolites in the Northern Finland Birth Cohort. Cancer Epidemiol. Prev. Biomark. 2020, 29, 2289–2299. [Google Scholar] [CrossRef]
- Org, E.; Blum, Y.; Kasela, S.; Mehrabian, M.; Kuusisto, J.; Kangas, A.J.; Soininen, P.; Wang, Z.; Ala-Korpela, M.; Hazen, S.L.; et al. Relationships between gut microbiota, plasma metabolites, and metabolic syndrome traits in the METSIM cohort. Genome Biol. 2017, 18, 70. [Google Scholar] [CrossRef] [PubMed]
- Osborne, G.; Wu, F.; Yang, L.; Kelly, D.; Hu, J.; Li, H.; Jasmine, F.; Kibriya, M.G.; Parvez, F.; Shaheen, I.; et al. The association between gut microbiome and anthropometric measurements in Bangladesh. Gut Microbes 2020, 11, 63–76. [Google Scholar] [CrossRef]
- Patil, D.P.; Dhotre, D.P.; Chavan, S.G.; Sultan, A.; Jain, D.S.; Lanjekar, V.B.; Gangawani, J.; Shah, P.S.; Todkar, J.S.; Shah, S.; et al. Molecular analysis of gut microbiota in obesity among Indian individuals. J. Biosci. 2012, 37, 647–657. [Google Scholar] [CrossRef]
- Rahat-Rozenbloom, S.; Fernandes, J.; Gloor, G.B.; Wolever, T.M. Evidence for greater production of colonic short-chain fatty acids in overweight than lean humans. Int. J. Obes. 2014, 38, 1525–1531. [Google Scholar] [CrossRef] [PubMed] [Green Version]
- Salah, M.; Azab, M.; Ramadan, A.; Hanora, A. New Insights on Obesity and Diabetes from Gut Microbiome Alterations in Egyptian Adults. Omics 2019, 23, 477–485. [Google Scholar] [CrossRef] [PubMed]
- Thingholm, L.B.; Rühlemann, M.C.; Koch, M.; Fuqua, B.; Laucke, G.; Boehm, R.; Bang, C.; Franzosa, E.A.; Hübenthal, M.; Rahnavard, A.; et al. Obese Individuals with and without Type 2 Diabetes Show Different Gut Microbial Functional Capacity and Composition. Cell Host Microbe 2019, 26, 252–264.e210. [Google Scholar] [CrossRef] [PubMed]
- Verdam, F.J.; Fuentes, S.; de Jonge, C.; Zoetendal, E.G.; Erbil, R.; Greve, J.W.; Buurman, W.A.; de Vos, W.M.; Rensen, S.S. Human intestinal microbiota composition is associated with local and systemic inflammation in obesity. Obesity 2013, 21, E607–E615. [Google Scholar] [CrossRef] [PubMed]
- Vieira-Silva, S.; Falony, G.; Belda, E.; Nielsen, T.; Aron-Wisnewsky, J.; Chakaroun, R.; Forslund, S.K.; Assmann, K.; Valles-Colomer, M.; Nguyen, T.T.D.; et al. Statin therapy is associated with lower prevalence of gut microbiota dysbiosis. Nature 2020, 581, 310–315. [Google Scholar] [CrossRef] [PubMed]
- Whisner, C.M.; Maldonado, J.; Dente, B.; Krajmalnik-Brown, R.; Bruening, M. Diet, physical activity and screen time but not body mass index are associated with the gut microbiome of a diverse cohort of college students living in university housing: A cross-sectional study. BMC Microbiol. 2018, 18, 210. [Google Scholar] [CrossRef]
- Wilkins, L.J.; Monga, M.; Miller, A.W. Defining Dysbiosis for a Cluster of Chronic Diseases. Sci. Rep. 2019, 9, 12918. [Google Scholar] [CrossRef] [Green Version]
- Yun, Y.; Kim, H.N.; Kim, S.E.; Heo, S.G.; Chang, Y.; Ryu, S.; Shin, H.; Kim, H.L. Comparative analysis of gut microbiota associated with body mass index in a large Korean cohort. BMC Microbiol. 2017, 17, 151. [Google Scholar] [CrossRef] [Green Version]
- Walters, W.A.; Xu, Z.; Knight, R. Meta-analyses of human gut microbes associated with obesity and IBD. FEBS Lett. 2014, 588, 4223–4233. [Google Scholar] [CrossRef] [Green Version]
- Sze, M.A.; Schloss, P.D. Looking for a Signal in the Noise: Revisiting Obesity and the Microbiome. MBio 2016, 7, e01018-16. [Google Scholar] [CrossRef] [PubMed] [Green Version]
- Su, H.; Wang, W.J.; Zheng, G.D.; Yin, Z.P.; Li, J.E.; Chen, L.L.; Zhang, Q.F. The anti-obesity and gut microbiota modulating effects of taxifolin in C57BL/6J mice fed with a high-fat diet. J. Sci. Food Agric. 2021. [Google Scholar] [CrossRef] [PubMed]
- Shahinozzaman, M.; Raychaudhuri, S.; Fan, S.; Obanda, D.N. Kale Attenuates Inflammation and Modulates Gut Microbial Composition and Function in C57BL/6J Mice with Diet-Induced Obesity. Microorganisms 2021, 9, 238. [Google Scholar] [CrossRef] [PubMed]
- Chakraborti, C.K. New-found link between microbiota and obesity. World J. Gastrointest. Pathophysiol. 2015, 6, 110–119. [Google Scholar] [CrossRef]
- Hou, Y.P.; He, Q.Q.; Ouyang, H.M.; Peng, H.S.; Wang, Q.; Li, J.; Lv, X.F.; Zheng, Y.N.; Li, S.C.; Liu, H.L.; et al. Human Gut Microbiota Associated with Obesity in Chinese Children and Adolescents. BioMed Res. Int. 2017, 2017, 7585989. [Google Scholar] [CrossRef]
- Zacarías, M.F.; Collado, M.C.; Gómez-Gallego, C.; Flinck, H.; Aittoniemi, J.; Isolauri, E.; Salminen, S. Pregestational overweight and obesity are associated with differences in gut microbiota composition and systemic inflammation in the third trimester. PLoS ONE 2018, 13, e0200305. [Google Scholar] [CrossRef] [Green Version]
- Anand, S.; Kaur, H.; Mande, S.S. Comparative In silico Analysis of Butyrate Production Pathways in Gut Commensals and Pathogens. Front. Microbiol. 2016, 7, 1945. [Google Scholar] [CrossRef] [Green Version]
- Duvallet, C.; Gibbons, S.M.; Gurry, T.; Irizarry, R.A.; Alm, E.J. Meta-analysis of gut microbiome studies identifies disease-specific and shared responses. Nat. Commun. 2017, 8, 1784. [Google Scholar] [CrossRef] [Green Version]
- Konikoff, T.; Gophna, U. Oscillospira: A Central, Enigmatic Component of the Human Gut Microbiota. Trends Microbiol. 2016, 24, 523–524. [Google Scholar] [CrossRef] [PubMed]
- Rosés, C.; Cuevas-Sierra, A.; Quintana, S.; Riezu-Boj, J.I.; Martínez, J.A.; Milagro, F.I.; Barceló, A. Gut Microbiota Bacterial Species Associated with Mediterranean Diet-Related Food Groups in a Northern Spanish Population. Nutrients 2021, 13, 636. [Google Scholar] [CrossRef]
- Hiergeist, A.; Reischl, U.; Gessner, A. Multicenter quality assessment of 16S ribosomal DNA-sequencing for microbiome analyses reveals high inter-center variability. Int. J. Med. Microbiol. 2016, 306, 334–342. [Google Scholar] [CrossRef] [Green Version]
- Tremblay, J.; Singh, K.; Fern, A.; Kirton, E.S.; He, S.; Woyke, T.; Lee, J.; Chen, F.; Dangl, J.L.; Tringe, S.G. Primer and platform effects on 16S rRNA tag sequencing. Front. Microbiol. 2015, 6, 771. [Google Scholar] [CrossRef] [PubMed] [Green Version]
- Clooney, A.G.; Fouhy, F.; Sleator, R.D.; O’Driscoll, A.; Stanton, C.; Cotter, P.D.; Claesson, M.J. Comparing Apples and Oranges?: Next Generation Sequencing and Its Impact on Microbiome Analysis. PLoS ONE 2016, 11, e0148028. [Google Scholar] [CrossRef] [PubMed]
- Sinha, R.; Abu-Ali, G.; Vogtmann, E.; Fodor, A.A.; Ren, B.; Amir, A.; Schwager, E.; Crabtree, J.; Ma, S.; Abnet, C.C.; et al. Assessment of variation in microbial community amplicon sequencing by the Microbiome Quality Control (MBQC) project consortium. Nat. Biotechnol. 2017, 35, 1077–1086. [Google Scholar] [CrossRef] [Green Version]
- Stämmler, F.; Gläsner, J.; Hiergeist, A.; Holler, E.; Weber, D.; Oefner, P.J.; Gessner, A.; Spang, R. Adjusting microbiome profiles for differences in microbial load by spike-in bacteria. Microbiome 2016, 4, 28. [Google Scholar] [CrossRef] [Green Version]
- Vandeputte, D.; Kathagen, G.; D’Hoe, K.; Vieira-Silva, S.; Valles-Colomer, M.; Sabino, J.; Wang, J.; Tito, R.Y.; De Commer, L.; Darzi, Y.; et al. Quantitative microbiome profiling links gut community variation to microbial load. Nature 2017, 551, 507–511. [Google Scholar] [CrossRef]
- Agnihotry, S.; Sarangi, A.N.; Aggarwal, R. Construction & assessment of a unified curated reference database for improving the taxonomic classification of bacteria using 16S rRNA sequence data. Indian J. Med. Res. 2020, 151, 93–103. [Google Scholar] [CrossRef] [PubMed]
- Marcon, Y.; Bishop, T.; Avraam, D.; Escriba-Montagut, X.; Ryser-Welch, P.; Wheater, S.; Burton, P.; González, J.R. Orchestrating privacy-protected big data analyses of data from different resources with R and DataSHIELD. PLoS Comput. Biol. 2021, 17, e1008880. [Google Scholar] [CrossRef] [PubMed]


| Study ID | Country | Study Design Study Population (Recruitment Process and Ethnicity) | Sample Size (Age, Sex) 1,2 | Obesity and Comparators (Definition, BMI Mean ± SD [Range]) 1,2 | Stool Sample Collection Method and Storage | DNA Extraction Method (Region Amplified) Database Used | Sequencing Platform | RoB 3,4 |
|---|---|---|---|---|---|---|---|---|
| Andoh 2016 [17] | Japan | Cross-sectional Volunteers | 20 10 O; 10 L Age (31–58 y); 10 ♂ and 10 ♀ | O: 38.1 ± 3.5 kg/m2 [35.7–49.2] L: 16.6 ±1.0 kg/m2) [14.2–17.7] | NR | FastPrep FP100A Instrument Primers used: 341 F and 806 R 16S (V3–V4) Techno-Suruga lab microbial identification Database DB-BA 9.0 | Illumina MiSeq | S |
| Beaumont 2016 [37] | UK | Cross-sectional Healthy volunteers predominantly female twins from the TUK-D 5 | 1313: 496 MZ, 594 DZ and 223 unrelated individuals; average age 63 y (range 32–87); 96.4% ♀. | BMI; abdominal adiposity; VFM 21, (SFM 22, % pTF 23, AGR 24 and WHR 25). High and low groups: >1.5SD from the mean of the phenotype | Samples refrigerated or kept on ice for 1–2 days prior to arriving at the laboratory and stored max 8 weeks at −80 °C | DNA extraction method not reported Primers used: 515F and 806R 16S (V4). Greengenes May 2013 database | Illumina MiSeq | S |
| Borges 2018 [38] | Brazil | Cross-sectional Selected from a clinic nutrition service at the UFJF 6 teaching hospital and from the community (city of Juiz de Fora, MG, Brazil) | 72 average age 39.61 y (range 18–60 y) | Eutrophic, OW, or O in accordance with their BMI | Collected in sterile vials given to the participants and sent immediately to the research laboratory for analysis | Fast DNA Spin Kit (MP Biomedicals, Illkirch, France). 18S rDNA using the universal primers (FungiQuant-F and FungiQuant-R) NCBI 35 nucleotide database | ABI Prism 3730 DNA sequencer (Applied Biosystems, San Francisco, CA, USA) | S |
| Borgo 2018 [18] | Italy | Cross-sectional Participants that underwent a screening colonoscopy for preventive purpose between January 2015 and January 2016 at the Department of the ASST Santi Paolo e Carlo of Milan | 40 20 NW (♂: 48.7 y ± 10.2; ♀: 51:7 y ± 8.3); 20 O (♂: 53.8 y ± 7.7; ♀: 51.3 y ± 6.7) | O: BMI > 30 (35.8 ± 8.3) L: BMI < 25 (22.8 ± 1.8) | Collected 3 weeks after the colonoscopy and stored at −80 °C | QIAamp DNA Microbiome Kit (QIAGEN, Hilden, Germany). 16S (region NR). Greengenes bacterial database | Illumina MiSeq | S |
| Chavez-Carbajal 2019 [19] | Mexico | Cross-sectional Volunteer women from among people attending the Nutrition Clinic at the Universidad Iberoamericana in Mexico City | 67 ♀ (25 control (mean age 23.3 y, SD 3.1), 17 obese (mean age 38.8, SD 8.4), 25 obese plus MetS (mean age 40.5 y, SD 10.3)) | O class I: 30–34.99 kg/m2; O class II 35–39.99 kg/m2, O class III ≥ 40 kg/m2; NW: 18.5–24.99 kg/m2 | Collected in a sterile stool container, aliquoted, and stored at −78 °C | ZR Fecal DNA MiniPrep™ (Zymo Research, Irvine, CA, USA) 16S (V3) Greengenes database (v 13.8) | 316 Chip Kit v2 and the Ion Torrent PGMTM System | S |
| Chen 2016 [20] | USA | Cross-sectional Mayo Clinic Biobank (patient medical records and patient-provided risk factor data) representative of the Midwestern US based on age, sex, race, BMI, smoking status and alcohol | 118 ♂/♀ 58/60; Age ≥ 50 y 60/118 | O: BMI ≥ 30 kg/m2 NO: BMI < 30 kg/m2 | Collected by the subjects and returned to Mayo Clinic Rochester within 24 h, and stored at −80 °C | PowerSoil kit (MoBio, Carlsbad, CA, USA) according to the manufacturer’s instructions. 16S (V3–V5) RDP 36 | Illumina MiSeq | M |
| Davis 2016 [40] | USA | Cross-sectional Randomly selected within the state of Alabama | 81 Age (33 ± 13.3 y), ♀ (45/81, 56%) | BMI cut-offs not reported, but O, OW and N-UW mentioned in results; overall mean BMI in kg/m2 (28.3 ± 7.01) | Collected using the Fisher Scientific Commode Specimen Collection System and placed into a Fisher Scientific C & S ParaPak | Zymo ZR Fecal DNA MiniPrep™ Isolation Kit. 16S (V4) Database NR | Illumina MiSeq | S |
| Davis 2020 [39] | Australia | Cross-sectional (15th follow-up) Ongoing prospective cohort GOS 7 study. A random sample of adults reflecting the various cultural and socio-economic backgrounds in the region of South East Australia | 158 Ages ranged from 34.2 to 92.2 y, with a mean of 65.9 y. | High FMI 26: FMI 26 ≥ 5.9 kg/m2 low FMI 26: FMI 26 < 5.9 kg/m2 | Omnigene® gut stool home collection. Samples were well mixed with the proprietary nucleic acid protective solution, aliquoted and frozen at −80 °C | QIAamp DNA mini kit (QIAGEN, Manchester, UK). Universal primers: 341-Forward and 806-Reverse 16S (V3–V4) Greengenes database | Illumina MiSeq | S |
| De la Cuesta-Zuluaga 2018 [41,42] (ref. [41] as the main study) | Colombia | Cross-sectional Adults enrolled in July–November 2014, with BMI ≥ 18.5 kg m−2, living in five Colombian cities. Participants were enrolled in similar proportions by BMI, city, sex and age | 441 (NW: 138; OW 171; OB: 132) sex and age range (18–40 and 41–62 y). N (%), age (mean ± SD): NW healthy 91 (66%), 36.8 ± 10.6 y, 45.1%♂; NW abnormal 47 (34%), 43.3 ± 11.8 y, 46.8%♂: OW healthy 60 (35%), 38.4 ± 10.8 y, 43.3%♂: OW abnormal 111 (65%), 41.5 ± 10.9 y, 56.8%♂: O healthy 21 (16%), 43.1 ± 8.8 y, 28.6%♂: O abnormal 111 (84%), 42.7 ± 11.1 y, 48.6%♂ | O: BMI ≥ 30.0 kg/m2 OW: 25.0 ≤ BMI < 30.0 kg/m2 NW: 18.5 ≤ BMI < 25.0 kg/m2 | Sample in a hermetically sealed sterile receptacle, immediately refrigerated in household freezers and brought to a facility within 12 h and stored in dry ice and sent to a central laboratory | DNA was extracted using the QIAamp DNA Stool Mini Kit. Primers: F515 and R806 16 S (V4) Greengenes database (v 13.8) | Illumina MiSeq | S |
| Fei 2019 [43] | USA and African countries (Ghana, Jamaica and South Africa) | Cross-sectional African-origin adults (25–45 yrs) enrolled in METS 8 between 01/2010 and 12/2011 and followed yearly. Men and women from Ghana (n = 196), South Africa (n = 176), Jamaica (n = 92) and the US (n = 191) were collected in 2014 | 655 (L = 277; OW = 149; O = 229) Approx. 60% ♀. Aged 34.9 ± 6.4 y. Participants from South Africa and Jamaica were significantly younger than US participants (p < 0.001 and p = 0.016, respectively) | O: BMI ≥ 30 kg/m2 OW: 25.0 ≤ BMI < 30.0 kg/m2 L: BMI < 25 kg/m2 Results stratified by high and low WC 27: High WC 27 >102 cm in ♂ and >88 cm in ♀ | Standard collection kit, brought to the site clinics and stored at −80 °C | DNeasy PowerSoil DNA Isolation Kit (Qiagen). 16 S (V4). Greengenes database (v 13.8) | Illumina MiSeq | M |
| Finucane 2014 [44] | USA (HMP study); Denmark and Spain (MetaHIT) | Cross-sectional HMP 9: Obese and non-obese adults living in Houston and Saint Louis; MetaHIT 10: A large survey of healthy obese and non-obese adults | HMP: (212 MetaHIT: 70) | HMP 9: O: BMI ≥ 30 L: BMI ≤ 25 MetaHIT 10: NR, just mentioned healthy O and NO adults | NR | DNA extraction method not reported. HMP 9: 16S (V1–V3 & V3–V5) MetaHIT 10: 16S GreenGenes database | HMP 9: Illumina GAIIx; MetaHIT 10: Illumina GA | S |
| Gallè 2020 [45] | Italy | Cross-sectional Students attending the University of Naples “Parthenope” and University of Rome “La Sapienza” | 140 (UW: 7; NW: 106; OW: 24; O: 3) (48.6% ♂, mean age 22.5 ± 2.9 y) | BMI categories as defined by the WHO standards | Fecal swabs. Samples stored at 4–8 °C in a refrigerated container and were taken within 24 h | NR Shotgun metagenomics Greengenes database | Libraries for NGS 39 following the 16S Metagenomic Sequencing Library Preparation Guide (Illumina, San Diego, CA, USA) | S |
| Gao 2018 [46] | China | Cross-sectional Volunteers (information on recruitment NR) | 551 | WHO Asian BMI cut points O: ≥27.5 kg/m2; OW: 23–27.5 kg/m2; NW: 18.5–23 kg/m2; UW: <18.5 kg/m2 | Self-collected by the volunteers using a 1.5 mL vial containing 1.0 mL inhibit EX Buffer. Samples shipped within 72 h of collection | QIAamp Fast DNA Stool Mini Kit (Qiagen, Stockach, Germany), following recommendations of the IHMS 34 guidelines. Universal primer set 341F/806R 16S (V3–V4). Greengenes database (v 13.8) | Illumina MiSeq | S |
| Harakeh 2020 [47] | Saudi Arabia | Cross-sectional Conducted between January 2015 and December 2015 on healthy adults of both genders, aged 18–55 years on students (including family members and friends) from King Abdulaziz University Medical campus | 104 volunteers: UW = 21; NW = 31; OW = 28; O = 24 48% ♂ with median age ± IR was 24 ± 7.7 y | WHO criteria, BMI categories: O > 30 kg/m2, OW 25–30 kg/m2, NW 20–25 kg/m2, UW 18–20 kg/m2 | Collected in aseptic conditions and immediately stored at −20 °C | NucleoSpin1 Tissue Mini Kit (Macherey Nagel, Hoerdt, France). 16S (V3–V4). SILVA123 SSU database | Illumina MiSeq | S |
| Kaplan 2019 [48] | USA | Cross-sectional HCHS/SOL a prospective, population-based cohort study of 16,415 Hispanic/Latino adults (aged 18–74 years, recruited in 2008–2011) selected using a two-stage probability sampling design from randomly sampled census block areas within four US communities (Chicago, IL; Miami, FL; Bronx, NY; San Diego, CA) | 1674 | O class I: 30–35 kg/m2 O class II: 35–40 kg/m2, O class III: >40 kg/m2; OW: 25–30 kg/m2, NW: 18.5 to 25 kg/m2 | Plastic applicator into a supplied container with a stabilizer and 0.5-mm-diameter glass beads to mix stool and preservative. Aliquots frozen at −80 °C | Qiagen MagAttract PowerSoil DNA kit. 16S (V4) & ITS1 (Fungi). Greengenes 13_8 UNITE reference Database (Fungi) | Illumina MiSeq | M |
| Kasai 2015 [21] | Japan | Cross-sectional Subjects aged <65 years who had undergone colonoscopy at Mie Prefectural General Medical Center, Yokkaichi, Japan, between 2012 and 2013 | 56 (23 non-obese and 33 obese adults). Sex, male 30/56 (54%). Age mean ± SD (NO: 45.6 ± 9.6 y; O: 54.4 ± 8.2 y (p < 0.001)) | O: ≥25 kg/m2, (n = 33) L: <20 kg/m2, (n = 23) | Collected prior to bowel preparation for colonoscopy. Stored at 4 °C after collection | MagDEA DNA 200 (GC) (Precision System Science). 16S (V3–V4). Apollon DB-BA database, ver 9.0 (TechnoSuruga Laboratory) | Illumina MiSeq | S |
| Loftfield 2020 [49] | Finland | Birth Cohort The NFBC 1966 included 12,055 expectant mothers within two Finnish provinces, Oulu and Lapland, with expected delivery dates during 1966. They were followed up to age 46 years | 563; (Group 1: n = 167; Group 2: n = 167; Group 3: n = 163; Group 4: n = 66) 217 (38.5% ♂) | BMI at age 46 y: O: BMI ≥ 30 kg/m2 OW: 25.0 ≤ BMI < 30.0 kg/m2 NW: 18.5 ≤ BMI < 25.0 kg/m2 | Collected at home, immediately frozen at −20 °C, brought to the study laboratory, and frozen without preservative in −70 °C | MO-BIO PowerSoil DNA isolation kit. barcoded 515F/806R primers 16S (V4) Greengenes database (v 13.8) | Illumina MiSeq | M |
| Oduaran 2020 [34] | South Africa | Cross-sectional Nested in the AWI-Gen project (part of the H3Africa 11). Recruited at two sites—the Bushbuckridge area within the Agincourt HDSS, Mpumalanga (rural) and Soweto, Johannesburg, Gauteng (urban) | 170 HIV-negative women (51 at Soweto; 119 at Bushbuckridge). Age range of 43–72 y | O: BMI ≥ 30 kg/m2 OW: 25 ≤ BMI < 30 kg/m2 L: BMI < 25 kg/m2 | DNA Genotek®’s OMNIgene microbial collection and stabilization kit and sent to the laboratory, aliquoted and frozen at −80 °C | DNA was extracted using Qiagen®’s QIAmp. 16S (V3–V4). RDP 36 | Illumina MiSeq | M |
| Org 2017 [50] | Finland | Cross-sectional Ongoing population-based METSIM 12 study, a randomly selected cohort of unrelated men from the population register of Kuopio in Eastern Finland (pop. 95,000) | 531 (aged 45–70 y) | O: BMI > 30 NO: BMI < 25 | Collected during evaluation at the hospital and immediately stored at −80 °C | PowerSoil DNA Isolation Kit (MO BIO Laboratories, Carlsbad, CA, USA). 16S (V4) Greengenes database (v 13.8) | Illumina MiSeq | S |
| Osborne 2020 [51] | Bangladesh | Cross-sectional Ongoing, prospective HEALS 13 (11,746 married adults, 18–75 years old), recruited from October 2000 to May 2002. For the present study, randomly selected 400 HEALS 13 participants residing in 6 villages aged 25–50 y free from any major illness | 250 mean age (mean ± SD): 48.6 ± 7.9 y 41% ♂ | O: BMI ≥ 30 kg/m2 OW: 25.0 ≤ BMI < 30.0 kg/m2 NW: 18.5 ≤ BMI < 25.0 kg/m2 UW: BMI < 18.5 kg/m2 | Collected in ThermoFisher Scientific vial, stored in a −20 °C freezer | MOBIO PowerSoil DNA Isolation Kit (MO BIO Laboratories, Carlsbad, CA, USA) 16S (V3–V4). Greengenes database (v 13.8) | Illumina MiSeq | M |
| Ozato 2019 [32] | Japan | Cross-sectional Iwaki Health Promotion Project launched in 2005 an annual health check-up for local residents living in the Iwaki region of Hirosaki City, Aomori Prefecture. Data obtained from the 2015 health checkup and a confirmation group from the 2016 health check (not in the 2015 one) | 1001 (391 ♂, 610 ♀; mean age ± SD: 51.2 ± 14.1 y ♂, 54.2 ± 13.7 y ♀). Confirmation group: 326 (62% ♀, mean age 50.7 ± 17.5 y) | O: BMI ≥ 30 kg/m2 OW: 25 ≤ BMI < 30 kg/m2 NW: 20 ≤ BMI < 25 kg/m2 UW: BMI < 20 kg/m2 4 groups: VFA 28 < 50, 50 ≤ VFA < 100, 100 ≤ VFA 28 < 150, VFA 28 ≥ 150 | Collected using a commercial tube kit and cotton swabs within 3 days prior to the study, and stored at 4 °C | Bead-treated suspension using an automatic nucleic acid extractor (Precision System Science, Chiba, Japan). MagDEA DNA 200 (GC) reagent kit (Precision System Science) used for automatic nucleic acid. 16S (V3–V4). Database NR | Illumina MiSeq | M |
| Patil 2012 [52] | India | Cross-sectional Healthy individuals of Indian origin (21–62 years old) irrespective of gender | 20 (5 individuals/group) Median age in years: L (age: 23 y), NW (age: 44 y), O (age: 45 y), O (treated) (age: 50 y) | O: 25–53 kg/m2, n = 5, O (treated): 25–36 kg/m2, regressing to normal BMI after SG 29 and AGB 30 surgeries. NW: 18–24 kg/m2, n = 5, L: BMI < 19 kg/m2, n = 5 | Collected from unrelated healthy individuals. Stored at 4 °C and transported to laboratory on ice, and processed immediately or stored at −80 °C | QIAamp DNA Stool Mini Kit (Qiagen) with an additional step of bead beating using a mix of silica beads. 16S (V1–V4) RDP-II 36 database | ABI 3730 (Sanger sequencing) | S |
| Peters 2018 [33] | USA | Cross-sectional Two independent study populations based at colonoscopy clinics: the CDC 14 study, and the NYU 15 study. Predominantly white (94%) | 599 (423 from CDU and 176 from NY study) Aged (62 ± 7 y) | O: BMI ≥ 30 kg/m2 OW: 25.0 ≤ BMI < 30.0 kg/m2 NW: 18.5 ≤ BMI < 25.0 kg/m2 | Beckman Coulter Hemoccult II SENSA® cards at home. Mailed to a laboratory for fecal occult blood testing. Samples refrigerated at 4 °C, and stored at −80 °C | PowerLyzer PowerSoil Kit (Mo Bio Laboratory Inc., CA) following manufacturer’s protocol. 16S (V4) Broad Institute Microbiome Utilities microbiomeutil-r20110519 database | Illumina MiSeq | M |
| Rahat-Rozenbloom 2014 [53] | Canada | Cross-sectional ♂ or non-pregnant, non-lactating ♀ aged > 17 years recruited via advertisements (University of Toronto campus) and from a pool of subjects previously involved in studies by their group | 22 L (35.8± 4.2 y); OW (42.5 ± 3.9 y) | OW: BMI > 25 L: BMI ≤ 25 | Plastic bag using the Fisher brand commode specimen collection system. Styrofoam box full of dry ice kept at −20 °C | DNA extraction method (Petrof EO et al., Microbiome 2013; 1:3) 16S (V6). Database NR | Ion Torrent sequencing | S |
| Salah 2019 [54] | Egypt | Cross-sectional Adult patients with obesity and diabetes in a population sample from El-Sharkia governate in North East Egypt | 60; age (43.95 ± 13.35 y), gender (31 ♂, 29 ♀); 5 (C), 25 (O), 5 (D), and 25 (OD) | O: BMI 31 to 49 kg/m2 NW: 19–25 kg/m2 | NR | QIAamp PowerFecal DNA Kit. 16S (V3–V4). SILVA SSU Ref NR dataset v.132 (OTUs), Greengenes (v 13.8), KEGG 37, KO 38 Database at level 2 and level 3 | Illumina MiSeq | S |
| Thingholm 2019 [55] | Germany | Cross-sectional Individuals from the northern German cohorts PopGen 16 (n = 436) and FoCus 17 (n = 844) | 1280 (L = 633; O = 494; OT2D = 153) | O: BMI >30 no T2D 31 OT2D: BMI >30 with T2D 31 L: BMI < 25 no T2D 31 | NR | QIAamp DNA Stool Mini Kit from QIAGEN. 16S (V1–V2). RDP 36 database (16S) HUMAnN2 v0.11.1 (Shotgun) | Illumina MiSeq (16S); Illumina HiSeq (shotgun) | M |
| Verdam 2013 [56] | The Netherlands | Cross-sectional From May to September 2010, adults recruited through advertising at the Atrium Medical Center Parkstad in Heerlen, The Netherlands | 28 Non-obese (n = 13): 9 lean and 4 were OW. Obese (n = 15): 9 were morbid obese. Aged 19–54 years. Sex F:M = 20:8 | O: BMI range 30.5–60.3 kg/m2; morbid O: BMI > 40 kg/m2 (range 40.4–60.3 kg/m2); OW: BMI range 25.2–29.6 kg/m2; L: BMI range 18.6–24.6 kg/m2 | Collected feces 24 h prior to the intestinal permeability test, kept refrigerated until test, and stored in aliquots at −20 °C | QIAamp Stool Kit by Qiagen 16S (region NR). HITChip specific database | HITChip, a phylogenetic profiling DNA microarray. Data extracted using the Agilent Feature Extraction | S |
| Vieira-Silva 2020 [57] | France Germany, Denmark | Cross-sectional BMIS 18 cohort was part of the overall MetaCardis recruitment (2013–2015) in several clinical departments 19 | 888 (NO (n = 414) versus O (n = 474)). Median age 54 [18–76} y; 574 ♀ and 314 ♂ | O: BMI ≥ 30 NO: BMI < 30 | Collected according to the IHMS 34 guidelines (modified SOP 04 V1 (collection without anaerobic bag)). Stored (less than 48 h) at −20 °C | DNA extracted following the IHMS guidelines (SOP 07 V2 H) Shotgun metagenomics NCBI 35 database (November 2016 version) | Ion proton system | S |
| Whisner 2018 [58] | USA | Cross-sectional Students from a larger study in two residence halls at Arizona State University in Tempe, Arizona (Fall 2014 and Spring 2015 semesters). 31.7% Hispanic; 39.0% White; 29.3% Other | 82 (UW (5); NW (47); OW (18); O (12)). 57.3% ♀; age mean ± SD; 18.4 ± 0.6 y | O: BMI ≥ 30.0 kg/m2 OW: 25.0 ≤ BMI < 30.0 kg/m2 NW: 18.5 ≤ BMI < 25.0 kg/m2 UW: BMI < 18.5 kg/m2 | Collection kit in small insulated cooler bags containing ice packs to be frozen immediately for 36–48 h in an insulated container. Samples delivered to the facility within 24 h of collection, and stored at −80 °C | PowerSoil DNA isolation kit as described by the manufacturer (MoBio Laboratories Ltd., Carlsbad, CA, USA) using a beadbeater (BioSpec, Bartlesville, OK, USA). 16S (V4). Greengenes database | Illumina MiSeq | S |
| Wilkins 2019 [59] | USA | Cross-sectional (retrospective) American Gut Project data (2012–2017) | 600 (300 H; 300 O) | Chronic disease state: if “diagnosed” for CVD 32, diabetes, or KD 33, or with “obese” for BMI. Health status based on self-reported medical diagnoses. Healthy: “I do not have this condition” entry for diabetes, CVD 32, and KD 33, as well as “normal” for BMI | Samples collected (December 2012 and April 2017) from individuals from a global population | Method of DNA extraction NR 16S (region NR) Greengenes database (v 13.8) | NR | S |
| Yasir 2015 [35] | France and Saudi Arabia | Cross-sectional Volunteers from France and SA 20 living in urban areas | France: 28 (O (12) 58%♂; NW (16) 44%♂) SA 20: 18 (O (9); NW (9)). All ♂ Age mean ± SD: NW (France): 34 ± 5 y NW (SA 20): 28 ± 4 y O (France): 39 ± 13 y O (SA 20): 26 ± 3 y | O: BMI > 30 kg/m2 NW: BMI 20–25 kg/m2 | Stool samples collected under aseptic conditions with clean, dry screw-top containers immediately stored at −20 °C | NucleoSpin Tissue Mini Kit (Macherey Nagel, Hoerdt, France). Primers: FwOvAd_341F and ReOvAd_785R 16S (V3–V4). SILVA SSU database | Illumina MiSeq | S |
| Yun 2017 [60] | Korea | Cross-sectional Kangbuk Samsung Health cohort study: men and women who underwent an annual or biennial examination at Kangbuk Samsung Hospital (June–September 2014) | 1274 (NW (529); OW (326); O (419)); age 45.7 (9.0) y; sex, ♂: 63.7% | Revised Asia-Pacific BMI criteria by the WHO Western Pacific Region: O: BMI ≥ 25 OW: 23 ≤ BMI < 25 NW: 18.5 ≤ BMI < 23 | NR | MO-BIO PowerSoil DNA Isolation Kit according to the manufacturer’s instructions. 16S (V3–V4). Greengenes database (v 13.8) | Illumina MiSeq | M |
| Study ID (Author, Year) | Comparison Groups 1 | Alpha Diversity Method 2 | Alpha Diversity and Richness 1,2 | Beta Diversity Method | Beta Diversity |
|---|---|---|---|---|---|
| Andoh 2016 [17] | O vs. L | Shannon index | Significantly lower in O (2.40 ± 0.17) vs. L (2.80 ± 0.14) p < 0.01 | PCA 3 | PCA 3 at phylum level showed different distribution of O and L peoples |
| Beaumont 2016 [37] | High vs. Low BMI | Shannon index | Significantly lower in high vs. low BMI (p = 0.0001) | — | — |
| Borges 2018 [38] | — | — | — | — | — |
| Borgo 2018 [18] | O vs. NW | Shannon index, observed species and Faith’s PD | Significantly lower α-diversity (PD) in O vs. n (p < 0.01). Shannon index and observed species are not reported by BMI group | Weighted and unweighted UniFrac 4 metrics and PCoA 5 Bray–Curtis distances | No separation was obtained between O and NW subjects (p > 0.05). Significant separation in LAM 7 samples between NW and O was observed |
| Chavez-Carbajal 2019 [19] | O vs. OMS vs. NW | Shannon index, Simpson index, Chao1, observed species. | Shannon index: no significant difference between groups O: 6.61 ± 0.36 OMS: 6.56 ± 0.38 NW: 6.32 ± 0.46 O vs. NW (p = 0.17) OMS vs. NW (p = 0.09) Simpson index: no significant difference between groups O: 0.97 ± 0.01 OMS: 0.97 ± 0.01 NW: 0.97 ± 0.02 O vs. NW (p = 0.28) OMS vs. NW (p = 0.52) Chao1 index: significantly higher in O vs. NW O: 787.1 ± 137.8 OMS: 769.4 ± 101.7 NW: 583.5 ± 87.8 OMS vs. NW (p = 0.003) O vs. NW (p = 0.002) | Unweighted UniFrac 4 analysis, PCoA 5 | For the unweighted, PCoA 4 analysis clearly grouped the O and OMS separating them from the NW (ANOSIM 8; p = 0.01). Weighted analysis showed a similar result (ANOSIM 8, p = 0.01) |
| Chen 2016 [20] | — | Shannon index | NR by BMI groups | unweighted and weighted UniFrac 4 distances | NR by BMI groups |
| Davis 2016 [40] | O vs. OW vs. NW | Simpson’s Index of Diversity, Chao1, Shannon index Effective Number of Species | Shannon index Effective Number of Species: No significant differences reported O: 228.2 ± 134.1 OW: 218.1 ± 134.2 NW: 179.9 ± 103.1 p = not reported Chao1 and Simpson’s Index NR | — | — |
| Davis 2020 [39] | High FMI vs. Low FMI | Shannon index, Fishers index, Chao 1, Observed species | The alpha diversity and richness indices were lower in the high versus low FMI 1 group: Shannon index: no significant differences (data not shown) Fisher index: no significant differences (MD −6.2, 95%CI −12.7, 0.4; p = 0.065). Chao1 index: significantly lower in high vs. low FMI (MD −46.1, 95%CI −90.2, −2.0; p = 0.040); Observed species: significantly lower in high vs. low FMI (MD −46.1, 95%CI −86.5, −5.7; p = 0.026) | — | — |
| De la Cuesta-Zuluaga 2018 [41,42] | O vs. OW vs. L | Shannon index and number of observed OTUs | Shannon index: significant differences (lower in O/OW vs. L) O: 3.1 ± 0.7 OW: 3.0 ± 0.7 L: 3.2 ± 0.7 p = 0.04 # observed OTUs: significant differences (lower in O/OW vs. L) O: 142.5 ± 36.4 OW: 138.6 ± 35.6 L: 153.5 ±38.8 p = 0.002 | Weighted and unweighted UniFrac 4 matrices (PERMANOVA 6) | NR by BMI groups |
| Fei 2019 [43] | O vs. OW vs. L | Shannon index, Chao1 diversity, observed OTUs | NR by BMI groups | Beta diversity (PERMANOVA 6) | NR by BMI groups |
| Finucane 2014 [44] | O vs. L | Shannon index, observed OTUs | Shannon index: No differences in O vs. L Richness (total number of OTUs): No difference in O vs. L | — | — |
| Gallè 2020 [45] | O/OW vs. NW/UW | Shannon index | No significant differences in O/OW (2.5 ± 0.2) vs. NW/UW (2.5 ± 0.2) p = 0.77 | PCoA 5 using the METAGEN assist platform | ANOSIM 8 test yielded no significant dissimilarity for the BMI groups (R = −0.011, p = 0.5) |
| Gao 2018 [46] | O vs. NW | Shannon, Simpson, Number of observed OTUs | Shannon index: Significantly lower in O vs. NW (p < 0.01) Simpson index: Significantly lower in O vs. NW (p < 0.001) # observed OTUs: No significant difference in O vs. NW | PCoA 5 of samples by weighted and unweighted UniFrac 4 distance | Fecal microbial communities of the four BMI groups were not distinct from each other, indicating low among-group dissimilarities |
| Harakeh 2020 [47] | O vs. OW vs. NW vs. UW | Shannon index | No difference between UW, NW, OW and O individuals | — | — |
| Kaplan 2019 [48] | NW vs. OW vs. O (class I, II, III) | Shannon index | Significantly lower in O Class III vs. NW: Beta (95% CI) NW Ref. OW −0.01 (−0.08, 0.10) O Class I −0.08 (−0.18, 0.01) O Class II −0.09 (−0.21, 0.03) O Class III −0.19 (−0.35, −0.03) | Bray-Curtis distances | NR by BMI groups |
| Kasai 2015 [21] | O vs. L | Shannon index | Significantly higher in O vs. L p < 0.05 | PCA 3 | L subjects formed a cluster distinct from O subjects |
| Loftfield 2020 [49] | O vs. OW vs. NW | Shannon index, Faith phylogenetic diversity index (PD), and number of observed sequence variants | Shannon index, PD and number of observed sequence variants: No significant differences across groups. | Bray–Curtis and unweighted UniFrac 4; PCoA 5 | Being O compared with normal BMI at age 46 was statistically significantly associated with Bray–Curtis, unweighted Uni-Frac, and weighted UniFrac distances (all p values ≤ 0.001); whereas OW BMI and BMI history were not statistically significantly associated with the beta diversity matrices |
| Oduaran 2020 [34] | O vs. L | Shannon index, Chao1 | Shannon diversity in Bushbuckridge: No significant differences in O (4.56 ± 0.39) vs. L (4.49 ± 0.53 (4.56 ± 0.41 after exclusion of an outlier)) p = 0.85 Chao 1: Significantly higher in O vs. L (p = 0.001) Shannon diversity in Soweto: No significant differences in O (4.30 ± 0.56) vs. L (4.49 ± 0.34) p = 0.45 Chao 1: No significant differences in O vs. L (p = 0.33) | Bray-Curtis distances, PcoA 4,5 | Beta diversity measurements showed statistically significant differences between the lean and obese groups in Bushbuckridge with calculated Bray-Curtis distances using the permutational analysis of variance (PERMANOVA 6) test (p = 0.02 for Bushbuckridge and p = 0.84 for Soweto) |
| Org 2017 [50] | — | Pielou’s index (evenness), and Fisher’s alpha (diversity) | NR by BMI groups | Bray–Curtis distance | NR by BMI groups |
| Osborne 2020 [51] | Tertile 1: 12.9–19.1 kg/m2; Tertile 2: 19.1–23.4 kg/m2; Tertile 3: 23.4–38.9 kg/m2 | Shannon index, Chao1, number of observed OTUs | Shannon index: Significant decrease across BMI tertiles tertile 1: 4.6 ± 0.5 tertile 2: 4.5 ± 0.5 tertile 3: 4.4 ± 0.5 p < 0.01 Chao1: Significant decrease across BMI tertiles tertile 1: 10,848 ± 3916 tertile 2: 9761 ± 3006 tertile 3: 9162 ± 3590 p = 0.02 # observed OTUs: Non-significant decrease across BMI tertiles tertile 1: 3613 ± 1462 tertile 2: 3160 ± 999 tertile 3: 3093 ± 1317 p = 0.07 | Unweighted UniFrac 4, weighted UniFrac 4, and Bray-Curtis distances | NR by BMI groups |
| Ozato 2019 [32] | High VFA vs. Low VFA | Shannon index | Significantly lower in High vs. Low VFA in men (p = 0.053) Non-significantly higher in High vs. Low VFA in women (p >0.05) | — | — |
| Patil 2012 [52] | O vs. NW | Shannon index and Simpson index | Shannon index: No significant differences reported O: 2.89 ± 0.56 NW: 2.84 ± 0.75 p = not reported Simpson index: No significant differences reported O: 0.11 ± 0.08 NW: 0.14 ± 0.18 p = not reported | UniFrac 4 analysis | Library cluster analysis clearly demonstrates clustering of lean and normal libraries except L3 (which has an unusually high Bacteroides genus counts). Interestingly, libraries O1 and O2 cluster in the normal/lean clade |
| Peters 2018 [33] | O vs. NW | Shannon index, Richness, and Evenness | Shannon index: Non-significantly lower in O vs. NW (beta = −0.11, p = 0.11, pHolm = 0.22) Evenness: Non-significantly lower in O vs. NW (beta = −0.01, p = 0.22, pHolm = 0.44). Richness (i.e., number of OTUs): Significantly lower in O vs. NW (beta = −9.87, p = 0.04, pHolm = 0.08); Significantly lower richness in O vs. NW in women (p = 0.03), but not in men (p = 0.47) | Weighted UniFrac4 distance, PCoA 5 | Partial constrained analysis of PCoA 4 of the weighted UniFrac distance revealed separation of obese from both healthy-weight and OW participants on the main axis, with OW separated from healthy-weight participants on the secondary axis, although PCoA 4 did not reveal clustering by BMI category. In PERMANOVA 6 analysis of the weighted UniFrac distance, BMI category was not associated globally with overall microbiome composition (p = 0.14). In pairwise comparisons, overall microbiome composition differed between O and HW participants (p = 0.04, pHolm = 0.07), while OW and HW participants did not differ significantly (p = 0.64, pHolm = 0.64) |
| Rahat-Rozenbloom 2014 [53] | OW vs. L | Shannon index | No significant difference in OW (4.66) vs. L (4.92) p = 0.18 | Weighted UniFrac 4 distances | PCoA 5 plots failed to reveal any difference in between the L and OW groups (data not shown) |
| Salah 2019 [54] | O vs. OD vs. NW | Shannon index, Number of OTUs | Shannon index: Significantly lower in O vs. NW (p < 0.01) Significantly higher in OD vs. NW (p < 0.05)- Number of OTUs: NR | PCoA 5 unweighted and weighted UniFrac 4 distance matrix | PCoA 5 plot based on unweighted Uni-Frac was built and showed significant BMI and diabetes-dependent clustering of samples (PERMANOVA 6; p = 0.001) |
| Thingholm 2019 [55] | O vs. L | PD calculated using the phylogenetic tree built on the aligned OTU sequences | PD significantly lower in O vs. L (p = 3.20310−11 by robust regression). | Function betadisper from the R package vegan with default settings to evaluate dispersion between groups | Composition (beta-diversity) of taxonomic and functional profiles (adonis q < 0.1), and taxonomic evaluation of dispersion (genera, betadisper q < 0.1) significantly lower in O vs. L, although not for functional features (betadispersion q > 0.1) |
| Verdam 2013 [56] | O vs. NO | Simpson’s reciprocal index of diversity (1/D) | Significantly lower in O (128.7 ± 33.2) vs. NO (174.6 ± 37.3) p = 0.002 | — | — |
| Vieira-Silva 2020 [57] | — | Observed richness was calculated using phyloseq | NR by BMI groups | PCoA 5 using Bray–Curtis dissimilarity with Hellinger transformation | NR by BMI groups |
| Whisner 2018 [58] | — | PD metrics calculated by QIIME via Faith’s PD | NR by BMI groups | PCoA 5 using weighted and unweighted UniFrac 4 distances | NR by BMI groups |
| Wilkins 2019 [59] | — | — | — | Weighted UniFrac 4 beta-diversity | NR by BMI groups |
| Yasir 2015 [35] | O vs. NW | Shannon Index Chao Index Number of OTUs | Shannon Index, Chao Index, and Number of OTUs reported at OTU cutoffs of 3, 6 and 9 distance units France O significantly lower diversity and richness than NW at all the OTU cutoffs (p < 0.05). Saudi Arabia No significant difference in diversity and richness between O and NW at all the OTU cutoffs | PCoA 5 calculated in QIIME by choosing Bray–Curtis distance methods at the genus level | PCoA 5 showed that O and NW individuals clustered independently. NW individuals from France and Saudi Arabia clustered together, but O Saudis clustered independently from obese French |
| Yun 2017 [60] | O vs. OW vs. NW | PD metrics calculated by QIIME 9 | Significantly lower diversity (PD) in O vs. NW (p < 0.01) and OW vs. NW (p < 0.01) | PCoA5 of weighted UniFrac 4 | Weighted UniFrac 4 PCoA 5 identified significant differences between groups (ANOSIM 8; R = 0.020, p = 0.001) |
| Study ID (Author, Year) | Comparison Groups 1 | Actinobacteria 1 | Bacteroidetes 1 | Firmicutes 1 | Fusobacterium 1 | Proteobacteria 1 | Verrucomicrobia 1 | Other | B/F 2 or F/B 3 Ratio 1 |
|---|---|---|---|---|---|---|---|---|---|
| Andoh 2016 [17] | O vs. L | No significant differences in O vs. L | No significant differences in O vs. L O: 31.2 ± 14.1% L: 32.9 ± 6.4% p = 0.38 | Significantly higher in O vs. L O: 42.6 ± 8.5% L: 35.1 ± 5.2% p = 0.018 | Significantly higher in O vs. L O: 1.86 ± 4.20% L: 0.00 ± 0.00% p = 0.002 | No significant differences in O vs. L | — | Unclassified (p > 0.05) | B/F 1 ratio O: 0.86 ± 0.63 L: 0.96 ± 0.27 Not significant |
| Beaumont 2016 [37] | — | — | — | — | — | — | — | — | — |
| Borges 2018 [38] | — | — | — | — | — | — | — | — | — |
| Borgo 2018 [18] | O vs. NW | No significant differences in O vs. NW O: 1.5 ± 1.2 NW: 1.4 ± 1.9 | No significant differences in O vs. NW O: 38.5 ± 12.7NW: 41.7 ± 7.9 | No significant differences in O vs. NW O: 53.8 ± 11.3 NW: 51.2 ± 8.1 | — | No significant differences in O vs. NW O: 3.5 ± 2.7 NW: 4.5 ± 5.7 | No significant differences in O vs. NW O: 2.4 ± 5.3 NW: 0.9 ± 1.7 | — | — |
| Chavez-Carbajal 2019 [19] | O + MetS vs. O vs. NW | No significant differences between groups O: 1.27% O + MetS: 1.29% NW: 2.32% p = 0.1667 | No significant differences between groups O: 22.50% O + MetS: 23.43% NW: 36.20% p = 0.7125 | Significantly higher in O vs. NW O: 72.97% O + MetS: 73.34% NW: 56.95% p = 0.0029 | — | No significant differences between groups O: 2.80% O + MetS: 1.45% NW: 4.20% p = 0.1160 | — | Includes Verrucomicrobia, Spirochaetes and Fusobacteria. O: 0.22% O + MetS: 0.37% NW: 0.14% p < 0.0001 | F/B2 ratio O + MetS: 3.13 O: 3.24 C: 1.57 p = not reported (significance not reported) |
| Chen 2016 [20] | O vs. NW | — | No significant differences in O vs. NW O: 4.339 × 10⁻¹ NW: 5.004 × 10⁻¹ q = 0.080 | No significant differences in O vs. NW O: 5.226 × 10⁻¹ NW: 4.660 × 10⁻¹ q = 0.080 | No significant differences in O vs. NW O: 1.433 × 10⁻² NW: 1.446 × 10⁻³ q = 0.080 | — | — | Chrisiogenetes: O: 1.927 × 10⁻⁵ NW: 1.680 × 10⁻⁴ q = 0.080 | — |
| Davis 2016 [40] | — | — | — | — | — | — | — | — | — |
| Davis 2020 [39] | — | — | — | — | — | — | — | — | — |
| De la Cuesta-Zuluaga 2018 [41,42] | O vs. OW vs. NW | — | Significantly lower in O vs. NW O: 8.2 ± 14.1 OW: 10.8 ± 17 NW:11.5 ± 19.8 p = 0.04 | No significant differences between groups O: 53.9 ± 30.9 OW: 51.8 ± 29.5 NW: 48.5 ± 20.8 p = 0.62 | — | — | — | — | Significantly lower in O vs. NW B/F 1 ratio O: 0.15 ± 0.28 OW: 0.22 ± 0.42 NW: 0.23 ± 0.40 p = 0.04 |
| Fei 2019 [43] | — | — | — | — | — | — | — | — | — |
| Finucane 2014 [44] | O vs. L | No differences | No differences (p = 0.30) | No differences (p = 0.86) | No differences | No differences | — | No differences | — |
| Gallè 2020 [45] | O/OW vs. NW/UW | — | No significant differences in O/OW vs. NW/UW O/OW: 31.8 ± 8.9 NW/UW: 33.4 ± 10.4 p = 0.54 | No significant differences in O/OW vs. NW/UW O/OW: 61.1 ± 8.7 NW/UW: 58.9 ± 13.1 p = 0.47 | — | — | — | — | No significant differences in O/WO vs. NW/UW F/B 2 ratio O/OW: 2.2 ± 1.3 NW/UW: 2.1 ± 1.1 p = 0.56 |
| Gao 2018 [46] | O vs. OW vs. NW vs. UW | No differences in O vs. UW | Significantly higher in O vs. UW (p < 0.05) | No differences in O vs. UW | Significantly higher in O vs. UW (p < 0.01) | Significantly higher in O vs. UW (p < 0.05) | — | — | — |
| Harakeh 2020 [47] | O vs. NW | — | — | — | Significantly lower in O vs. NW (p = 0.005, FDR = 0.014) | — | — | — | — |
| Kaplan 2019 [48] | — | — | — | — | — | — | — | — | — |
| Kasai 2015 [21] | O vs. NO | No differences between groups O: 8.0 ± 7.1% NO: 8.2 ± 6.7% p = 0.917 | Significantly lower in O vs. NO O: 37.0 ± 14.0% NO: 44.0 ± 9.8% p = 0.033 | No differences between groups O: 40.8 ± 15.0% NO: 37.0 ± 9.1% p = 0.241 | O: 1.58% NO: 0.07% p > 0.05 | O: 0.91% NO: 1.20% p > 0.05 | — | Increase in the proportion of “unclassified” phyla (O 21.76% vs. NO 8.54%) were observed in the O group relative to the NO group Sinergistetes: O: 0.00% NO: 0.03% | Significantly higher in O vs. UW F/B 2 ratio O: 1.7 ± 1.7 NO: 0.9 ± 0.4 p = 0.045 |
| Loftfield 2020 [49] | O vs. NW | — | Significantly higher in O vs. NW | — | — | — | — | — | No significant differences in O vs. NW F/B 2 ratio expressed as beta coefficients OW vs. NW: −29.7 (p = 0.26) O vs. NW: 4.66 (p = 0.88) |
| Oduaran 2020 [34] | O vs. L | No differences between groups (p > 0.05) | Significantly higher in O vs. L (p < 0.05) | No differences between groups (p > 0.05) | No differences between groups (p > 0.05) | No differences between groups (p > 0.05) | No differences between groups (p > 0.05) | No differences between groups (p > 0.05) | — |
| Org 2017 [50] | — | — | — | — | — | — | — | — | — |
| Osborne 2020 [51] | — | — | — | — | — | — | — | — | — |
| Ozato 2019 [32] | G1: BMI < 20 G2: 20 ≤ BMI < 25 G3: 25 ≤ BMI < 30 G4: BMI ≥ 30 | No differences between groups | Significant decrease across BMI groups in women (p for trend: <0.001). No significant association across BMI groups in men | Significant increase across BMI groups in women (p for trend: 0.004). No significant association across BMI groups in men | — | No differences between groups | — | — | — |
| Patil 2012 [52] | O vs. L | No differences between groups | No differences between groups | No differences between groups | — | No differences between groups | — | Unclassified: No differences between groups | — |
| Peters 2018 [33] | O vs. OW vs. NW | — | Not associated with BMI category (p = 0.49) | Not associated with BMI category (p = 0.40) | — | — | — | — | F/B 2 ratio (Kruskal-Wallis test p = 0.94). No results per group provided |
| Rahat-Rozenbloom 2014 [53] | O/OW vs. L | — | No significant differences in O/OW (6.4 ± 4.3) vs. L (19.4 ± 6.1) p = 0.335 | Significantly higher in O/OW (83.1 ± 4.1) vs. L (69.5 ± 5.8) p = 0.008 | — | — | — | — | Significantly higher in O/OW vs. LF/B 2 ratio O/OW: 34.3 ± 1.6 L: 6.8 ± 1.0 (p = 0.023, or p = 0.0098 when adjusted for age). F/B 2 ratio expressed as a base 2 logarithm derived from the median center log-ratio-transformed values of each sample. |
| Salah 2019 [54] | O vs. OD vs. D vs. NW | Significant differences: NW: 0.54% O: 0.69% D: 0.77% OD: 1.52% p = 0.04 | Non-significant differences: NW:34.25% O: 44.94% D: 38.4% OD: 37.16% p = 0.07 | Non-significant differences: NW. 36.4% O: 48.72% D: 49.1% OD: 51.09% p = 0.31 | Non-significant differences: NW: 0% O: 0% D: 0% O + D: 0.48 p = 0.20 | Significant differences NW: 24.65% O: 5.61% D: 11.1% OD: 7.48% p = 0.02 | Significant differences NW: 3.86% O: 0.006% D: 0.43% OD: 1.54% p < 0.001 | Significant differences: Euryarchaeota (p < 0.001) Lentisphaerae (p = 0.01) Synergistetes (p < 0.001) Tenericutes (p = 0.01) | No significant differences reported: F/B 2 ratio NW = 1.06 O: 1.08 OD: 1.37 p = not reported |
| Thingholm 2019 [55] | — | — | — | — | — | — | — | — | — |
| Verdam 2013 [56] | O vs. NO | — | Significantly lower in O vs. NO O: 5.9% ± 5.8% NO: 19.2% ± 9.2%; p < 0.002 | Significantly higher in O vs. NO O: 85.8% ± 8.5% NO: 74.6% ± 9.2%; q = 0.002 | — | Several members of the Proteobacteria including those related to E. aerogene, K. pneumoniea, Vibrio, and Yersina spp. were positively associated with BMI and more abundantly present in obese | — | — | B/F 1 ratio strongly decreased in O (p = 0.0002). |
| Vieira-Silva 2020 [57] | — | — | — | — | — | — | — | — | — |
| Whisner 2018 [58] | BMI < 18.5 BMI 18.5–24.9 BMI 25.0–29.9 BMI ≥ 30.0 | — | — | — | — | — | — | — | F/B 2 ratio did not differ by BMI p = 0.413 No results per group provided |
| Wilkins 2019 [59] | — | — | — | — | — | — | — | — | — |
| Yasir 2015 [35] | O vs. NW (France) O vs. NW (Saudi Arabia) | No significant differences (France and SA) | Significantly higher in O vs. NW (France) (p = 0.05) No significant differences (SA) | No significant differences (France) Significantly higher in O vs. NW (SA) (p = 0.001) | — | Significantly higher in O vs. NW (France) (p = 0.002) No significant differences (SA 4) | No significant differences (France and SA) | — | — |
| Yun 2017 [60] | O vs. OW vs. NW | — | — | — | — | — | — | — | No significant differences in F/B 2 ratio. No results per group provided |
| Genus (#Studies) | Significantly Higher in Obese | Significantly Lower in Obese | ||
|---|---|---|---|---|
| n | [Citations] | n | [Citations] | |
| Firmicutes | ||||
| Acetanaerobacterium1 | 1 | [34] | — | — |
| Acidaminococcus | 3 | [32,48,51] | — | — |
| Anaerococcus | 2 | [17,59] | — | — |
| Anaerotruncus | 1 | [45] | 1 | [48] |
| Blautia | 4 | [20,33,49,50] | 1 | [32] |
| Butyrivibrio1 | — | 1 | [54] | |
| Catenibacterium | 2 | [34,48] | — | — |
| Clostridium2 | 1 | [54] | 1 | [35] |
| Clostridium_IV1 | 1 | [34] | — | — |
| Clostridium_XIVa3 | 1 | [34] | — | — |
| Clostridium_XIVb3 | 1 | [34] | — | — |
| Coprobacillus | — | 1 | [48] | |
| Coproccocus | 3 | [17,19,59] | 1 | [33] |
| Dehalobacterium | — | 1 | [33] | |
| Dialister | 2 | [18,19] | — | — |
| Dorea4 | 5 | [20,35,43,45,49] | — | — |
| Eubacterium | 2 | [20,45] | — | — |
| Faecalibacterium2 | 2 | [19,54] | 2 | [17,35] |
| Finegoldia | — | — | 1 | [17] |
| Fusicatenibacter3 | — | — | 1 | [34] |
| Gemella | 1 | [45] | — | — |
| Intestinimonas | 1 | [34] | — | — |
| Lachnoanaerobaculum | — | — | 1 | [17] |
| Lachnobacterium | 1 | [45] | — | — |
| Lachnospira | 1 | [19] | — | — |
| Lactobacillus2 | 1 | [35] | — | — |
| Megasphera | 2 | [43,48] | — | — |
| Oscillibacter3 | 1 | [34] | 1 | [55] |
| Oscillospira | 1 | [37] | 4 | [18,33,48,51] |
| Parvimonas | 1 | [17] | — | — |
| Phascolarctobacterium1 | 1 | [34] | — | — |
| Roseburia | 4 | [19,43,49,54] | — | — |
| Ruminoccocus3 | 4 | [34,37,41,49] | 2 | [48,54] |
| Sporobacter3 | 1 | [34] | — | — |
| Staphylococcus | 1 | [54] | — | — |
| Streptococcus3 | 5 | [33,34,43,45,48] | — | — |
| Subdoligranulum | — | — | 1 | [17] |
| Bacteroidetes | ||||
| Alistipes1 | 2 | [17,34] | 1 | [55] |
| Bacteroides2 | 3 | [35,52,59] | 2 | [17,19] |
| Parabacteroides1,3 | 2 | [34,43] 1 | 1 | [34] 3 |
| Paraprevotella | — | — | 1 | [45] |
| Prevotella | 3 | [34,48,54] | — | — |
| Actinobacteria | ||||
| Bifidobacterium | — | — | 1 | [32] |
| Corynebacterium | 1 | [59] | — | — |
| Eggerthella5 | — | — | 2 | [48,60] |
| Olsenella | — | — | 1 | [17] |
| Rothia | 1 | [59] | — | — |
| Fusobacteria | ||||
| Fusobacterium | 2 | [17,46] | — | — |
| Sneathia | 1 | [45] | — | — |
| Proteobacteria | ||||
| Desulfovibrio | 1 | [43] | 1 | [17] |
| Escherichia-Shigella2,3 | 2 | [34,35] | — | — |
| Haemophilus3 | 1 | [34] | — | — |
| Jannaschia | 1 | [45] | — | — |
| Oxalobacter3 | 1 | [34] | — | — |
| Paucibacter | 1 | [45] | — | — |
| Succinivibrio | 1 | [45] | — | — |
| Sutterella1 | 2 | [34,46] | — | — |
| Verrucomicrobia | ||||
| Akkermansia1 | 1 | [34] | 2 | [54,55] |
| Synergistetes | ||||
| Cloacibacillus | — | — | 1 | [48] |
| Euryarchaeota | ||||
| Methanobrevibacter | — | — | 1 | [50] |
| Lentisphaerae | ||||
| Victivallis3 | — | — | 1 | [34] |
Publisher’s Note: MDPI stays neutral with regard to jurisdictional claims in published maps and institutional affiliations. |
© 2021 by the authors. Licensee MDPI, Basel, Switzerland. This article is an open access article distributed under the terms and conditions of the Creative Commons Attribution (CC BY) license (https://creativecommons.org/licenses/by/4.0/).
Share and Cite
Pinart, M.; Dötsch, A.; Schlicht, K.; Laudes, M.; Bouwman, J.; Forslund, S.K.; Pischon, T.; Nimptsch, K. Gut Microbiome Composition in Obese and Non-Obese Persons: A Systematic Review and Meta-Analysis. Nutrients 2022, 14, 12. https://doi.org/10.3390/nu14010012
Pinart M, Dötsch A, Schlicht K, Laudes M, Bouwman J, Forslund SK, Pischon T, Nimptsch K. Gut Microbiome Composition in Obese and Non-Obese Persons: A Systematic Review and Meta-Analysis. Nutrients. 2022; 14(1):12. https://doi.org/10.3390/nu14010012
Chicago/Turabian StylePinart, Mariona, Andreas Dötsch, Kristina Schlicht, Matthias Laudes, Jildau Bouwman, Sofia K. Forslund, Tobias Pischon, and Katharina Nimptsch. 2022. "Gut Microbiome Composition in Obese and Non-Obese Persons: A Systematic Review and Meta-Analysis" Nutrients 14, no. 1: 12. https://doi.org/10.3390/nu14010012