
Association of Dietary Patterns with Cardiovascular and Kidney Phenotypes in an Uruguayan Population Cohort

 ,
,  , and
, and
Abstract
:1. Introduction
2. Materials and Methods
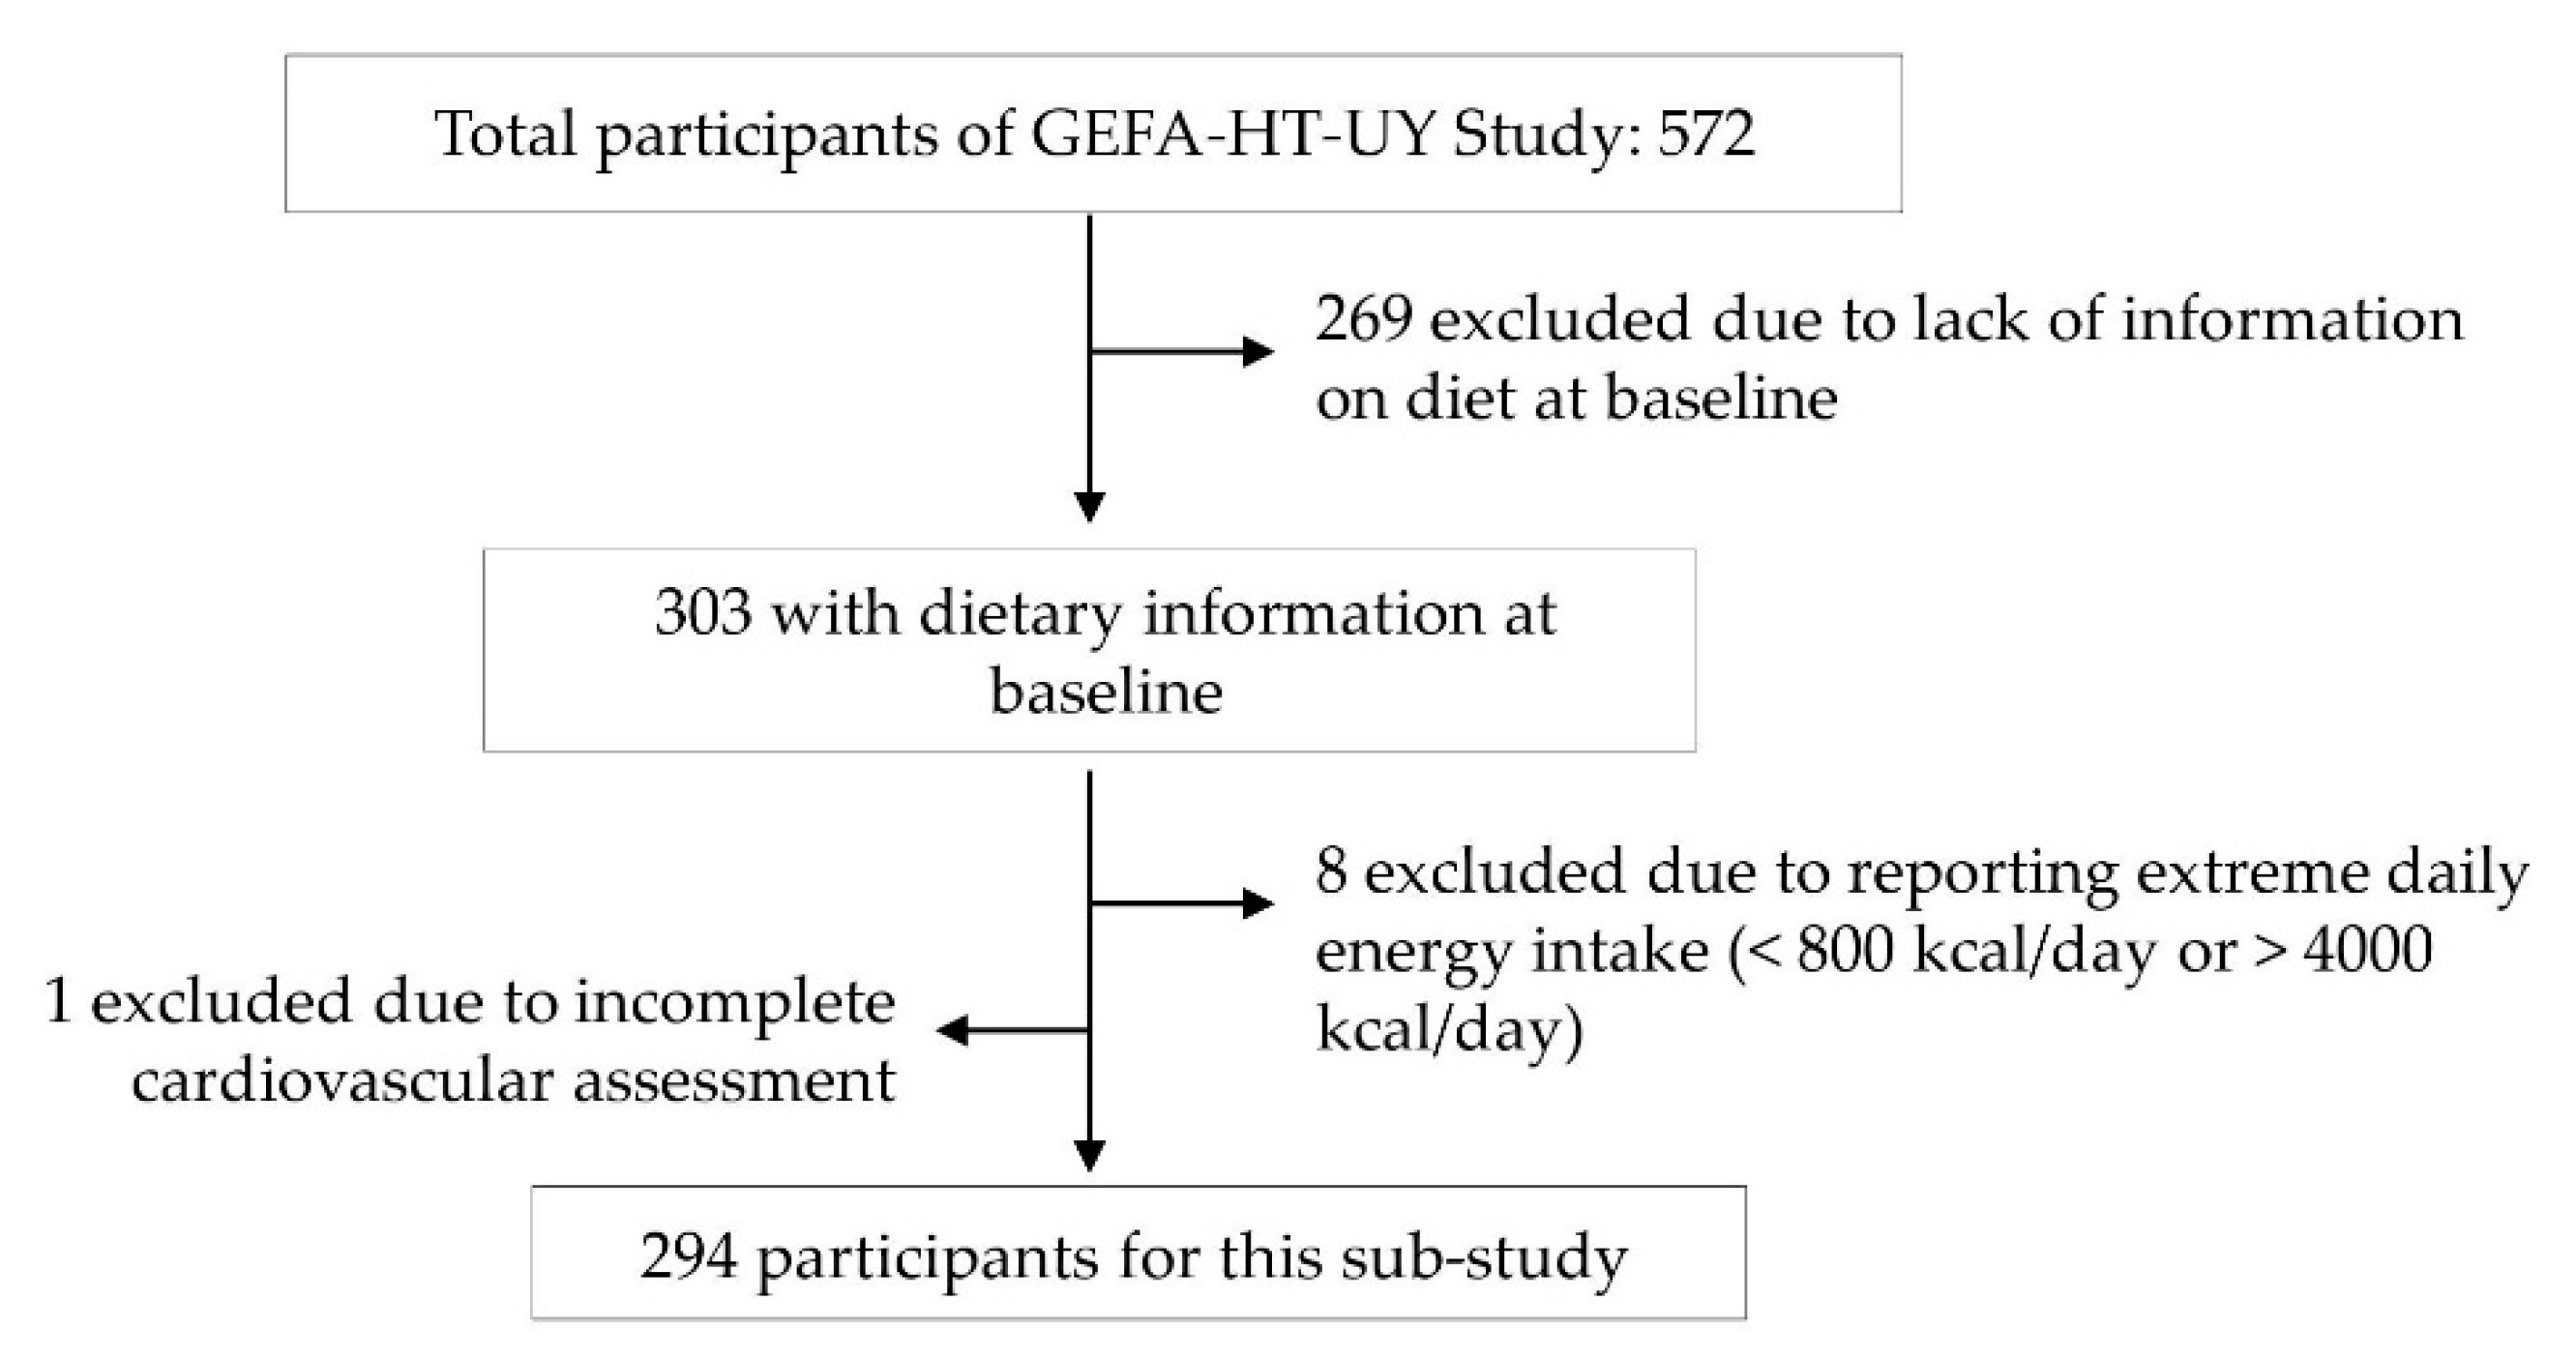
2.1. Population
2.1.1. Dietary Assessment and Food Grouping
2.1.2. Dietary Pattern Analysis
2.2. Physical Activity
2.3. Anthropometric Measurements
2.4. Blood Samples and Biochemical Measurements
2.5. Blood Pressure Measurements
2.6. Arterial Ageing Parameters
2.7. Assessment of Kidney Parameters
2.8. Statistical Methods
3. Results
3.1. Characteristics of Participants
3.2. Dietary Patterns and Characteristics of Participants
3.3. Metabolic, Anthropometric, Cardiovascular, and Kidney Variables by Tertiles of Dietary Patterns
4. Discussion
4.1. Dietary Patterns and Metabolic Characteristics
4.2. Dietary Patterns and Cardiovascular and Kidney Phenotypes
5. Conclusions
Supplementary Materials
Author Contributions
Funding
Institutional Review Board Statement
Informed Consent Statement
Data Availability Statement
Acknowledgments
Conflicts of Interest
References
- World Health Organization. World Health Statistics 2020: Monitoring Health for the SDGs, Sustainable Development Goals; World Health Organization: Geneva, Switzerland, 2020. [Google Scholar]
- Rubinstein, A.L.; Irazola, V.E.; Calandrelli, M.; Elorriaga, N.; Gutierrez, L.; Lanas, F.; Manfredi, J.A.; Mores, N.; Olivera, H.; Poggio, R.; et al. Multiple cardiometabolic risk factors in the Southern Cone of Latin America: A population-based study in Argentina, Chile, and Uruguay. Int. J. Cardiol. 2015, 183, 82–88. [Google Scholar] [CrossRef] [PubMed] [Green Version]
- Bermudez, O.; Tucker, K. Trends in dietary patterns of Latin American populations. Cad. Saude Publica 2003, 19, 87–99. [Google Scholar] [CrossRef] [PubMed]
- Bruins, M.J.; Van Dael, P.; Eggersdorfer, M. The role of nutrients in reducing the risk for noncommunicable diseases during aging. Nutrients 2019, 11, 85. [Google Scholar] [CrossRef]
- GBD 2017 Diet Collaborators. Health effects of dietary risks in 195 countries, 1990—2017: A systematic analysis for the Global Burden of Disease Study. Lancet 2019, 393, 1958–1972. [Google Scholar] [CrossRef] [Green Version]
- Ministerio de Salud Pública. Primera Encuesta Nacional de Factores de Riesgo de Enfermedades Crónicas No Transmisibles; Ministerio de Salud Pública: Montevideo, Uruguay, 2006. [Google Scholar]
- Ministerio de Salud Pública. Segunda Encuesta Nacional de Factores de Riesgo de Enfermedades Crónicas No Transmisibles; Ministerio de Salud Pública: Montevideo, Uruguay, 2013. [Google Scholar]
- Ministerio de Salud Escuela de Nutrición. Recomendaciones Nutricionales para la Población Uruguaya; Ministerio de Salud: Montevideo, Uruguay, 2019. [Google Scholar]
- Moliterno, P.; Álvarez-Vaz, R.; Pécora, M.; Luzardo, L.; Borgarello, L.; Olascoaga, A.; Marino, C.; Noboa, O.; Staessen, J.A.; Boggia, J. Blood Pressure in relation to 24-Hour Urinary Sodium and Potassium Excretion in a Uruguayan Population Sample. Int. J. Hypertens. 2018, 2018, 1–10. [Google Scholar] [CrossRef] [Green Version]
- Pan American Health Organization. Ultra-Processed Food and Drink Products in Latin America: Trends, Impact on Obesity, Policy Implications; World Health Organization: Washington, DC, USA, 2015. [Google Scholar]
- Kant, A.K. Dietary patterns and health outcomes. J. Am. Diet. Assoc. 2004, 104, 615–635. [Google Scholar] [CrossRef]
- Hu, F.B. Dietary pattern analysis: A new direction in nutritional epidemiology. Curr. Opin. Lipidol. 2002, 13, 3–9. [Google Scholar] [CrossRef] [PubMed]
- Luzardo, L.; Lujambio, I.; Sottolano, M.; Da Rosa, A.; Robaina, S.; Arce, F.; Márquez, M.; Agorrody, V.; Américo, C.; Garau, M.; et al. Cohorte GEFA-HT-UY (GEnotipo, Fenotipo y Ambiente de la HiperTensión Arterial en UruguaY). Protocolo y primeros resultados. Rev. Med. Urug. 2013, 29, 103–113. [Google Scholar]
- National Institutes of Health. Applied Research Program NCI. Diet History Questionnaire, Spanish Version 1.0. 2007. Available online: https://epi.grants.cancer.gov/dhq/forms/ (accessed on 10 February 2013).
- López, L.; Longo, E.; Carballido, M.; Di Carlo, P. Validation of Food Photographs as a Tool to Quantify Portion Size. Rev. Chil. Nutr. 2006, 33, 480–487. [Google Scholar]
- Ministerio de Salud Argentina. Sistema de Análisis y Registro de Alimentos (SARA: System Analysis and Food Registry). Argentina: Subsecretaria de Salud Comunitaria. Dirección Nacional de Maternidad e Infancia. 2013. Available online: https://datos.dinami.gov.ar/sara/ (accessed on 1 March 2017).
- U.S. Department of Agriculture, Agricultural Research Service. FoodData Central 2019. US Department of Agriculture’s National Nutrient Database for Standard Reference. Available online: https://fdc.nal.usda.gov/ (accessed on 10 January 2019).
- Floyd, F.J.; Widaman, K.F. Factor Analysis in the Development and Refinement of Clinical Assessment Instruments. Psychol. Assess. 1995, 7, 286–299. [Google Scholar] [CrossRef]
- Carvalho, C.A.D.; Fonseca, P.C.D.A.; Nobre, L.N.; Priore, S.E.; Franceschini, S.D.C.C. Metodologias de identificação de padrões alimentares a posteriori em crianças Brasileiras: Revisão sistemática. Ciência Saúde Coletiva 2016, 21, 143–154. [Google Scholar] [CrossRef] [PubMed] [Green Version]
- Agnoli, C.; Pounis, G.; Krogh, V. Dietary Pattern Analysis. Anal. Nutr. Res. 2019, 75–101. [Google Scholar] [CrossRef]
- Newby, P.K.; Tucker, K.L. Empirically Derived Eating Patterns Using Factor or Cluster Analysis: A Review. Nutr. Rev. 2004, 62, 177–203. [Google Scholar] [CrossRef]
- Ainsworth, B.E.; Haskell, W.L.; Herrmann, S.D.; Meckes, N.; Bassett, D.R.; Tudor-Locke, C.; Greer, J.L.; Vezina, J. Compendium of Physical Activities: A Second Update of Codes and MET Values. Med. Sci. Sport Exerc. 2011, 43, 1575–1581. [Google Scholar] [CrossRef] [Green Version]
- Ashwell, M.; Gibson, S. Waist-to-height ratio as an indicator of ‘early health risk’: Simpler and more predictive than using a ‘matrix’ based on BMI and waist circumference. BMJ Open 2016, 6, e010159. [Google Scholar] [CrossRef] [Green Version]
- Hanak, V.; Munoz, J.; Teague, J.; Stanley, A.J.; Bittner, V. Accuracy of the triglyceride to high-density lipoprotein cholesterol ratio for prediction of the low-density lipoprotein phenotype B. Am. J. Cardiol. 2004, 94, 219–222. [Google Scholar] [CrossRef] [PubMed]
- Gayoso-diz, P.; Otero-González, A.; Rodriguez-Alvarez, M.X.; Gude, F.; García, F.; Francisco, A.; Quintela, A.G. Insulin resistance (HOMA-IR) cut-off values and the metabolic syndrome in a general adult population: Effect of gender and age: EPIRCE cross-sectional study. BMC Endocr. Disord. 2013, 13, 47. [Google Scholar] [CrossRef] [Green Version]
- Balta, S.; Celik, T.; Mikhailidis, D.P.; Ozturk, C.; Demirkol, S.; Aparci, M.; Iyisoy, A. The Relation between Atherosclerosis and the Neutrophil—Lymphocyte Ratio. Clin. Appl. Thromb. 2016, 22, 405–411. [Google Scholar] [CrossRef]
- National Kidney Disease Education Program. Creatinine Standardization Recommendations. Available online: https://www.niddk.nih.gov/health-information/professionals/clinical-tools-patient-management/kidney-disease/laboratory-evaluation/glomerular-filtration-rate/creatinine-standardization/recommendations (accessed on 2 January 2021).
- Levey, A.S.; Stevens, L.A.; Schmid, C.H.; Zhang, Y.L.; Castro, A.F.; Feldman, H.I.; Kusek, J.W.; Eggers, P.; Van Lente, F.; Greene, T.; et al. A New Equation to Estimate Glomerular Filtration Rate. Ann. Intern. Med. 2009, 150, 604–612. [Google Scholar] [CrossRef]
- Brannon, P.M.; Fleet, J.C. Vitamin D. Adv. Nutr. 2011, 2, 365–367. [Google Scholar] [CrossRef] [PubMed] [Green Version]
- Soley-Bori, M.; Horn, M.; Morgan, J.; Min Lee, K. Technical Report No. 4. Dealing with Missing data: Key Assumptions and Methods for Applied Analysis; Boston University School of Public Health: Boston, MA, USA, 2013. [Google Scholar]
- Poggio, R.; Elorriaga, N.; Gutierrez, L.; Irazola, V.; Rubinstein, A.; Danaei, G. Associations between dietary patterns and serum lipids, apo and C-reactive protein in an adult population: Evidence from a multi-city cohort in South America. Br. J. Nutr. 2017, 117, 548–555. [Google Scholar] [CrossRef] [Green Version]
- Silveira, B.K.S.; Novaes, J.F.D.; Reis, N.D.A.; Lourenço, L.P.; Capobiango, A.H.M.; Vieira, S.A.; Hermsdorff, H.H.M. “Traditional” and “Healthy” dietary patterns are associated with low cardiometabolic risk in brazilian subjects. Cardiol Res. 2018, 2018, 4585412. [Google Scholar] [CrossRef] [PubMed]
- De Stefani, E.; Deneo-Pellegrini, H.; Boffetta, P.; Ronco, A.L.; Aune, D.; Acosta, G.; Mendilaharsu, M.; Brennan, P.; Ferro, G. Dietary patterns and risk of cancer: A factor analysis in Uruguay. Int. J. Cancer 2009, 124, 1391–1397. [Google Scholar] [CrossRef] [PubMed]
- Monteiro dos Santos, J.E.; Crispim, S.P.; Murphy, J.; de Camargo Cancela, M. Health, lifestyle and sociodemographic characteristics are associated with Brazilian dietary patterns: Brazilian National Health Survey. PLoS ONE 2021, 16, e0247078. [Google Scholar] [CrossRef]
- Ronco, A.L.; De Stefani, E.; Boffetta, P.; Deneo-Pellegrini, H.; Acosta, G.; Mendilaharsu, M. Food patterns and risk of breast cancer: A factor analysis study in Uruguay. Int. J. Cancer 2006, 119, 1672–1678. [Google Scholar] [CrossRef] [PubMed]
- Defagó, M.D.; Elorriaga, N.; Renato, E.A.; Poggio, R.; Gutiérrez, L.; Irazola, V.E.; Rubinstein, A.L. Associations between major dietary patterns and biomarkers of endothelial dysfunction in two urban midsized cities in Argentina. Nutrition 2019, 67–68, 110521. [Google Scholar] [CrossRef] [PubMed]
- Laufs, U.; Parhofer, K.G.; Hegele, R.A.; Ginsberg, H.N. Clinical review on triglycerides. Eur. Heart J. 2020, 41, 99c–109c. [Google Scholar] [CrossRef] [Green Version]
- Crouse, J.R.; Grundy, S.M. Effects of alcohol on plasma lipoproteins and cholesterol and triglyceride metabolism in man. J. Lipid Res. 1984, 25, 486–496. [Google Scholar] [CrossRef]
- Espírito, L.R.; Faria, T.O.; Anjos, N.A.; Xavier, L.A.; Mota, G.A.; Silveira, M.F.; Mill, J.G.; Baldo, M.P. Sex-specific characteristics associated with the elevated triglyceride to high-density lipoprotein cholesterol ratio in a population-based study. Obes. Med. 2019, 16, 100151. [Google Scholar] [CrossRef]
- Lear, S.A.; Hu, W.; Rangarajan, S.; Gasevic, D.; Leong, D.; Iqbal, R.; Casanova, A.; Swaminathan, S.; Anjana, R.M.; Kumar, R. The effect of physical activity on mortality and cardiovascular disease in 130 000 people from 17 high-income, middle-income, and low-income countries: The PURE study. Lancet 2017, 390, 2643–2654. [Google Scholar] [CrossRef]
- Ashwell, M.; Stone, E.M.; Stolte, H.; Cashman, K.D.; Macdonald, H.; Lanham-New, S.; Hiom, S.; Webb, A.; Fraser, D. UK Food Standards Agency Workshop Report: An investigation of the relative contributions of diet and sunlight to vitamin D status. Br. J. Nutr. 2010, 104, 603–611. [Google Scholar] [CrossRef] [Green Version]
- Ross, A.C.; Manson, J.E.; Abrams, S.A.; Aloia, J.F.; Brannon, P.M.; Clinton, S.K.; Durazo-Arvizu, R.A.; Gallagher, J.C.; Gallo, R.L.; Jones, G.; et al. The 2011 Dietary Reference Intakes for Calcium and Vitamin D: What dietetics practitioners need to know. J. Am. Diet. Assoc. 2011, 111, 524–527. [Google Scholar] [CrossRef]
- Berlin, T.; Björkhem, I. Effect of calcium intake on serum levels of 25-hydroxyvitamin D3. Eur. J. Clin. Investig. 1988, 18, 52–55. [Google Scholar] [CrossRef]
- Oliveri, B.; Plantalech, L.; Bagur, A.; Wittich, A.C.; Rovai, G.; Pusiol, E.; Giovanelli, J.L.; Ponce, G.; Nieva, A.; Chaperón, A.; et al. High prevalence of vitamin D insufficiency in healthy elderly people living at home in Argentina. Eur. J. Clin. Nutr. 2004, 58, 337–342. [Google Scholar] [CrossRef] [Green Version]
- Canto-Costa, M.; Kunii, I.; Hauache, O. Body fat and cholecalciferol supplementation in elderly homebound individuals. Braz. J. Med. Biol. Res. 2006, 39, 91–98. [Google Scholar] [CrossRef] [Green Version]
- Gan, R.Y.; Zhang, D.; Wang, M.; Corke, H. Health benefits of bioactive compounds from the Genus Ilex, a source of traditional caffeinated beverages. Nutrients 2018, 10, 1682. [Google Scholar] [CrossRef] [Green Version]
- Chaves, G.; Britez, N.; Oviedo, G.; Gonzalez, G.; Italiano, C.; Blanes, M.; Sandoval, G.; Mereles, D. Heavy drinkers of Ilex paraguariensis beverages show lower lipid profiles but higher body weight. Phytother. Res. 2018, 32, 1030–1038. [Google Scholar] [CrossRef]
- Balsan, G.; Pellanda, L.C.; Sausen, G.; Galarraga, T.; Zaffari, D.; Pontin, B. Effect of yerba mate and green tea on paraoxonase and leptin levels in patients affected by overweight or obesity and dyslipidemia: A randomized clinical trial. Nutr. J. 2019, 18, 5. [Google Scholar] [CrossRef]
- Leng, B.; Jin, Y.; Li, G.; Chen, L.; Jin, N. Socioeconomic status and hypertension: A meta-analysis. J. Hypertens. 2015, 33, 221–229. [Google Scholar] [CrossRef]
- Rubinstein, A.L.; Irazola, V.E.; Calandrelli, M.; Chen, C.-S.; Gutierrez, L.; Lanas, F.; Manfredi, J.A.; Mores, N.; Poggio, R.; Ponzo, J.; et al. Prevalence, awareness, treatment, and control of hypertension in the southern cone of Latin America. Am. J. Hypertens. 2016, 29, 1343–1352. [Google Scholar] [CrossRef] [Green Version]
- Bove, M.I. Calcium intake Calcium intake in Uruguay: From national balance to home intake. In Role of Calcium and Vitamin D beyond Bone Health, 1st ed.; Uauy, R., Carmuega, E., Belizán, J., Eds.; Danone: Paris, France, 2014; pp. 37–53. (In Spanish) [Google Scholar]
- Pou, S.A.; Díaz, P.; Gabriela, A.; Quintana, D.; La Forte, C.A.; Aballay, L.R. Identification of dietary patterns in urban population of Argentina: Study on diet-obesity relation in population-based prevalence study. Nutr. Res. Pract. 2016, 10, 616–622. [Google Scholar] [CrossRef] [Green Version]
- Aleksandrova, K.; Koelman, L.; Rodrigues, C.E. Dietary patterns and biomarkers of oxidative stress and inflammation: A systematic review of observational and intervention studies. Redox Biol. 2021, 42, 01869. [Google Scholar] [CrossRef]
- Koikkalainen, M.; Julkunen, J.; Foundation, R.; Uusitupa, M.I.J.; Lappalainen, R. Dificulties in changing the diet in relation to dietary fat intake among patients with coronary heart disease. Eur. J. Clin. Nutr. 1999, 53, 120–126. [Google Scholar] [CrossRef] [Green Version]
- Kant, A.K.; Block, G.; Schatzkin, A.; Nestle, M. Association of fruit and vegetable intake with dietary fat intake. Nutr Res. 1992, 12, 1441–1454. [Google Scholar] [CrossRef]
- Sang, Y.; Cao, M.; Wu, X.; Ruan, L.; Zhang, C. Use of lipid parameters to identify apparently healthy men at high risk of arterial stiffness progression. BMC Cardiovasc. Disord. 2021, 21, 34. [Google Scholar] [CrossRef]
- Da Silva, B.D.P.; Neutzling, M.B.; Camey, S.; Olinto, M.T.A. Dietary patterns and hypertension: A population- based study with women from Southern Brazil. Cadernos de Saude Publica 2014, 30, 961–971. [Google Scholar] [CrossRef] [Green Version]
- Francisco, S.C.; Araújo, L.F.; Griep, R.H.; Chor, D.; Molina, M.D.C.B.; Mil, J.G.; Bensenor, I.M.; Matos, S.M.A.; Barreto, S.M.; Giatti, L. Adherence to the Dietary Approaches to Stop Hypertension (DASH) and hypertension risk: Results of the Longitudinal Study of Adult Health (ELSA-Brasil). Br. J. Nutr. 2020, 123, 1068–1077. [Google Scholar] [CrossRef]
- Sattar, N.; Preiss, D. Reverse causality in cardiovascular epidemiological research. More common than imagined? Circulation 2017, 135, 2369–2372. [Google Scholar] [CrossRef]
- Silva, J.G.; Fraser, S.; Néri, A.; Xavier, R.; Mota, R.; Lopes, A.; Mill, J.G.; Barreto, S.M.; Luft, V.C.; Chor, D.; et al. Association between dietary patterns and renal function in a cross-sectional study using baseline data from the ELSA-Brasil cohort. Braz. J. Med. Biol. Res. 2020, 53, e10230. [Google Scholar] [CrossRef] [PubMed]
- Ferraro, P.M.; Taylor, E.N.; Gambaro, G.; Curhan, G.C. Dietary and lifestyle risk factors associated with incident kidney stones in men and women. J. Urol. 2017, 198, 858–863. [Google Scholar] [CrossRef]
- Rasmussen, L.B.; Matthiessen, J.; Biltoft-jensen, A.; Tetens, I. Characteristics of misreporters of dietary intake and physical activity. Public Health Nutr. 2007, 10, 230–237. [Google Scholar] [CrossRef] [PubMed] [Green Version]


| Description | |||
|---|---|---|---|
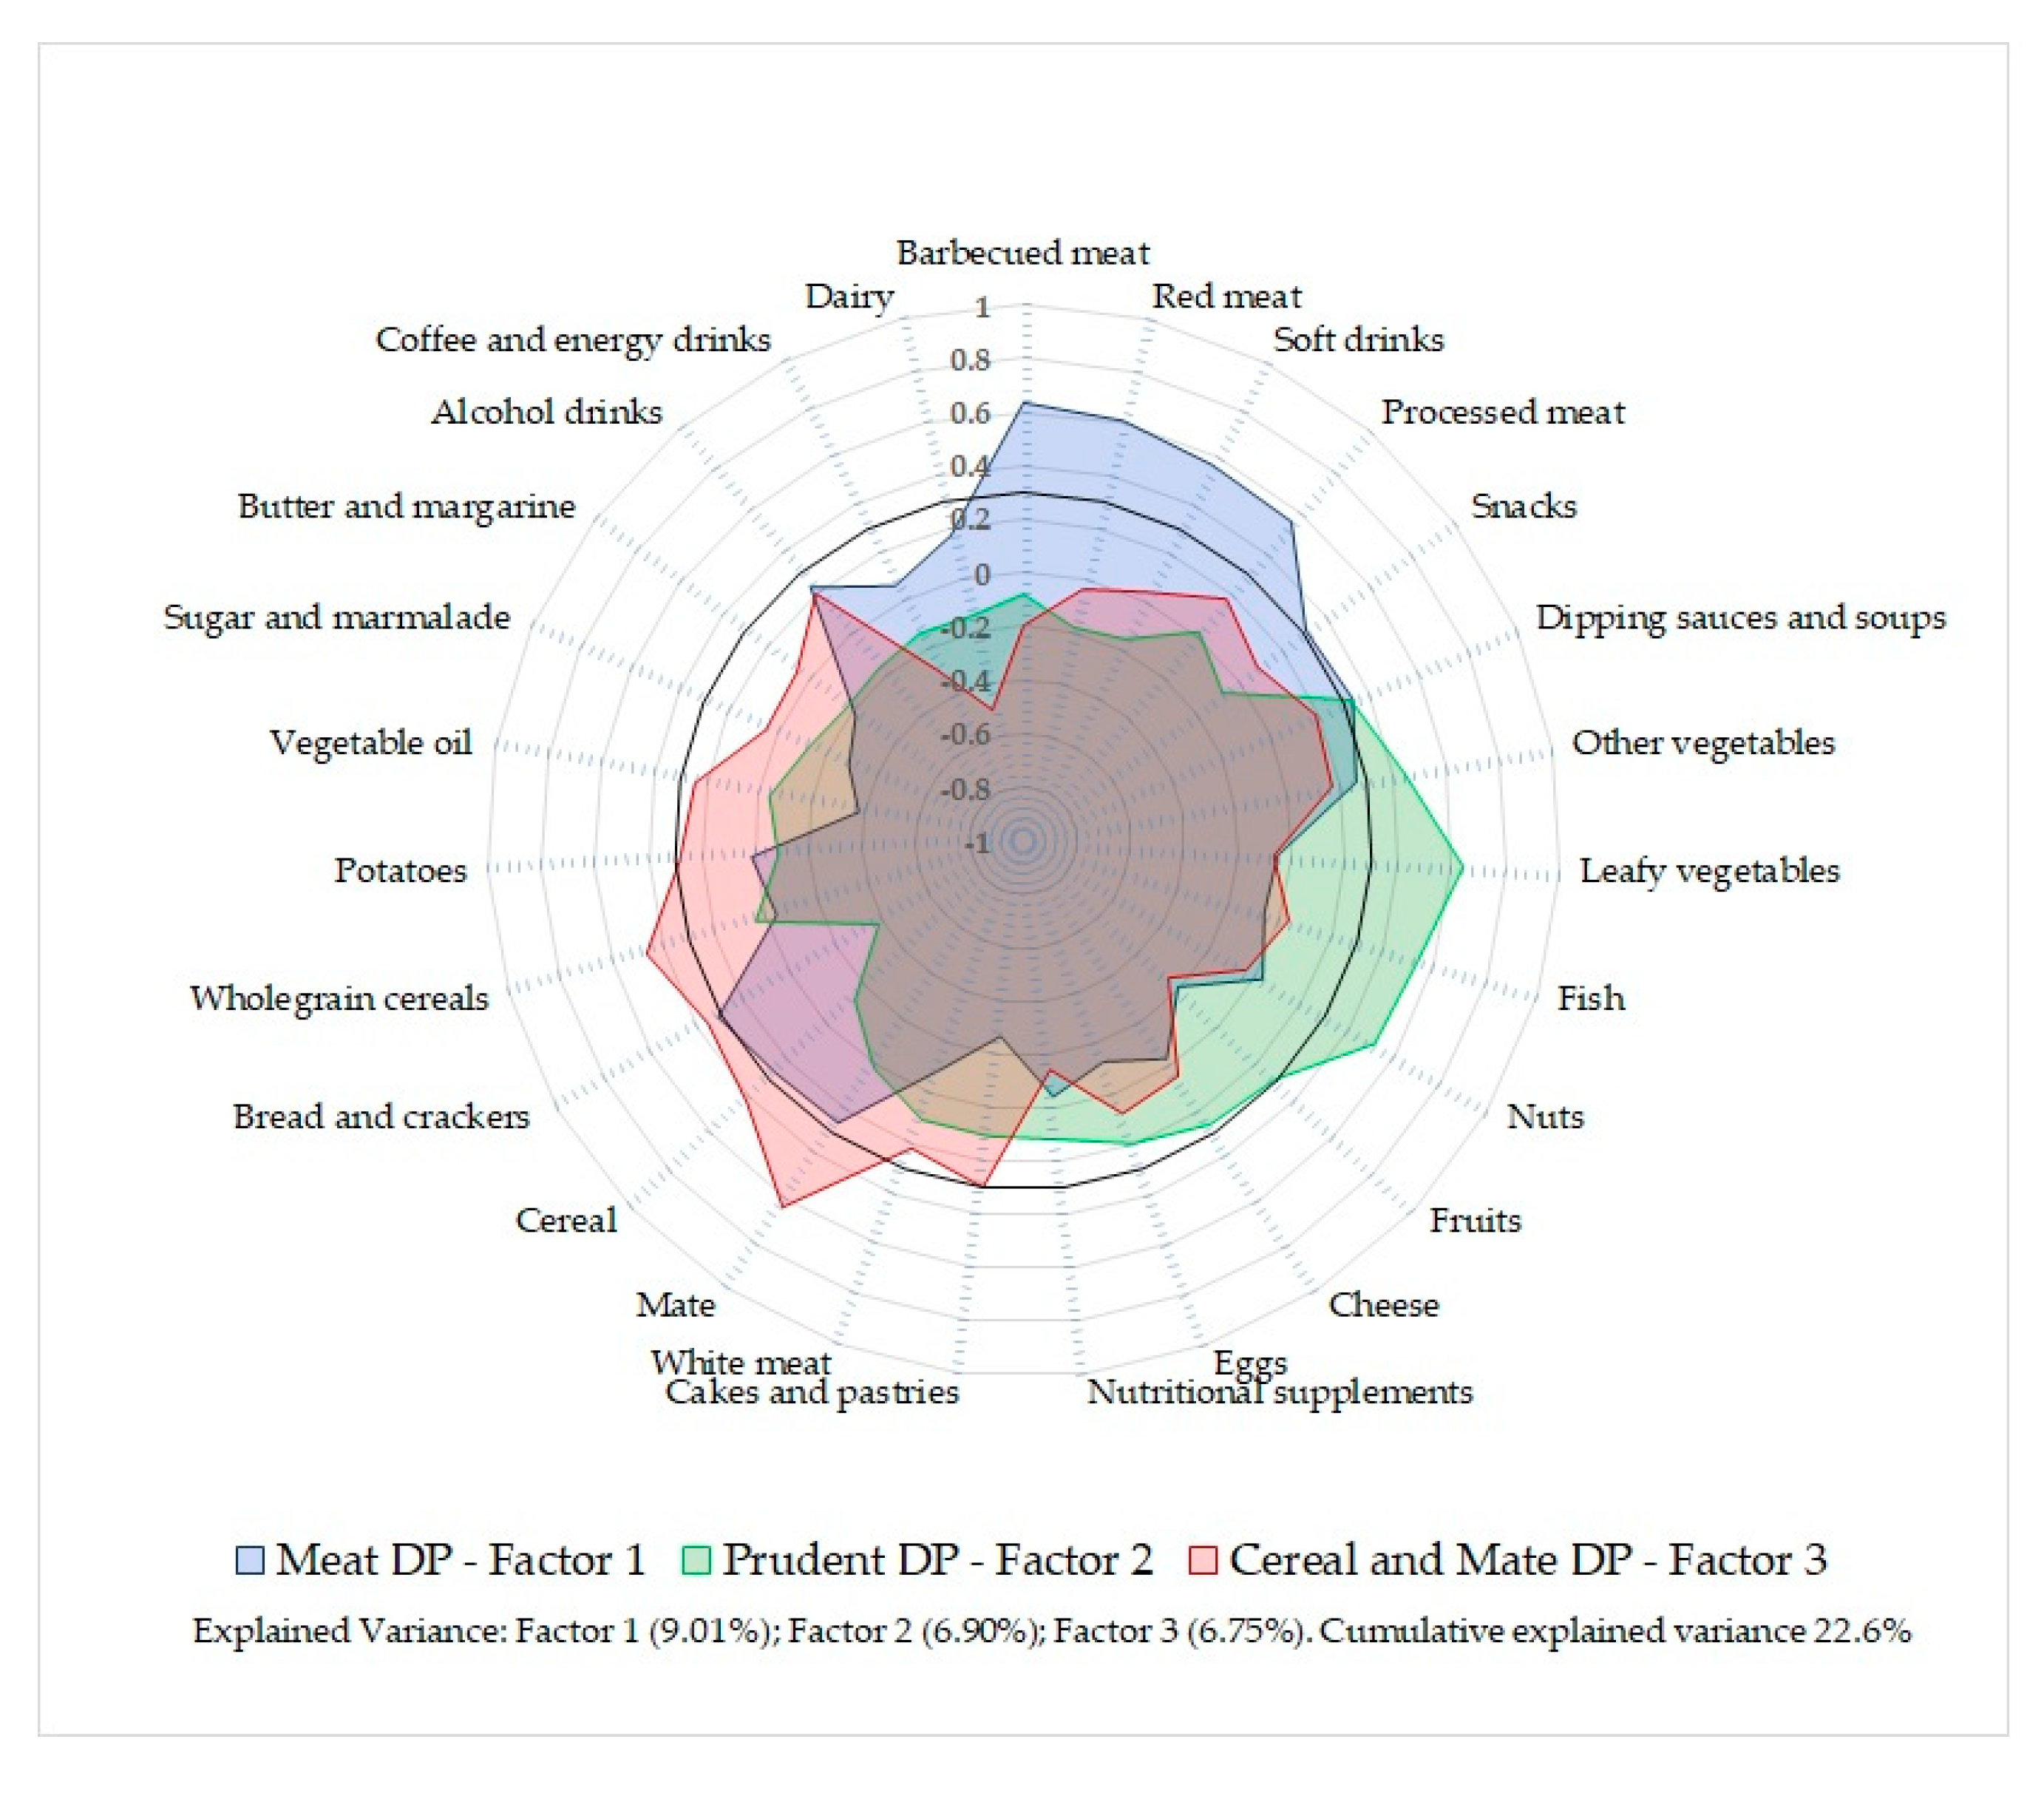
| Original Food Groups | Factor 1 Meat DP | Factor 2 Prudent DP | Factor 3 Cereal and Mate DP |
| Barbecued meat | 0.63 | ||
| Red meat | 0.61 | ||
| Soft drinks | 0.57 | ||
| Processed meat | 0.55 | ||
| Snacks | 0.31 | ||
| Dipping sauces/soups | 0.34 | 0.33 | |
| Other vegetables | 0.44 | ||
| Leafy vegetables | 0.64 | ||
| Fish | 0.54 | ||
| Nuts | 0.51 | ||
| Fruits | |||
| Cheese | |||
| Eggs | |||
| Nutritional supplements | |||
| Cakes and pastries | 0.30 | ||
| White meat | |||
| Mate | 0.63 | ||
| Cereal | 0.42 | ||
| Bread and crackers | 0.31 | −0.38 | 0.36 |
| Wholegrain cereals | 0.47 | ||
| Potatoes | |||
| Vegetable oil | −0.38 | ||
| Sugar/marmalade | |||
| Butter/margarine | |||
| Alcohol drinks | |||
| Coffee/energy drinks | |||
| Dairy | −0.50 | ||
| Explained variance (%) | 9.01 | 6.90 | 6.75 |
| Meat DP | Prudent DP | Cereal and Mate DP | ||||||||||
|---|---|---|---|---|---|---|---|---|---|---|---|---|
| T1 | T2 | T3 | p * | T1 | T2 | T3 | p * | T1 | T2 | T3 | p * | |
| Total energy intake (kcal/day) | 1633 | 1596 | 2124 | <0.0001 | 1893 | 1710 | 1751 | 0.13 | 1599 | 1624 | 2125 | <0.0001 |
| Protein (% energy) | 15.2 | 16.4 | 16.7 | 0.0058 | 14.8 | 15.9 | 17.6 | <0.0001 | 16.9 | 15.8 | 15.6 | 0.019 |
| Fat (% energy) | 42.2 | 41.3 | 40.3 | 0.065 | 38.7 | 41.4 | 43.6 | <0.0001 | 42.3 | 42.2 | 39.3 | 0.0043 |
| SFA (% energy) | 11.7 | 11.0 | 11.6 | 0.83 | 10.9 | 11.6 | 12.0 | 0.023 | 11.4 | 11.4 | 11.6 | 0.80 |
| MUFA (% energy) | 16.7 | 15.2 | 15.1 | 0.026 | 14.3 | 15.7 | 17.0 | <0.0001 | 16.1 | 15.9 | 15.0 | 0.11 |
| PUFA (% energy) | 11.0 | 11.5 | 9.8 | 0.039 | 10.1 | 11.0 | 11.1 | 0.076 | 11.1 | 11.5 | 9.8 | 0.019 |
| Cholesterol (mg/1000 kcal) | 101.1 | 95.9 | 101.4 | 0.97 | 76.7 | 93.3 | 127.9 | <0.0001 | 99.4 | 95.2 | 103.7 | 0.61 |
| Carbohydrate (% energy) | 42.6 | 42.3 | 43.0 | 0.74 | 46.5 | 42.7 | 38.8 | <0.0001 | 40.7 | 42.0 | 45.2 | 0.0011 |
| Fiber (g/1000 kcal) | 8.8 | 8.3 | 7.1 | 0.0006 | 7.2 | 8.0 | 9.0 | 0.0004 | 8.0 | 7.3 | 8.9 | 0.085 |
| Sodium (mg/day) | 1116.5 | 1408.2 | 2340.8 | <0.0001 | 1715.2 | 1604.9 | 1549.9 | 0.28 | 1358.0 | 1389.9 | 2113.2 | <0.0001 |
| Calcium (mg/day) | 768.6 | 810.2 | 825.7 | 0.39 | 718 | 768 | 917 | 0.0025 | 951 | 750 | 705 | 0.0002 |
| Alcohol (g/day) | 8.0 | 12.8 | 27.5 | <0.0001 | 26.8 | 13.9 | 13.4 | 0.0030 | 15.8 | 20.1 | 18.2 | 0.63 |
| Meat DP | Prudent DP | Cereal and Mate DP | ||||||||||
|---|---|---|---|---|---|---|---|---|---|---|---|---|
| T1 | T2 | T3 | p * | T1 | T2 | T3 | p * | T1 | T2 | T3 | p * | |
| n | 97 | 99 | 98 | 97 | 98 | 99 | 98 | 97 | 99 | |||
| Female, n (%) | 74 (76.3) | 68 (68.7) | 57 (58.2) | 0.0068 | 62 (63.9) | 66 (67.4) | 71 (71.7) | 0.24 | 63 (64.3) | 77 (79.4) | 59 (59.6) | 0.48 |
| Age, (years) ǂ | 60.4 ± 14.4 | 53.8 ± 16.5 | 44.5 ± 15.5 | <0.0001 | 49.5 ± 18.6 | 54.0 ± 15.9 | 55.1 ± 15.2 | 0.018 | 52.0 ± 17.9 | 53.8 ± 16.4 | 52.9 ± 16.0 | 0.72 |
| Education ≤9 years, n (%) | 66 (68.8) | 54 (54.6) | 68 (69.4) | 0.91 | 68 (70.1) | 66 (67.4) | 54 (55.1) | 0.029 | 52 (53.6) | 66 (68.0) | 70 (70.7) | 0.013 |
| Low physical activity, n (%) | 75 (77.3) | 73 (73.7) | 74 (75.5) | 0.77 | 75 (77.3) | 75 (76.5) | 72 (72.7) | 0.45 | 64 (65.3) | 79 (81.4) | 79 (79.8) | 0.018 |
| Current smokers, n (%) | 7 (7.5) | 18 (19.6) | 30 (33.3) | <0.0001 | 17 (17.7) | 17 (19.5) | 21 (22.8) | 0.38 | 11 (12.0) | 19 (20.7) | 25 (27.5) | 0.009 |
| Alcohol use, n (%) | 28 (30.1) | 26 (28.3) | 43 (47.8) | 0.013 | 31 (32.3) | 32 (36.8) | 34 (37.0) | 0.50 | 29 (31.2) | 25 (27.5) | 43 (47.3) | 0.023 |
| Obesity, n (%) | 39 (40.2) | 40 (40.4) | 37 (37.8) | 0.73 | 37 (38.1) | 48 (49.0) | 31 (31.3) | 0.32 | 39 (39.8) | 40 (41.2) | 37 (37.4) | 0.73 |
| Hypertension, n (%) | 46 (47.4) | 40 (40.4) | 21 (21.4) | 0.0002 | 28 (28.9) | 41 (41.8) | 38 (38.4) | 0.17 | 32 (32.7) | 40 (41.2) | 35 (35.4) | 0.70 |
| Uncontrolled HT-OBP, n (%) | 27 (27.8) | 23 (23.2) | 10 (10.2) | 0.0022 | 15 (15.5) | 22 (22.5) | 23 (23.2) | 0.18 | 18 (18.4) | 22 (22.7) | 20 (20.2) | 0.75 |
| Uncontrolled HT-ABPM, n (%) | 21 (29.6) | 16 (25.4) | 20 (33.9) | 0.62 | 16 (28.1) | 19 (28.4) | 22 (31.9) | 0.63 | 15 (26.3) | 20 (30.3) | 22 (31.4) | 0.54 |
| Arterial stiffness, n (%) | 22 (31.4) | 17 (28.3) | 5 (11.4) | 0.022 | 7 (16.3) | 22 (39.3) | 15 (20.0) | 0.98 | 11 (21.2) | 18 (30.5) | 15 (23.8) | 0.79 |
| Pulse wave velocity (m/s) ǂ | 9.2 ± 2.9 | 9.2 ± 3.1 | 8.0 ± 2.7 | 0.061 | 7.9 ± 2.8 | 9.7 ± 3.2 | 8.8 ± 2.6 | 0.23 | 8.5 ± 2.7 | 8.9 ± 2.8 | 9.2 ± 3.2 | 0.23 |
| Diabetes, n (%) | 15 (15.5) | 11 (11.1) | 5 (5.1) | 0.019 | 8 (8.3) | 11 (11.2) | 12 (12.1) | 0.38 | 9 (9.2) | 11 (11.3) | 11 (11.1) | 0.66 |
| Proteinuria (g/24 h) ǂ | 0.14 (0.16) | 0.12 (0.063) | 0.17 (0.10) | 0.13 | 0.15 (0.083) | 0.15 (0.17) | 0.13 (0.08) | 0.26 | 0.13 (0.10) | 0.15 (0.16) | 0.14 (0.08) | 0.95 |
| ACR (mg/g) ǂ | 12.5 ± 43.9 | 6.6 ± 10.8 | 10.7 ± 24.9 | 0.90 | 6.1 ± 16.0 | 12.2 ± 37.2 | 12.2 ± 25.7 | 0.23 | 9.1 ± 34.6 | 7.7 ± 15.7 | 12.4 ± 26.9 | 0.56 |
| CKD, n (%) | 3 (8.6) | 3 (5.9) | 5 (7.3) | 0.87 | 2 (3.2) | 5 (9.4) | 4 (10.0) | 0.16 | 2 (3.5) | 5 (10.4) | 4 (8.0) | 0.35 |
| Nephrolithiasis, n (%) | 13 (13.4) | 12 (12.1) | 12 (12.2) | 0.81 | 14 (14.4) | 12 (12.2) | 11 (11.1) | 0.48 | 13 (13.3) | 14 (14.4) | 10 (10.1) | 0.50 |
| Meat DP | Prudent DP | Cereal and Mate DP | ||||||||||
|---|---|---|---|---|---|---|---|---|---|---|---|---|
| T1 | T2 | T3 | p * | T1 | T2 | T3 | p * | T1 | T2 | T3 | p * | |
| Metabolic characteristics | ||||||||||||
| Fasting glucose (mg/dL) | 93.3 | 92.6 | 98.6 | 91.9 | 91.0 | 101.3 | 93.7 | 95.8 | 95.9 | |||
| Adjusted median difference | Ref | 0.57 | 1.82 | 0.49 | Ref | 1.72 | 4.48 | 0.097 | Ref | 0.055 | 0.14 | 0.96 |
| Total cholesterol (mg/dL) | 208.2 | 207.2 | 203.0 | 201.1 | 206.2 | 208.9 | 208.0 | 205.3 | 204.2 | |||
| Adjusted median difference | Ref | −0.53 | −1.70 | 0.69 | Ref | 2.23 | 5.81 | 0.17 | Ref | 0.070 | 0.17 | 0.97 |
| Triglyceride (mg/dL) | 139.0 | 131.8 | 155.8 | 134.9 | 154.2 | 138.4 | 153.8 | 133.6 | 139.9 | |||
| Adjusted median difference | Ref | 5.23 | 16.68 | 0.040 | Ref | 0.42 | 1.08 | 0.90 | Ref | 0.40 | 0.99 | 0.91 |
| LDLc (mg/dL) | 127.6 | 128.0 | 126.6 | 123.8 | 125.2 | 131.9 | 127.5 | 127.7 | 126.9 | |||
| Adjusted median difference | Ref | −0.24 | −0.78 | 0.82 | Ref | 2.42 | 6.31 | 0.075 | Ref | −0.39 | −0.98 | 0.80 |
| HDLc (mg/dL) | 49.6 | 52.1 | 46.0 | 51.6 | 47.0 | 49.3 | 48.3 | 49.5 | 49.6 | |||
| Adjusted median difference | Ref | −1.09 | −3.48 | 0.012 | Ref | −0.24 | −0.62 | 0.66 | Ref | 0.78 | 1.95 | 0.20 |
| Non-HDL colesterol (mg/dL) | 158.1 | 154.8 | 157.1 | 149.7 | 158.0 | 160.0 | 158.9 | 155.2 | 155.2 | |||
| Adjusted median difference | Ref | 0.36 | 1.13 | 0.78 | Ref | 2.60 | 6.79 | 0.10 | Ref | −0.43 | −1.07 | 0.81 |
| TG/HDLc ratio | 3.19 | 2.97 | 3.80 | 3.01 | 3.72 | 3.25 | 3.62 | 3.12 | 3.27 | |||
| Adjusted median difference | Ref | 0.22 | 0.70 | 0.0031 | Ref | 0.0082 | 0.021 | 0.93 | Ref | −0.051 | −0.13 | 0.63 |
| HOMA-r | 2.83 | 2.87 | 3.57 | 2.61 | 2.96 | 3.69 | 2.95 | 3.38 | 3.13 | |||
| Adjusted median difference | Ref | 0.17 | 0.54 | 0.044 | Ref | 0.17 | 0.44 | 0.10 | Ref | 0.0099 | 0.025 | 0.93 |
| Neut/Lymph ratio | 1.91 | 1.90 | 1.89 | 1.87 | 1.99 | 1.84 | 1.83 | 1.99 | 1.89 | |||
| Adjusted median difference | Ref | 0.045 | 0.14 | 0.096 | Ref | −0.009 | −0.023 | 0.79 | Ref | 0.057 | 0.14 | 0.13 |
| Serum 25(OH)D (ng/mL) | 26.9 | 23.9 | 25.8 | 25.6 | 24.3 | 26.2 | 24.7 | 26.8 | 25.0 | |||
| Adjusted median difference | Ref | −0.31 | −1.00 | 0.27 | Ref | 0.35 | 0.92 | 0.32 | Ref | 0.32 | 0.80 | 0.43 |
| Anthropometric characteristics | ||||||||||||
| BMI (kg/m2) | 27.3 | 28.2 | 28.2 | 27.1 | 29.2 | 27.6 | 28.0 | 27.6 | 28.2 | |||
| Adjusted median difference | Ref | 0.22 | 0.69 | 0.29 | Ref | 0.18 | 0.46 | 0.48 | Ref | −0.029 | −0.071 | 0.92 |
| Waist/height ratio | 0.58 | 0.58 | 0.59 | 0.59 | 0.59 | 0.58 | 0.59 | 0.58 | 0.59 | |||
| Adjusted median difference | Ref | 0.0026 | 0.0084 | 0.10 | Ref | −0.002 | −0.004 | 0.40 | Ref | 0.0015 | 0.0037 | 0.50 |
| Cardiovascular and renal characteristics | ||||||||||||
| Systolic BP (mm Hg) | 124.2 | 125.4 | 124.9 | 123.9 | 124.5 | 126.1 | 124.6 | 124.1 | 125.8 | |||
| Adjusted median difference | Ref | −0.21 | −0.66 | 0.67 | Ref | 0.18 | 0.47 | 0.77 | Ref | 1.30 | 3.24 | 0.059 |
| Diastolic BP (mm Hg) | 81.2 | 82.0 | 80.2 | 80.1 | 80.2 | 82.8 | 81.0 | 81.1 | 81.2 | |||
| Adjusted median difference | Ref | −0.29 | −0.91 | 0.34 | Ref | 0.44 | 1.14 | 0.24 | Ref | 0.42 | 1.03 | 0.32 |
| ABPM Systolic BP (mm Hg) | 118.7 | 121.9 | 123.2 | 122.7 | 122.0 | 120.3 | 121.3 | 119.7 | 122.4 | |||
| Adjusted median difference | Ref | 0.66 | 2.08 | 0.20 | Ref | −0.57 | −1.53 | 0.37 | Ref | 1.65 | 3.73 | 0.021 |
| ABPM Diastolic BP (mm Hg) | 75.2 | 76.1 | 77.9 | 76.4 | 76.6 | 76.4 | 76.0 | 75.1 | 77.4 | |||
| Adjusted median difference | Ref | 0.20 | 0.62 | 0.62 | Ref | 0.084 | 0.23 | 0.86 | Ref | 1.43 | 3.22 | 0.010 |
| Pulse wave velocity (m/s) | 8.55 | 9.32 | 8.93 | 8.05 | 9.49 | 8.98 | 8.79 | 8.75 | 9.17 | |||
| Adjusted median difference | Ref | 0.12 | 0.33 | 0.38 | Ref | 0.010 | 0.025 | 0.94 | Ref | 0.050 | 0.13 | 0.74 |
| Serum creatinine (mg/dl) | 0.82 | 0.81 | 0.85 | 0.81 | 0.85 | 0.83 | 0.83 | 0.82 | 0.84 | |||
| Adjusted median difference | Ref | 0.0013 | 0.0041 | 0.82 | Ref | 0.0076 | 0.020 | 0.29 | Ref | 0.0048 | 0.012 | 0.56 |
| Proteinuria (g/24-h) | 0.15 | 0.12 | 0.17 | 0.15 | 0.15 | 0.13 | 0.14 | 0.16 | 0.13 | |||
| Adjusted median difference | Ref | 0.0054 | 0.017 | 0.26 | Ref | −0.003 | −0.008 | 0.57 | Ref | −0.0004 | −0.001 | 0.95 |
| ACR (mg/g) | 14.9 | 7.3 | 15.6 | 9.3 | 14.0 | 15.3 | 11.6 | 10.0 | 17.0 | |||
| Adjusted median difference | Ref | 0.081 | 0.25 | 0.95 | Ref | 095 | 2.65 | 0.55 | Ref | 2.28 | 6.04 | 0.19 |
| eGFR (mL/min/1.73 m2) | 95.5 | 95.9 | 92.1 | 96.0 | 93.2 | 94.1 | 94.2 | 94.9 | 93.9 | |||
| Adjusted median difference | Ref | −0.30 | −0.97 | 0.49 | Ref | −0.77 | −2.02 | 0.16 | Ref | −0.17 | −0.43 | 0.78 |
| Variables | Meat DP | Prudent DP | Cereal and Mate DP | ||||||||||||
|---|---|---|---|---|---|---|---|---|---|---|---|---|---|---|---|
| T1 | T2 | T3 | T1 | T2 | T3 | T1 | T2 | T3 | |||||||
| Ref | OR | 95% CI | OR | 95% CI | Ref | OR | 95% CI | OR | 95% CI | Ref | OR | 95% CI | OR | 95% CI | |
| Hypertension (Office SBP ≥ 140 mm Hg or DBP ≥ 90 mm Hg or use of antihypertensive drugs) | |||||||||||||||
| Adjusted | 1.00 | 2.14 | 0.69–6.62 | 0.37 | 0.08–1.81 | 1.00 | 1.64 | 0.48–5.62 | 1.97 | 0.61–6.41 | 1.00 | 1.34 | 0.44–4.04 | 0.65 | 0.18–2.30 |
| Uncontrolled hypertension by office measurement (SBP ≥ 140 mm Hg or DBP ≥ 90 mm Hg) | |||||||||||||||
| Adjusted | 1.00 | 1.19 | 0.57–2.47 | 0.48 | 0.18–1.31 | 1.00 | 1.35 | 0.59–3.06 | 1.67 | 0.75–3.74 | 1.00 | 1.08 | 0.49–2.38 | 0.96 | 0.42–2.19 |
| Uncontrolled hypertension by ABPM measurement (SBP ≥ 130 mm Hg or DBP ≥ 80 mm Hg) | |||||||||||||||
| Adjusted | 1.00 | 0.95 | 0.41–2.18 | 1.83 | 0.69–4.82 | 1.00 | 0.81 | 0.33–1.97 | 1.00 | 0.43–2.35 | 1.00 | 1.26 | 0.53–3.00 | 0.95 | 0.40–2.28 |
| Arterial stiffness (pulse wave velocity > 10 m/s) | |||||||||||||||
| Adjusted | 1.00 | 2.86 | 0.84–9.80 | 2.14 | 0.46–9.99 | 1.00 | 4.05 | 0.97–16.93 | 1.76 | 0.49–6.34 | 1.00 | 0.95 | 0.28–3.27 | 0.55 | 0.14–2.26 |
| High TG/HDLc ratio (>3.75 for men and >3.0 for women) | |||||||||||||||
| Adjusted | 1.00 | 0.93 | 0.47–1.82 | 1.11 | 0.51–2.39 | 1.00 | 1.46 | 0.76–2.79 | 0.85 | 0.43–1.67 | 1.00 | 0.55 | 0.28–1.07 | 0.72 | 0.36–1.43 |
| Overweight (BMI ≥ 25 < 30 kg/m2) | |||||||||||||||
| Adjusted | 1.00 | 1.30 | 0.69–2.43 | 0.96 | 0.46–1.99 | 1.00 | 1.16 | 0.62–2.18 | 1.42 | 0.77–2.65 | 1.00 | 2.14 | 1.11–4.12 | 2.76 | 1.40–5.47 |
| Overweight and Obesity (BMI > 25 kg/m2) | |||||||||||||||
| Adjusted | 1.00 | 1.82 | 0.84–3.95 | 1.01 | 0.43–2.36 | 1.00 | 3.12 | 1.39–7.02 | 1.33 | 0.66–2.68 | 1.00 | 2.26 | 1.10–4.65 | 2.48 | 1.13–5.43 |
| High waist-to-height ratio (≥0.5) | |||||||||||||||
| Adjusted | 1.00 | 0.53 | 0.15–1.89 | 1.43 | 0.36–5.74 | 1.00 | 0.84 | 0.21–3.32 | 0.66 | 0.20–2.14 | 1.00 | 0.55 | 0.16–1.84 | 1.64 | 0.38–6.99 |
| Vitamin D deficiency (serum 25(OH)D < 12 ng/mL) | |||||||||||||||
| Adjusted | 1.00 | 4.82 | 1.32–17.65 | 3.07 | 0.60–15.66 | 1.00 | 0.64 | 0.20–2.02 | 0.22 | 0.048–0.99 | 1.00 | 0.74 | 0.23–2.38 | 0.72 | 0.20–2.60 |
| Chronic kidney disease (eGFR < 60 mL/min/1.73 m2 or ACR > 30 mg/g) | |||||||||||||||
| Adjusted | 1.00 | 0.64 | 0.11–3.75 | 1.31 | 0.21–8.27 | 1.00 | 2.96 | 0.49–17.68 | 3.61 | 0.56–23.48 | 1.00 | 3.33 | 0.54–20.64 | 2.94 | 0.40–21.61 |
| Nephrolithiasis (yes) | |||||||||||||||
| Adjusted | 1.00 | 0.98 | 0.38–2.54 | 1.74 | 0.58–5.28 | 1.00 | 0.61 | 0.24–1.51 | 0.59 | 0.23–1.53 | 1.00 | 1.52 | 0.61–3.80 | 0.88 | 0.32–2.39 |
Publisher’s Note: MDPI stays neutral with regard to jurisdictional claims in published maps and institutional affiliations. |
© 2021 by the authors. Licensee MDPI, Basel, Switzerland. This article is an open access article distributed under the terms and conditions of the Creative Commons Attribution (CC BY) license (https://creativecommons.org/licenses/by/4.0/).
Share and Cite
Moliterno, P.; Donangelo, C.M.; Borgarello, L.; Pécora, M.; Olascoaga, A.; Noboa, O.; Boggia, J. Association of Dietary Patterns with Cardiovascular and Kidney Phenotypes in an Uruguayan Population Cohort. Nutrients 2021, 13, 2213. https://doi.org/10.3390/nu13072213
Moliterno P, Donangelo CM, Borgarello L, Pécora M, Olascoaga A, Noboa O, Boggia J. Association of Dietary Patterns with Cardiovascular and Kidney Phenotypes in an Uruguayan Population Cohort. Nutrients. 2021; 13(7):2213. https://doi.org/10.3390/nu13072213
Chicago/Turabian StyleMoliterno, Paula, Carmen Marino Donangelo, Luciana Borgarello, Matías Pécora, Alicia Olascoaga, Oscar Noboa, and José Boggia. 2021. "Association of Dietary Patterns with Cardiovascular and Kidney Phenotypes in an Uruguayan Population Cohort" Nutrients 13, no. 7: 2213. https://doi.org/10.3390/nu13072213