
Universal Free Meals Associated with Lower Meal Costs While Maintaining Nutritional Quality


Abstract
:1. Introduction
2. Materials and Methods
2.1. Data and Design
2.2. Measures
2.3. Study Sample
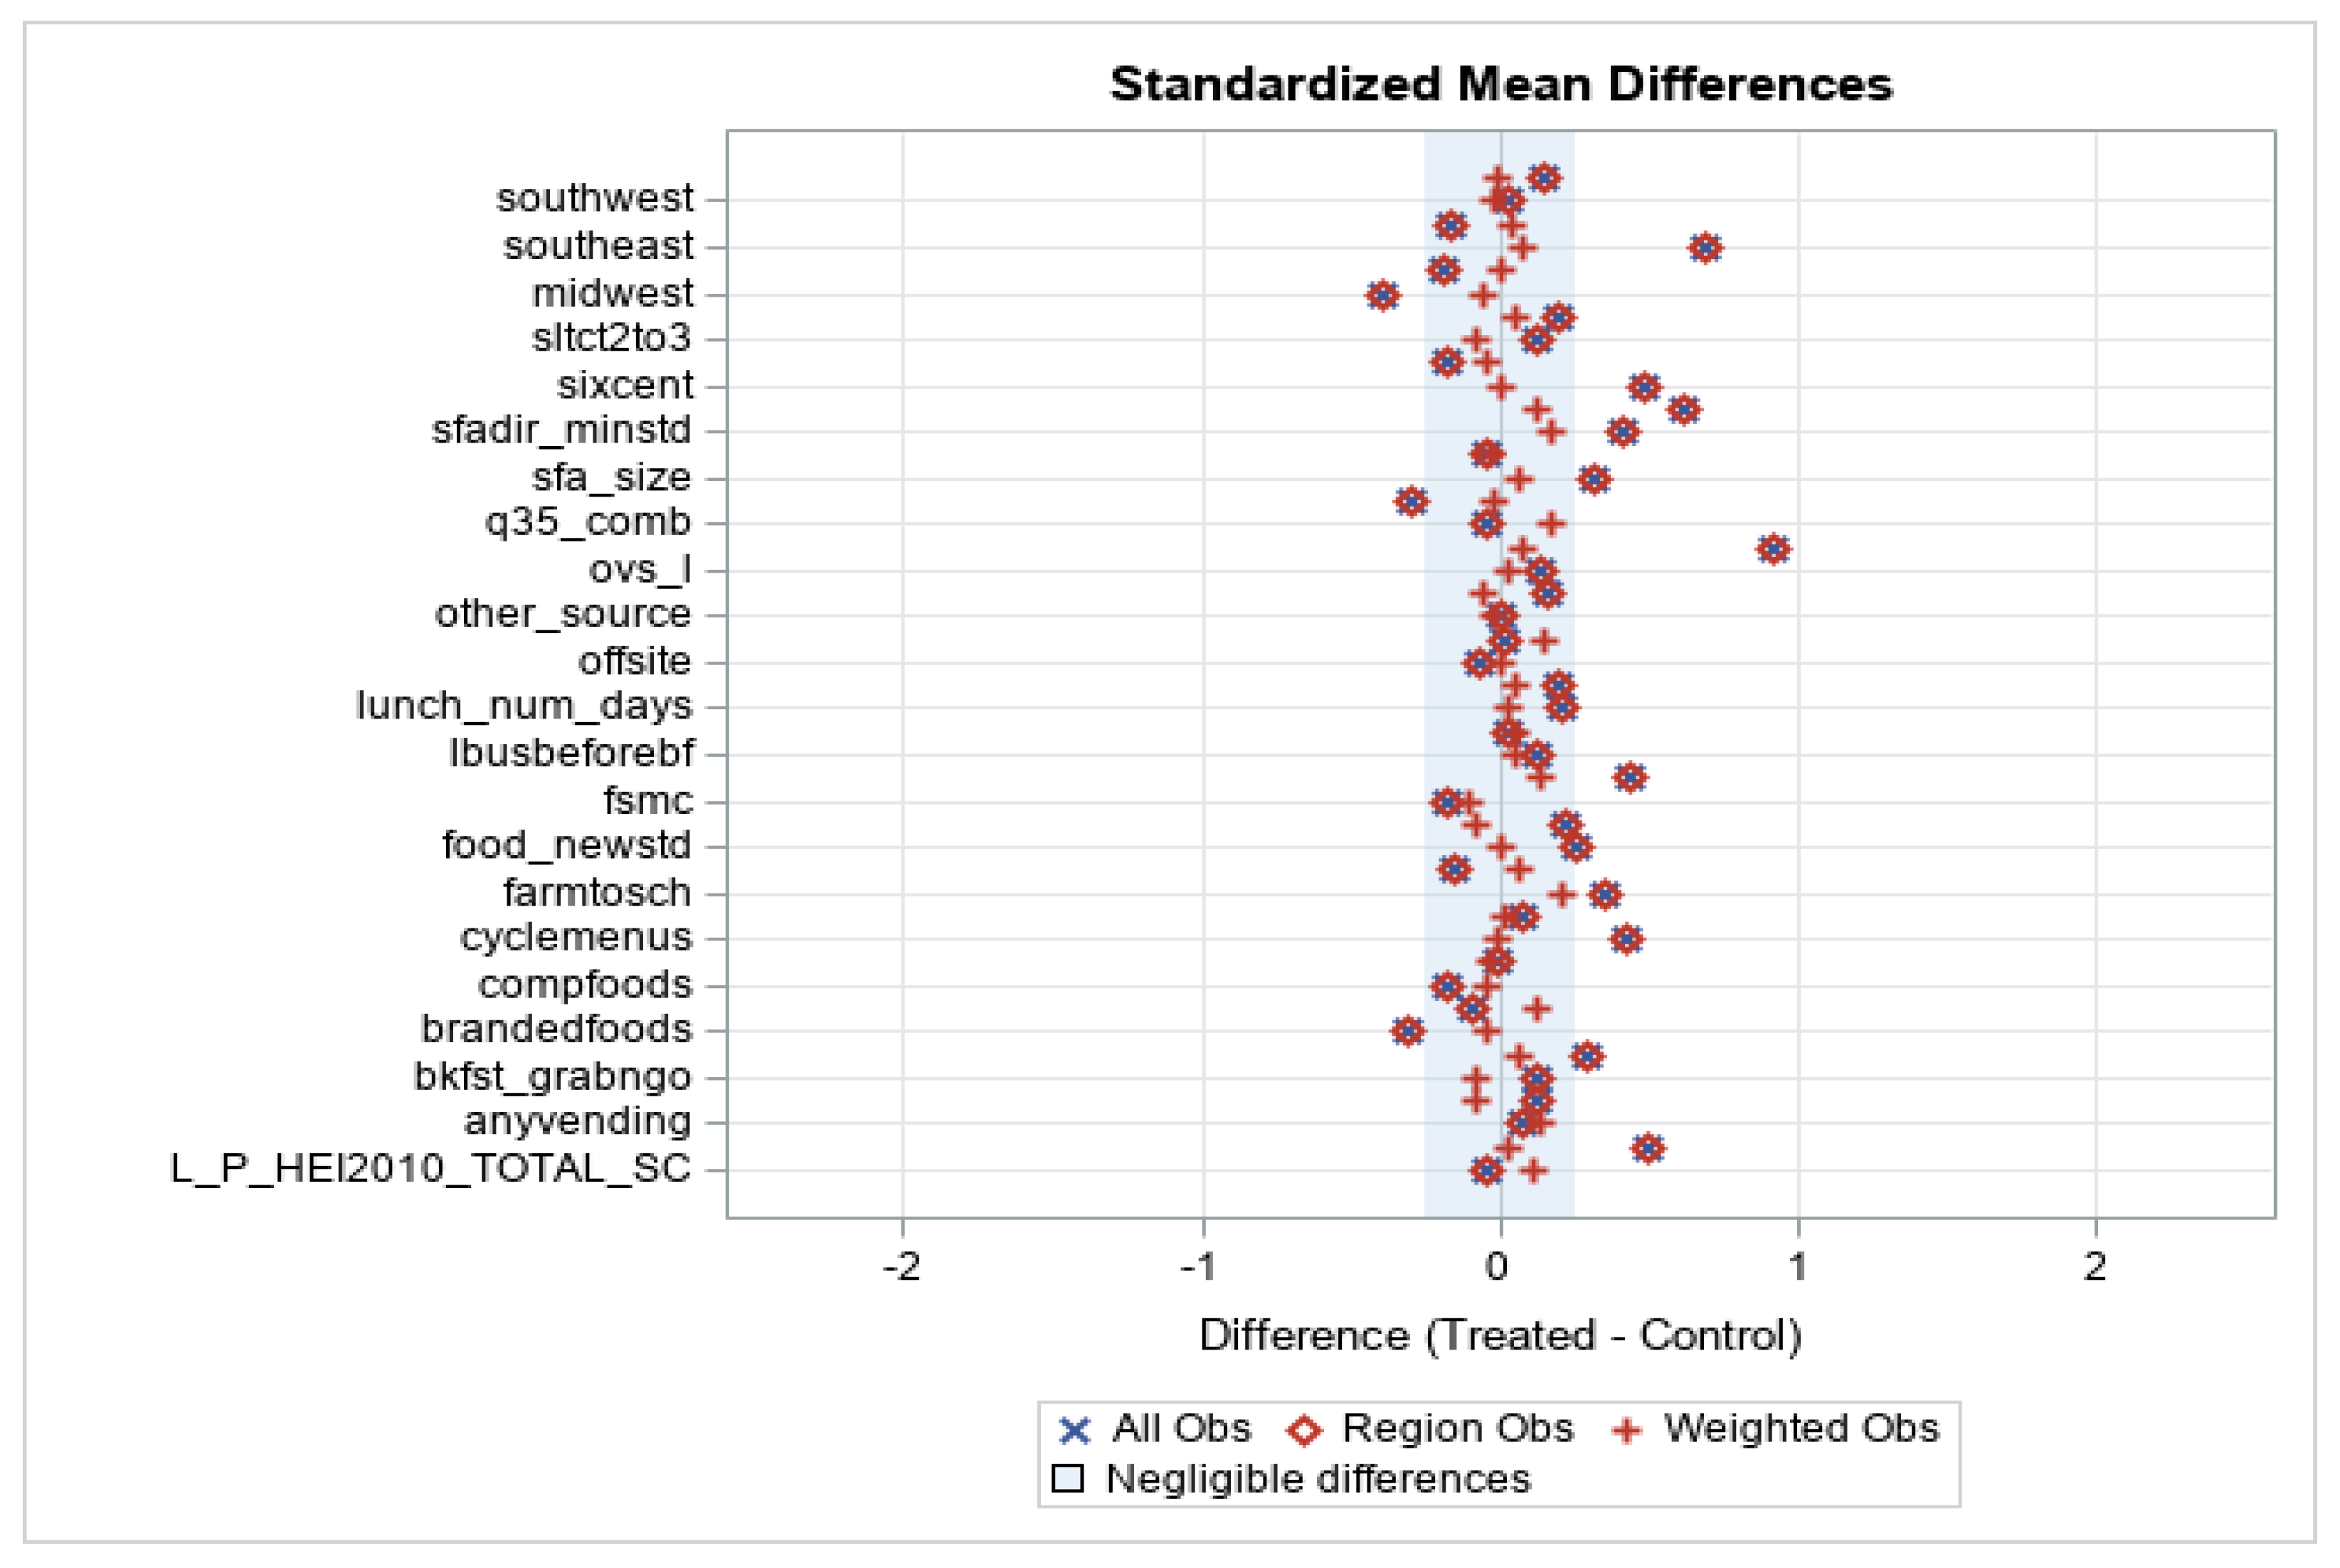
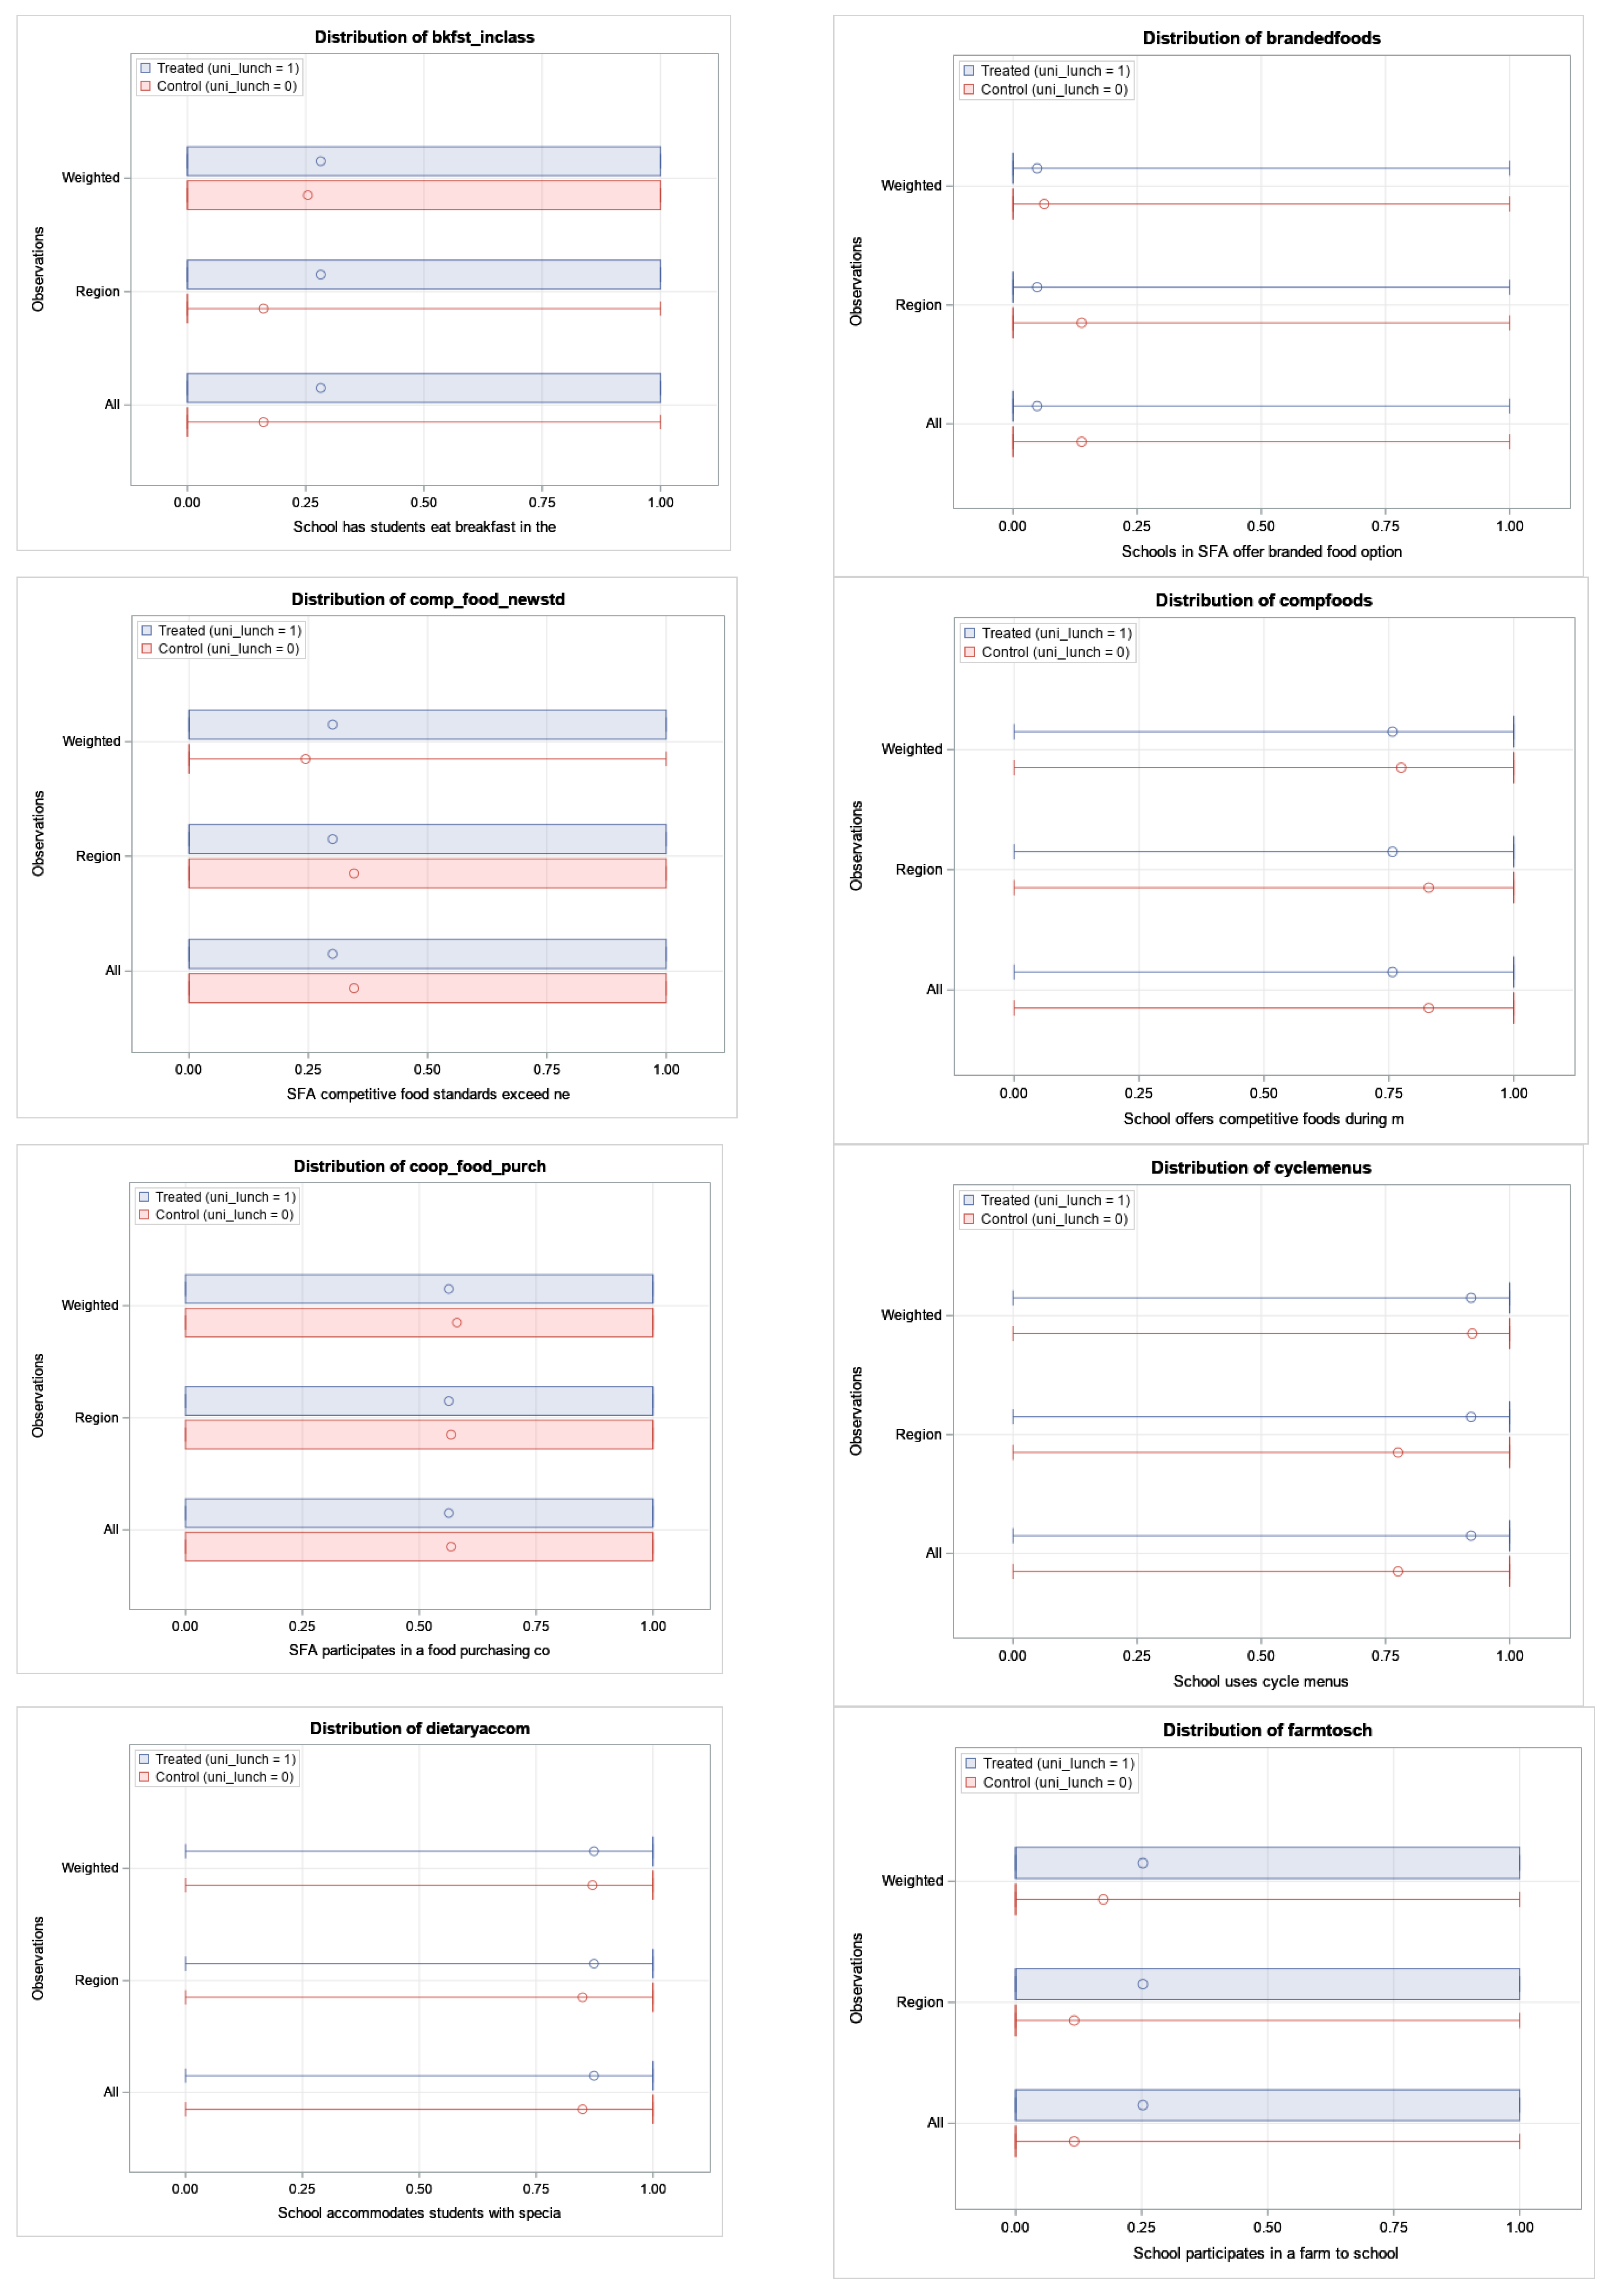
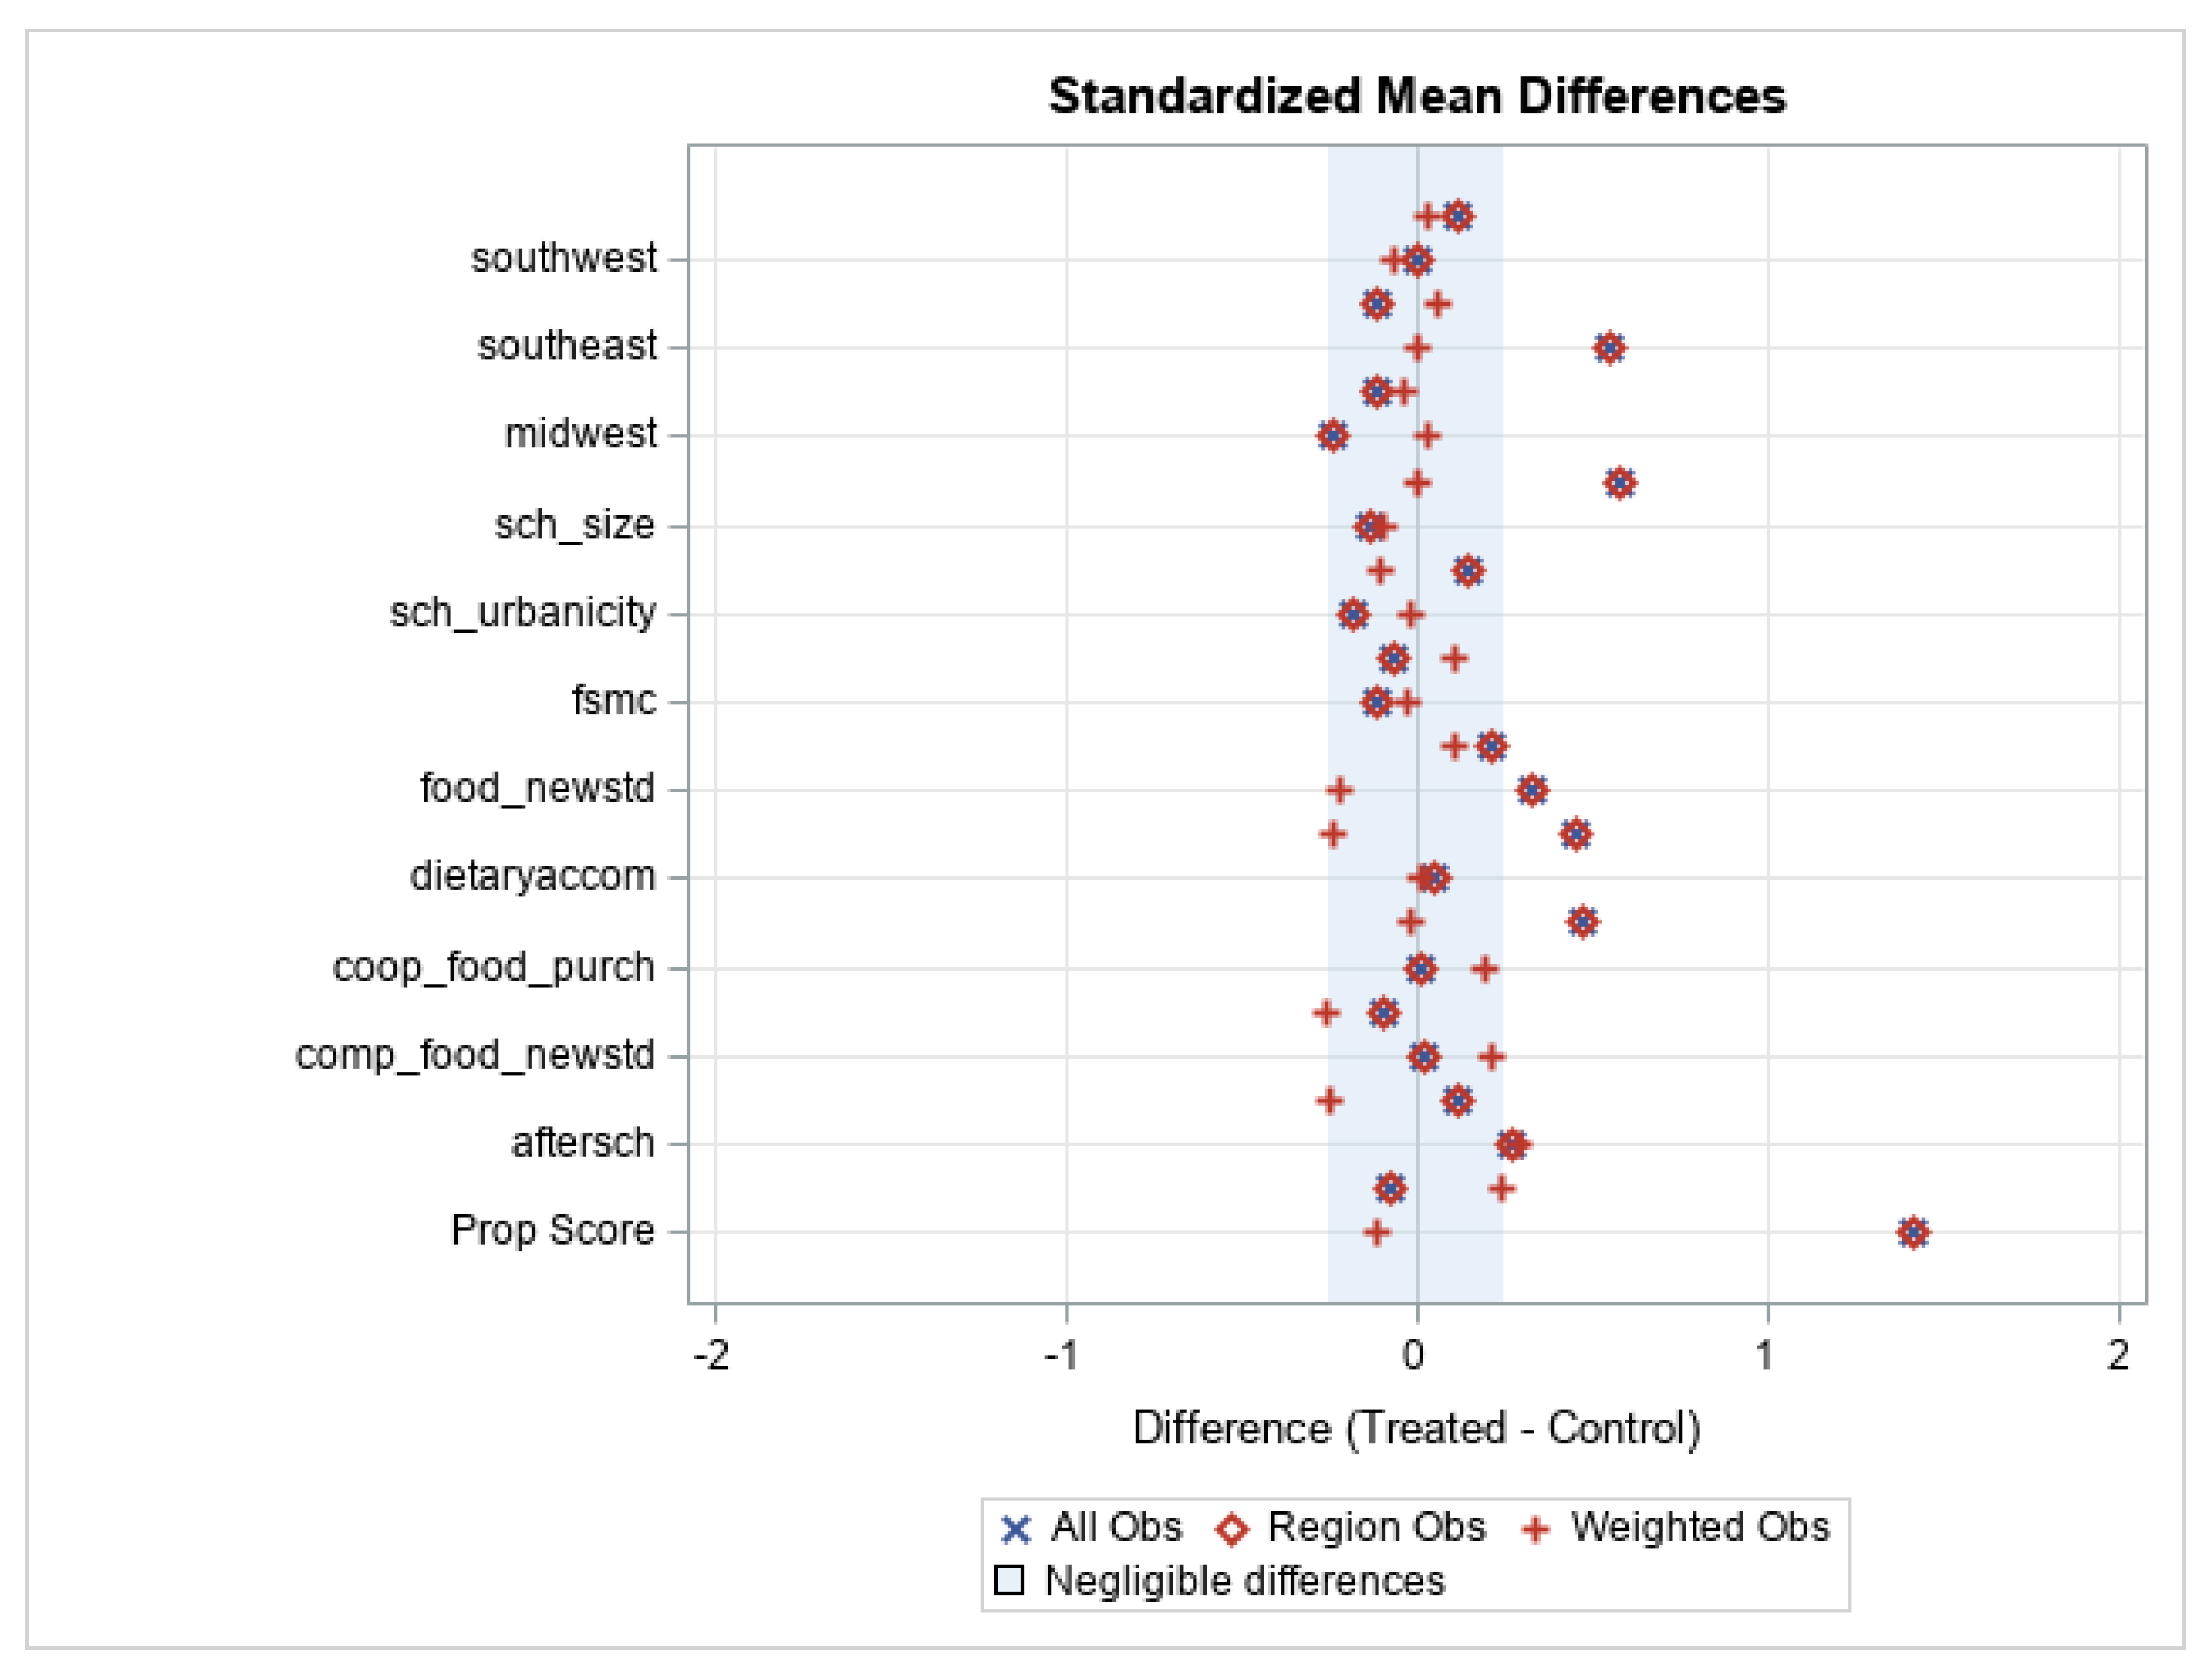
2.4. Data Analysis
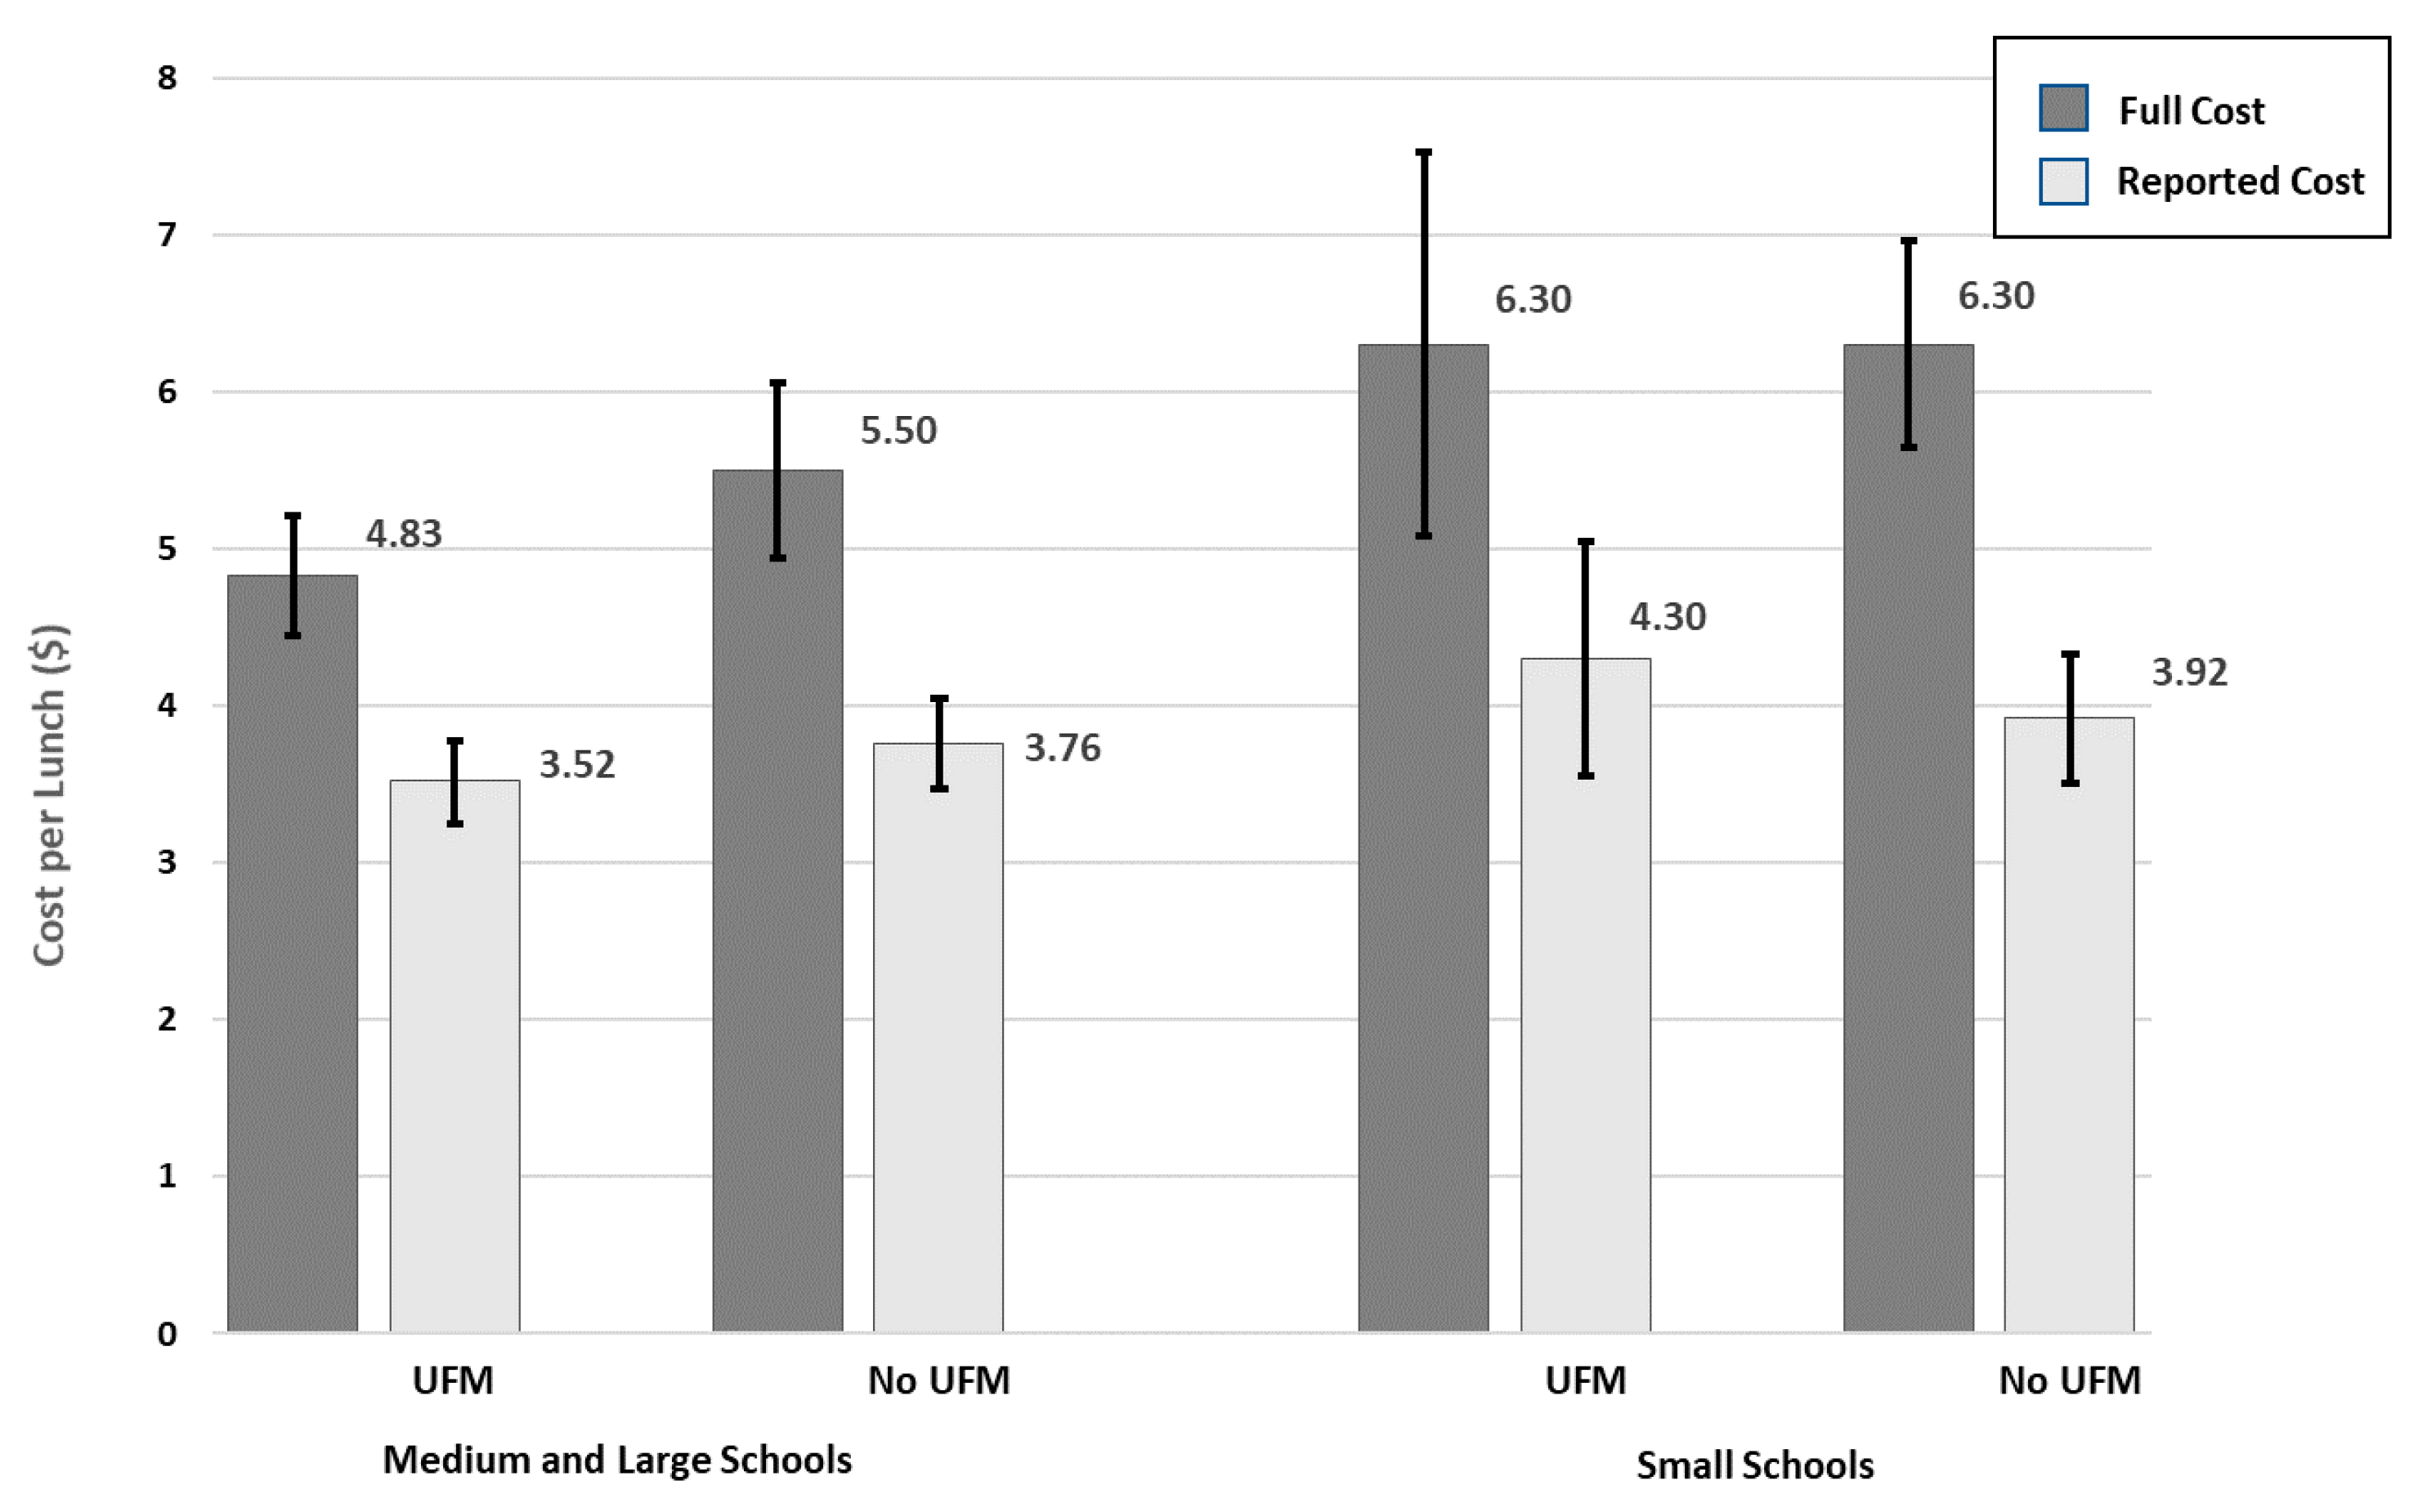
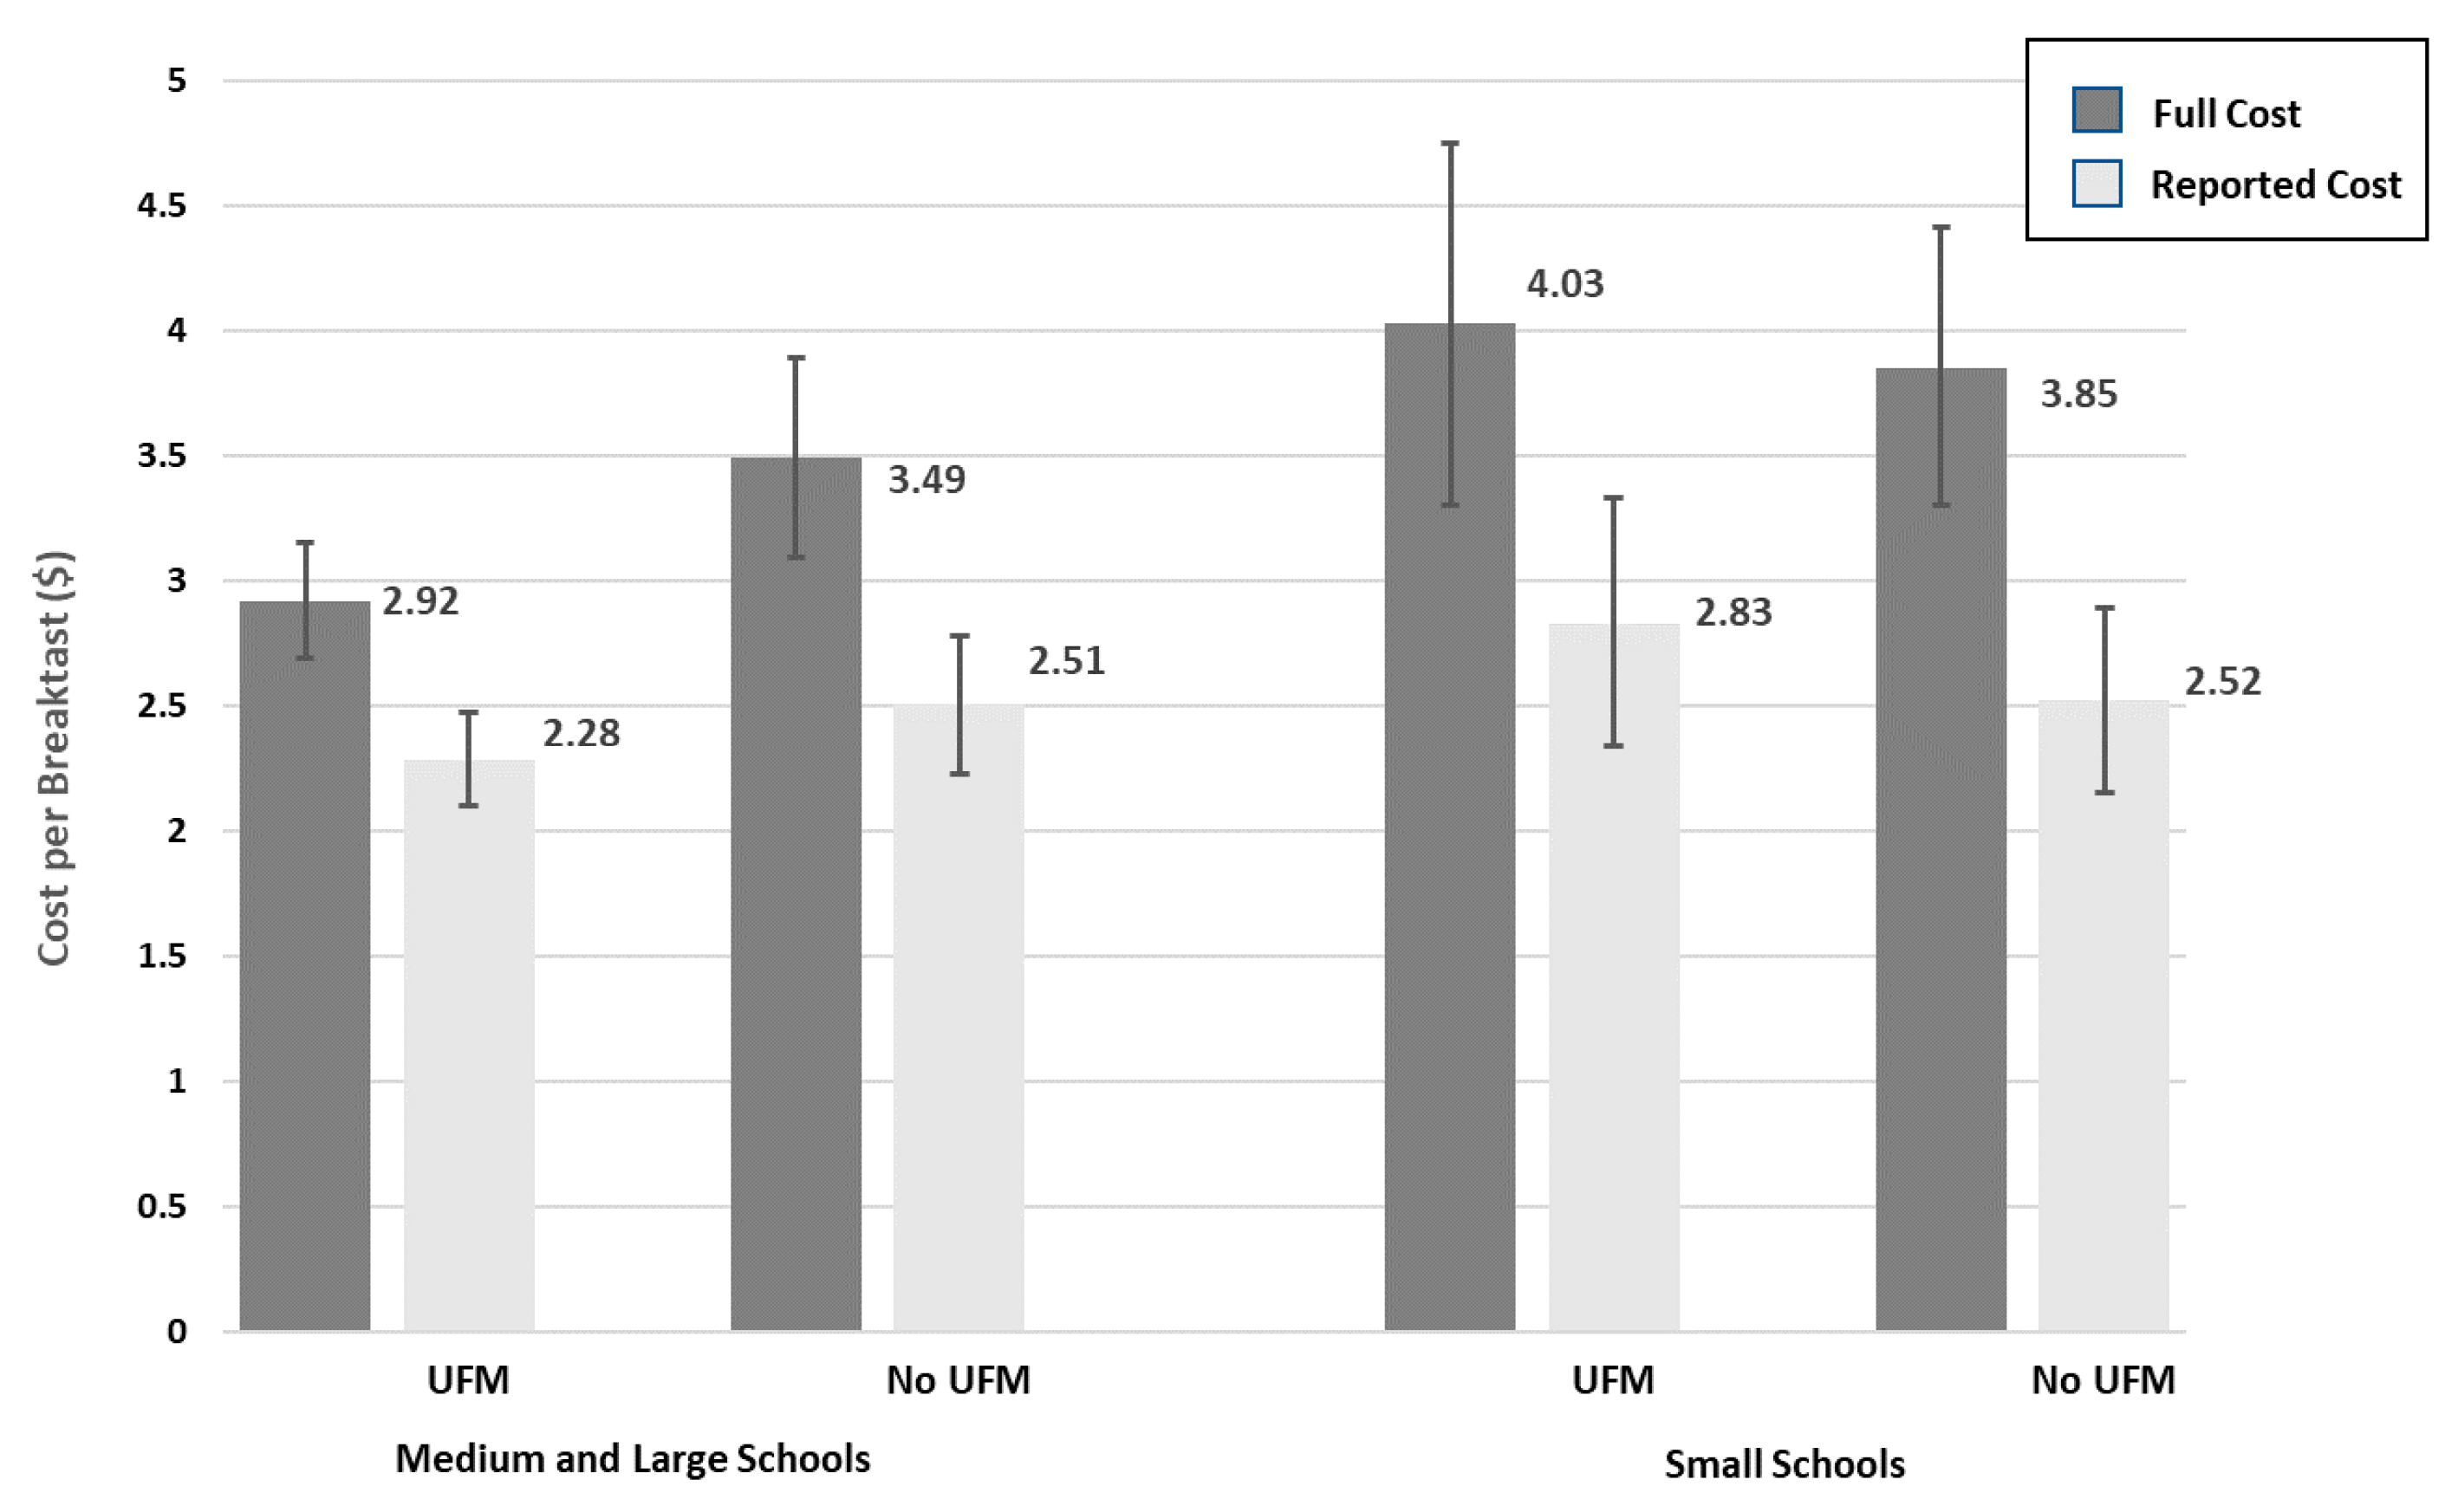
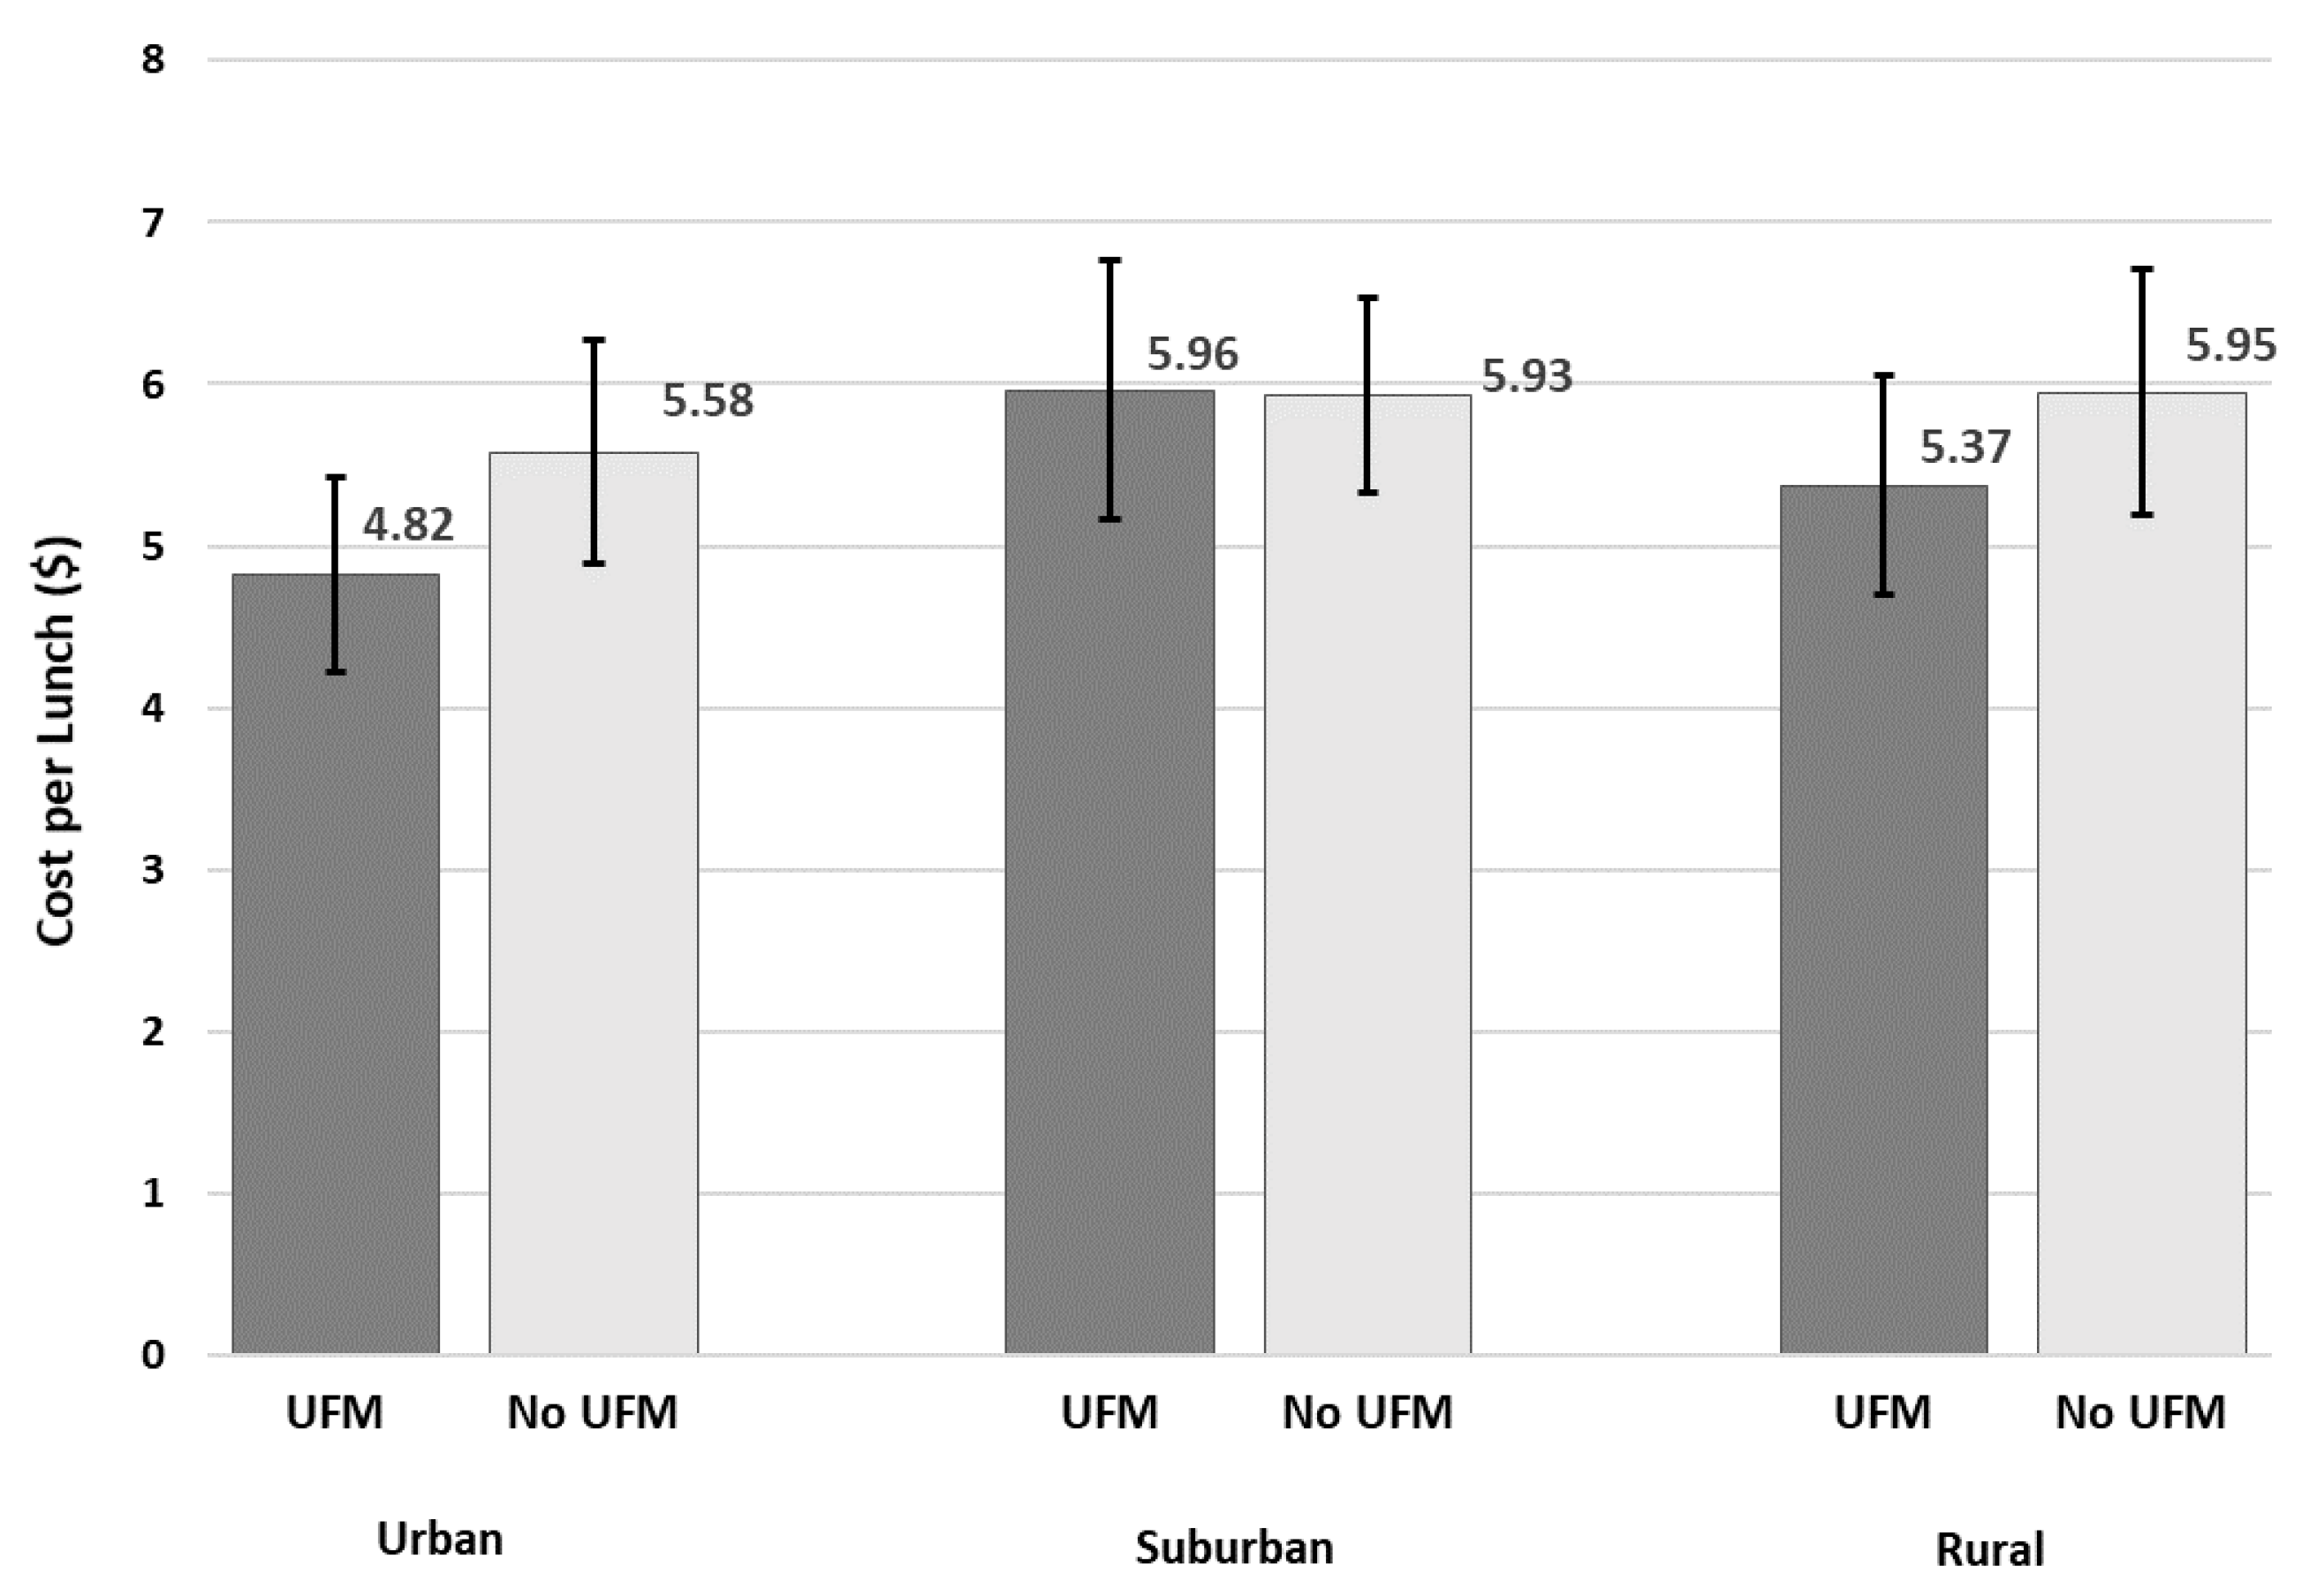
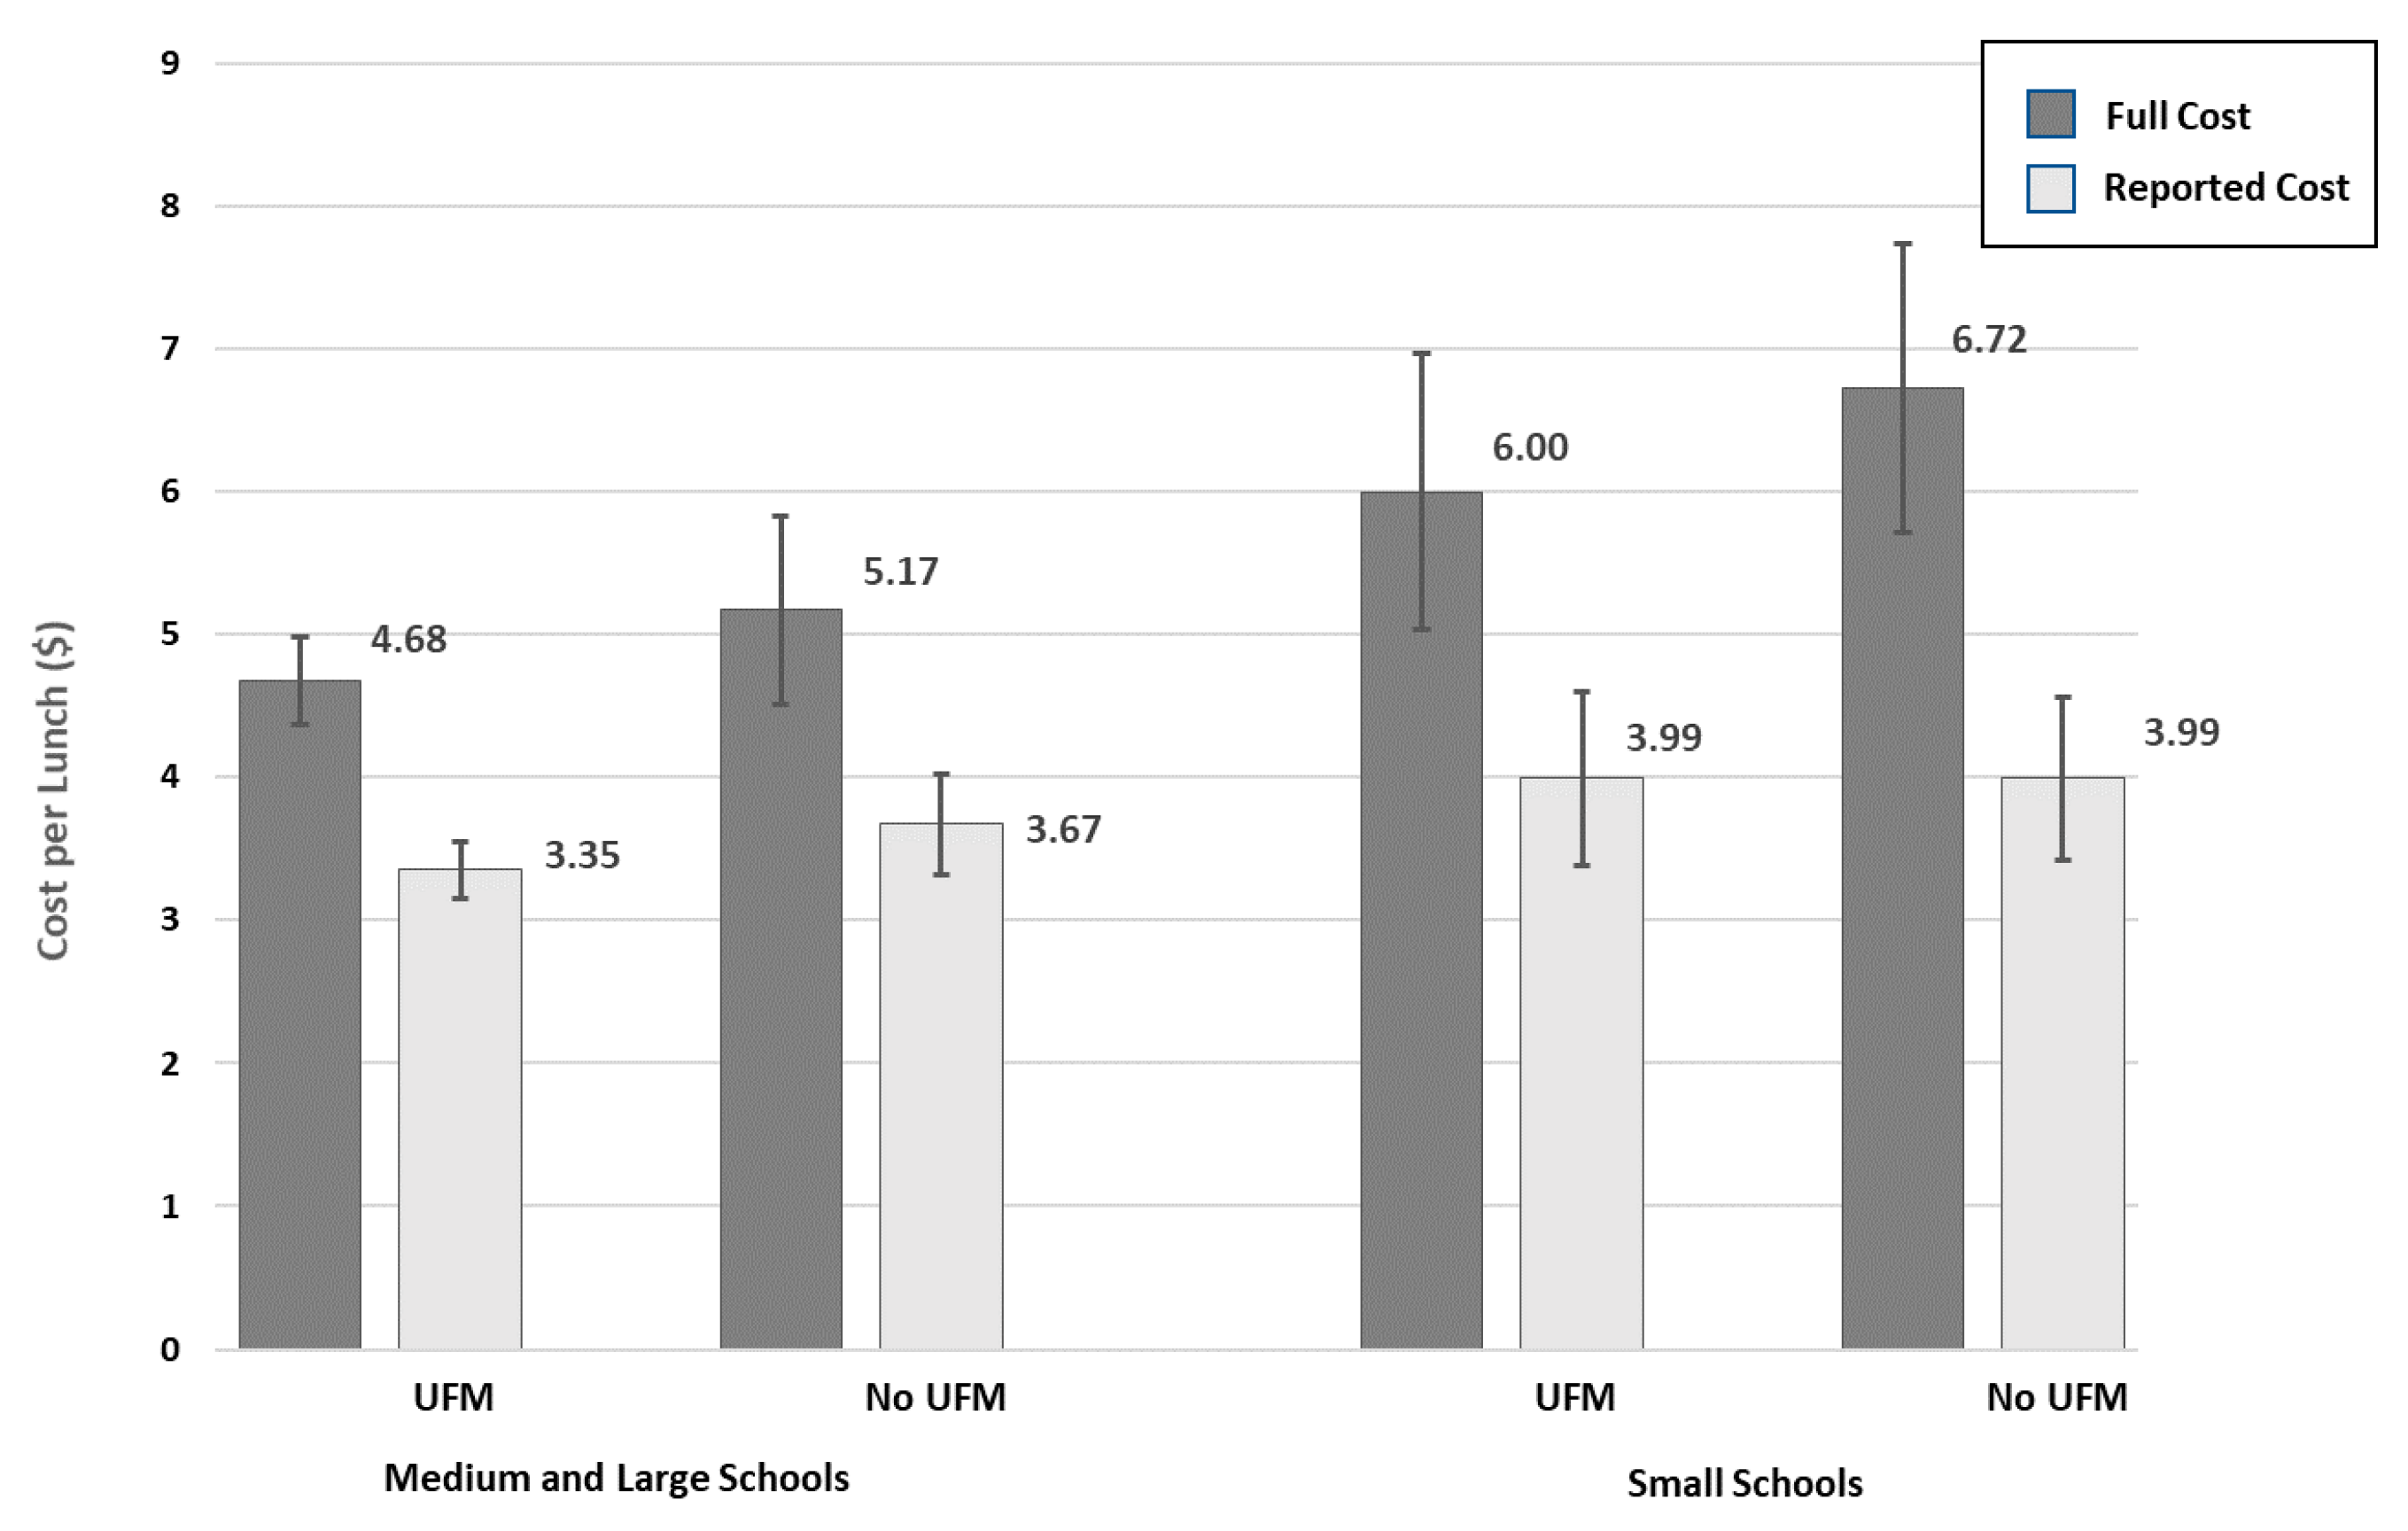
3. Results
4. Discussion
Strengths and Limitations
5. Conclusions
Author Contributions
Funding
Institutional Review Board Statement
Informed Consent Statement
Data Availability Statement
Acknowledgments
Conflicts of Interest
Appendix A

| Variable | Mean Difference | Standardized Difference | Percent Reduction | Variance Ratio |
|---|---|---|---|---|
| Model Specification | ||||
| Propensity Score | 0.05791 | 0.24770 | 86.48 | 1.4349 |
| Demographics | ||||
| Region | ||||
| Mid-Atlantic | −0.00448 | −0.01373 | 90.92 | 0.9741 |
| Midwest | −0.01831 | −0.05467 | 86.13 | 0.8025 |
| Mountain | 0.00216 | 0.00778 | 95.91 | 1.0349 |
| Northeast | 0.00779 | 0.03311 | 80.62 | 1.2392 |
| Southeast | 0.03026 | 0.06977 | 89.86 | 1.0158 |
| Southwest | −0.00609 | −0.01699 | 36.92 | 0.9680 |
| West | -- | -- | -- | -- |
| School urbanicity | −0.01752 | −0.02301 | 92.39 | 1.1910 |
| School higher poverty status (20% or more) | 0.02793 | 0.06983 | 92.39 | 0.7576 |
| SFA size | 0.04215 | 0.06443 | 79.79 | 1.2073 |
| School size | −0.02081 | −0.02873 | 44.67 | 0.9699 |
| Breakfast | ||||
| Breakfast starts before or at start of first class | −0.03370 | −0.08785 | 28.49 | 1.2265 |
| School offers grab and go Breakfast | −0.02613 | −0.07899 | 37.68 | 0.8735 |
| Last bus arrives before or at the start time for breakfast | 0.01723 | 0.04662 | 60.60 | 1.0789 |
| Offer vs. serve at breakfast | −0.01978 | −0.05816 | 63.16 | 1.1992 |
| School has students eat breakfast in the classroom | 0.02710 | 0.06579 | 77.62 | 1.0649 |
| Lunch | ||||
| School has multiple lunch periods | 0.03056 | 0.06269 | 60.08 | 0.9846 |
| Average HEI total score from one week of lunches | 0.50865 | 0.10554 | 0.00 | 0.9339 |
| Number of lunch menu days | 0.01236 | 0.02271 | 88.95 | 1.0187 |
| Offer vs. serve at lunch | 0.00950 | 0.01986 | 85.35 | 0.9838 |
| Competitive Foods | ||||
| School has vending machines | 0.06261 | 0.13173 | 0.00 | 1.1019 |
| SFA competitive food standards exceed federal standards | 0.05668 | 0.12094 | 0.00 | 1.1382 |
| School has pouring rights contract | 0.06829 | 0.16887 | 0.00 | 1.4202 |
| School offers competitive foods during meals | −0.01733 | −0.04283 | 76.05 | 1.0515 |
| School has store or snack shop | −0.00588 | −0.01662 | 0.00 | 0.9666 |
| School has an open-campus policy | 0.02758 | 0.14392 | 0.00 | 3.3503 |
| Nutrition Standards, Menu Planning, and Training | ||||
| School uses cycle menus | −0.00244 | −0.00695 | 98.34 | 1.0284 |
| SFA meal standards exceed federal standards | 0.00007 | 0.00015 | 99.94 | 0.9987 |
| District conducts nutrient analysis of menus | 0.02190 | 0.05354 | 71.60 | 0.9117 |
| Number of food service training categories | 0.28750 | 0.11987 | 80.57 | 1.0610 |
| SFA director education and experience meets HHFKA standards | 0.07031 | 0.17320 | 57.47 | 0.7165 |
| Operations | ||||
| School provides afterschool snack or supper | 0.01397 | 0.02954 | 93.95 | 1.0001 |
| Schools in SFA offer branded foods | −0.01434 | −0.04975 | 84.02 | 0.7828 |
| SFA participates in food purchasing cooperative | −0.01749 | −0.03518 | 0.00 | 1.0091 |
| School accommodates students with special dietary needs | 0.00320 | 0.00924 | 86.90 | 0.9777 |
| School participates in a farm to school program | 0.07845 | 0.20482 | 42.48 | 1.3115 |
| School participates in fresh fruit and vegetable program | −0.02970 | −0.08223 | 61.99 | 0.8994 |
| SFA uses a food service management company | −0.02871 | −0.10466 | 40.08 | 0.6900 |
| SFA uses Alliance for Healthier Generation or similar purchasing tool | 0.06298 | 0.12871 | 69.99 | 0.9780 |
| School has more than one line for reimbursable meals or components | 0.02460 | 0.04912 | 0.00 | 0.9945 |
| School receives fully prepped foods from a central kitchen or production facility | 0.00204 | 0.00719 | 90.32 | 1.0235 |
| School is approved and certified for additional six-cent reimbursement | 0.00000 | 0.00000 | 100.00 | 0.0000 |
| One smarter lunchroom technique implemented | −0.02101 | −0.04841 | 72.99 | 0.9343 |
| Two to three smarter lunchroom techniques | −0.04318 | −0.08637 | 28.52 | 1.0080 |
| Four to seven smarter lunchroom techniques | 0.01821 | 0.05229 | 72.45 | 1.0909 |

| Variable | Universal Free Lunch (n = 508) | Universal Free Breakfast (n = 496) | ||
|---|---|---|---|---|
| β (95% CI) | p-Value | β (95% CI) | p-Value | |
| Constant | 2.134 (1.168, 3.100) | 0.000 | 1.730 (0.809, 2.652) | 0.000 |
| CEP Participation | −0.127 (−0.269, 0.015) | 0.078 | −0.106 (−0.263, 0.052) | 0.188 |
| School Size | ||||
| Small (<500 students) | referent | referent | ||
| Medium/Large (≥500 students) | −0.134 (−0.243, −0.025) | 0.017 | −0.154 (−0.302, −0.006) | 0.042 |
| Interaction: Small school × UFM | 0.112 (−0.157, 0.382) | 0.82 | 0.187 (−0.090, 0.464) | 0.184 |
| School Level | ||||
| Elementary | −0.032 (−0.117, 0.052) | 0.451 | −0.035 (−0.129, 0.058) | 0.459 |
| Middle School | referent | referent | ||
| High School | 0.110 (−0.003, 0.223) | 0.055 | −0.031 (−0.141, 0.080) | 0.586 |
| Region | ||||
| Midwest | referent | referent | ||
| Northeast | 0.337 (0.137, 0.537) | 0.001 | 0.154 (−0.082, 0.391) | 0.200 |
| Mid-Atlantic | 0.188 (0.035, 0.340) | 0.016 | 0.250 (0.076, 0.424) | 0.005 |
| Southeast | 0.186 (0.008, 0.364) | 0.041 | 0.332 (0.097, 0.567) | 0.006 |
| Southwest | 0.081 (−0.086, 0.249) | 0.341 | 0.191 (−0.042, 0.424) | 0.108 |
| West | −0.122 (−0.245, 0.002) | 0.054 | 0.099 (−0.057, 0.255) | 0.214 |
| Mountain | 0.035 (−0.093, 0.163) | 0.592 | 0.132 (−0.054, 0.318) | 0.164 |
| Urbanicity | ||||
| Rural | referent | referent | ||
| Suburban | 0.034 (−0.085, 0.153) | 0.577 | −0.084 (−0.224, 0.056) | 0.239 |
| Urban | −0.085 (−0.213, 0.042) | 0.189 | −0.057 (−0.224, 0.110) | 0.502 |
| FRP Meal Eligibility | ||||
| 40 to 60% | referent | referent | ||
| 60 to 80% | −0.060 (−0.163, 0.042) | 0.249 | −0.082 (−0.203, 0.040) | 0.185 |
| 80 to 100% | 0.132 (0.010, 0.254) | 0.035 | −0.089 (−0.228, 0.050) | 0.207 |
| Competitive food during meals | −0.061 (−0.163, 0.042) | 0.249 | −0.079 (−0.248, 0.090) | 0.356 |
| SFA uses food service management company | −0.203 (−0.323, −0.083) | 0.001 | −0.020 (−0.183, 0.143) | 0.809 |
| Number of food service training categories | −0.010 (−0.031, 0.011) | 0.337 | −0.029 (−0.054, −0.003) | 0.027 |
| HEI score for lunch | −0.004 (−0.015, 0.007) | 0.480 | -- | |
| HEI score for breakfast | -- | −0.004 (−0.016, 0.008) | 0.492 | |
| Variable | Universal Free Lunch (n = 508) | Universal Free Breakfast (n = 496) | ||
|---|---|---|---|---|
| β (95% CI) | p-Value | β (95% CI) | p-Value | |
| Constant | 1.30 (0.448, 2.15) | 0.003 | 1.201 (0.441, 1.960) | 0.002 |
| UFM | −0.067 (−0.186, 0.052) | 0.267 | −0.095 (−0.237, 0.047) | 0.19 |
| School Size | ||||
| Small (<500 students) | referent | referent | ||
| Medium/Large (≥500 students) | −0.048 (−0.153, 0.056) | 0.364 | −0.049 (−0.202, 0.105) | 0.532 |
| Interaction: Small school*UFM | 0.159 (−0.053, 0.370) | 0.140 | 0.212 (−0.272, 0.452) | 0.080 |
| School Level | ||||
| Elementary | −0.056 (−0.145, 0.033) | 0.217 | −0.050 (−0.134, 0.034) | 0.241 |
| Middle School | referent | Referent | ||
| High School | 0.100 (−0.004, 0.203) | 0.059 | 0.004 (−0.100, 0.107) | 0.946 |
| Region | ||||
| Midwest | referent | referent | ||
| Northeast | 0.128 (0.001, 0.254) | 0.048 | 0.046 (−0.164, 0.256) | 0.666 |
| Mid-Atlantic | 0.052 (−0.063, 0.166) | 0.375 | 0.182 (0.060, 0.303) | 0.004 |
| Southeast | 0.176 (0.011, 0.341) | 0.037 | 0.354 (0.139, 0.569) | 0.001 |
| Southwest | 0.040 (−0.109, 0.190) | 0.593 | 0.216 (−0.014, 0.447) | 0.066 |
| West | −0.026 (−0.149, 0.096) | 0.673 | 0.227 (0.106, 0.347) | <0.001 |
| Mountain | 0.017 (−0.106, 0.140) | 0.784 | 0.131 (−0.031, 0.292) | 0.113 |
| Urbanicity | ||||
| Rural | Referent | referent | ||
| Suburban | 0.060 (−0.057, 0.177) | 0.316 | −0.088 (−0.202, 0.075) | 0.370 |
| Urban | −0.023 (−0.138, 0.092) | 0.695 | −0.045 (−0.197, 0.106) | 0.555 |
| FRP Meal Eligibility | ||||
| 40 to 60% | Referent | Referent | ||
| 60 to 80% | −0.054 (−0.146, 0.037) | 0.242 | −0.047 (−0.153, 0.060) | 0.388 |
| 80 to 100% | 0.022 (−0.101, 0.146) | 0.724 | −0.099 (−0.225, 0.026) | 0.121 |
| Competitive food during meals | −0.083 (−0.200, 0.035) | 0.169 | −0.096 (−0.243, 0.050) | 0.195 |
| SFA uses food service management company | −0.149 (−0.255, −0.042) | 0.006 | 0.102 (−0.080, 0.283) | 0.271 |
| Number of food service training categories | −0.012 (−0.032, 0.011) | 0.234 | −0.024 (−0.050, 0.002) | 0.075 |
| HEI score for lunch | 0.001 (−0.008, 0.011) | 0.759 | -- | |
| HEI score for breakfast | -- | −0.005 (−0.013, 0.007) | 0.527 | |


References
- U.S. Department of Agriculture, Food and Nutrition Service. National School Lunch Program and School Breakfast Program: Nutrition standards for all foods sold in school as required by the Healthy, Hunger-Free Kids Act of 2010. Final rule and interim final rule. Fed Regist. 2016, 81, 50131–50151. [Google Scholar]
- Au, L.E.; Ritchie, L.D.; Gurzo, K.; Nhan, L.A.; Woodward-Lopez, G.; Kao, J.; Guenther, P.M.; Tsai, M.; Gosliner, W. Post–Healthy, Hunger-Free Kids Act Adherence to Select School Nutrition Standards by Region and Poverty Level: The Healthy Communities Study. J. Nutr. Educ. Behav. 2020, 52, 249–258. [Google Scholar] [CrossRef] [PubMed]
- Cullen, K.W.; Chen, T.-A.; Dave, J.M. Changes in foods selected and consumed after implementation of the new National School Lunch Program meal patterns in southeast Texas. Prev. Med. Rep. 2015, 2, 440–443. [Google Scholar] [CrossRef] [PubMed] [Green Version]
- Fox, M.K.; Gearan, E. School Nutrition and Meal Cost Study: Summary of Findings; U.S. Department of Agriculture, Food and Nutrition Service: Washington, DC, USA, 2019. Available online: https://fns-prod.azureedge.net/sites/default/files/resource-files/SNMCS_Summary-Findings.pdf (accessed on 25 January 2021).
- Schwartz, M.B.; Henderson, K.E.; Read, M.; Danna, N.; Ickovics, J.R. New School Meal Regulations Increase Fruit Consumption and Do Not Increase Total Plate Waste. Child. Obes. 2015, 11, 242–247. [Google Scholar] [CrossRef] [PubMed]
- Kenney, E.L.; Barrett, J.L.; Bleich, S.N.; Ward, Z.J.; Cradock, A.L.; Gortmaker, S.L. Impact of The Healthy, Hunger-Free Kids Act on Obesity Trends: Study examines impact of the Healthy, Hunger-Free Kids Act of 2010 on childhood obesity trends. Health Aff. 2020, 39, 1122–1129. [Google Scholar] [CrossRef]
- Segal, B.; Hewins, J.; Sanderson, M.; Nchako, C.; Neuberger, Z.; Cai, L.; Maurice, A. Community Eligibility Adoption Rises for the 2015–2016 School Year, Increasing Access to School Meals. Cent. Budg. Policy Priorities 2016. Available online: https://www.cbpp.org/sites/default/files/atoms/files/4-7-16fa.pdf (accessed on 25 January 2021).
- Food Research and Action Center. 2019. Available online: https://frac.org/news/more-low-income-students-receive-free-school-meals-in-the-2018-2019-school-year-through-community-eligibility (accessed on 25 January 2021).
- Logan, C.W.; Connor, P.; Harvill, E.L.; Harkness, J.; Nisar, H.; Checkoway, A.; Enver, A. Community Eligibility Provision Evaluation. Nutrition Assistance Program Report; U.S. Department of Agriculture: Washington, DC, USA, 2014.
- Pokorney, P.E.; Chandran, A.; Long, M.W. Impact of the Community Eligibility Provision on meal counts and participation in Pennsylvania and Maryland National School Lunch Programs. Public Health Nutr. 2019, 22, 3281–3287. [Google Scholar] [CrossRef] [PubMed]
- Tan, M.L.; Laraia, B.; Madsen, K.A.; Johnson, R.C.; Ritchie, L. Community Eligibility Provision and School Meal Participation among Student Subgroups. J. Sch. Health 2020, 90, 802–811. [Google Scholar] [CrossRef]
- Gordon, N.; Ruffini, K. Schoolwide Free Meals and Student Discipline: Effects of the Community Eligibility Provision. Educ. Finance Policy 2019, 1–50. [Google Scholar] [CrossRef]
- Bartfeld, J.S.; Berger, L.; Men, F. Universal Access to Free School Meals through the Community Eligibility Provision Is Associated with Better Attendance for Low-Income Elementary School Students in Wisconsin. J. Acad. Nutr. Diet. 2020, 120, 210–218. [Google Scholar] [CrossRef]
- Schwartz, A.E.; Rothbart, M.W. Let Them Eat Lunch: The Impact of Universal Free Meals on Student Performance. J. Policy Anal. Manag. 2020, 39, 376–410. [Google Scholar] [CrossRef]
- Ruffini, K. Universal Access to Free School Meals and Student Achievement: Evidence from the Community Eligibility Provision. J. Hum. Resour. 2021, 0518–9509R3. [Google Scholar] [CrossRef]
- Gordanier, J.; Ozturk, O.; Williams, B.; Zhan, C. Free lunch for all! the effect of the community eligibility provision on academic outcomes. Econ. Educ. Rev. 2020, 77, 101999. [Google Scholar] [CrossRef]
- Gutierrez, E. The Effect of Universal Free Meals on Student Perceptions of School Climate: Evidence from New York City. 2020. Available online: https://www.maxwell.syr.edu/events/Emily_Gutierrez,_The_Effect_of_Universal_Free_Meals_on_Student_Perceptions_of_School_Climate__Evidence_from_New_York_City/ (accessed on 25 January 2021).
- Davis, W.; Musaddiq, T. Estimating the Effects of Subsidized School Meals on Child Health: Evidence from the Community Eligibility Provision in Georgia Schools. SSRN Electron. J. 2018. [Google Scholar] [CrossRef]
- Rothbart, M.W.; Schwartz, A.E.; Gutierrez, E. Paying for Free Lunch: The Impact of CEP Universal Free Meals on Revenues, Spending, and Student Health; Center for Pol-icy Research, Maxwell School of Citizenship and Public Affairs, Syracuse University. April 2020. Paper No. 227. Available online: https://surface.syr.edu/cpr/259 (accessed on 25 January 2021).
- Zeidman, E.; Beyler, N.; Gearan, E.; Morrison, N.; Niland, K.; Washburn, L.; Carlson, B.; Judkins, D.; LeClair, L.; Mendelson, M.; et al. School Nutrition and Meal Cost Study: Study Design, Sampling, and Data Collection; U.S. Department of Agriculture, Food and Nutrition Service, Office of Policy Support: Alexandria, VA, USA, 2017.
- Logan, C.; Tran, V.; Boyle, M.; Enver, A.; Zeidenberg, M.; Mendelson, M. School Nutrition and Meal Cost Study, Final Report Volume 3: School Meal Costs and Revenues; U.S. Department of Agriculture, Food and Nutrition Service, Office of Policy Support: Alexandria, VA, USA, 2019.
- Gearan, E.; Fox, M.K.; Niland, K.; Dotter, D.; Washburn, L.; Connor, P.; Olsho, L.; Wommack, T. School Nutrition and Meal Cost Study, Final Report Volume 2: Nutritional Characteristics of School Meals; U.S. Department of Agriculture, Food and Nutrition Service, Office of Policy Support: Alexandria, VA, USA, 2019.
- Austin, P.C.; Stuart, E.A. Moving towards best practice when using inverse probability of treatment weighting (IPTW) using the propensity score to estimate causal treatment effects in observational studies. Stat. Med. 2015, 34, 3661–3679. [Google Scholar] [CrossRef] [PubMed]
- Rubin, D.B. Using Propensity Scores to Help Design Observational Studies: Application to the Tobacco Litigation. Health Serv. Outcomes Res. Methodol. 2001, 2, 169–188. [Google Scholar] [CrossRef]
- Malehi, A.S.; Pourmotahari, F.; Angali, K.A. Statistical models for the analysis of skewed healthcare cost data: A simulation study. Health Econ. Rev. 2015, 5, 1–16. [Google Scholar] [CrossRef] [Green Version]
- Brambor, T.; Clark, W.R.; Golder, M. Understanding Interaction Models: Improving Empirical Analyses. Politi- Anal. 2006, 14, 63–82. [Google Scholar] [CrossRef] [Green Version]
- U.S. Department of Agriculture. National School Lunch, Special Milk, and School Breakfast Programs: National Average Payments/Maximum Reimbursement Rates. Fed. Regist. 2014, 79, 41532–41535. [Google Scholar]
- Wharton, C.M.; Long, M.; Schwartz, M.B. Changing Nutrition Standards in Schools: The Emerging Impact on School Revenue. J. Sch. Health 2008, 78, 245–251. [Google Scholar] [CrossRef]
- Long, M.W.; Luedicke, J.; Dorsey, M.; Fiore, S.S.; Henderson, K.E. Impact of Connecticut Legislation Incentivizing Elimination of Unhealthy Competitive Foods on National School Lunch Program Participation. Am. J. Public Health 2013, 103, e59–e66. [Google Scholar] [CrossRef] [PubMed]
- Continuing Appropriations Act, 2021 and Other Extensions Act, P.L. 116–159, Enacted 1 October 2020. Available online: https://www.congress.gov/bill/116th-congress/house-bill/8337 (accessed on 27 January 2021).


| Variable | Schools Participating in Universal Free Lunch Mean or % (95% CI) (n = 103) | Schools not Participating in Universal Free Lunch Mean or % (95% CI) (n = 405) |
|---|---|---|
| Region | ||
| Mid-Atlantic | 21.3 (0.0, 43.3) | 11.4 (4.3, 18.4) |
| Midwest | 10.4 (0.0, 23.8) | 14.5 (8.9, 20.2) |
| Mountain | 7.8 (0.0, 17.1) | 11.9 (6.4, 17.4) |
| Northeast | 2.3 (0.0, 6.7) | 5.3 (2.0, 8.5) |
| Southeast | 39.2 (11.9, 66.6) | 21.2 (12.3, 30.1) |
| Southwest | 9.6 (1.1, 18.1) | 13.1 (7.4, 18.7) |
| West | 9.4 (0.6, 18.3) | 22.7 (14.5, 30.8) |
| School Size | ||
| Small (<500 students) | 31.3 (13.1, 49.5) | 52.3 (44.4, 60.2) |
| Medium or Large (500 or more students) | 68.7 (50.5, 86.9) | 47.7 (39.8, 55.6) |
| Urbanicity | ||
| Urban | 33.2 (13.1, 53.4) | 20.6 (12.8, 28.4) |
| Suburban | 28.8 (5.7, 51.8) | 46.3 (37.5, 55.1) |
| Rural | 38.0 (9.8, 66.2) | 33.1 (25.3, 40.9) |
| School Level | ||
| Elementary School | 61.1 (41.5, 80.7) | 68.1 (63.9, 72.2) |
| Middle School | 26.7 (9.7, 43.8) | 18.2 (14.8, 21.6) |
| High School | 12.2 (3.9, 20.4) | 13.7 (11.5, 15.9) |
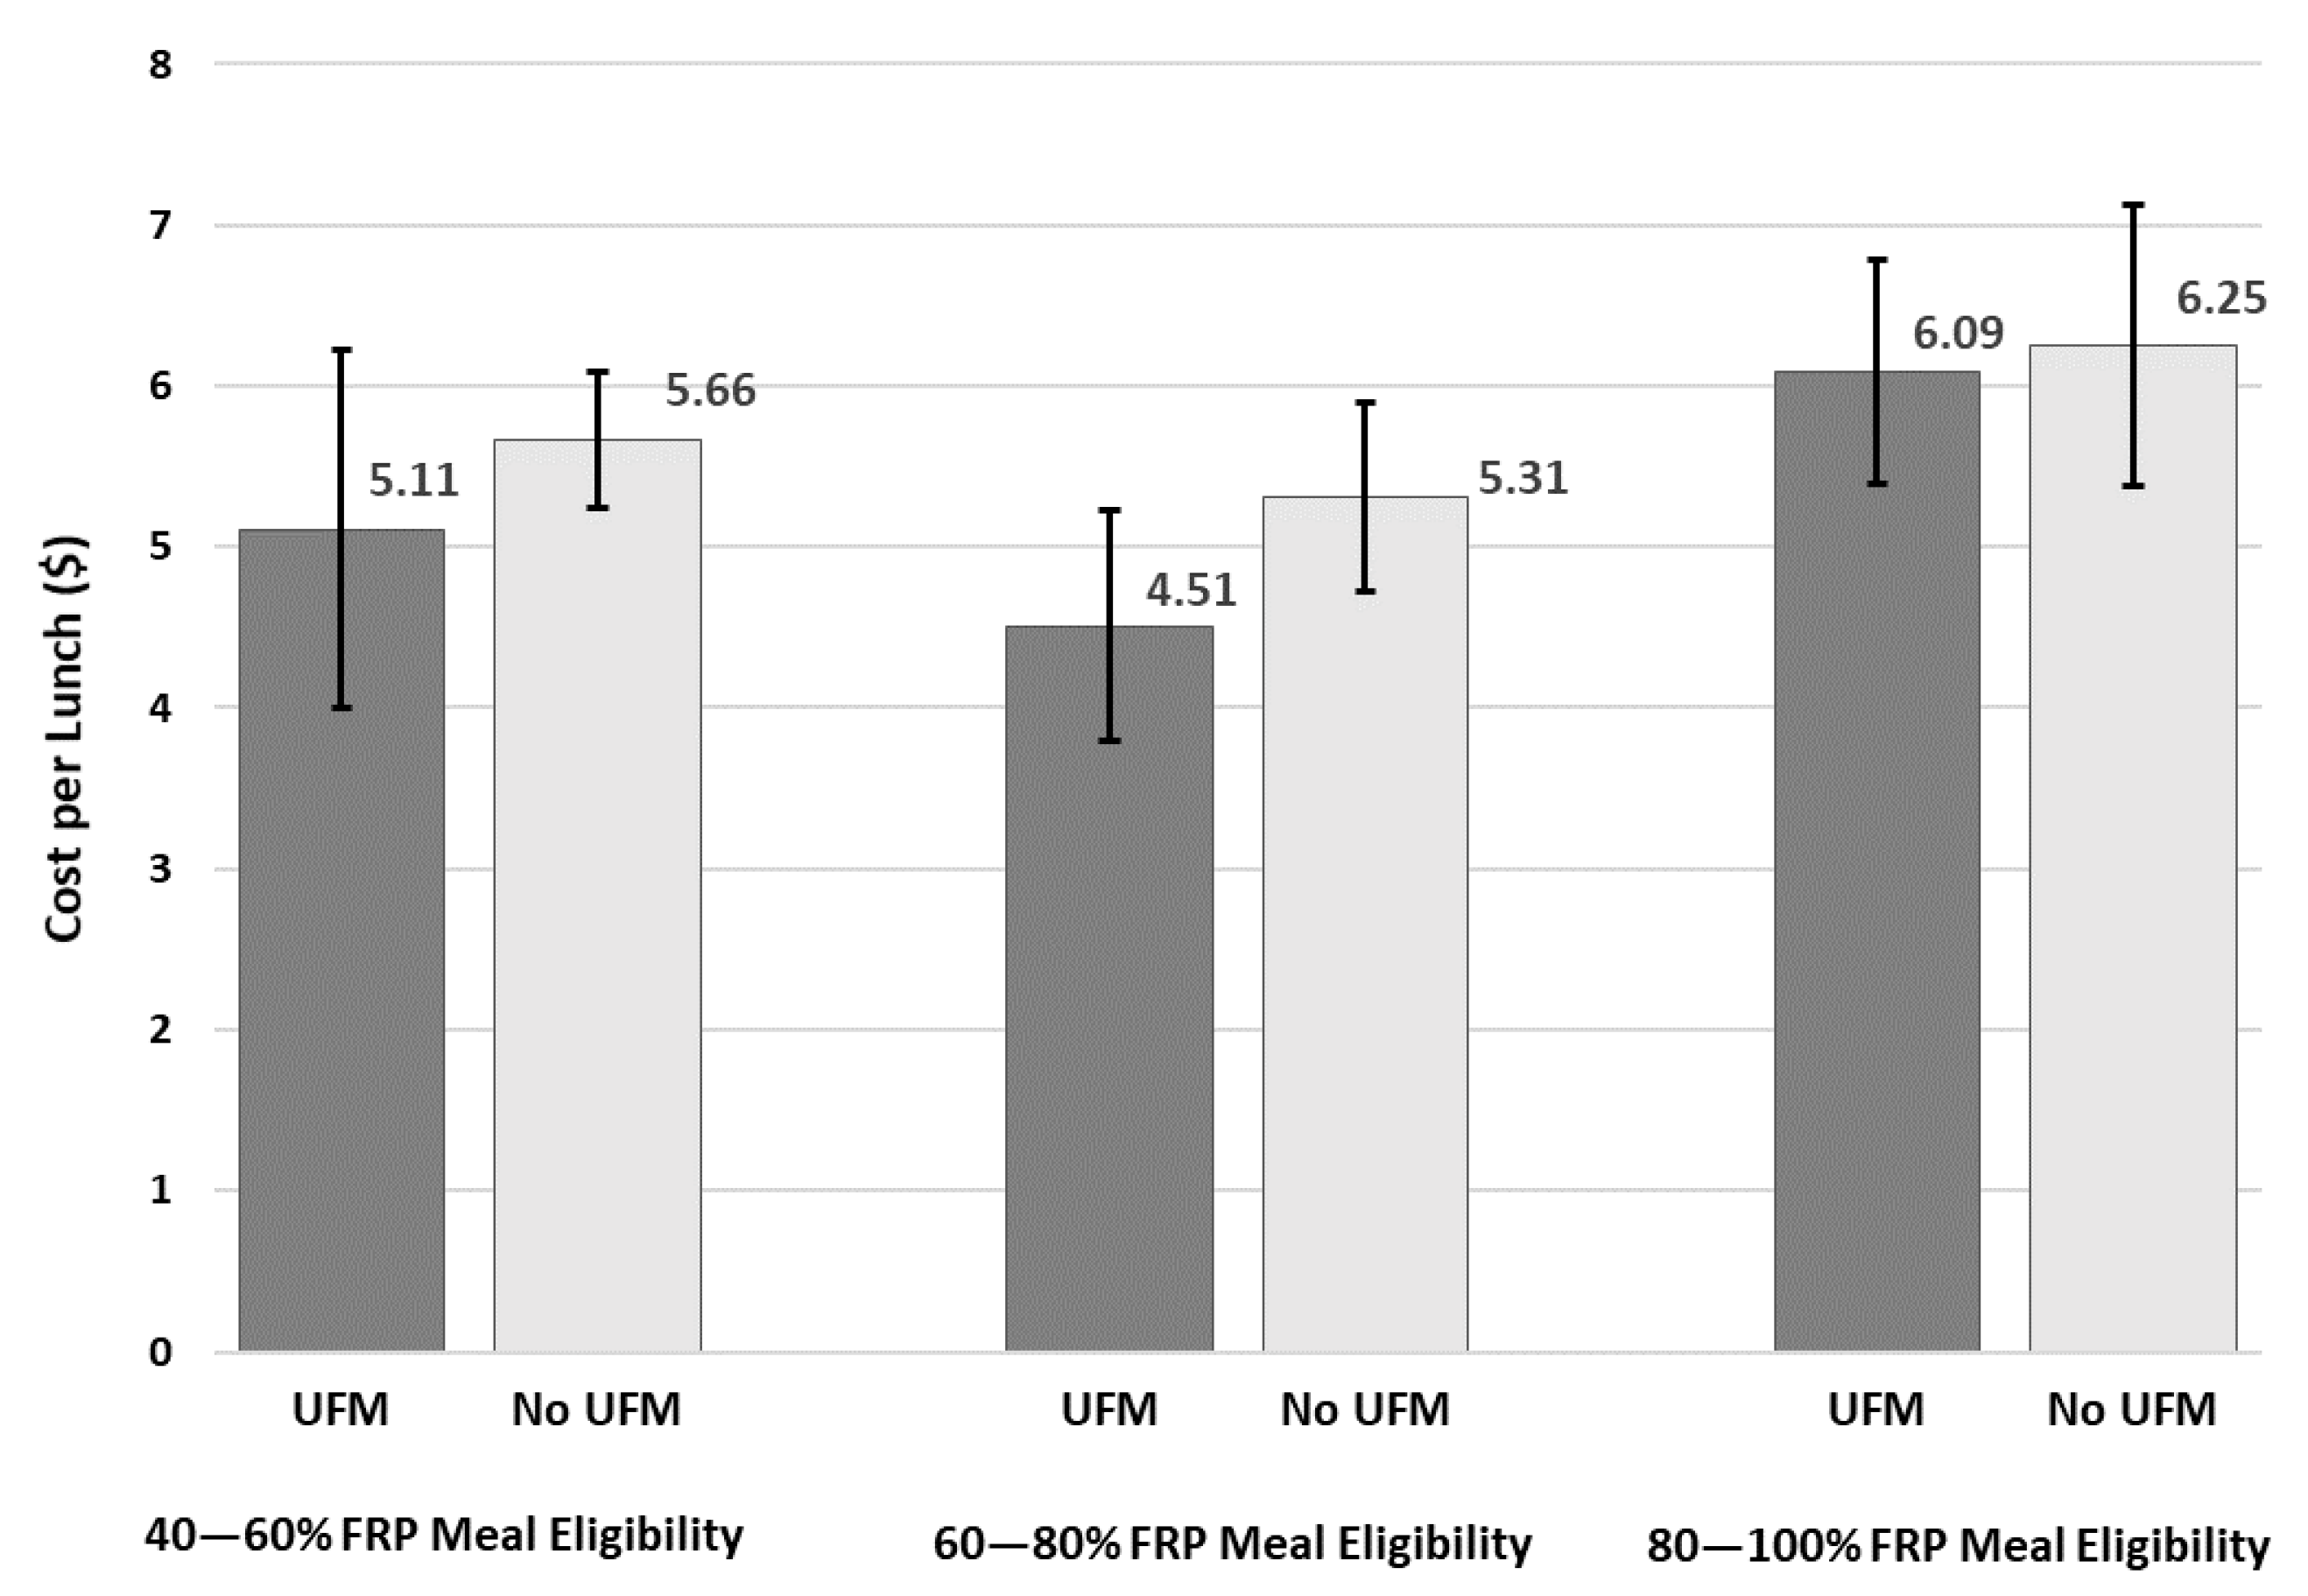
| FRP Meal Eligibility | ||
| 40–60% | 9.1 (0.0, 19.1) | 44.4 (36.7, 52.1) |
| 60–80% | 27.9 (0.0, 57.9) | 32.2 (24.7, 39.7) |
| 80–100% | 63.0 (34.8, 91.2) | 23.4 (16.0, 30.9) |
| Offers Competitive Foods During Meals | 74.8 (58.2, 91.3) | 79.4 (72.4, 86.3) |
| Uses Food Service Management Company | 23.2 (0.0, 53.8) | 9.1 (3.8, 14.4) |
| Number of Food Service Training Categories | 2.5 (1.2, 3.8) | 2.9 (2.4, 3.4) |
| HEI Score for Lunch | 81.4 (80.2, 82.5) | 81.9 (81.1, 82.7) |
| Variable | Universal Free Lunch (n = 508) | Universal Free Breakfast (n = 496) | ||
|---|---|---|---|---|
| β (95% CI) | p-Value | β (95% CI) | p-Value | |
| Constant | 2.118 (1.153, 3.083) | 0.000 | 1.668 (0.751, 2.584) | 0.000 |
| UFM | −0.130 (−0.268, 0.007) | 0.063 | −0.180 (−0.332, −0.028) | 0.020 |
| School Size | ||||
| Small (<500 students) | referent | referent | ||
| Medium/Large (≥500 students) | −0.125 (−0.238, −0.011) | 0.032 | −0.121 (−0.273, 0.032) | 0.121 |
| Interaction: Small school × UFM | 0.130 (−0.102, 0.363) | 0.271 | 0.223 (−0.266, 0.473) | 0.080 |
| School Level | ||||
| Elementary | −0.031 (−0.117, 0.054) | 0.473 | −0.031 (−0.127, 0.064) | 0.518 |
| Middle School | referent | Referent | ||
| High School | 0.111 (−0.001, 0.222) | 0.053 | −0.025 (−0.136, 0.085) | 0.652 |
| Region | ||||
| Midwest | referent | referent | ||
| Northeast | 0.336 (0.135, 0.537) | 0.001 | 0.141 (−0.094, 0.377) | 0.237 |
| Mid-Atlantic | 0.185 (0.033, 0.338) | 0.018 | 0.250 (0.078, 0.423) | 0.005 |
| Southeast | 0.180 (0.006, 0.354) | 0.043 | 0.334 (0.114, 0.554) | 0.003 |
| Southwest | 0.080 (−0.086, 0.246) | 0.344 | 0.178 (−0.058, 0.413) | 0.138 |
| West | −0.114 (−0.230, 0.002) | 0.053 | 0.093 (−0.057, 0.244) | 0.223 |
| Mountain | 0.035 (−0.096, 0.165) | 0.603 | 0.133 (−0.516, 0.318) | 0.157 |
| Urbanicity | ||||
| Rural | Referent | referent | ||
| Suburban | 0.031 (−0.087, 0.150) | 0.184 | −0.088 (−0.230, 0.054) | 0.225 |
| Urban | −0.084 (−0.208, 0.040) | 0.607 | −0.058 (−0.220, 0.103) | 0.478 |
| FRP Meal Eligibility | ||||
| 40 to 60% | Referent | Referent | ||
| 60 to 80% | −0.056 (−0.160, 0.0479) | 0.289 | −0.068 (−0.192, 0.055) | 0.278 |
| 80 to 100% | 0.133 (0.002, 0.263) | 0.046 | −0.057 (−0.193, 0.079) | 0.408 |
| Competitive food during meals | −0.0615 (−0.205, 0.082) | 0.399 | −0.095 (−0.192, 0.055) | 0.270 |
| SFA uses food service management company | −0.203 (−0.323, −0.083) | 0.001 | −0.001 (−0.167, 0.164) | 0.988 |
| Number of food service training categories | −0.010 (−0.031, 0.011) | 0.335 | −0.030 (−0.055, −0.005) | 0.019 |
| HEI Score for Lunch | −0.004 (−0.015, 0.007) | 0.495 | -- | |
| HEI Score for Breakfast | -- | −0.003 (−0.015, 0.009) | 0.590 | |
Publisher’s Note: MDPI stays neutral with regard to jurisdictional claims in published maps and institutional affiliations. |
© 2021 by the authors. Licensee MDPI, Basel, Switzerland. This article is an open access article distributed under the terms and conditions of the Creative Commons Attribution (CC BY) license (http://creativecommons.org/licenses/by/4.0/).
Share and Cite
Long, M.W.; Marple, K.; Andreyeva, T. Universal Free Meals Associated with Lower Meal Costs While Maintaining Nutritional Quality. Nutrients 2021, 13, 670. https://doi.org/10.3390/nu13020670
Long MW, Marple K, Andreyeva T. Universal Free Meals Associated with Lower Meal Costs While Maintaining Nutritional Quality. Nutrients. 2021; 13(2):670. https://doi.org/10.3390/nu13020670
Chicago/Turabian StyleLong, Michael W., Keith Marple, and Tatiana Andreyeva. 2021. "Universal Free Meals Associated with Lower Meal Costs While Maintaining Nutritional Quality" Nutrients 13, no. 2: 670. https://doi.org/10.3390/nu13020670