Review

Animal Protein versus Plant Protein in Supporting Lean Mass and Muscle Strength: A Systematic Review and Meta-Analysis of Randomized Controlled Trials

Department of Food Science & Technology, National University of Singapore, 3 Science Drive 3, Singapore 117543, Singapore
*
Author to whom correspondence should be addressed.
Nutrients 2021, 13(2), 661; https://doi.org/10.3390/nu13020661
Submission received: 28 December 2020 / Revised: 5 February 2021 / Accepted: 13 February 2021 / Published: 18 February 2021
(This article belongs to the Special Issue Nutritional Considerations for Skeletal Muscle in Health and Disease)

Abstract

:
Although animal protein is usually considered to be a more potent stimulator of muscle protein synthesis than plant protein, the effect of protein source on lean mass and muscle strength needs to be systematically reviewed. This study aimed to examine potential differences in the effect of animal vs. plant protein on lean mass and muscle strength, and the possible influence of resistance exercise training (RET) and age. The following databases were searched: PubMed, Embase, Scopus and CINAHL Plus with Full Text, and 3081 articles were screened. A total of 18 articles were selected for systematic review, of which, 16 were used for meta-analysis. Total protein intakes were generally above the recommended dietary allowance at the baseline and end of intervention. Results from the meta-analyses demonstrated that protein source did not affect changes in absolute lean mass or muscle strength. However, there was a favoring effect of animal protein on percent lean mass. RET had no influence on the results, while younger adults (<50 years) were found to gain absolute and percent lean mass with animal protein intake (weighted mean difference (WMD), 0.41 kg; 95% confidence interval (CI) 0.08 to 0.74; WMD 0.50%; 95% CI 0.00 to 1.01). Collectively, animal protein tends to be more beneficial for lean mass than plant protein, especially in younger adults.

1. Introduction

Skeletal muscle is known to support physical stability and enable movement. It also has important metabolic functions, such as supplying amino acids during the post-absorptive state for tissue building and maintenance [1] and serving as a site for glucose uptake and storage [2]. Loss of muscle has detrimental consequences; low muscle mass has been associated with increased morbidity, poorer quality of life and higher mortality [3]. Similarly, low muscle strength was shown to be a significant and independent predictor of mortality risk [4,5].
A decline in muscle mass and strength is usually observed with age across different populations [6,7,8]. Muscle protein anabolism in older adults may be negatively affected by inadequate nutritional intake or impaired response to nutrients and hormones [9]. This age-related loss of muscle mass and strength is termed sarcopenia, now recognized as a “muscle disease” [10]. The development and progression of sarcopenia is influenced by peak muscle mass and strength attained in early adulthood, as well as their preservation later in life [11]. Preventing and treating low muscle mass or sarcopenia will not only lead to potential clinical benefits, but may also result in cost savings for the healthcare system [3,12].
Maintenance of muscle mass is a dynamic balance between muscle protein synthesis (MPS) and muscle protein breakdown (MPB). Muscle gain occurs only when MPS exceeds protein degradation (i.e., positive net protein balance). MPS is increased after resistance exercise, but protein balance remains negative as the rate of MPB is also elevated [13,14]. To achieve a positive net balance, ingestion of dietary protein is required [14]. Animal protein, with its higher protein quality, is usually considered to be superior to plant protein for building muscle mass [15,16,17]. On the other hand, healthcare professionals have encouraged the replacement of animal protein, particularly red meat, with plant protein to help decrease the risk of cardiovascular diseases [18]. Plant protein utilization is also promoted to reduce harm to the environment by decreasing the demand for animal protein, since animal farming tends to be more resource intensive with higher greenhouse gas emissions [19].
The effects of animal protein vs. plant protein on muscle mass and strength have been examined in a few systematic reviews, but there are research gaps. One publication concluded that a higher amount of plant protein is needed to achieve muscle growth similar to animal protein [20]. However, the review included trials which only studied acute changes in muscle protein turnover. This may not be appropriate since muscle hypertrophy is a result of long-term change in net protein balance [21]. Furthermore, the sole focus of that review was on adults below 40 years of age. It is important to understand the impact among older adults, since a substantial decline in muscle mass and muscle strength is known to occur after the age of about 50 years [10,22]. A recent meta-analysis concluded that soy protein resulted in similar muscle mass and strength gains as animal protein [23], but the authors did not investigate the use of other plant proteins or stratify their analyses according to age. In addition, both publications only reviewed studies in which subjects underwent resistance exercise training (RET). Potential differences in the effects of animal protein and plant protein among adults who do not engage in RET are therefore not known. Hence, the aim of the present systematic review and meta-analysis of randomized controlled trials (RCTs) was to compare the non-acute effects of animal protein vs. plant protein on muscle accretion and strength among adults ≥19 years, with and without RET.

2. Materials and Methods

The protocol for this study is in accordance with the PRISMA (Preferred Reporting Items for Systematic Reviews and Meta-Analyses) guidelines [24]. The description of the PICOS (population, intervention, comparison, outcome and setting) criteria used to define the research question is presented in Table 1 below.

2.1. Search Strategy and Inclusion Criteria

A computerized search of the literature was performed independently by a primary reviewer (M.T.L.) and a secondary reviewer (B.J.P.) for all articles from inception to early January 2020 using four online databases: namely, PubMed, Embase, Scopus and CINAHL Plus with Full Text. The search strategy focused on combining the terms “protein” or “proteins” with types of animal protein, types of plant protein and muscle mass or muscle strength. Medical subject headings were used where possible, and no filters were applied. An updated search was performed in mid-June 2020. Details of the search strategy can be found in Supplementary Materials (Table S1).
A total of 3081 articles were retrieved and exported into EndNote X9 (Clarivate Analytics) for literature management. After the exclusion of duplicates (n = 1150), screening was conducted based on inclusion criteria determined a priori. Studies had to be human RCTs, with subjects having a mean age of ≥19 years and written in English. The study must have allocated subjects to an animal protein group and a plant protein group. If the supplement given consisted of a protein blend, i.e., a mix of animal protein and plant protein (regardless of proportion), the study would not be accepted. Other than studies which provided protein as a supplement, those that specifically compared the effects of diets higher in animal protein and plant protein were also considered for inclusion. In both cases, it is reasonable to assume that subjects would have consumed more animal protein and plant protein in their overall diet, based on the intervention group they were assigned to. In line with this notion, studies which provided a different quantity of protein for each intervention group were included as well.
Finally, studies which only examined muscle protein fractional synthetic rate or net protein balance, without tracking changes in muscle mass, percent muscle mass and/or muscle strength, were excluded. Methods of body composition assessment accepted for this review were dual-energy X-ray absorptiometry (DEXA) and air displacement plethysmography (ADP). DEXA has been recommended as the reference standard for measuring muscle mass [25]. Measurement of fat-free mass in adults using DEXA and ADP was found to have a strong correlation [26]. For strength, the outcomes of interest were one-repetition maximum (1-RM) bench press and squat, grip strength, as well as peak torque of leg/knee extension and flexion.

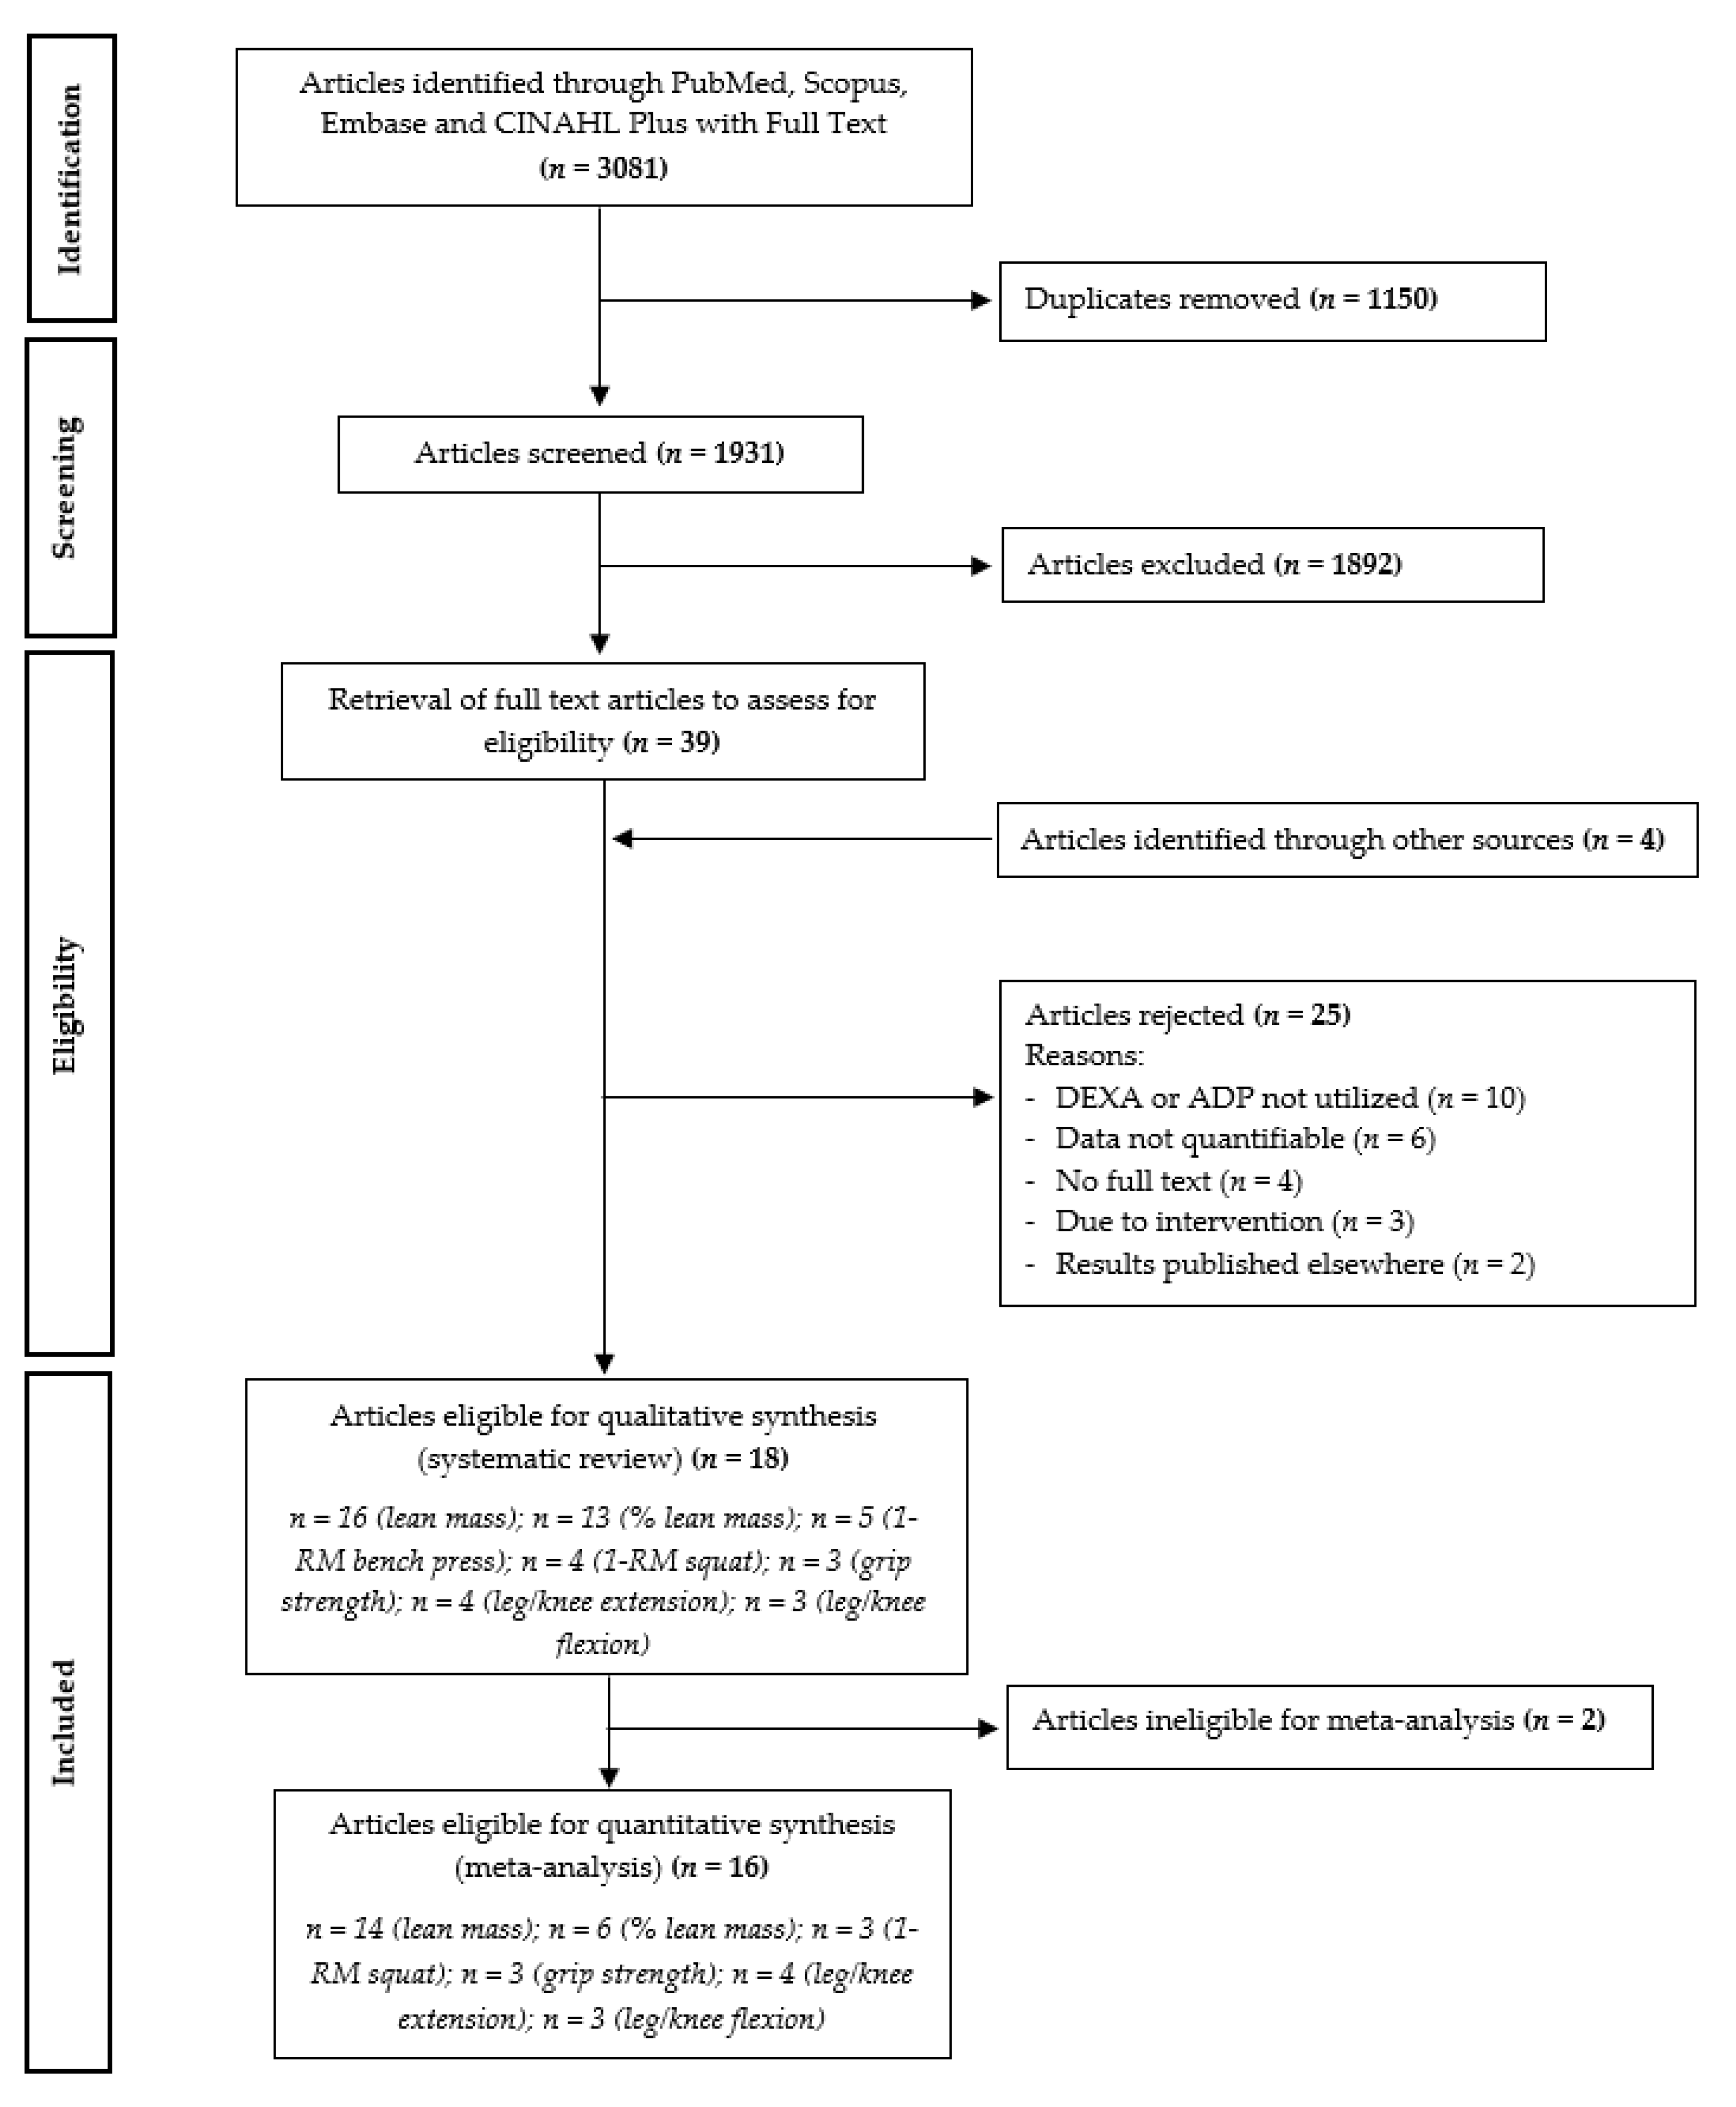
2.2. Article Selection

The primary and secondary reviewers independently screened the titles and abstracts, and based on the pre-established criteria, eliminated 1892 articles. The full text for the remaining 39 articles were retrieved for further evaluation of inclusion eligibility; four original articles obtained from other sources were also added for assessment. Out of the total of 43 articles, 25 were subsequently rejected. Ten articles were omitted because DEXA or ADP was not found to be utilized for body composition assessment. Another six articles were excluded as they did not contain quantifiable values, i.e., results of interest were only presented in bar chart form. Four articles were rejected because no full text was available, while three articles were omitted as there was indication that the study intervention consisted of a protein blend. Two articles were removed since the relevant results were published in other eligible articles. Where necessary, attempts were made to contact corresponding authors to obtain data or seek clarification. Collectively, 18 articles were selected for this systematic review (Figure 1).

2.3. Data Extraction and Quality Assessment

The primary and secondary reviewers independently extracted details from the 18 selected articles onto an electronic form. The fields captured were the primary author’s last name; publication year; country; intervention period; study population; subjects’ gender, age, weight, height and body mass index; intervention specifics (type and amount of protein and intake protocol); description of usual diet; dietary assessment method; total protein consumed (g/kg/day, baseline and end-of-intervention) and inclusion of RET. Protein intake, if not reported, was estimated by dividing the mean total protein consumed with the corresponding mean body weight. Some articles only provided intake data which excluded protein supplementation. In such cases, end-of-intervention protein intake was estimated by adding the amount of supplemented protein to the final total protein consumed. The mean and standard deviation (SD) of the pre-intervention, post-intervention (final measurement) and change values of the outcome variables were extracted. Percent muscle mass, if not reported, was calculated by dividing muscle mass with the corresponding body weight at pre- and post-intervention, and change value was obtained by subtracting the final mean from the baseline mean. Relevant data provided by authors were added to the form, and where applicable, superseded existing values reported in or derived from the original articles.
Results from different intervention phases in a crossover trial were treated as if they were the respective groups in a parallel trial. If more than one variation of animal or plant protein was used in a study, the interventions were treated as independent trials and presented separately to account for within-study differences. Any data associated with the control group (i.e., non-protein intervention) were not captured since they were not relevant to our research question. When required, standard error (SE) values were converted to SD, while peak torque given in foot–pounds (ft lb) were standardized to Newton meters (Nm) by multiplying the value by 1.355818 [27]. Across the different articles, muscle mass was referred to using varying terminologies such as fat-free mass, lean body mass and lean tissue mass. For the purpose of this review, these terms were considered synonymous and “lean mass” is henceforth used consistently. By definition, bone is part of fat-free mass; bone is also sometimes included as part of lean body mass in the literature [28]. Nonetheless, studies that included bone mineral content within lean mass were still considered in our analyses, since bone only accounts for approximately 7% of fat-free mass (or lean body mass) [25]. Moreover, bone remodeling is a very slow process, lasting 4 to 6 months and may continue over a period of 2 years [29].
Risk of bias of the selected studies was evaluated using a modified version of the Cochrane risk of bias tool [30]. The primary and secondary reviewers independently assigned a subjective level of risk (low, high or unclear) for each study based on four domains: namely, random sequence generation, allocation concealment, blinding of participants and investigator and blinding of outcome assessors.

2.4. Calculations and Statistical Analyses

The reported and/or calculated change values from the different studies for each outcome were summarized and presented as a median. In addition, the range of change values were indicated for each outcome based on the minimum and maximum change values obtained from the studies.
In order to impute change SD for studies in which the value was missing, the correlation coefficient for a particular outcome was calculated based on at least one other study which was reported in considerable detail. The overall effect sizes of the outcomes were determined using weighted mean difference (WMD) of the change values between animal protein and plant protein groups, with 95% confidence intervals. Meta-analyses were performed using the metan function of the Stata/IC 13.0 software (StataCorp LP, College Station, TX, USA). A random-effects model was applied because effect sizes of the studies were expected to vary due to differences in the mix of subjects and interventions [31]. Sensitivity analysis was performed for each outcome based on the leave-one-out method to explore the potential effect of removing a single trial or pairwise comparison at a time.
Subgroup analyses were determined a priori to identify possible variations of observed effects in the overall analysis. Studies were categorized into those which provided RET as part of the protocol and those that did not, as well as younger (<50 years) and older (≥50 years) age groups.

3. Results

3.1. Characteristics of Selected Studies

Detailed characteristics of the selected studies are summarized in Table 2. All 18 studies were utilized for systematic review [32,33,34,35,36,37,38,39,40,41,42,43,44,45,46,47,48,49], while 16 studies [32,33,35,36,37,38,39,40,41,43,44,45,46,47,48,49] were eligible for meta-analysis. Of the 18 studies, 17 had a parallel design and one was a crossover study [45]. The duration of intervention ranged from 14 days to 2 years. In 11 studies, subjects participated in a RET program. Eight studies were conducted in subjects with a mean/median age of 50 years and older. Two studies involved trained subjects, while four studies recruited subjects with medical conditions (i.e., chronic kidney disease, hyperlipidemia, insulin resistance or metabolic syndrome).
The protein provided was used as a supplement in 15 studies. For animal protein, these encompassed whey (isolate, concentrate and hydrolysate), casein, milk protein (casein plus whey), dairy product and beef. Sources of plant protein were soy (isolate, concentrate and soy products), pea protein and rice protein isolate. In the remaining three studies, subjects were specifically assigned to diets which were higher in animal protein or plant protein [33,38,45]. Six studies utilized two variations of either animal or plant protein in the intervention, thus allowing for two pairwise comparisons from a single trial [33,38,40,43,44,49]. At baseline, subjects were generally consuming protein above the recommended dietary allowance (RDA) of 0.8 g/kg/day [50]. Subjects were estimated to have achieved a final protein intake of at least 1.0 g/kg/day; the highest total reported was 3.1 g/kg/day.

3.2. Quality of Selected Studies

Under selection bias, five and seven studies, respectively, provided sufficient information on randomization and allocation concealment. The remaining studies were judged to have unclear risk for these two domains. Blinding of participants may not always be feasible, especially if food was provided. In such cases, consideration will be made as to whether blinding of the investigator was carried out in order to evaluate the risk of performance bias. Eight RCTs were deemed as low risk for participant/investigator blinding, while six RCTs were judged likewise for blinding of outcome assessors (detection bias). The risk for the other studies was considered to be unclear. Overall, two RCTs were found to be at low risk across all four domains. Details of each study’s risk of bias assessment are available in Supplementary Materials (Table S2).

3.3. Results of Systematic Review

The summary of the published results on the impact of protein source on changes in lean mass and muscle strength is shown in Table 3. On the whole, consumption of both animal protein and plant protein demonstrated an increase in the median value of lean mass and strength outcomes. Animal protein presented greater gains for lean mass and percent lean mass compared to plant protein, while findings for strength outcomes were inconsistent.

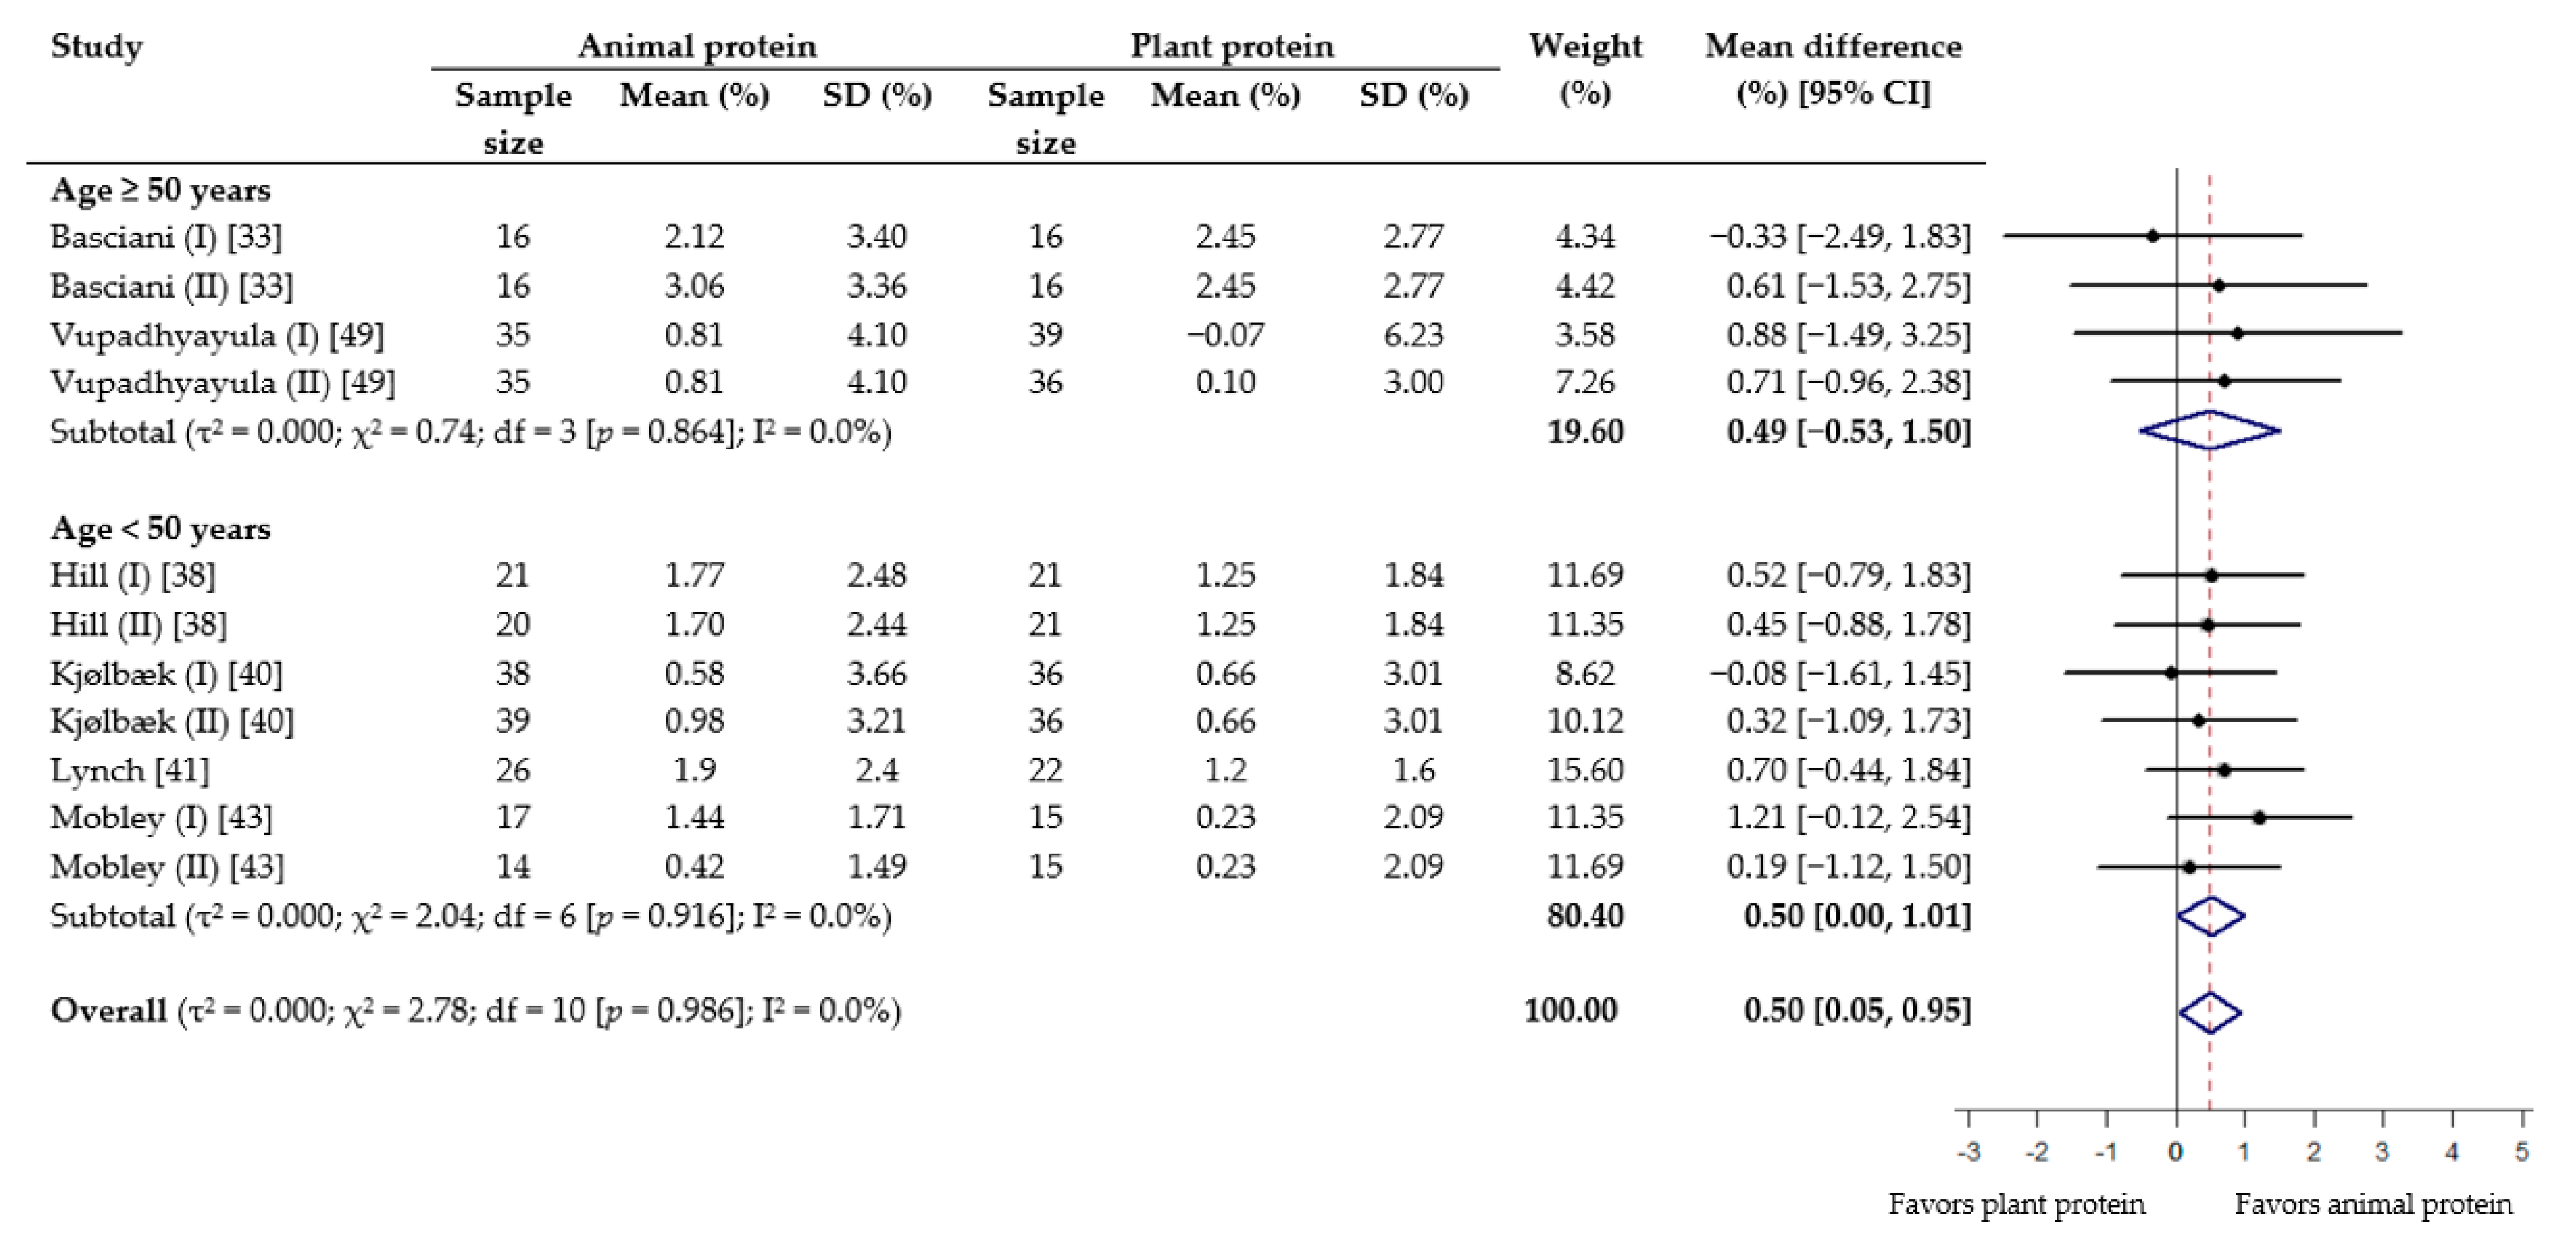
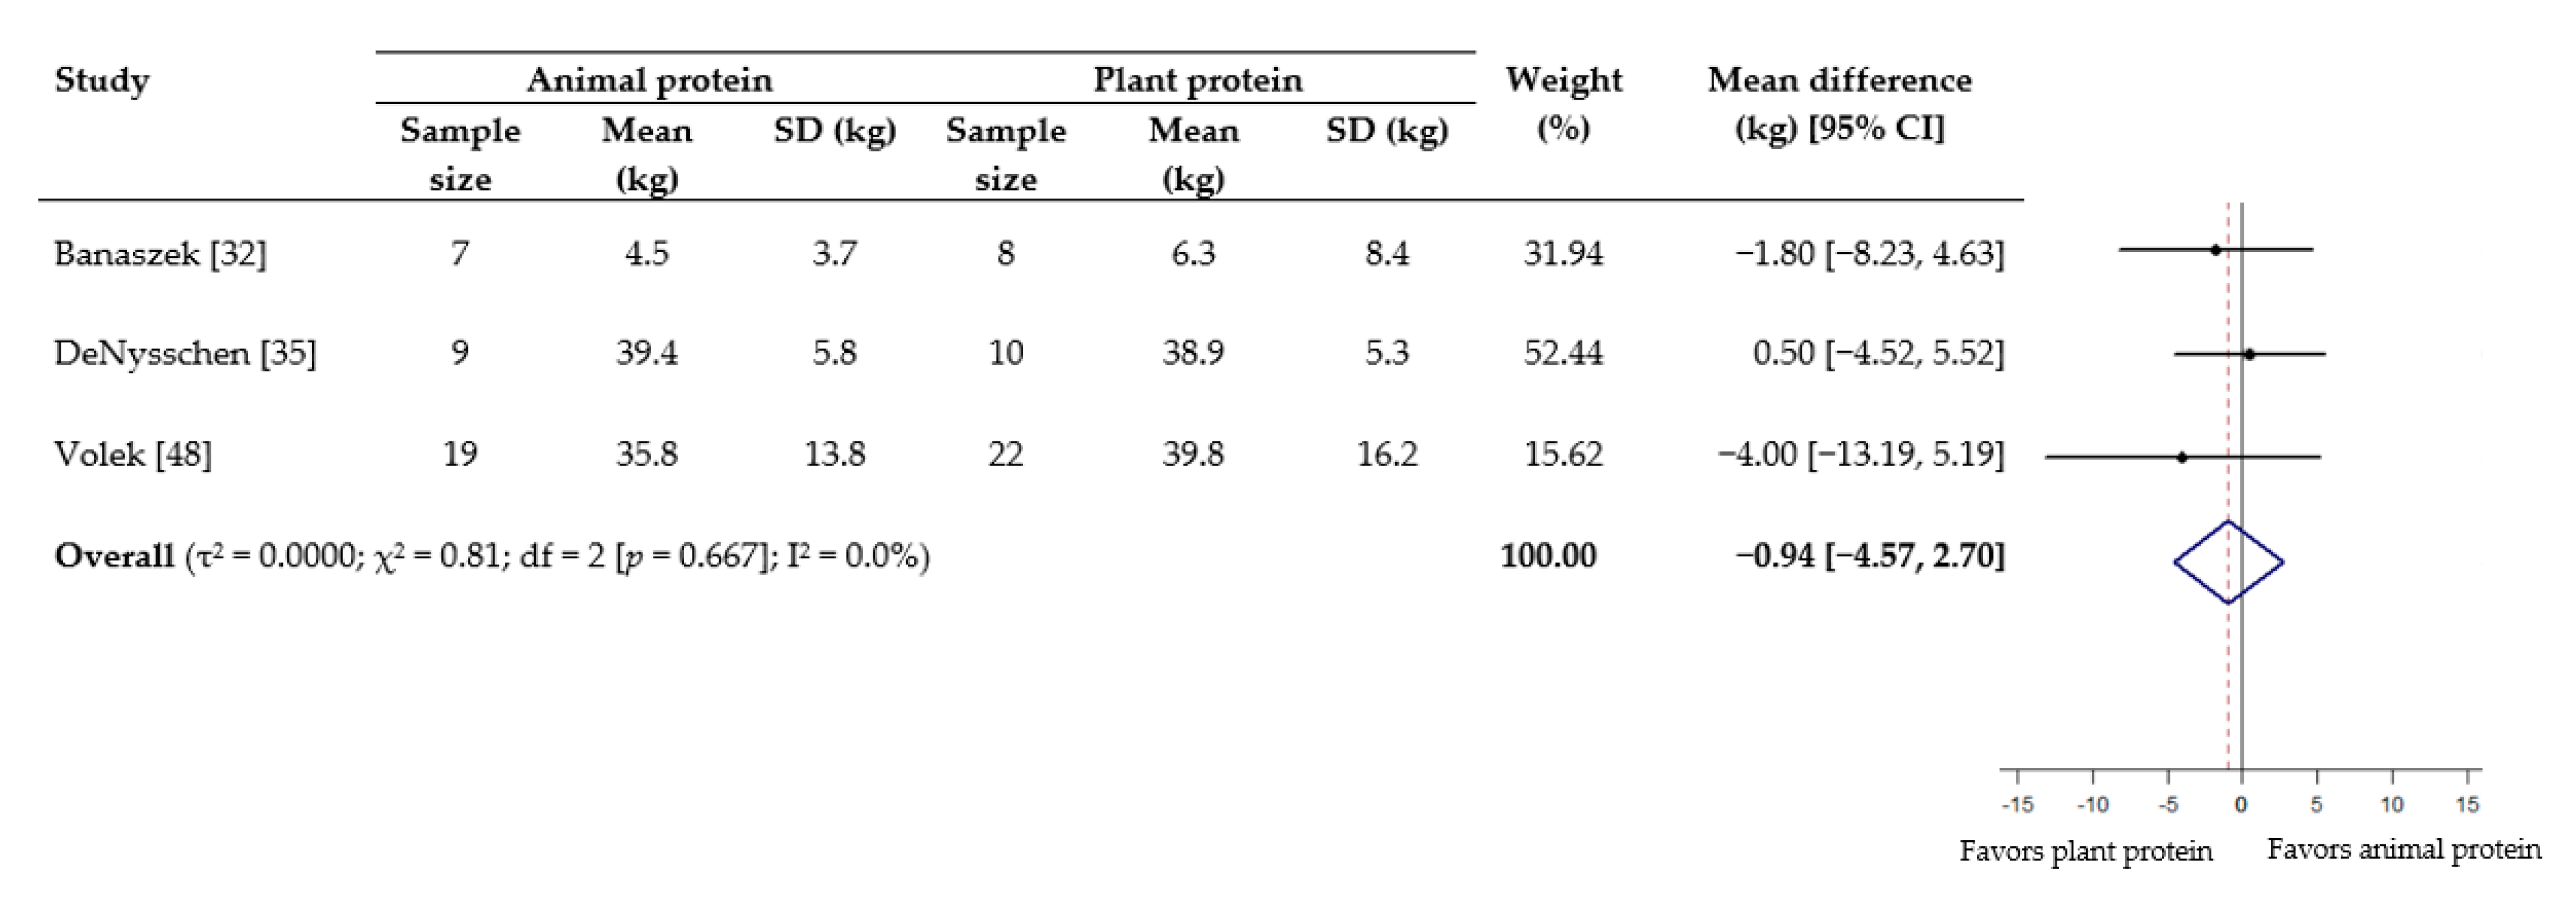
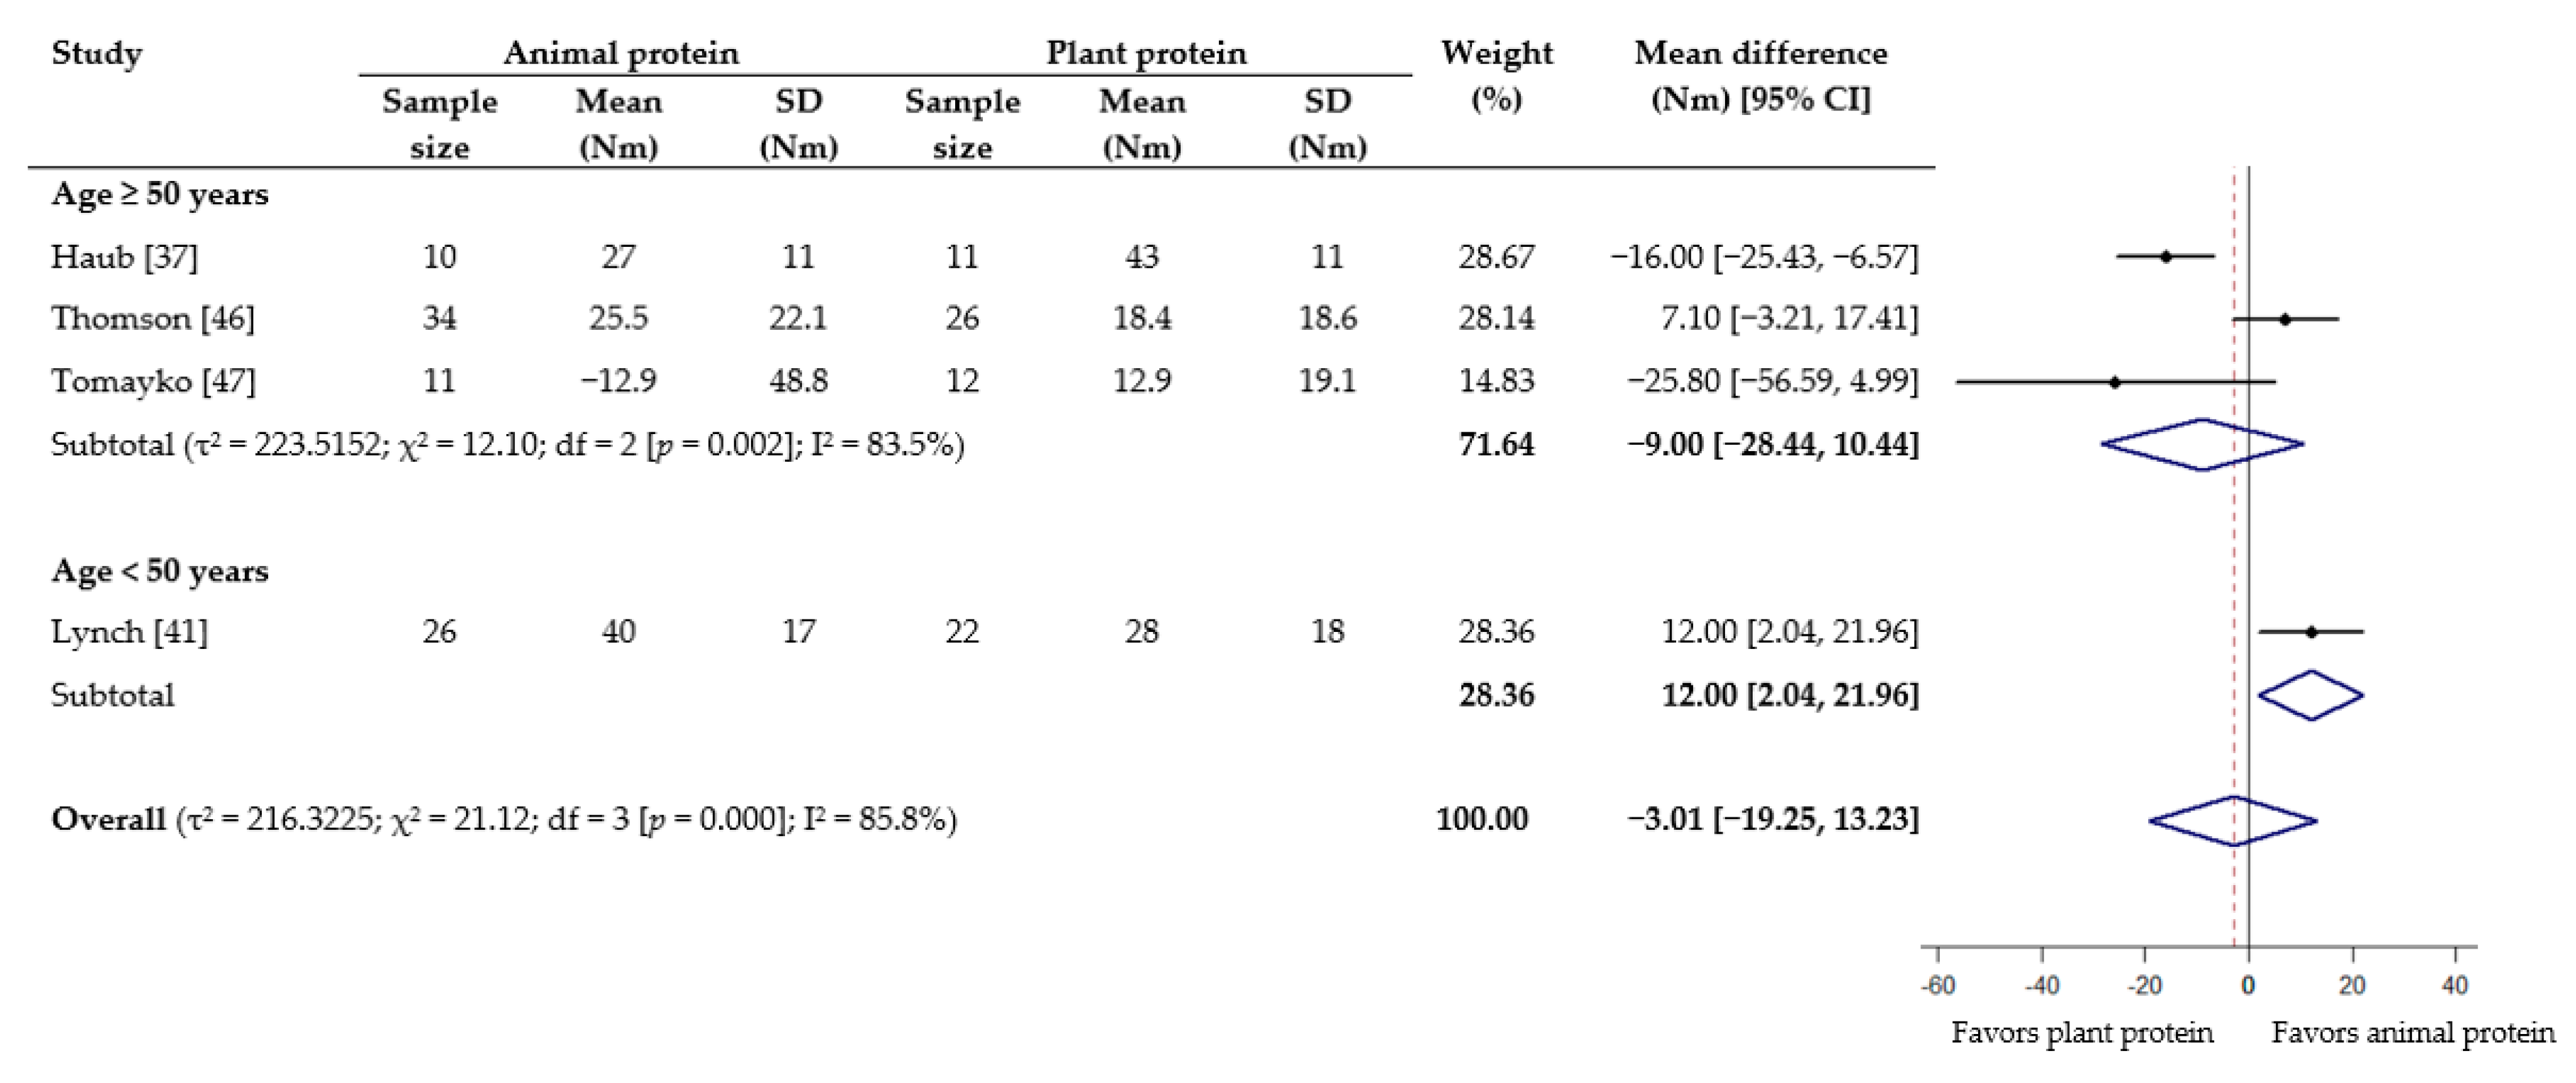
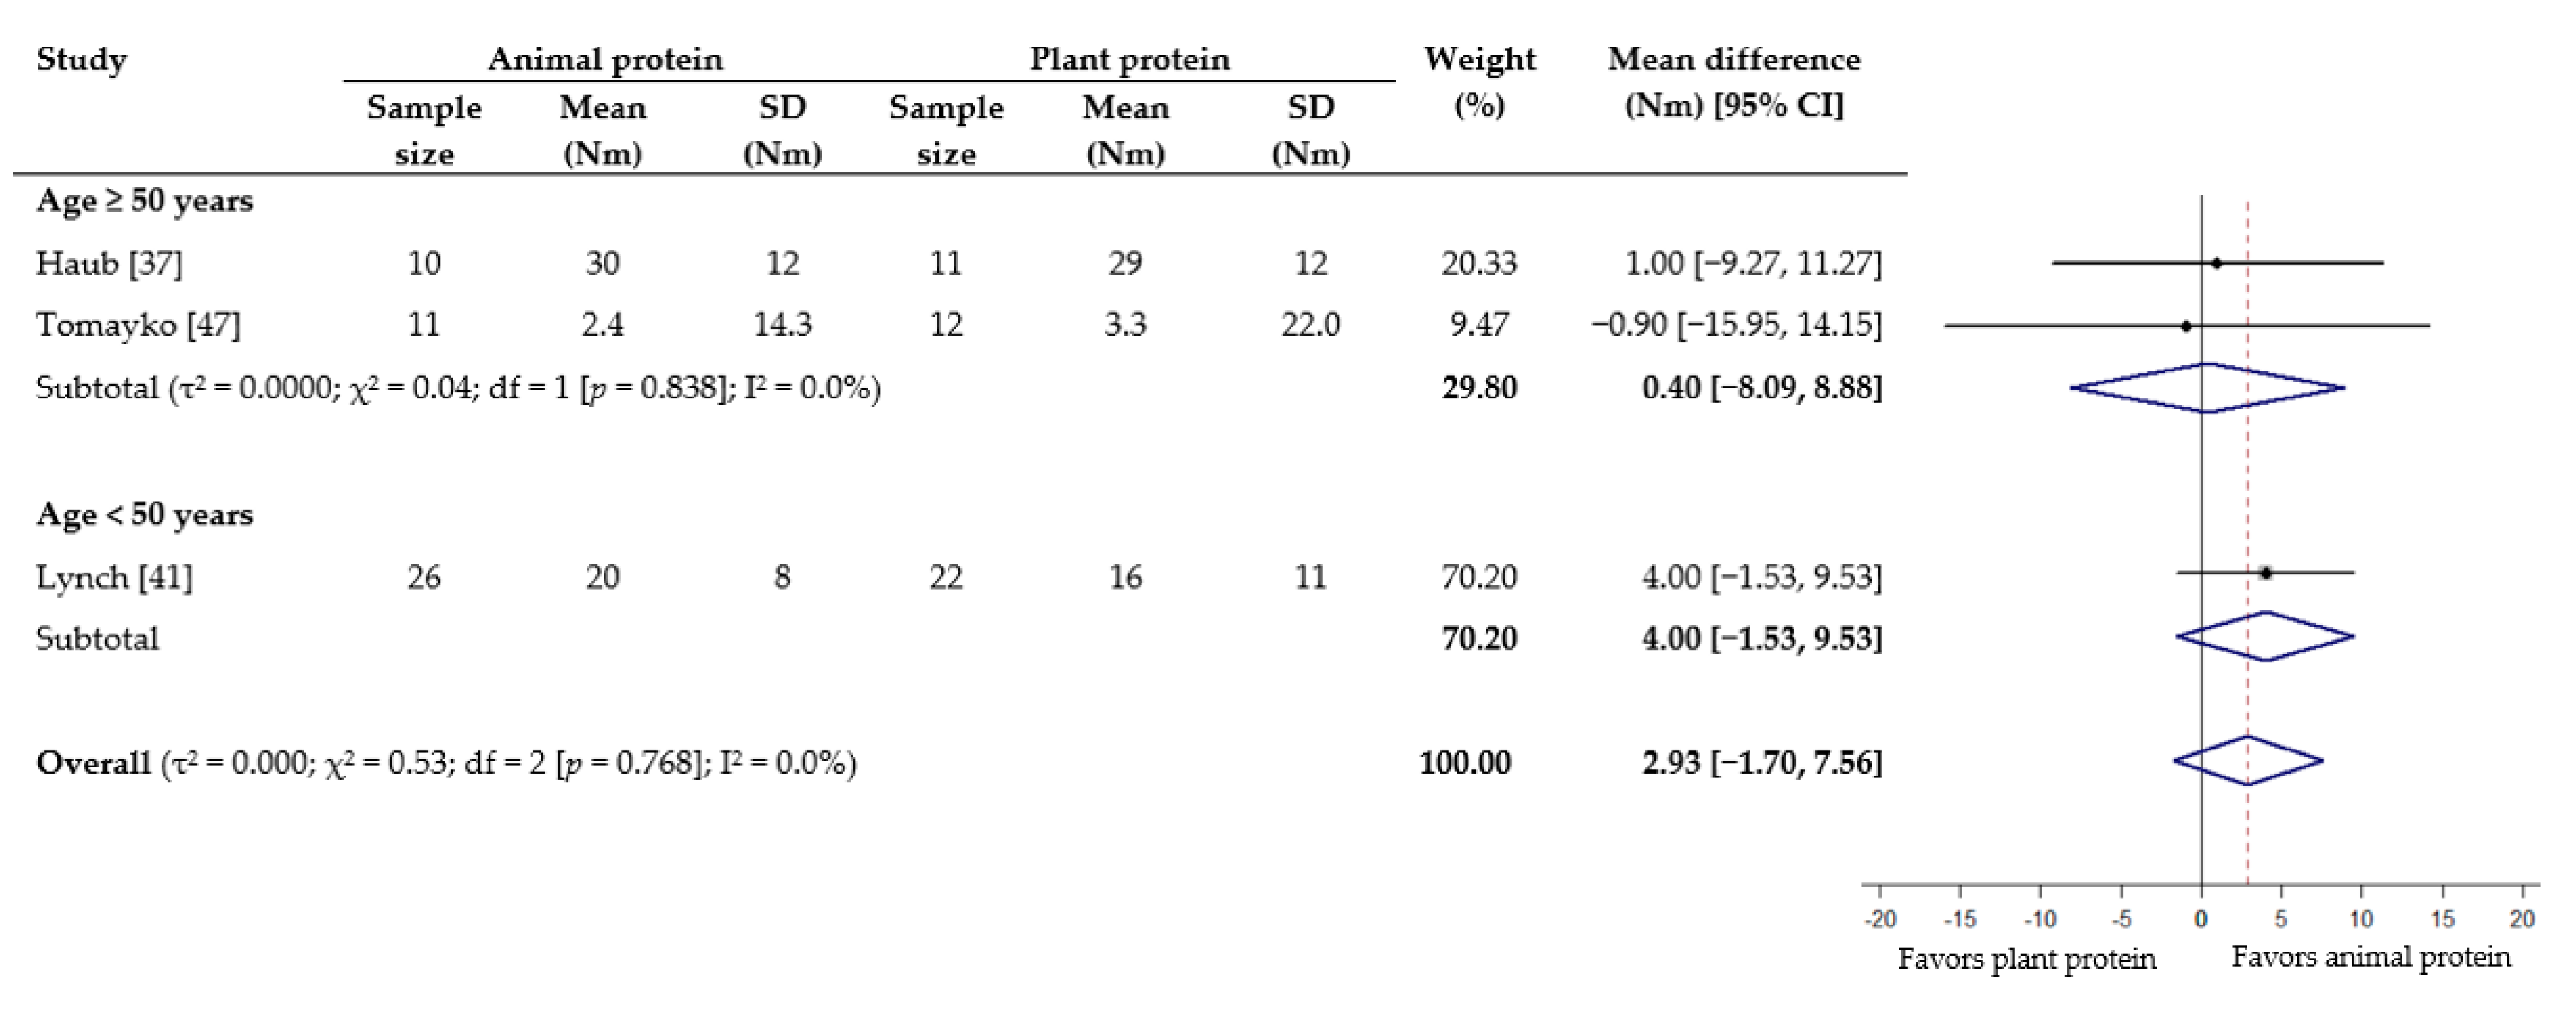
3.4. Results of Meta-Analysis

Meta-analysis revealed that although consuming animal protein provided a favorable effect on absolute lean mass compared to plant protein, the result was not statistically significant (WMD 0.22 kg; 95% CI −0.02 to 0.46) (Figure 2). On the other hand, animal protein intake was found to produce a statistically significant increase in percent lean mass (WMD 0.50%; 95% CI 0.05 to 0.95) (Figure 3). In the subgroup analysis based on age, while no difference was seen among older adults (≥50 years), there was a gain of 0.41 kg lean mass (95% CI, 0.08 to 0.74) and 0.50% lean mass (95% CI 0.00 to 1.01) with animal protein intake among subjects <50 years (Figure 2 and Figure 3). When analyzed according to RET, results showed no significant difference between the effect of protein source on absolute and percent lean mass, with or without RET (Figures S1 and S2).
As for muscle strength, meta-analyses showed no statistical difference in effect between animal protein and plant protein for 1-RM squat (WMD −0.94 kg; 95% CI −4.57 to 2.70) (Figure 4), grip strength (WMD −0.49 kg, 95% CI −1.28 to 0.30) (Figure S3), leg/knee extension (WMD −3.01 Nm; 95% CI −19.25 to 13.23) (Figure 5) and leg/knee flexion (WMD 2.93 Nm; 95% CI −1.70 to 7.56) (Figure 6). For the subgroup analyses based on age, a significant effect favoring animal protein was found in subjects <50 years for peak torque of leg/knee extension (WMD 12.00 Nm; 95% CI 2.04 to 21.96), although this was not seen for leg/knee flexion (Figure 5 and Figure 6). The subgroup analyses according to provision of RET did not demonstrate any significant difference between the effect of protein source on the measurements of muscle strength (Figures S3–S5).
Overall, there may be moderate heterogeneity across studies for absolute lean mass (I2 = 36.1%; p-value from Chi-squared test = 0.056), while heterogeneity was not present for percent lean mass (I2 = 0.0%; p = 0.986). Results for both lean mass outcomes were not stable to the leave-one-out sensitivity analysis (Table S3). For absolute lean mass, the impact of animal protein became significant when the study by Mobley et al. [43], Moeller et al. [44] or Thomson et al. [46] was removed from the analysis, resulting in higher WMD of between 0.25 kg and 0.29 kg. Percent lean mass was highly affected by four studies: i.e., Hill et al. [38], Lynch et al. [41], Mobley et al. [43] and Vupadhyayula et al. [49]. When either one of these studies was removed from the analysis, the impact of animal protein on percent lean mass was no longer significant.
In terms of muscle strength outcomes, there was no heterogeneity for the 1-RM squat, grip strength and peak torque of leg/knee flexion (I2 = 0.0% for all). However, considerable heterogeneity was found for peak torque of leg/knee extension (I2 = 85.8%; p = 0.000). The results reported for strength were all robust to sensitivity analysis (Table S4).

4. Discussion

Even though there is general consensus that animal protein is a potent stimulator of MPS, the effect of protein source on lean mass accretion over time and the potential influence of RET and age has not been systematically reviewed. Our qualitative assessment showed that both animal protein and plant protein supported an increase in absolute and percent lean mass, although a more substantial gain was observed with animal protein. Quantitatively, the meta-analysis revealed a favoring effect of animal protein specifically for percent lean mass. There was a significant gain in both absolute and percent lean mass with animal protein intake among adults <50 years, while RET did not influence the effect of protein source on changes in lean mass.
The positive impact of animal protein on percent lean mass could be attributed to its protein quality. Protein quality is dependent on the composition of amino acids as well as its ability to be digested, absorbed and utilized to meet the body’s needs [51]. Animal protein is deemed as “high quality” because it provides all the essential amino acids (EAAs) in sufficient quantities, and tends to be well digested [52]. EAAs are known to stimulate the mammalian target of rapamycin complex 1 (mTORC1) signaling pathway, triggering a rise in MPS [53,54]. Plant protein, including soy, is deficient in specific EAAs [15,52]. This relative lack of EAAs in plant protein may result in their amino acids being directed towards urea synthesis, instead of muscle building [15]. In addition, plant protein is generally less digestible than animal protein likely due to differences in protein structure, thus affecting their anabolic potential [17]. Since percent lean mass takes into account body weight, it is also plausible that subjects who consumed proportionally more animal protein experienced a greater loss or lesser gain in body weight (fat) over time. This is because the ingestion of animal protein may induce higher energy expenditure than plant protein, possibly due to its greater anabolic effect [52]. Increased percent lean mass has been shown to be associated with desirable health outcomes, such as lower risk of metabolic syndrome [55] and reduced mortality risk among middle-aged women [56].
Interestingly, absolute lean mass was not shown to be affected by protein source in our meta-analysis. Most subjects in the included studies were consuming a varied diet, comprising different protein foods. Hence, the finding that protein source did not differentially affect absolute lean mass may suggest that the proportion of animal protein and plant protein in a diverse diet do not influence the chronic response of muscle turnover, provided the total protein consumed is adequate. As stated before, subjects in the studies reviewed here achieved a total protein intake above the RDA, regardless of intervention group. Li et al. analyzed the diets of over 3200 community-dwelling adults and found no association between the ratio of animal-to-plant protein intake and the lean mass of participants, as measured by skeletal muscle index (SMI). There was however a significant relationship between total protein intake and SMI, where higher SMI was seen with protein intakes greater than the RDA [57]. Nonetheless, the discrepancy in results seen for the effect of animal protein on absolute and percent lean mass warrants further investigation. It should be noted that the number of studies used to assess the impact of protein source on absolute lean mass is different from that used for percent lean mass.
Morton et al. previously demonstrated in a systematic review that protein supplementation augmented gains in fat-free mass in response to RET, up to intakes of ~1.6 g/kg/day [58]. The authors however found no significant role for protein source (soy vs. whey) on changes in fat-free mass. In line with this, our subgroup analyses revealed that animal protein and plant protein did not differentially affect absolute and percent lean mass among subjects who performed RET. In the absence of RET, it has been shown that protein intakes greater than the RDA did not induce significant changes in lean mass over time [59]. We have further demonstrated here that without RET, protein source similarly had no influence on changes in absolute and percent lean mass. The revelation that both the quantity and quality of protein had no effect on lean mass, in the absence of RET, is perhaps not unexpected. MPS is known to switch off after a certain duration despite sustained amino acid availability, and RET is able to delay this “set-point” by up to and beyond 24 h [60]. In other words, the combination of protein intake and exercise is expected to be more anabolic than protein alone.
We found a significant gain in both absolute and percent lean mass with animal protein intake among adults <50 years, an effect not seen in older adults (≥50 years). Animal protein generally contains higher EAA content than plant protein [61], and evidence suggests that young muscles are more sensitive to the anabolic action of EAAs compared to aging muscles [62]. It is generally recognized that there is an attenuated response of MPS to the ingestion of protein which occurs with aging—a phenomenon known as “anabolic resistance” [63,64]. The etiology for this condition is not fully understood, but could be related to defects caused by declining physical activity, prolonged muscle disuse or chronic inflammation [65]. The cellular mechanisms may involve impaired activation of mTORC1 and downstream targets implicated in translation initiation, such as ribosomal protein S6 kinase (p70S6K) and eukaryotic initiation factor 4E binding protein 1 (4EBP1) [16]. While this age-associated reduction in MPS for older adults could be enhanced with greater doses of protein [62], the provision of more EAAs will not elevate MPS to the rate seen in younger adults [63]. Our finding appears to support the notion that protein intake may need to be enriched with other nutritional compounds, such as beta-hydroxy-beta-methylbutyrate (HMB) and vitamin D, to help maintain muscle mass among middle-aged and older adults [66].
Although animal protein was found to have resulted in a statistically significant gain in percent lean mass, as well as absolute and percent lean mass among younger adults (<50 years), the clinical significance of this increase is unclear. Based on the confidence interval of our results, the maximum gain in percent lean mass with animal protein intake was 0.95% overall. In a retrospective study conducted among Korean adults, the average percent lean mass of individuals with no metabolic syndrome was found to be approximately 1% higher than those with the condition [55]—this might be suggestive of the practical importance of our data. Regardless, as there is currently no consensus on what represents a minimal clinically important difference in lean mass [67], healthcare professionals should exercise appropriate clinical judgement in the interpretation of our findings.
The effect of protein source on muscle strength was found to be inconsistent across different outcome measures, based on the current qualitative assessment—this is reflective of results from observational studies [68,69]. Nevertheless, our meta-analyses revealed that protein source did not affect changes in strength outcomes. Similarly, no differences were found in subgroup analyses based on RET. This echoes findings by Messina et al., who demonstrated that both soy and animal protein (whey, beef and dairy) produced significant increases in strength (1-RM bench press and 1-RM squat) in response to RET, with no difference between protein groups [23]. Indeed, RET has been shown to be a far more potent stimulus for increasing muscle strength than protein supplementation [58]. It is therefore not surprising to find that without RET, protein source also did not differentially affect strength. As for subgroup analyses based on age, a significant effect favoring animal protein was seen in subjects <50 years for peak torque of leg/knee extension only. Although animal protein was found to benefit lean mass in younger adults in this study, lean mass gain may not necessarily translate to strength improvements. The link between growth in lean mass and changes in muscle strength is still a matter of debate [70,71]. Overall, there is no difference in effect between animal protein and plant protein on strength outcomes, with or without RET; the influence of age is not clear. It should be noted that the small number of studies used in these meta-analyses has limited our ability to draw any definitive conclusions.
The present work makes a unique contribution with its wide inclusion criteria that were not restricted to particular protein types or narrowly-defined participant characteristics. This has allowed us to conduct a comprehensive overview of the topic and increase the external validity and generalizability of our results. In addition, the omission of acute trials in this systematic review more accurately represents the accretion of lean mass that occurs over time. Nonetheless, our systematic review also has several limitations. Considering the variability in subjects and interventions of the included studies, there could have been a masking effect on the pooled estimates. Although subgroup analyses were conducted to uncover potential differences, findings were limited to the influence of age and RET. Moreover, findings for both absolute and percent lean mass were not stable to leave-one-out sensitivity analyses, hence our results need to be interpreted with caution. Although this review aimed to compare the effects between animal protein and plant protein, it should be noted that the source of animal protein in most studies was derived from dairy, while for plant protein a majority of the studies utilized some form of soy protein.
Another potential limitation is that we have assumed subjects randomized to the animal protein group and plant protein group have consumed a diet which was higher in animal protein and plant protein, respectively. It is however not possible to confirm this assumption for studies which provided protein as a supplement, since no details on background dietary pattern or intake were reported. For example, an individual assigned to receive a plant protein supplement could be eating a lot of animal-based foods, resulting in higher animal protein intake overall. It is imperative for future studies that aim to investigate the effect of protein source on lean mass and strength to include data on the subjects’ background diet, since the lack of such information may compromise the validity of the study’s results.

5. Conclusions

In summary, this systematic review and meta-analysis have found that animal protein tends to have a more favorable effect on lean mass compared to plant protein, and the benefit appears more pronounced in younger adults. On the other hand, protein source is not likely to have an impact on muscle strength.

Supplementary Materials

The following are available online at https://www.mdpi.com/2072-6643/13/2/661/s1, Figure S1: Effect of consuming animal protein compared to plant protein on changes in absolute lean mass (kg), with and without resistance exercise training (RET). Data expressed as weighted mean differences with 95% CIs, using a random-effects model. Figure S2: Effect of consuming animal protein compared to plant protein on changes in percent lean mass (%), with and without resistance exercise training (RET). Data expressed as weighted mean differences with 95% CIs, using a random-effects model. Figure S3: Effect of consuming animal protein compared to plant protein on changes in grip strength (kg), with and without resistance exercise training (RET). Data expressed as weighted mean differences with 95% CIs, using a random-effects model. Figure S4: Effect of consuming animal protein compared to plant protein on changes in peak torque of leg/knee extension (Nm), with and without resistance exercise training (RET). Data expressed as weighted mean differences with 95% CIs, using a random-effects model. Figure S5: Effect of consuming animal protein compared to plant protein on changes in peak torque of leg/knee flexion (Nm), with and without resistance exercise training (RET). Data expressed as weighted mean differences with 95% CIs, using a random-effects model. Table S1: Search strategy for a systematic review and meta-analysis assessing the effects of animal protein versus plant protein on supporting muscle mass and strength in adults. Table S2: Risk of bias assessment of included studies. Table S3: Sensitivity analysis for lean mass outcomes following the removal of single groups or randomized controlled trials to assess the robustness of meta-analyses results. Table S4: Sensitivity analysis for strength outcomes following the removal of single groups or randomized controlled trials to assess the robustness of meta-analyses results.

Author Contributions

M.T.L. and J.E.K. designed the study; M.T.L. and B.J.P. conducted the literature search; M.T.L., D.W.K.T. and C.N.S. analyzed the data; M.T.L. and J.E.K. drafted and reviewed the manuscript; M.T.L. and J.E.K. have primary responsibility for final content. All authors read and approved the final manuscript.

Funding

This research was funded by the National University of Singapore (R160-000-A03-133) and National University of Singapore Mind Science Centre (R160-000-A62-720).

Conflicts of Interest

The authors declare no conflict of interest.

Abbreviations

1-RM One repetition maximum
ADPAir displacement plethysmography
DXADual-energy X-ray absorptiometry
EAAEssential Amino Acid
FMMFat-free mass
MPBMuscle protein breakdown
MPSMuscle protein synthesis
mTORC1Mammalian target of rapamycin complex 1
RCTRandomized controlled trial
RDARecommended dietary allowance
RETResistance exercise training
SMISkeletal muscle index

References

  1. Wolfe, R.R. The underappreciated role of muscle in health and disease. Am. J. Clin. Nutr. 2006, 84, 475–482. [Google Scholar] [CrossRef]
  2. Meyer, C.; Dostou, J.M.; Welle, S.L.; Gerich, J.E. Role of human liver, kidney, and skeletal muscle in postprandial glucose homeostasis. Am. J. Physiol. Metab. 2002, 282, E419–E427. [Google Scholar] [CrossRef] [Green Version]
  3. Prado, C.M.; Purcell, S.A.; Alish, C.; Pereira, S.L.; Deutz, N.E.; Heyland, D.K.; Goodpaster, B.H.; Tappenden, K.A.; Heymsfield, S.B. Implications of low muscle mass across the continuum of care: A narrative review. Ann. Med. 2018, 50, 675–693. [Google Scholar] [CrossRef] [Green Version]
  4. Newman, A.B.; Kupelian, V.; Visser, M.; Simonsick, E.M.; Goodpaster, B.H.; Kritchevsky, S.B.; Tylavsky, F.A.; Rubin, S.M.; Harris, T.B. Strength, But Not Muscle Mass, Is Associated With Mortality in the Health, Aging and Body Composition Study Cohort. J. Gerontol. Ser. A: Boil. Sci. Med Sci. 2006, 61, 72–77. [Google Scholar] [CrossRef] [PubMed]
  5. Li, R.; Xia, J.I.; Zhang, X.; Gathirua-Mwangi, W.G.; Guo, J.; Li, Y.; McKenzie, S.; Song, Y. Associations of Muscle Mass and Strength with All-Cause Mortality among US Older Adults. Med. Sci. Sports Exerc. 2018, 50, 458–467. [Google Scholar] [CrossRef] [PubMed]
  6. Chen, L.; Nelson, D.R.; Zhao, Y.; Cui, Z.A.; Johnston, J. Relationship between muscle mass and muscle strength, and the impact of comorbidities: A population-based, cross-sectional study of older adults in the United States. BMC Geriatr. 2013, 13, 74. [Google Scholar] [CrossRef] [PubMed] [Green Version]
  7. Landi, F.; Calvani, R.; Tosato, M.; Martone, A.M.; Fusco, D.; Sisto, A.; Ortolani, E.; Savera, G.; Salini, S.; Marzetti, E. Age-Related Variations of Muscle Mass, Strength, and Physical Performance in Community-Dwellers: Results From the Milan EXPO Survey. J. Am. Med Dir. Assoc. 2017, 18, 88.e17–88.e24. [Google Scholar] [CrossRef]
  8. Hayashida, I.; Tanimoto, Y.; Takahashi, Y.; Kusabiraki, T.; Tamaki, J. Correlation between Muscle Strength and Muscle Mass, and Their Association with Walking Speed, in Community-Dwelling Elderly Japanese Individuals. PLoS ONE 2014, 9, e111810. [Google Scholar] [CrossRef] [PubMed]
  9. Bauer, J.; Biolo, G.; Cederholm, T.; Cesari, M.; Cruz-Jentoft, A.J.; Morley, J.E.; Phillips, S.; Sieber, C.; Stehle, P.; Teta, D.; et al. Evidence-Based Recommendations for Optimal Dietary Protein Intake in Older People: A Position Paper From the PROT-AGE Study Group. J. Am. Med Dir. Assoc. 2013, 14, 542–559. [Google Scholar] [CrossRef]
  10. Cruz-Jentoft, A.J.; Bahat, G.; Bauer, J.; Boirie, Y.; Bruyère, O.; Cederholm, T.; Cooper, C.; Landi, F.; Rolland, Y.; Sayer, A.A.; et al. Sarcopenia: Revised European consensus on definition and diagnosis. Age Ageing 2019, 48, 16–31. [Google Scholar] [CrossRef] [Green Version]
  11. Sayer, A.A.; Syddall, H.; Martin, H.; Patel, H.; Baylis, D.; Cooper, C. The developmental origins of sarcopenia. J. Nutr. Heal. Aging 2008, 12, 427–432. [Google Scholar] [CrossRef] [PubMed] [Green Version]
  12. Norman, K.; Otten, L. Financial impact of sarcopenia or low muscle mass—A short review. Clin. Nutr. 2019, 38, 1489–1495. [Google Scholar] [CrossRef]
  13. Tipton, K.D.; Wolfe, R.R. Exercise, protein metabolism, and muscle growth. Int. J. Sport Nutr. Exerc. Metab. 2001, 11, 109–132. [Google Scholar] [CrossRef] [Green Version]
  14. Kumar, V.; Atherton, P.; Smith, K.; Rennie, M.J. Human muscle protein synthesis and breakdown during and after exercise. J. Appl. Physiol. 2009, 106, 2026–2039. [Google Scholar] [CrossRef] [PubMed] [Green Version]
  15. Van Vliet, S.; Burd, N.A.; Van Loon, L.J.C. The Skeletal Muscle Anabolic Response to Plant- versus Animal-Based Protein Consumption. J. Nutr. 2015, 145, 1981–1991. [Google Scholar] [CrossRef] [Green Version]
  16. Gorissen, S.H.M.; Witard, O.C. Characterising the muscle anabolic potential of dairy, meat and plant-based protein sources in older adults. Proc. Nutr. Soc. 2018, 77, 20–31. [Google Scholar] [CrossRef]
  17. Berrazaga, I.; Micard, V.; Gueugneau, M.; Walrand, S. The Role of the Anabolic Properties of Plant- versus Animal-Based Protein Sources in Supporting Muscle Mass Maintenance: A Critical Review. Nutrients 2019, 11, 1825. [Google Scholar] [CrossRef] [PubMed] [Green Version]
  18. Zhubi-Bakija, F.; Bajraktari, G.; Bytyçi, I.; Mikhailidis, D.P.; Henein, M.Y.; Latkovskis, G.; Rexhaj, Z.; Zhubi, E.; Banach, M.; Alnouri, F.; et al. The impact of type of dietary protein, animal versus vegetable, in modifying cardiometabolic risk factors: A position paper from the International Lipid Expert Panel (ILEP). Clin. Nutr. 2021, 40, 255–276. [Google Scholar] [CrossRef]
  19. Fasolin, L.; Pereira, R.; Pinheiro, A.; Martins, J.; Andrade, C.; Ramos, O.; Vicente, A. Emergent food proteins—Towards sustainability, health and innovation. Food Res. Int. 2019, 125, 108586. [Google Scholar] [CrossRef] [Green Version]
  20. Langer, H.; Carlsohn, A. Effects of Different Dietary Proteins and Amino Acids on Skeletal Muscle Hypertrophy in Young Adults after Resistance Exercise. Strength Cond. J. 2014, 36, 33–42. [Google Scholar] [CrossRef] [Green Version]
  21. Phillips, S.M.; Tang, J.E.; Moore, D.R. The Role of Milk- and Soy-Based Protein in Support of Muscle Protein Synthesis and Muscle Protein Accretion in Young and Elderly Persons. J. Am. Coll. Nutr. 2009, 28, 343–354. [Google Scholar] [CrossRef] [PubMed]
  22. Janssen, I.; Heymsfield, S.B.; Wang, Z.; Ross, R. Skeletal muscle mass and distribution in 468 men and women aged 18–88 yr. J. Appl. Physiol. 2000, 89, 81–88. [Google Scholar] [CrossRef] [Green Version]
  23. Messina, M.; Lynch, H.; Dickinson, J.M.; Reed, K.E. No Difference between the Effects of Supplementing With Soy Protein Versus Animal Protein on Gains in Muscle Mass and Strength in Response to Resistance Exercise. Int. J. Sport Nutr. Exerc. Metab. 2018, 28, 674–685. [Google Scholar] [CrossRef] [PubMed] [Green Version]
  24. Moher, D.; Liberati, A.; Tetzlaff, J.; Altman, D.G. Preferred reporting items for systematic reviews and meta-analyses: The PRISMA statement. Int. J. Surg. 2010, 8, 336–341. [Google Scholar] [CrossRef] [Green Version]
  25. Buckinx, F.; Landi, F.; Cesari, M.; Fielding, R.A.; Visser, M.; Engelke, K.; Maggi, S.; Dennison, E.; Al-Daghri, N.M.; Allepaerts, S.; et al. Pitfalls in the measurement of muscle mass: A need for a reference standard. J. Cachexia Sarcopenia Muscle 2018, 9, 269–278. [Google Scholar] [CrossRef] [PubMed]
  26. Hames, K.C.; Anthony, S.J.; Thornton, J.C.; Gallagher, D.; Goodpaster, B.H. Body composition analysis by air displacement plethysmography in normal weight to extremely obese adults. Obesity 2013, 22, 1078–1084. [Google Scholar] [CrossRef] [PubMed] [Green Version]
  27. Josephs, H.; Huston, R. Dynamics of Mechanical Systems, 1st ed.; CRC Press: Boca Raton, FL, USA, 2002; p. 10. [Google Scholar]
  28. Yu, S.; Visvanathan, T.; Field, J.; Ward, L.C.; Chapman, I.; Adams, R.; Wittert, G.; Visvanathan, R. Lean body mass: The development and validation of prediction equations in healthy adults. BMC Pharmacol. Toxicol. 2013, 14, 53. [Google Scholar] [CrossRef] [Green Version]
  29. Eriksen, E.F. Cellular mechanisms of bone remodeling. Rev. Endocr. Metab. Disord. 2010, 11, 219–227. [Google Scholar] [CrossRef] [Green Version]
  30. Toh, D.W.K.; Koh, E.S.; Kim, J.E. Incorporating healthy dietary changes in addition to an increase in fruit and vegetable intake further improves the status of cardiovascular disease risk factors: A systematic review, meta-regression, and meta-analysis of randomized controlled trials. Nutr. Rev. 2019, 78, 532–545. [Google Scholar] [CrossRef]
  31. Borenstein, M.; Hedges, L.V.; Higgins, J.P.T.; Rothstein, H.R. Fixed-Effect versus Random-Effects Models. In Introduction to Meta-Analysis; Wiley: New York, NY, USA, 2009; pp. 77–86. [Google Scholar]
  32. Banaszek, A.; Townsend, J.R.; Bender, D.; Vantrease, W.C.; Marshall, A.C.; Johnson, K.D. The Effects of Whey vs. Pea Protein on Physical Adaptations Following 8-Weeks of High-Intensity Functional Training (HIFT): A Pilot Study. Sports 2019, 7, 12. [Google Scholar] [CrossRef] [Green Version]
  33. Basciani, S.; Camajani, E.; Contini, S.; Persichetti, A.; Risi, R.; Bertoldi, L.; Strigari, L.; Prossomariti, G.; Watanabe, M.; Mariani, S.; et al. Very-Low-Calorie Ketogenic Diets With Whey, Vegetable, or Animal Protein in Patients with Obesity: A Randomized Pilot Study. J. Clin. Endocrinol. Metab. 2020, 105, 2939–2949. [Google Scholar] [CrossRef]
  34. Candow, D.G.; Burke, N.C.; Smith-Palmer, T.; Burke, D.G. Effect of whey and soy protein supplementation combined with resistance training in young adults. Int. J. Sport Nutr. Exerc. Metab. 2006, 16, 233–244. [Google Scholar] [CrossRef]
  35. DeNysschen, C.A.; Burton, H.W.; Horvath, P.J.; Leddy, J.J.; Browne, R.W. Resistance training with soy vs whey protein supplements in hyperlipidemic males. J. Int. Soc. Sports Nutr. 2009, 6, 8. [Google Scholar] [CrossRef] [PubMed] [Green Version]
  36. Hartman, J.W.; Tang, J.E.; Wilkinson, S.B.; Tarnopolsky, M.A.; Lawrence, R.L.; Fullerton, A.V.; Phillips, S.M. Consumption of fat-free fluid milk after resistance exercise promotes greater lean mass accretion than does consumption of soy or carbohydrate in young, novice, male weightlifters. Am. J. Clin. Nutr. 2007, 86, 373–381. [Google Scholar] [CrossRef] [PubMed] [Green Version]
  37. Haub, M.D.; Wells, A.M.; Tarnopolsky, M.A. Campbell, W.W. Effect of protein source on resistive-training-induced changes in body composition and muscle size in older men. Am. J. Clin. Nutr. 2002, 76, 511–517. [Google Scholar] [CrossRef]
  38. Hill, A.M.; Jackson, K.A.H.; Roussell, M.A.; West, S.G.; Kris-Etherton, P.M. Type and amount of dietary protein in the treatment of metabolic syndrome: A randomized controlled trial. Am. J. Clin. Nutr. 2015, 102, 757–770. [Google Scholar] [CrossRef] [PubMed] [Green Version]
  39. Joy, J.M.; Lowery, R.P.; Wilson, J.M.; Purpura, M.; De Souza, E.O.; Mc Wilson, S.; Kalman, D.S.; Dudeck, J.E.; Jäger, R. The effects of 8 weeks of whey or rice protein supplementation on body composition and exercise performance. Nutr. J. 2013, 12, 86. [Google Scholar] [CrossRef] [Green Version]
  40. Kjølbæk, L.; Sørensen, L.B.; Søndertoft, N.B.; Rasmussen, C.K.; Lorenzen, J.K.; Serena, A.; Astrup, A.; Larsen, L.H. Protein supplements after weight loss do not improve weight maintenance compared with recommended dietary protein intake despite beneficial effects on appetite sensation and energy expenditure: A randomized, controlled, double-blinded trial. Am. J. Clin. Nutr. 2017, 106, 684–697. [Google Scholar] [CrossRef]
  41. Lynch, H.M.; Buman, M.P.; Dickinson, J.M.; Ransdell, L.B.; Johnston, C.S.; Wharton, C.M. No Significant Differences in Muscle Growth and Strength Development When Consuming Soy and Whey Protein Supplements Matched for Leucine Following a 12 Week Resistance Training Program in Men and Women: A Randomized Trial. Int. J. Environ. Res. Public Heal. 2020, 17, 3871. [Google Scholar] [CrossRef]
  42. Maltais, M.L.; Ladouceur, J.P.; Dionne, I.J. The Effect of Resistance Training and Different Sources of Postexercise Protein Supplementation on Muscle Mass and Physical Capacity in Sarcopenic Elderly Men. J. Strength Cond. Res. 2016, 30, 1680–1687. [Google Scholar] [CrossRef]
  43. Mobley, C.B.; Haun, C.T.; Roberson, P.A.; Mumford, P.W.; Romero, M.A.; Kephart, W.C.; Anderson, R.G.; Vann, C.G.; Osburn, S.C.; Pledge, C.D.; et al. Effects of Whey, Soy or Leucine Supplementation with 12 Weeks of Resistance Training on Strength, Body Composition, and Skeletal Muscle and Adipose Tissue Histological Attributes in College-Aged Males. Nutrients 2017, 9, 972. [Google Scholar] [CrossRef] [PubMed]
  44. Moeller, L.E.; Peterson, C.T.; Hanson, K.B.; Dent, S.B.; Lewis, D.S.; King, D.S.; Alekel, D.L. Isoflavone-rich soy protein prevents loss of hip lean mass but does not prevent the shift in regional fat distribution in perimenopausal women. Menopause 2003, 10, 322–331. [Google Scholar] [CrossRef] [PubMed]
  45. Neacsu, M.; Fyfe, C.; Horgan, G.; Johnstone, A.M. Appetite control and biomarkers of satiety with vegetarian (soy) and meat-based high-protein diets for weight loss in obese men: A randomized crossover trial. Am. J. Clin. Nutr. 2014, 100, 548–558. [Google Scholar] [CrossRef] [Green Version]
  46. Thomson, R.L.; Brinkworth, G.D.; Noakes, M.; Buckley, J.D.; Information, P.E.K.F.C. Muscle strength gains during resistance exercise training are attenuated with soy compared with dairy or usual protein intake in older adults: A randomized controlled trial. Clin. Nutr. 2016, 35, 27–33. [Google Scholar] [CrossRef]
  47. Tomayko, E.J.; Kistler, B.M.; Fitschen, P.J.; Wilund, K.R. Intradialytic Protein Supplementation Reduces Inflammation and Improves Physical Function in Maintenance Hemodialysis Patients. J. Ren. Nutr. 2015, 25, 276–283. [Google Scholar] [CrossRef] [Green Version]
  48. Volek, J.S.; Volk, B.M.; Gómez, A.L.; Kunces, L.J.; Kupchak, B.R.; Freidenreich, D.J.; Aristizabal, J.C.; Saenz, C.; Dunn-Lewis, C.; Ballard, K.D.; et al. Whey Protein Supplementation During Resistance Training Augments Lean Body Mass. J. Am. Coll. Nutr. 2013, 32, 122–135. [Google Scholar] [CrossRef] [PubMed]
  49. Vupadhyayula, P.M.; Gallagher, J.C.; Templin, T.; Logsdon, S.M.; Smith, L.M. Effects of soy protein isolate on bone mineral density and physical performance indices in postmenopausal women-a 2-year randomized, double-blind, placebo-controlled trial. Menopause 2009, 16, 320–328. [Google Scholar] [CrossRef]
  50. Trumbo, P.; Schlicker, S.; Yates, A.A.; Poos, M. Dietary Reference Intakes for Energy, Carbohydrate, Fiber, Fat, Fatty Acids, Cholesterol, Protein and Amino Acids. J. Am. Diet. Assoc. 2002, 102, 1621–1630. [Google Scholar] [CrossRef]
  51. Boye, J.; Wijesinha-Bettoni, R.; Burlingame, B. Protein quality evaluation twenty years after the introduction of the protein digestibility corrected amino acid score method. Br. J. Nutr. 2012, 108, S183–S211. [Google Scholar] [CrossRef] [Green Version]
  52. Gilbert, J.-A.; Bendsen, N.; Tremblay, A.; Astrup, A. Effect of proteins from different sources on body composition. Nutr. Metab. Cardiovasc. Dis. 2011, 21, B16–B31. [Google Scholar] [CrossRef]
  53. Fujita, S.; Dreyer, H.C.; Drummond, M.J.; Glynn, E.L.; Cadenas, J.G.; Yoshizawa, F.; Volpi, E.; Rasmussen, B.B. Nutrient signalling in the regulation of human muscle protein synthesis. J. Physiol. 2007, 582, 813–823. [Google Scholar] [CrossRef] [PubMed]
  54. Volpi, E.; Kobayashi, H.; Sheffield-Moore, M.; Mittendorfer, B.; Wolfe, R.R. Essential amino acids are primarily responsible for the amino acid stimulation of muscle protein anabolism in healthy elderly adults. Am. J. Clin. Nutr. 2003, 78, 250–258. [Google Scholar] [CrossRef] [PubMed]
  55. Park, B.S.; Yoon, J.S. Relative Skeletal Muscle Mass Is Associated with Development of Metabolic Syndrome. Diabetes Metab. J. 2013, 37, 458–464. [Google Scholar] [CrossRef] [Green Version]
  56. Bea, J.W.; Thomson, C.A.; Wertheim, B.C.; Nicholas, J.S.; Ernst, K.C.; Hu, C.; Jackson, R.D.; Cauley, J.A.; Lewis, C.E.; Caan, B.J.; et al. Risk of Mortality According to Body Mass Index and Body Composition Among Postmenopausal Women. Am. J. Epidemiology 2015, 182, 585–596. [Google Scholar] [CrossRef] [PubMed]
  57. Li, C.-Y.; Fang, A.-P.; Ma, W.-J.; Wu, S.-L.; Li, C.-L.; Chen, Y.-M.; Zhu, H.-L. Amount Rather than Animal vs Plant Protein Intake Is Associated with Skeletal Muscle Mass in Community-Dwelling Middle-Aged and Older Chinese Adults: Results from the Guangzhou Nutrition and Health Study. J. Acad. Nutr. Diet. 2019, 119, 1501–1510. [Google Scholar] [CrossRef] [Green Version]
  58. Morton, R.W.; Murphy, K.T.; McKellar, S.R.; Schoenfeld, B.J.; Henselmans, M.; Helms, E.; Aragon, A.A.; Devries, M.C.; Banfield, L.; Krieger, J.W.; et al. A systematic review, meta-analysis and meta-regression of the effect of protein supplementation on resistance training-induced gains in muscle mass and strength in healthy adults. Br. J. Sports Med. 2018, 52, 376–384. [Google Scholar] [CrossRef] [PubMed]
  59. Hudson, J.L.; Wang, Y.; Iii, R.E.B.; Campbell, W.W. Protein Intake Greater than the RDA Differentially Influences Whole-Body Lean Mass Responses to Purposeful Catabolic and Anabolic Stressors: A Systematic Review and Meta-analysis. Adv. Nutr. 2020, 11, 548–558. [Google Scholar] [CrossRef]
  60. Atherton, P.J.; Smith, K. Muscle protein synthesis in response to nutrition and exercise. J. Physiol. 2012, 590, 1049–1057. [Google Scholar] [CrossRef] [Green Version]
  61. Gorissen, S.H.M.; Crombag, J.J.R.; Senden, J.M.G.; Waterval, W.A.H.; Bierau, J.; Verdijk, L.B.; Van Loon, L.J.C. Protein content and amino acid composition of commercially available plant-based protein isolates. Amino Acids 2018, 50, 1685–1695. [Google Scholar] [CrossRef] [Green Version]
  62. Breen, L.; Phillips, S.M. Skeletal muscle protein metabolism in the elderly: Interventions to counteract the ’anabolic resistance’ of ageing. Nutr. Metab. 2011, 8, 68. [Google Scholar] [CrossRef] [Green Version]
  63. Cuthbertson, D.; Smith, K.; Babraj, J.; Leese, G.; Waddell, T.; Atherton, P.; Wackerhage, H.; Taylor, P.M.; Rennie, M.J. Anabolic signaling deficits underlie amino acid resistance of wasting, aging muscle. FASEB J. 2004, 19, 1–22. [Google Scholar] [CrossRef] [PubMed]
  64. Wall, B.T.; Gorissen, S.H.; Pennings, B.; Koopman, R.; Groen, B.B.L.; Verdijk, L.B.; Van Loon, L.J.C. Aging Is Accompanied by a Blunted Muscle Protein Synthetic Response to Protein Ingestion. PLoS ONE 2015, 10, e0140903. [Google Scholar] [CrossRef]
  65. Shad, B.J.; Thompson, J.L.; Breen, L. Does the muscle protein synthetic response to exercise and amino acid-based nutrition diminish with advancing age? A systematic review. Am. J. Physiol. Metab. 2016, 311, E803–E817. [Google Scholar] [CrossRef] [Green Version]
  66. Cruz-Jentoft, A.J.; Hughes, B.D.; Scott, D.; Sanders, K.M.; Rizzoli, R. Nutritional strategies for maintaining muscle mass and strength from middle age to later life: A narrative review. Maturitas 2020, 132, 57–64. [Google Scholar] [CrossRef] [PubMed]
  67. Daly, R.M.; Nowson, C.A. Can protein supplementation lead to clinically meaningful improvements in muscle mass and function in undernourished (pre)frail elderly? Am. J. Clin. Nutr. 2018, 108, 911–912. [Google Scholar] [CrossRef] [PubMed]
  68. Yuan, M.; Pickering, R.T.; Bradlee, M.L.; Mustafa, J.; Singer, M.R.; Moore, L.L. Animal protein intake reduces risk of functional impairment and strength loss in older adults. Clin. Nutr. 2020. [Google Scholar] [CrossRef]
  69. Sahni, S.; Mangano, K.M.; Hannan, M.T.; Kiel, D.P.; McLean, R.R. Higher Protein Intake Is Associated with Higher Lean Mass and Quadriceps Muscle Strength in Adult Men and Women. J. Nutr. 2015, 145, 1569–1575. [Google Scholar] [CrossRef]
  70. Loenneke, J.P.; Buckner, S.L.; Dankel, S.J.; Abe, T. Exercise-Induced Changes in Muscle Size do not Contribute to Exercise-Induced Changes in Muscle Strength. Sports Med. 2019, 49, 987–991. [Google Scholar] [CrossRef] [PubMed] [Green Version]
  71. Taber, C.B.; Vigotsky, A.; Nuckols, G.; Haun, C.T. Exercise-Induced Myofibrillar Hypertrophy is a Contributory Cause of Gains in Muscle Strength. Sports Med. 2019, 49, 993–997. [Google Scholar] [CrossRef] [Green Version]
Figure 1. Preferred reporting items for systematic reviews and meta-analyses (PRISMA) flow chart of the literature selection process. 1-RM: one-repetition maximum.
Nutrients 13 00661 g001
Figure 2. Effect of consuming animal protein compared to plant protein on changes in absolute lean mass (kg) based on age group. Data expressed as weighted mean differences with 95% CIs, using a random-effects model.
Nutrients 13 00661 g002
Figure 3. Effect of consuming animal protein compared to plant protein on changes in percent lean mass (%) based on age group. Data expressed as weighted mean differences with 95% CIs, using a random-effects model.
Nutrients 13 00661 g003
Figure 4. Effect of consuming animal protein compared to plant protein on changes in 1-RM squat (kg). Data expressed as weighted mean differences with 95% CIs, using a random-effects model. 1-RM: one-repetition maximum.
Nutrients 13 00661 g004
Figure 5. Effect of consuming animal protein compared to plant protein on changes in peak torque of leg/knee extension (Nm) based on age group. Data expressed as weighted mean differences with 95% CIs, using a random-effects model. Nm: Newton meter.
Nutrients 13 00661 g005
Figure 6. Effect of consuming animal protein compared to plant protein on changes in peak torque of leg/knee flexion (Nm) based on age group. Data expressed as weighted mean differences with 95% CIs, using a random-effects model. Nm: Newton meter.
Nutrients 13 00661 g006
Table 1. Population, intervention, comparison, outcome and setting (PICOS) criteria used to define the research question.
ParameterDescription
PopulationAdults with mean age ≥19 years
InterventionConsumption of animal protein, as food or supplement
ComparatorConsumption of plant protein, as food or supplement
OutcomeChange in muscle mass and/or muscle strength
Study designRandomized controlled trials
Research questionAre there differences in the effect of animal protein and plant protein on muscle mass and strength in adults?
Table 2. Summary of selected studies for systematic review and meta-analysis.
Author, Year and CountryDuration of InterventionSubjectsIntervention (per day)n /GenderAge (years)Baseline
Weight (kg)
Total Protein Intake ^RETReported Outcomes #
BaselineFinal
Banaszek et al. (2019), USA [32]8 weeksHealthy, trained adultsWhey protein: 48.8 g
Pea protein: 49 g
4M/3F
4M/4F
M:38.6 ± 12.7; F:38.9 ± 10.983.9 ± 18.9
78.4 ± 11.6
NA1.8 ± 0.3 a
1.7 ± 0.4 a
Yes1-RM squat
Basciani et al. (2020), Italy [33]~6 weeks
(45 days)
Obese, insulin-resistant, untrained adultsWhey protein b
Meat, fish and eggs b
Plant protein b
16
16
16
56.2 ± 6.1102.02 ± 12.04
98.36 ± 14.49
102.10 ± 12.36
NA~1.0NoTotal lean (DEXA); grip strength
Candow et al. (2006), Canada [34]6 weeksHealthy, untrained adultsWhey protein: ~83 g
Soy protein: ~86 g
6F/3M
6F/3M
24.0 ± 6
22.5 ± 6
69.3 ± 12
71.8 ± 15
1.6
1.8
3.1
3.0
YesLean tissue mass (DEXA); 1-RM bench press; 1-RM squat
DeNysschen et al. (2009), USA [35]12 weeksOverweight, untrained men with hypercholesterolemiaWhey protein: 26.6 g
Soy protein: 25.8 g
9M
10M
21–5090 ± 13.2
92.9 ± 7.9
1.0 ± 1.5
0.92 ± 0.9
1.2 ± 0.9
1.1 ± 0.9
Yes1-RM bench press; 1-RM squat
Hartman et al. (2007), Canada [36]12 weeksHealthy, untrained young menMilk: 35 g
Soy beverage: 35 g
18M
19M
18–3078.8 ± 10.6
83.3 ± 17.9
1.4 ± 0.4
1.2 ± 0.4
1.8 ± 0.8
1.6 ± 0.4
YesFat- and bone-free mass (DEXA)
Haub et al.
(2002), USA [37]
12 weeksHealthy, untrained older menBeef: ~54 g
TVP: ~54 g
10M
11M
63 ± 3
67 ± 6
89.5 ± 8.7
89.1 ± 6.3
1.00 ± 0.2
1.06 ± 0.1
1.03 ± 0.3
1.15 ± 0.1
YesFat-free mass (ADP); leg extension and flexion
Hill et al.
(2015), USA [38]
6 monthsOverweight/obese untrained adults with metabolic syndromeAnimal foods: 102.2 g c
Animal foods: 63.7 g c
Plant foods: 64.3 g c
10M/11F
9M/10F
9M/12F
46.4 ± 8.5
46.2 ± 9.4
45.3 ± 6.7
104.8 ± 17.7
101.8 ± 15.6
102.1 ± 15.5
~0.9 d
~0.9 d
~0.9 d
~1.5 e
~1.1 e
~1.0 e
NoBody lean mass (DEXA)
Joy et al.
(2013), USA [39]
8 weeksHealthy, trained young menWhey protein isolate: 48 g
Rice protein isolate: 48 g
12M
12M
21.3 ± 1.976.08 ± 5.6NANAYesLean body mass (DEXA); 1-RM bench press
Kjølbæk et al.
(2017), Denmark [40]
24 weeksHealthy, overweight/obese, untrained adultsWhey protein + calcium: 45 g
Whey protein: 45 g
Soy protein isolate: 45 g
7M/31F
7M/32F
8M/28F
42.7 ± 10.5
42.2 ± 9.32
42.4 ± 9.65
96.2 ± 14.5
95.8 ± 13.5
96.9 ± 13.2
1.00 ± 0.29
1.02 ± 0.27
1.00 ± 0.26
1.58 ± 0.29
1.66 ± 0.36
1.57 ± 0.36
NoLean body mass (DEXA)
Lynch et al.
(2020), USA [41]
12 weeksHealthy, untrained adultsWhey protein isolate: 19 g
Soy protein isolate: 26 g
10M/16F
7M/15F
18–3566.9 ± 10.1
65.5 ± 13.3
1.4
1.2
~1.6
~1.8
YesLean body mass (DEXA); leg extension and flexion
Maltais et al.
(2016), Canada [42]
16 weeksSarcopenic, untrained older menMilk: 13.53 g
Soy beverage + EAA powder: 12 g
8M
8M
68 ± 5.6
64 ± 4.8
76.7 ± 9.0
80.5 ± 13.5
1.04
1.26
~1.13
~1.36
YesLean body mass (DEXA); 1-RM bench press
Mobley et al.
(2017), USA [43]
12 weeksHealthy, untrained young menWhey protein concentrate: 52.6 g
Whey protein hydrolysate: 50.8 g
Soy protein concentrate: 78.4 g
17M
14M
15M
21 ± 4.1
21 ± 3.7
21 ± 3.9
81 ± 12.4
79 ± 11.2
81 ± 11.6
1.1 ± 0.4
1.2 ± 0.4
1.1 ± 0.4
1.8 ± 0.41
1.9 ± 0.37
2.1 ± 0.39
YesLean body mass (DEXA)
Moeller et al.
(2003), USA [44]
24 weeksHealthy, perimenopausal, untrained womenWhey protein: 40 g
Soy protein (isoflavone-poor): 40 g
Soy protein (isoflavone-rich): 40 g
21F
24F
24F
49.4 f
50.9 f
50.2 f
64.6 ± 8.9
64.5 ± 8.1
66.8 ± 10.2
~1.1
~1.1
~1.0
Mean intake +27 g among all subjectsNoBone-free lean mass (DEXA)
Neacsu et al.
(2005), UK [45]
2 weeks
(crossover)
Healthy, overweight/obese, untrained menMeat (chicken and beef) g
Soy foods and TVP g
20M51 ± 11.4109.6 ± 17.2~1.1 h
~1.1 h
~1.5 e
~1.5 e
NoFat-free mass (ADP)
Thomson et al. (2016), Australia [46]12 weeksHealthy, untrained adultsDairy shake: 27 g i
Soy shake: 27 g i
34
26
61.3 ± 6.9
61.7 ± 8.3
77.7 ± 15.6
75.8 ± 12.6
NA1.42 ± 0.14 a
1.45 ± 0.14 a
YesTotal body lean mass (DEXA); grip strength; knee extension
Tomayko et al. (2015), USA [47]6 monthsAdults on maintenance hemodialysisWhey protein: 27 g
Soy protein: 27 g
7M/4F
7M/5F
57.0 ± 4.8
52.5 ± 4.3
89.8 ± 24.5
91.9 ± 19.4
NANANoWhole body lean mass (DEXA); leg extension and flexion
Volek et al. (2013), USA [48]9 monthsHealthy, untrained adultsWhey protein concentrate: 21.6 g
Soy protein isolate: 20.0 g
13M/6F
11M/11F
22.8 ± 3.7
24.0 ± 2.9
74.1 ± 15.7
72.0 ± 8.4
1.27 ± 0.41
1.27 ± 0.45
1.39 ± 0.18
1.35 ± 0.13
YesLean body mass (DEXA); 1-RM bench press; 1-RM squat
Vupadhyayula et al. (2009), USA [49]24 monthsHealthy, postmenopausal, untrained womenCasein + whey: 25 g
Soy protein isolate + isoflavone: 25 g
Soy protein isolate: 25 g
52F
57F
48F
63.9 ± 4.3
63.8 ± 4.6
63.6 ± 4.5
69.6 ± 11.5
70.4 ± 12.0
71.4 ± 10.7
0.93 ± 0.21
0.97 ± 0.25
0.88 ± 0.26
1.34 ± 0.26
1.17 ± 0.30
1.07 ± 0.30
NoLean body mass (DEXA); grip strength
All values are mean ± SD, unless otherwise stated. Abbreviations: 1-RM, one-repetition maximum; ADP, air displacement plethysmography; DEXA, dual-energy X-ray absorptiometry; EAA, essential amino acid; NA, not available; RET: resistance exercise training; TVP, textured vegetable protein (soy); Based on subjects with reportable results, and may not reflect initial number recruited; ^ g/kg/day, unless otherwise stated; # Only outcomes utilized in the current review are shown; a Average intake during study period. Baseline and final intake values were not reported; b Subjects in each group were given 90 g protein as part of a very-low-calorie ketogenic diet. Plant protein was derived from soy, green peas or cereals. Quantity for each protein source was not specified; c Subjects were assigned to one of three diets: a diet in which plant protein (pulses, grains, soy, nuts and seeds) contributed two-thirds of total protein, a diet in which animal protein (lean beef, chicken, tuna, eggs and dairy) contributed two-thirds of total protein, and a higher protein diet where animal protein contributed two-thirds of total protein; d Calculated based on protein content of a 2-week controlled feeding diet, provided prior to randomization. Intake data were not reported; e Calculated based on protein content of the intervention diet. Intake data were not reported; f Median values. Median age of all subjects was 50.6 years; g Total protein provided in the meat-based diet and soy-based diet was 154.74 g and 153.03 g, respectively. Quantity for each protein source was not specified; h Calculated based on protein content of a 3-day maintenance diet, provided prior to randomization. Intake data were not reported; i Dairy shake consisted of reduced-fat milk, no-fat yoghurt and vanilla milk mix syrup. Soy shake was made from reduced-fat soy milk, soy yoghurt, soy protein powder and maltodextrin.
Table 3. Summary of changes in lean mass and strength from baseline levels after the consumption of animal protein compared to plant protein *.
OutcomeProtein Source
Animal ProteinPlant Protein
MedianRangeMedianRange
Lean mass (kg)1.25−3.02–3.970.80−2.62–3.2
Percent lean mass (%)1.50−0.6–3.060.32−3.3–2.9
1-RM bench press (kg)9.007.06–20.112.757.6–18.2
1-RM squat (kg)31.254.5–39.431.306.3–39.8
Grip strength (kg)1.20−1.59–1.980.09−0.86–1.6
Leg/knee extension (Nm)26.25−12.9–4023.2012.9–43
Leg/knee flexion (Nm)20.002.4–3016.003.3–29
1-RM: one-repetition maximum; Nm: Newton meter * Summary of reported and/or calculated change values for each outcome, presented as the median and range (min–max) of change values. Median standardized to two decimal places. Change values derived from the following number of studies: lean mass (n = 16); percent lean mass (n = 13); 1-RM bench press (n = 5); 1-RM squat (n = 4); grip strength (n = 3); leg/knee extension (n = 4); leg/knee flexion (n = 3). For the study by Maltais et al., only data for animal protein were used in qualitative assessment. Data for plant protein were omitted due to the addition of essential amino acid powder.
Publisher’s Note: MDPI stays neutral with regard to jurisdictional claims in published maps and institutional affiliations.

