1. Introduction
Since C.V. Raman discovered the Raman scattering phenomenon in 1928, rapid development has taken place in the field of Raman spectroscopy [
1,
2,
3,
4,
5,
6,
7,
8]. Varies of methods have been developed and utilized in biosciences [
4,
9,
10], electronics, archaeology [
11], planetary science [
12,
13,
14], and many other fields. The applications mentioned above are always fixed on a dedicated application scenario. However, there are many measurements needs that must be met outside of the laboratory, even in the field or deep space exploration missions. Therefore, portable/handheld Raman spectrometers and intelligent devices are greatly needed.
When it comes to deep space exploration missions, the National Aeronautics and Space Administration (NASA) of the United Stated has launched two Raman instruments, SuperCam [
15] and SHERLOC [
16], on board the Perseverance rover to Mars for the analysis and collection of minerals and organics. Moreover, there are more deep space exploration missions that are expected to be equipped with Raman payloads, including the Chang’e-7 mission [
17], which will be carried out by the China National Space Administration (CNSA); the ExoMars 2022 mission, which will be carried out by the European Space Agency (ESA) [
14]; and the Mars Moon eXploration (MMX) mission, which will be carried out by the Japan Aerospace Exploration Agency (JAXA) [
18].
By analyzing Raman scattering photons from molecules, a Raman probe can acquire vibrational spectrum of rocks, regolith, and even organics on a planetary surface. But as a non-damaging, rapid acquisition, accurate identification method, there are setbacks preventing Raman spectroscopy from being used in deep space exploration missions.
Firstly, most Raman probes perform a manual focusing procedure due to their sensitive relationship with the Raman Signal-to-Noise Ratio (SNR). To acquire a high-quality Raman spectrum, a spectrometer usually focuses according to a laser spot or a confocal imager. Therefore, a Raman spectrometer can only be operated by a well-trained operator with relevant knowledge and sufficient operating experience. Moreover, the manual focusing procedure can be affected by the operator, and the quality of the acquired spectra can vary with different operators. This not only limits the application of Raman spectroscopy, but also introduces artificial errors into spectrum acquisition.
The second disadvantage of most Raman spectrometers is their restricted application scenarios. Nowadays, Raman spectrometers are primarily designed for two kinds of users: scientists in laboratories and engineers in factories. There are few Raman spectrometers designed for geologists in the field or security officers who needs an efficient way to identify explosives outside a lab setting.
There are automatic focusing methods applicable for different kinds of optical systems that cooperate with Raman spectrometers [
3,
19]. However, the SHERLOC team found that there is an axial offset between the Raman spectrometer used and the Autofocus Context Imager (ACI) [
20]. To accomplish this automatic focusing task, researchers also tried to employ an autofocusing unit based on a liquid lens and a distance sensor [
21]. Therefore, an automatic focusing method independent of an optical system is in strong demand. Herein, we put forward an automatic focusing method which does not need the assistance of any other optical system like a microscope or a telescope.
2. Materials and Methods
At present, there are different ways to realize an auto-focus method for a Raman spectrometer; they can be based on pattern recognition, Raman spectra, and laser ranging methods. In the laboratory-used large-scale Raman spectrometer system that has been commercialized, the spectroscopic instrument has its own optical path used for confocal imaging; thus, pattern recognition can be easily used in manual/automatic focusing procedures. In this circumstance, we could choose the image-based focus evaluation function to evaluate the focusing condition. However, due to the overall system complexity, many optical components are irrelevant to Raman spectroscopy acquirement, like the confocal imager and other components, resulting in high costs and difficult implementation in deep space exploration missions.
In comparison, there is another automatic focusing method for spectrometers. In this method, equipment like a laser rangefinder is usually used to measure the distance between the spectrometer and the target, and the spectrometer is focused directly to the measured target position via the adjustment of its optic lens. This method is direct and intuitive, but distance calibration between the spectrometer and the rangefinder is necessary in advance, and should be performed throughout a spectrometer’s lifetime. Compared to a focus-fixed Raman probe, a spectrum-based auto-focusing method can realize the autofocus function without adding too much hardware to the spectroscopy system, leading to a simple structure and high reliability. Therefore, we selected the auto-focus design based on the spectral signal by selecting the corresponding focus evaluation function and programming to realize the auto-focus function. But how can we validate automatic focusing on account of Raman scattering light?
2.1. Principles of the Signal-Based Auto-Focusing Method
An ideal convex lens should be able to focus a parallel beam that travels along the optical axis to a focal point. Similarly, a beam of diverging light from the focal point should be collimated into a parallel beam after passing through the lens, as occurs in a lens group. Therefore, a lens group was utilized to focus the excitation laser and collect the induced Raman scattering photons. When the energy of the incident laser does not vary significantly, a Raman instrument can collect more photons with better focusing conditions, and hence the peaks in the spectra can be higher. To evaluate and quantify this, we put forward an evaluation parameter and named it the Focusing Evaluation Function (FEF). This FEF, which corresponds monotonically to the intensity of spectral peaks, can be utilized in a spectrum-based auto-focusing method, and therefore to evaluate focus levels.
After evaluating the focus conditions of the Raman spectroscopic probe, we also needed a strategy, namely, the Extremum Search Strategy (ESS), with which to find the position at which the Raman scattering peak is most intense. Different from other extremum search scenarios, the acquirement of Raman scattering light is more time consuming. Therefore, to improve the search efficiency of the search procedure, the acquirement of Raman spectra should be performed as few as possible.
The spectrum-based auto-focusing strategy mainly consists of using an FEF and an ESS. The selection of FEF and ESS is strongly related to the focusing efficiency and precision of the overall automatic focusing system. The FEF and ESS used in this study are introduced in detail as follows.
2.2. Calculation and Characteristics of the FEF
Whether or not the sample located in the focal plane of the lens group will change the FEF [
22], i.e., whether the value of the FEF comes to the extremum. Therefore, the quality of the FEF will directly affect the precision and efficiency of the auto-focusing method. There are many kinds of spectrum-based FEFs, such as the maximum peak intensity of the raw spectrum, the partial- or full-spectra integration of raw spectra, the maximum peak intensity of spectrum with baseline removed, and the partial- or full-spectra integration of a spectra with the baseline removed. The curve of the ideal FEF should change according to the focusing position (that is, the focal length of the lens group), be as monotonous as possible on both sides of the extreme value, and be able to reach the extreme value at the optimal focusing position; that is, it should meet the following characteristics [
23]:
Unbiasedness—The extreme value of an FEF should be reached when the lens group is accurately focused on the surface of the target. That is, the extreme point of an FEF should be consistent with the actual value of the focus.
Unimodality—The curve of the FEF that changes with the focal length should have only a single extreme point and increase/decrease monotonically on both sides of the extreme point.
Low-time-complexity—To improve the efficiency of the method, the amount of calculation required for the FEFs in the focusing procedure should be as low as possible. In addition, fast calculation methods should be utilized, such as addition and subtraction, rather than complex operations such as gradient calculation.
Otherwise, to fit the complexity and changeability of the application of Raman spectroscopy, we propose that there are two more criteria that be met:
Furthermore, FEFs are best characterized by steepness near the extreme point (i.e., the focal point), making the FEFs highly sensitive to the extreme point being the focus.
According to the features above, by comparing different kinds of spectrum-based FEFs, it can be found that there is a slight increment in computation between full spectra integration and the maximum peak intensity of the spectrum. However, the former is more robust, performing better in suppressing the random noise caused by single-or multi-pixel anomalies than the latter.
In addition, the influence of residual fluorescence is nonnegligible in the measurement of terrestrial materials. Therefore, the continuum is eliminated by removing the lower envelope right behind the acquisition of Raman spectrum in the focus procedure.
The FEF elected in this work can be calculated as follows:
In the equation, stands for the different positions where the spectra are acquired; stands for the intensity of each pixel with the continuum removed; and stands for the pixel number of the spectrometer.
When the surface of target material becomes closer to the focal plane, the FEF will increase and reach the extremum value when the spectrometer is focused on the sample surface. After passing the focal plane, the FEF decreases, which meeting the requirements of a unimodal distribution. Therefore, the integration of full spectra serves as an effective FEF in this spectrum-based auto-focusing method.
2.3. The ESS in Relation to the High-Computing Cost Issue
An ESS is the other key to find the best focusing position quickly. By applying the characteristic that the extreme point of the FEF curve corresponds precisely to the focusing position, an ESS can determine the best position by quickly finding the extreme point of the FEF. Under circumstances in which the performance of the FEFs is similar, a better ESS can significantly improve focusing efficiency. To meet the requirements, the ESS selected should apply to a dual function with less acquisition time and high accuracy. Common search strategies include the traversal method, the function approximation method, the mountain-climbing method, and the Fibonacci search method (also named the golden section search method) [
24].
The traversal method is seldomly applied because of the multiple readings required. It requires numerous acquisitions to accomplish this focusing procedure. At present, the mountain-climbing method is the most widely used. Though this method exhibits better performance than the traversal method, mountain-climbing method also requires large amounts of time because of its multiple acquisitions of spectra. The Fibonacci search method is rarely used because of its complex operation procedure and considerable uncertainty due to its discrete and discontinuous search process. It is easily affected by fluctuation near the extreme point, which does not conform with the unbiasedness. After multiple comparisons, we chose to simplify the Fibonacci search method and named the resulting version the trichotomy search method.
In the Fibonacci search method, the golden section point is used as the split point; more importantly, the array must be ordered. Therefore, when encountering a single-peak function, the Fibonacci search method cannot be utilized. The key procedure of Fibonacci search is the comparison between the target value and the middle value of the array. The result of the comparison determines the next range to search and consequently shortens the search range. For a single-peak function, we can search for the extremum point via the comparison of two split points and by narrowing the search range. The positions of these split points can impact the efficiency of the search procedure remarkably. Therefore, to average the influences of different focusing conditions, we utilized two triples of the search range as the split point and named the method trichotomy search.
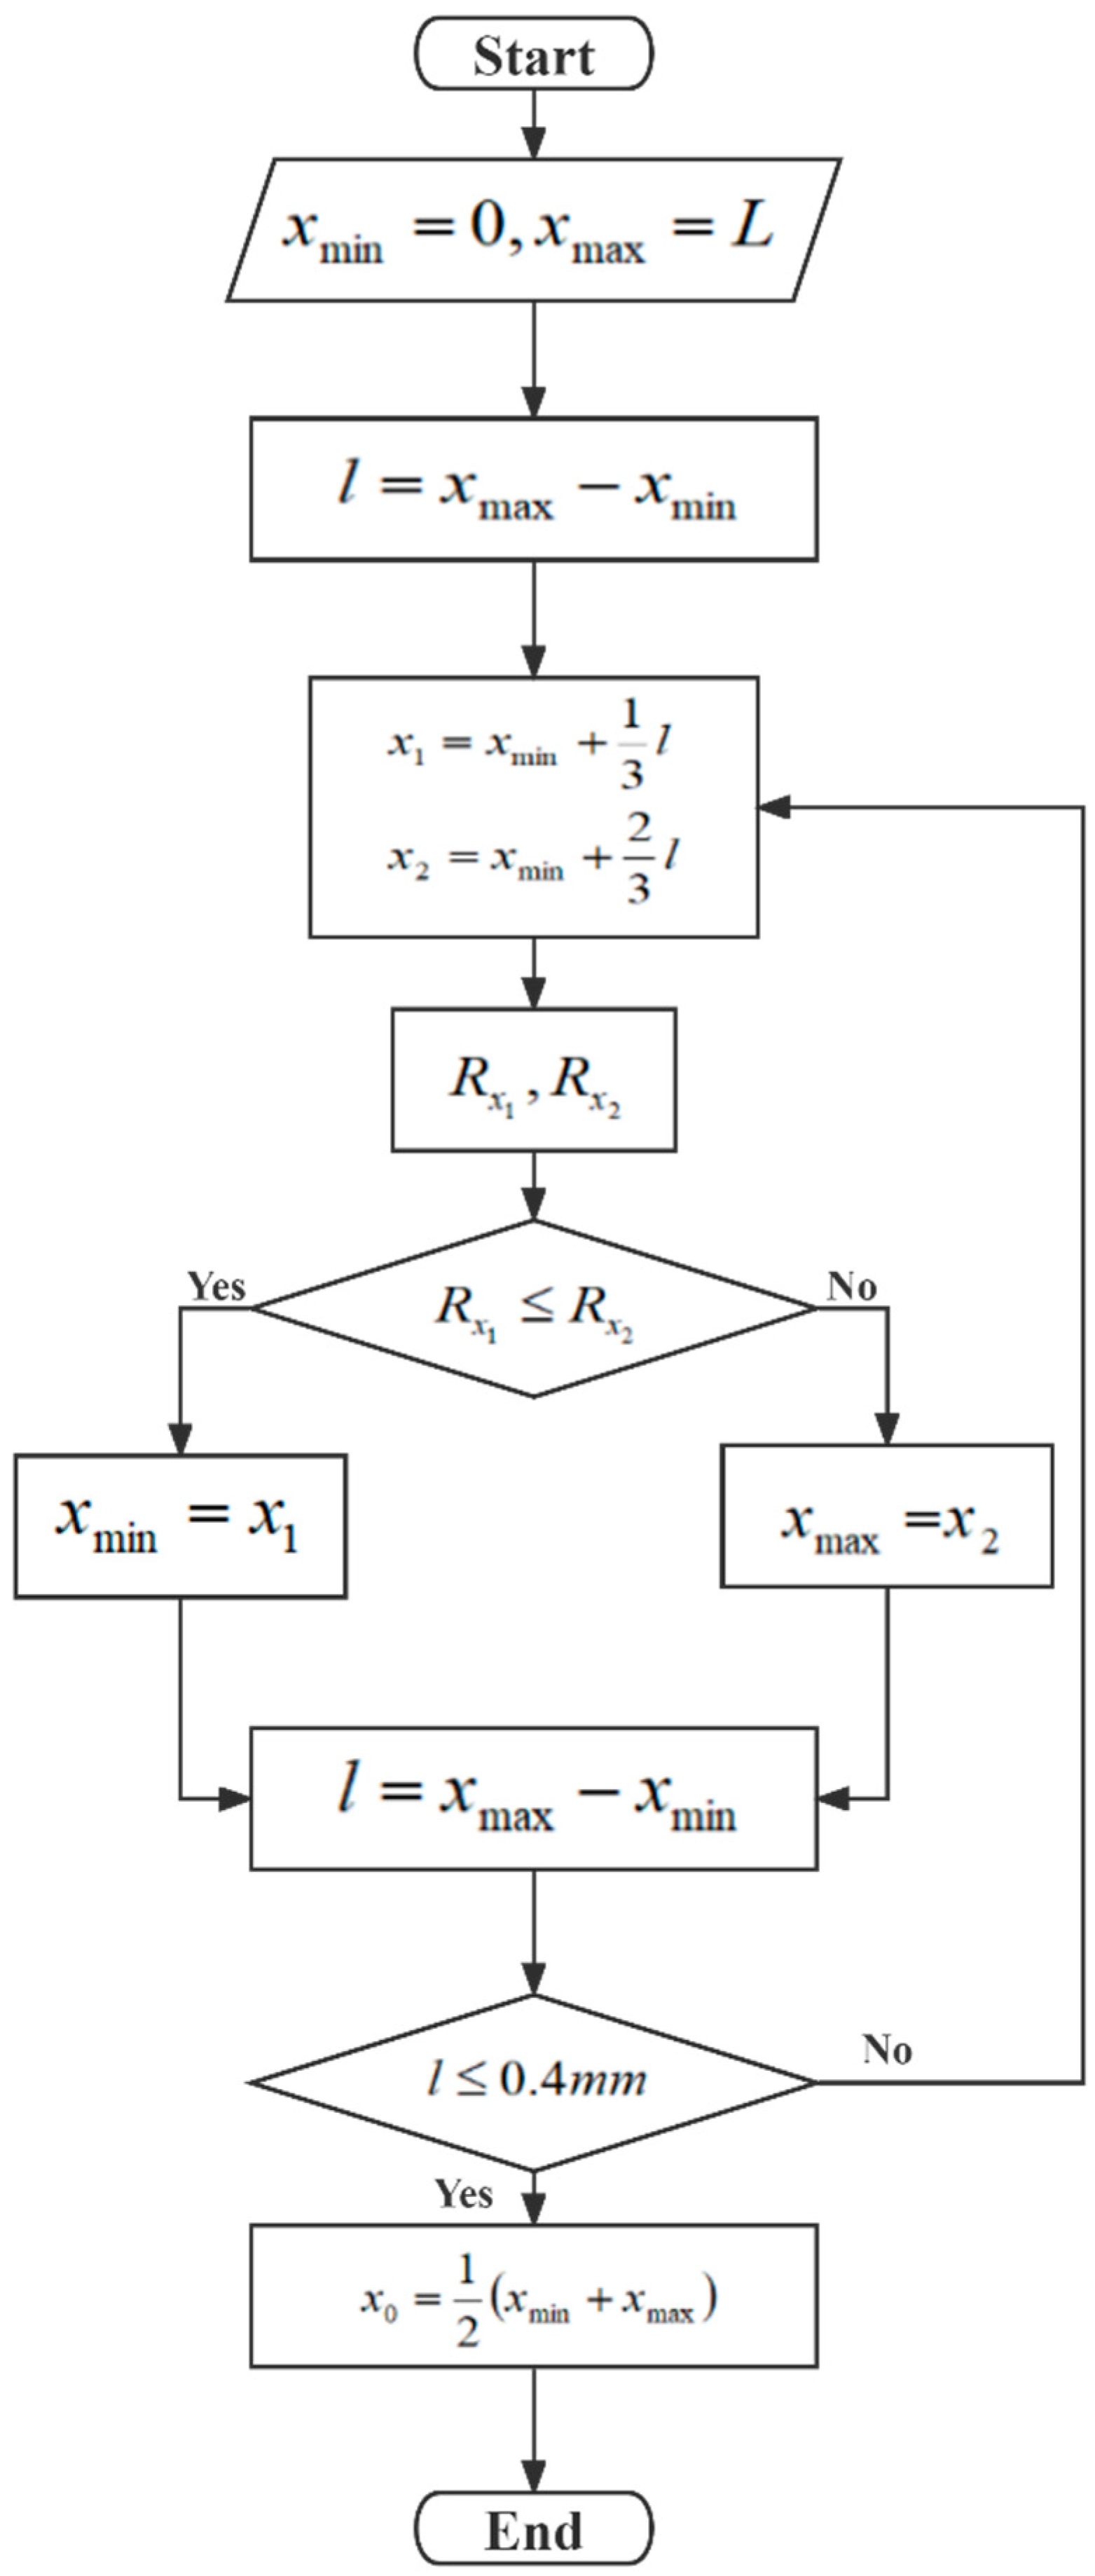
In the trichotomy search, the search range is continuously shortened to approximate the extreme point of an FEF according to the judgment conditions, finally achieving the preset accuracy to realize the focusing function. Therefore, under the condition that the accuracy of the FEF and focal length adjustment is high enough, a trichotomy search can attain a focusing result with very high precision.
Figure 1 shows a flow chart of the trichotomy search.
When the extremum point is set inside the performance range of this search strategy, the ESS begins.
The search range is denoted as xmin to xmax, and its length is written as L.
The length of the ongoing search range (l) is calculated, and two trisection points are denoted as x1 and x2 (0 < x1 < x2 < L).
Raman spectra at each trisection point, and a FEF is performed for each Raman spectrum marked as Rx1 or Rx2.
Rx1 and Rx2 are compared.
If Rx1 is not greater than Rx2, the lower end (xmin) of the search range will be set to x1; otherwise, the higher end (xmax) of the search range will be set to x2.
Procedures 3 to 6 are repeated until the ongoing search range (l) is no greater than 400 μm or the other break conditions have been met.
The midpoint of the last search range is taken as the focal point and output.
During the automatic focusing procedure, the integration time was set to 500 ms for organic materials, and for silicate or sulfate materials this integration time was set to 1000 ms to ensure a significant difference between in-focus and out-of-focus. In this work, the iteration of the focusing procedure was set to break when the step of acquisition was no greater than 400 μm depending on the accuracy of the motor. Therefore, we adopted a minimum pitch of 400 μm, ensuring that the distance error from the real focus was within 200 μm.
2.4. Auto-Focusing Raman Probe Developed by Shandong University
Using commercial items like a laser, a spectrometer, filters, lenses, and a stepper motor, we developed an auto-focus Raman probe (SDU-ARP, where SDU is short for Shandong University).
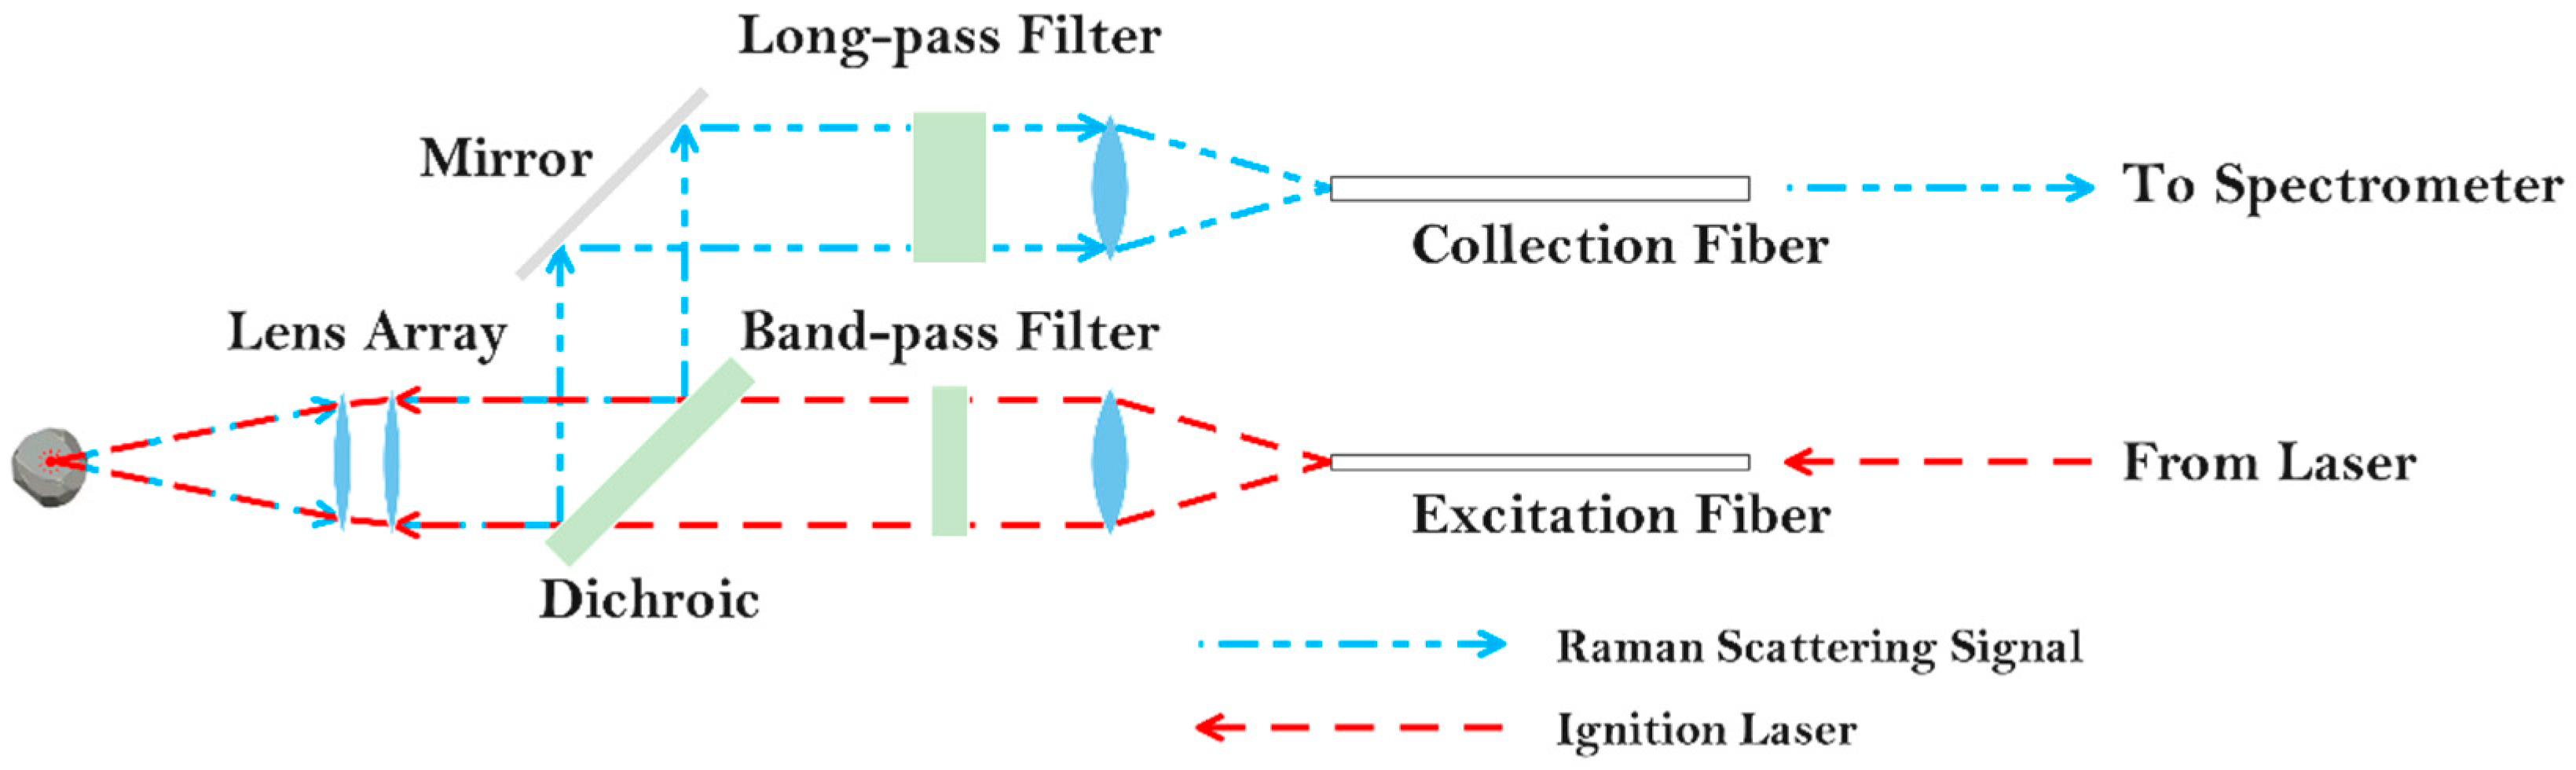
Figure 2 shows an optical scheme of the SDU-ARP, and
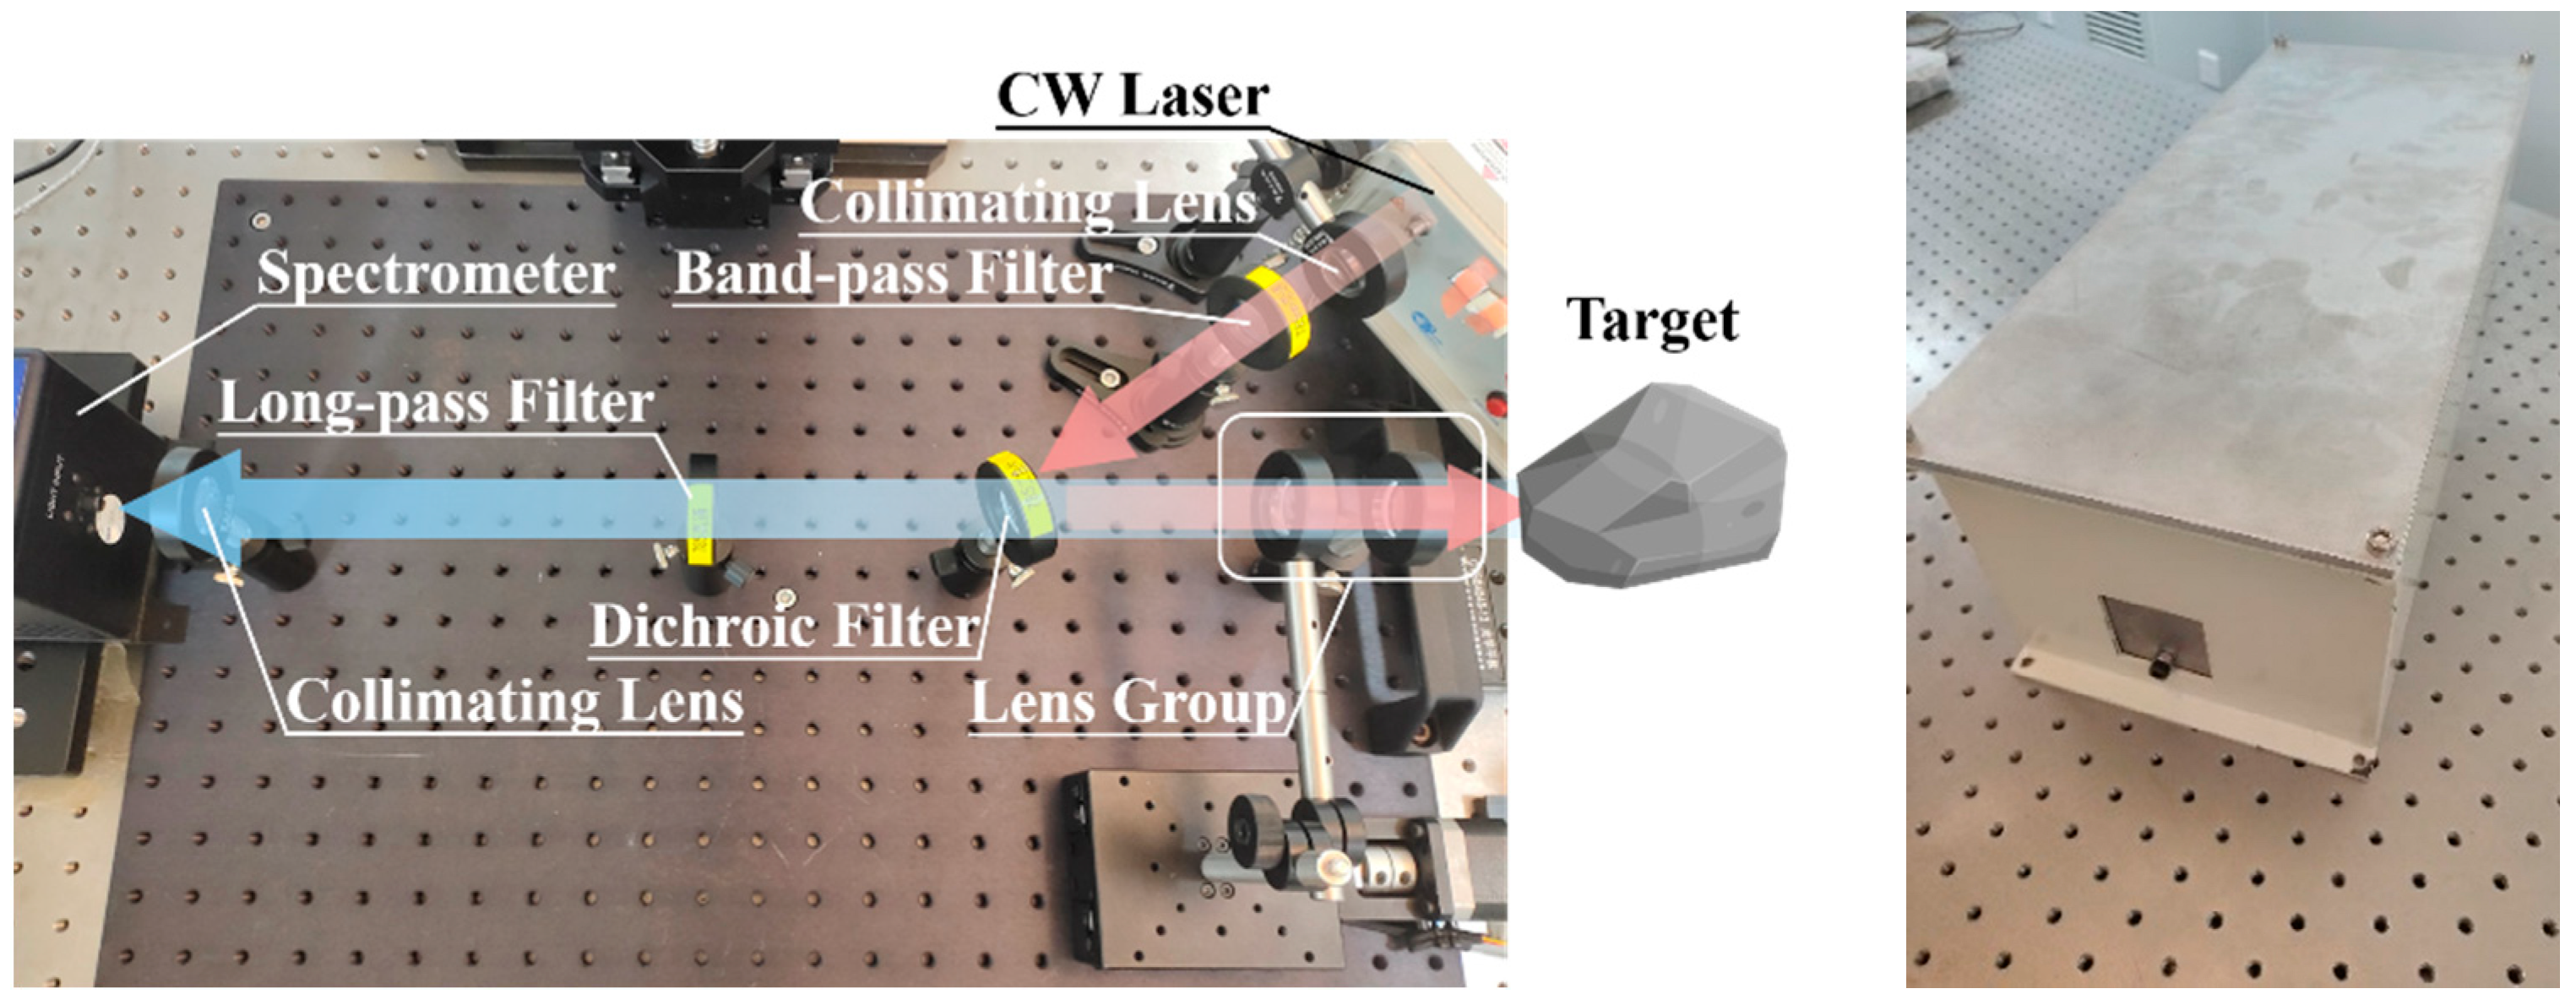
Figure 3 shows a breadboard model and the assemblage of the SDU-ARP.
For Raman spectroscopy, the excitation source is a laser. The laser source utilized in this work is CleanLaze BRM-785E presented by B&W Tek Co., Ltd., Newark, DE, USA, and it emits a continuous wave (CW) light. This laser source can maintain a linewidth of less than 0.03 nm in single transverse mode while operating at 785 nm.
The SDU-ARP consists of a collimating lens, a filter, a group of lenses for focusing the laser and collimating the Raman scattering light, a dichroic filter for dividing the Raman scattering light, a long-pass filter for filtering the Rayleigh scattering light, and a focus lens for collecting the Raman scattering light in the collection fiber. The lens group was utilized to adjust focal length and was driven by a stepper motor. This motor was aligned on a CXPF50-80100 motorized stage produced by Zolix Instrument Co., Ltd, Beijing, China. The motor can be controlled by a computer; therefore, it can be programmed by employing a Soft Development Kit (SDK, v1.0.0.8).
The last component is the spectrometer, which was utilized to convert the Raman scattering light into a spectrum that could be easily analyzed. The spectrometer used was a Glacier T produced by B&W Tek Co., Ltd., a type of TE-cooled spectrometer. The spectrometer was equipped with a 2048-pixel linear CCD array with a high dynamic range. Like the Zolix Co., Ltd., B&W Tek Co., Ltd. provided SDK to make a secondary development of the spectrometer available. By aligning between the spectrometer and the stepper motor, we realized the automatic presented focusing method in this paper.
When producing target materials, the minimum diameter of the laser spot on the target was approximately 120 μm, while the diameter of the well-focused spot after applying this auto-focusing method was approximately 190 μm. The focal distance of the SDU-ARP is between 5 and −45 mm. The design and realization of the auto-focusing function needed to maintain high focusing accuracy while also maintaining a high focusing speed, and these properties could be attained in different sample positions within the focusing range and in various samples. Theoretically, the auto-focusing function can normalize the imaging conditions and objectivity of each Raman spectrum. More importantly, an auto-focusing method can eliminate the difference in the characteristic peak intensity of the Raman spectrum caused by the difference in the manual focus effect as much as possible. Therefore, it helps the follow-up Raman spectral analyses in the laboratory or in the field.
2.5. Comparison of a Manual Focusing Method with the Auto-Focusing Method
For comparison with the automatic focusing method proposed in this paper, we employed a manual focusing method that is widely applied in laser instrument focusing procedures. This artificial method according to the diameter of the laser spot on the surface of a target. It is widely accepted that the probe is focused when the laser spot is at a minimum diameter. Therefore, we performed an artificial focusing procedure consisting of adjusting the probe position and the target position to minimize the laser spot diameter.
2.6. Continuum Removal Method
During the focusing procedure, Raman spectra were acquired at relatively low quality. To avoid disturbance from fluorescence, the spectra used in the focusing procedure were continuum-removed. This continuum removal was realized by using spline algorithms to remove the lower envelope of a spectrum [
25]. The lower envelopes of the spectra were dominated by spectral noise from the spectrometer. Therefore, directly removing the lower envelope of a spectrum may make the spectral baseline less than flat, which could lead to misleading results. Therefore, the lower envelope was calculated from the denoised spectra. Then, the raw spectra, i.e., spectra to which noise reduction was not applied, were removed along with this lower envelope, so it was no longer influenced by spectral noise. This method can avoid the occurrence of false peaks from continuum removal and makes the spectra-based method more robust.
3. Results
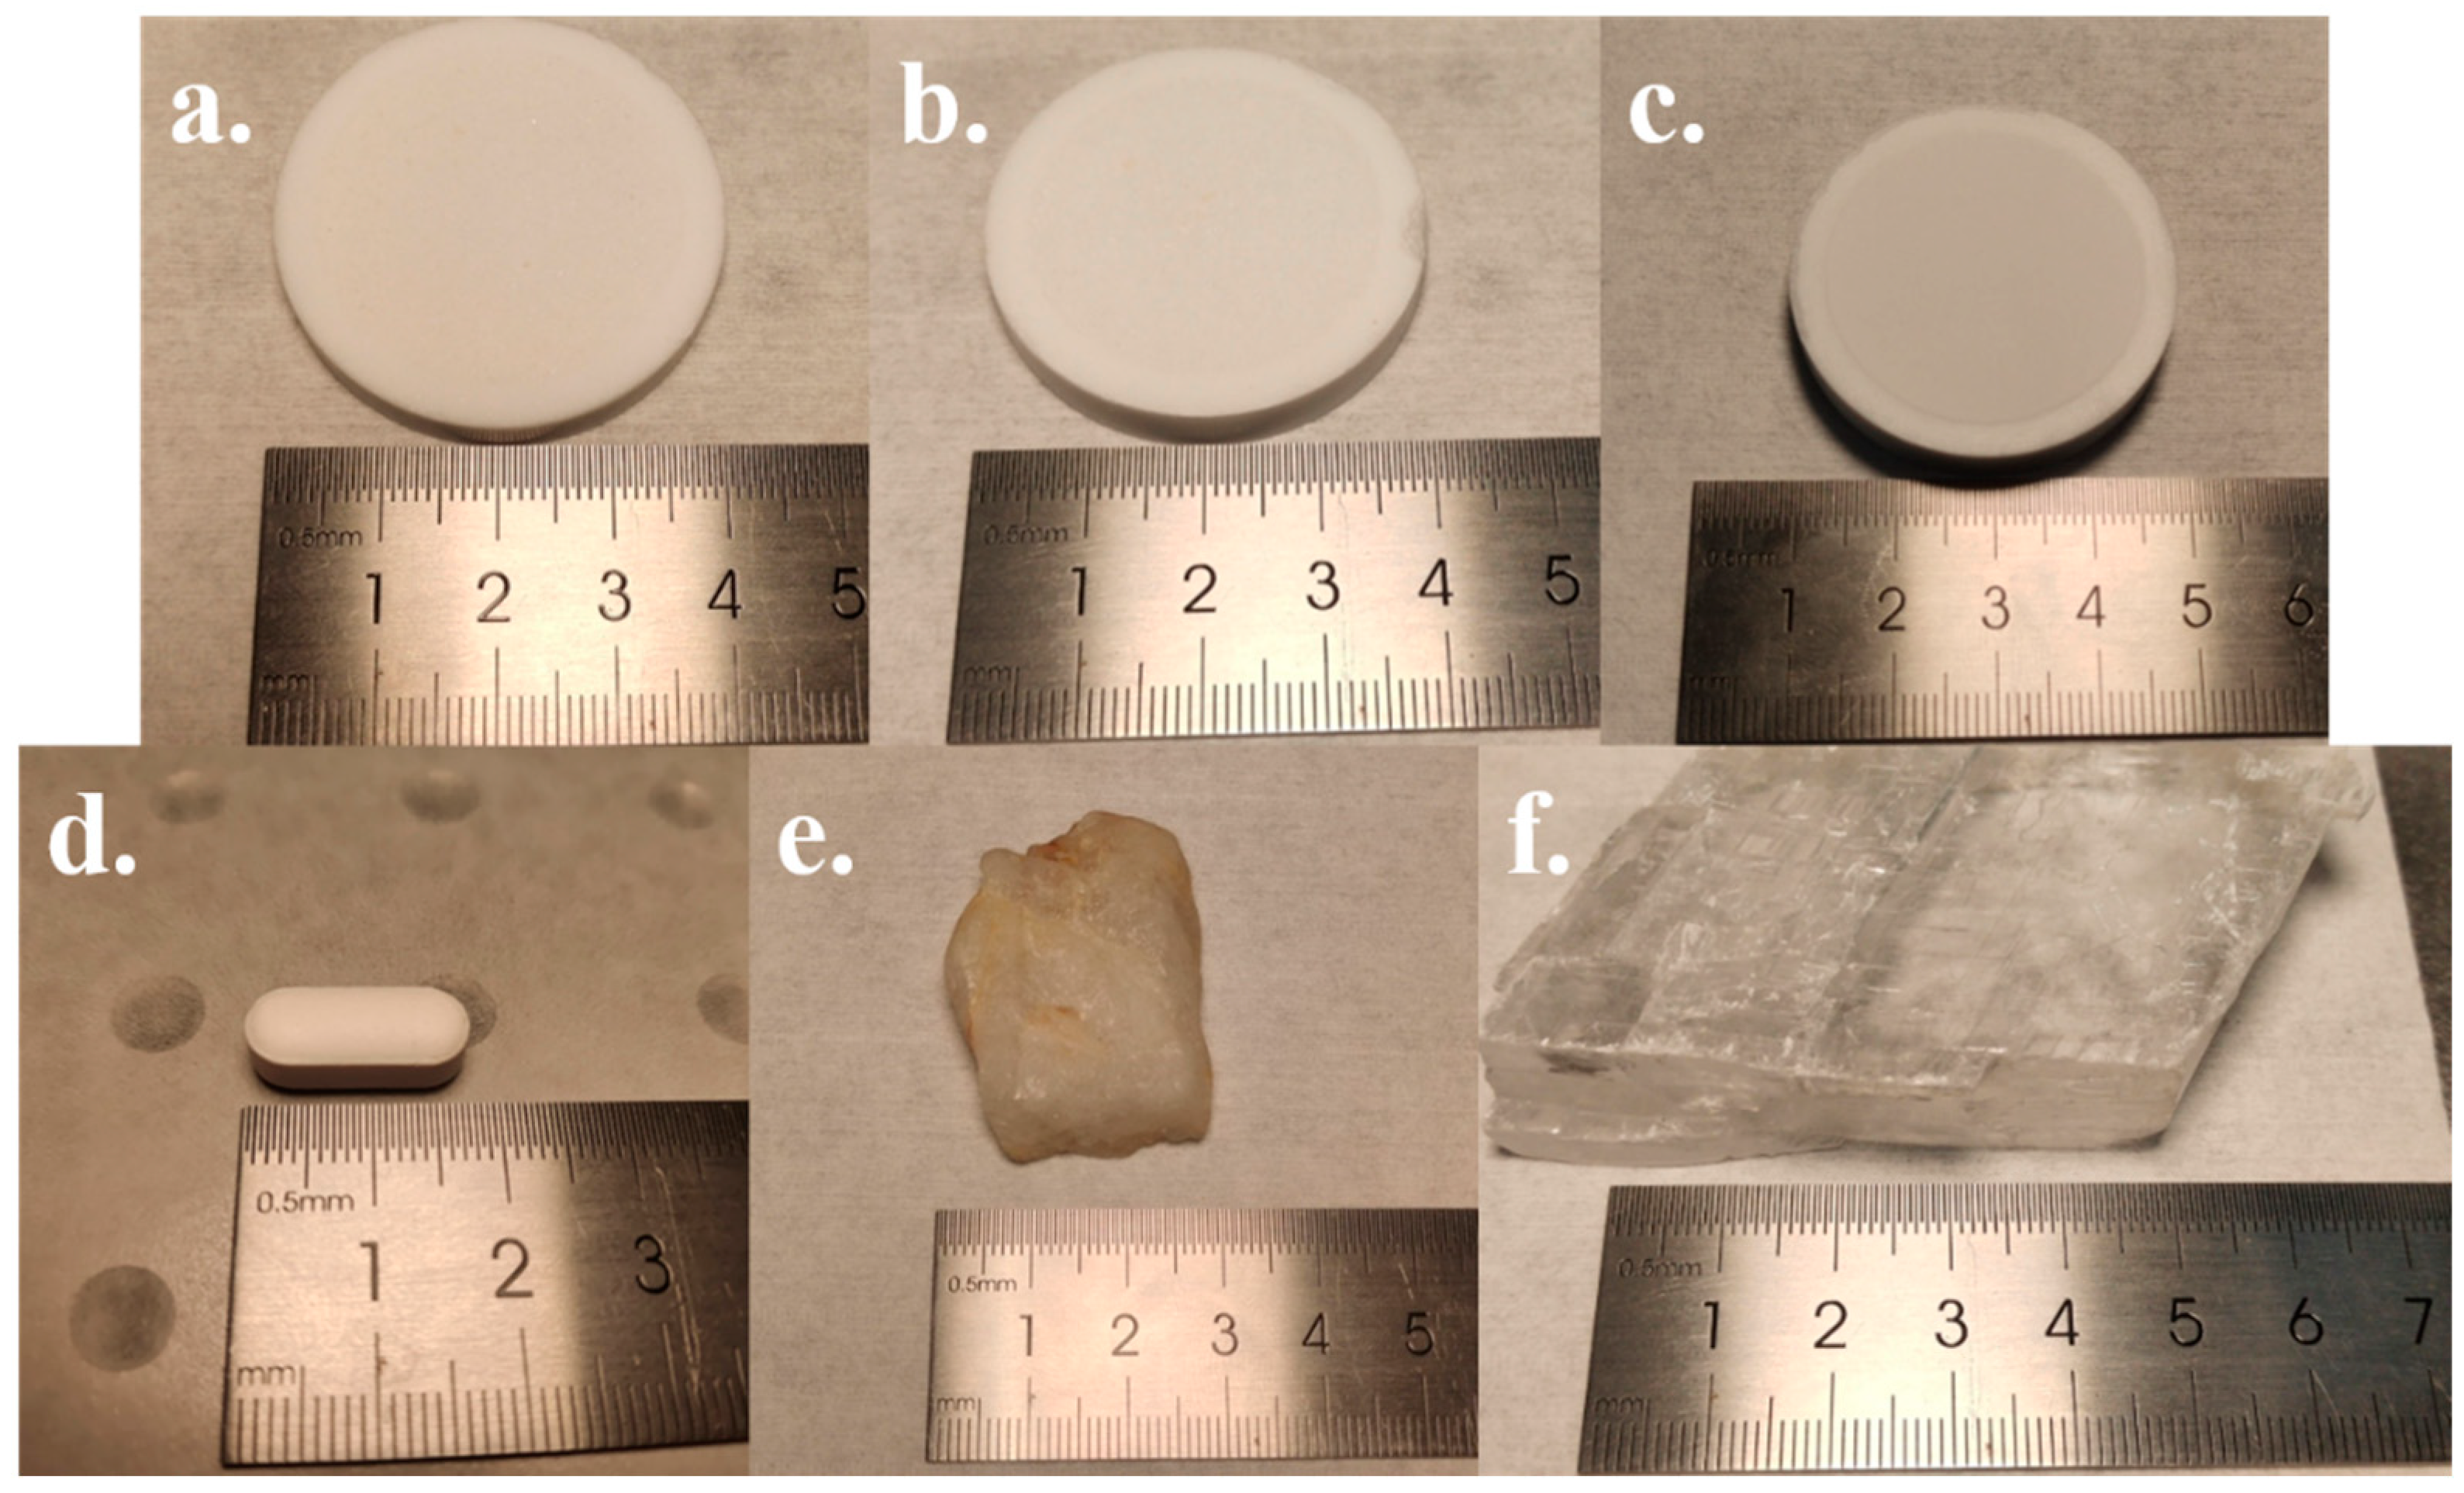
We selected several target samples (
Figure 4), include three minerals and three organics, to evaluate the performance of this auto-focusing method. The three minerals used were quartz, selenite, and natronite. The three organics used were glycine, benzoic acid, and paracetamol. The quartz sample was natural rock collected from Weihai, China, and the selenite sample was also natural rock, this time collected from Dali City, China. The three organic samples included two amino acids, glycine and benzoic acid, and a phenol, paracetamol. These amino acid and natronite samples were purchased from Aladdin Biochemical Technology Co., Ltd., Riverside, CA, USA, and their purity were both higher than 99.5%. The paracetamol sample consisted of pills, and each pill contained 0.3 g of paracetamol (the concentration was roughly 1 wt. %).
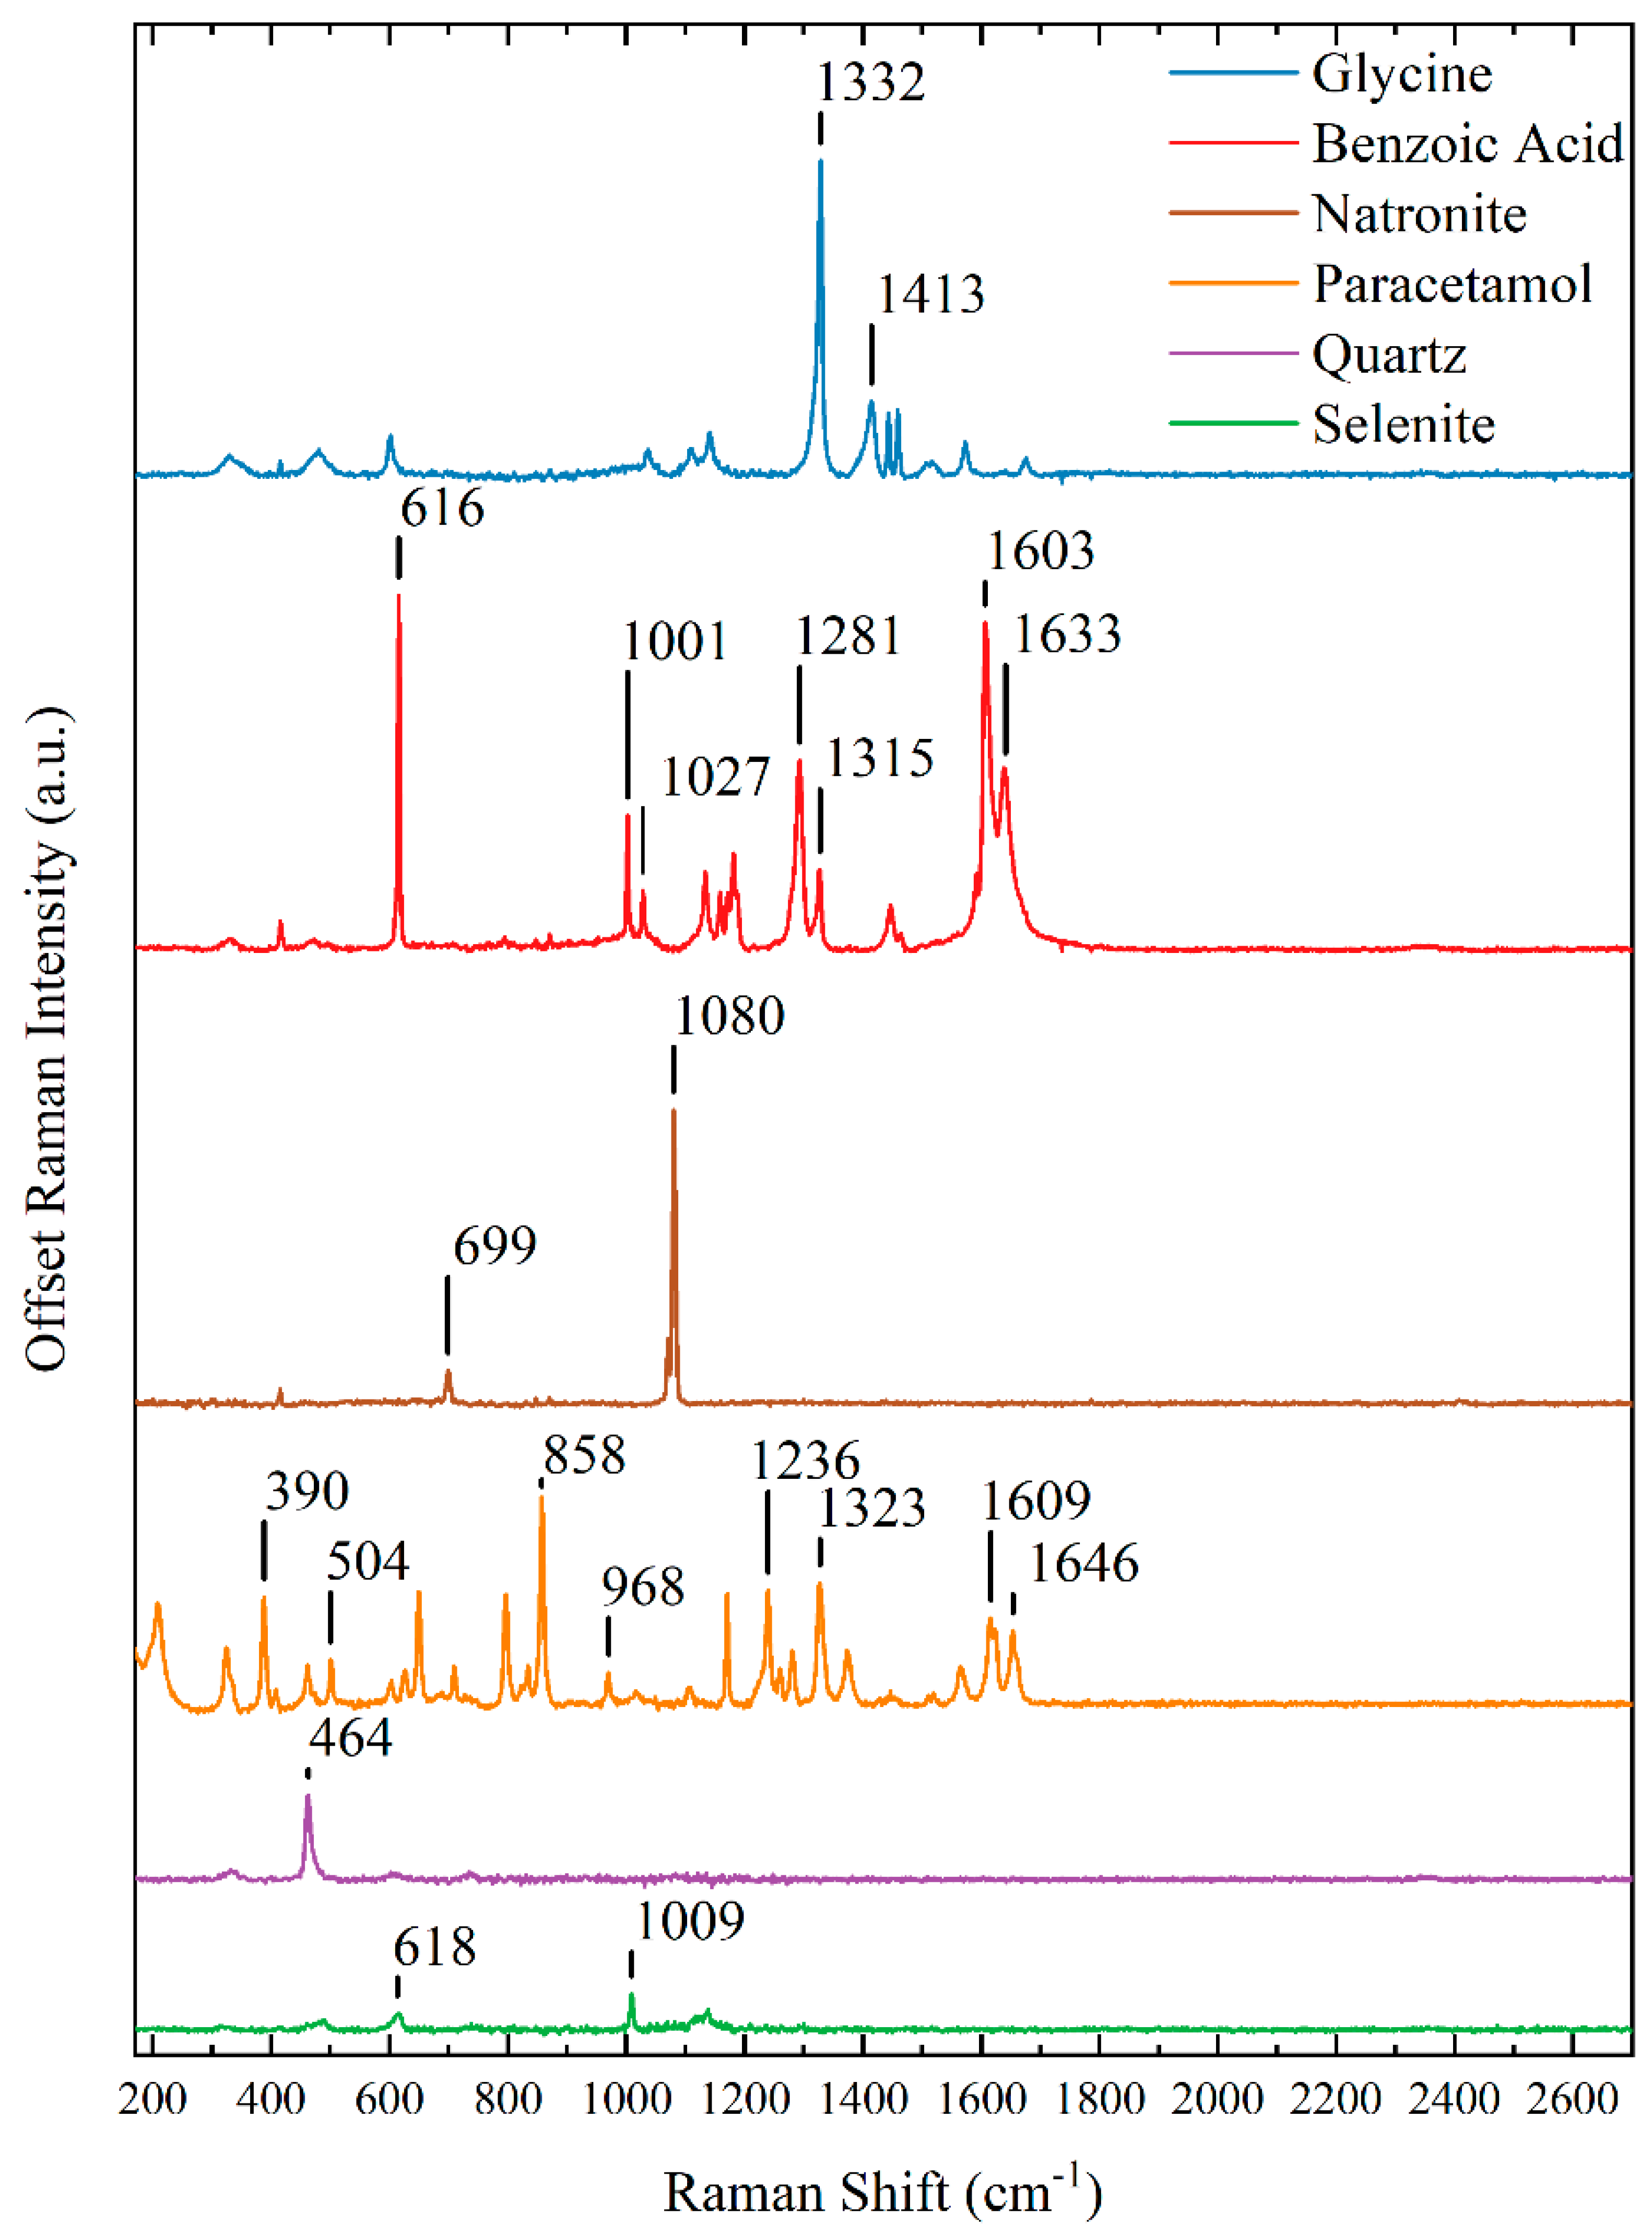
The spectra of the target materials acquired using the laboratory prototype are shown in
Figure 5. Glycine is the simplest amino acid and contains no asymmetric carbon atoms. In this work, the most intense scattering peak is, which was located at 1332 cm
−1, can be assigned to the twisting vibration of -CH
2, and the scattering peak at 1413 cm
−1 can be assigned to C=O symmetric stretching vibration [
26]. Benzoic acid is the simplest aromatic acid material. In the Raman scattering spectra of benzoic acid, the highest and most intense peak, located at 616 cm
−1, was attributed to the deformation of a phenyl-ring, and the peaks at 1001 cm
−1 and 1315 cm
−1 can be ascribed to the stretching of the phenyl-ring. The doublet peaks at 1603 cm
−1 and 1633 cm
−1 can be ascribed to aromatic C-C stretching and C=O stretching modes. The peak at 1027 cm
−1 corresponds to the stretching of C-OH [
27]. A sample of natronite was chosen to represent the mineral carbonate. The peak at 699 cm
−1 can be attributed to asymmetric movements in the plane of the CO
32− ion, and the peak at 1080 cm
−1 can be as attributed to symmetric breathing mode of the CO
32− ion [
28]. For paracetamol, the highest peak at 858 cm
−1 represents the ring breathing of a phenyl group, the peak at 504 cm
−1 represents the in-plane deformation modes of C=O in acetamido, the peak at 1609 cm
−1 represents the stretching of C=C, and the peak at 1646 cm
−1 represents the stretching of C=O. The 390 cm
−1 peak was attributed to a whole molecule wavy motion, the peak at 968 cm
−1 can be attributed to the deformation of the phenyl ring plus the stretching of the C-N amide bond, the peak at 1167 cm
−1 can be attributed to the bending of phenyl ring and C-OH groups, the peak at 1236 cm
−1 can be attributed to the deformation of phenyl ring plus amide and C-OH groups, and the peak at 1323 cm
−1 can be attributed to the deformation of a phenyl ring and a C-OH group [
29]. Due to the symmetric stretching of Si-O-Si, the Raman scattering spectra of quartz shows an intense peak at 464 cm
−1 [
30]. In this work, selenite was selected as a representative sulfate mineral. It is a specific phase of gypsum. The Raman scattering spectra of selenite are similar to those of gypsum, and the peak at 618 cm
−1 can be assigned as asymmetric bending vibration modes of the SO
42− tetrahedra, while and the strongest peak at 1009 cm
−1 corresponds to the symmetric stretch vibration mode of the SO
42− tetrahedra [
31].
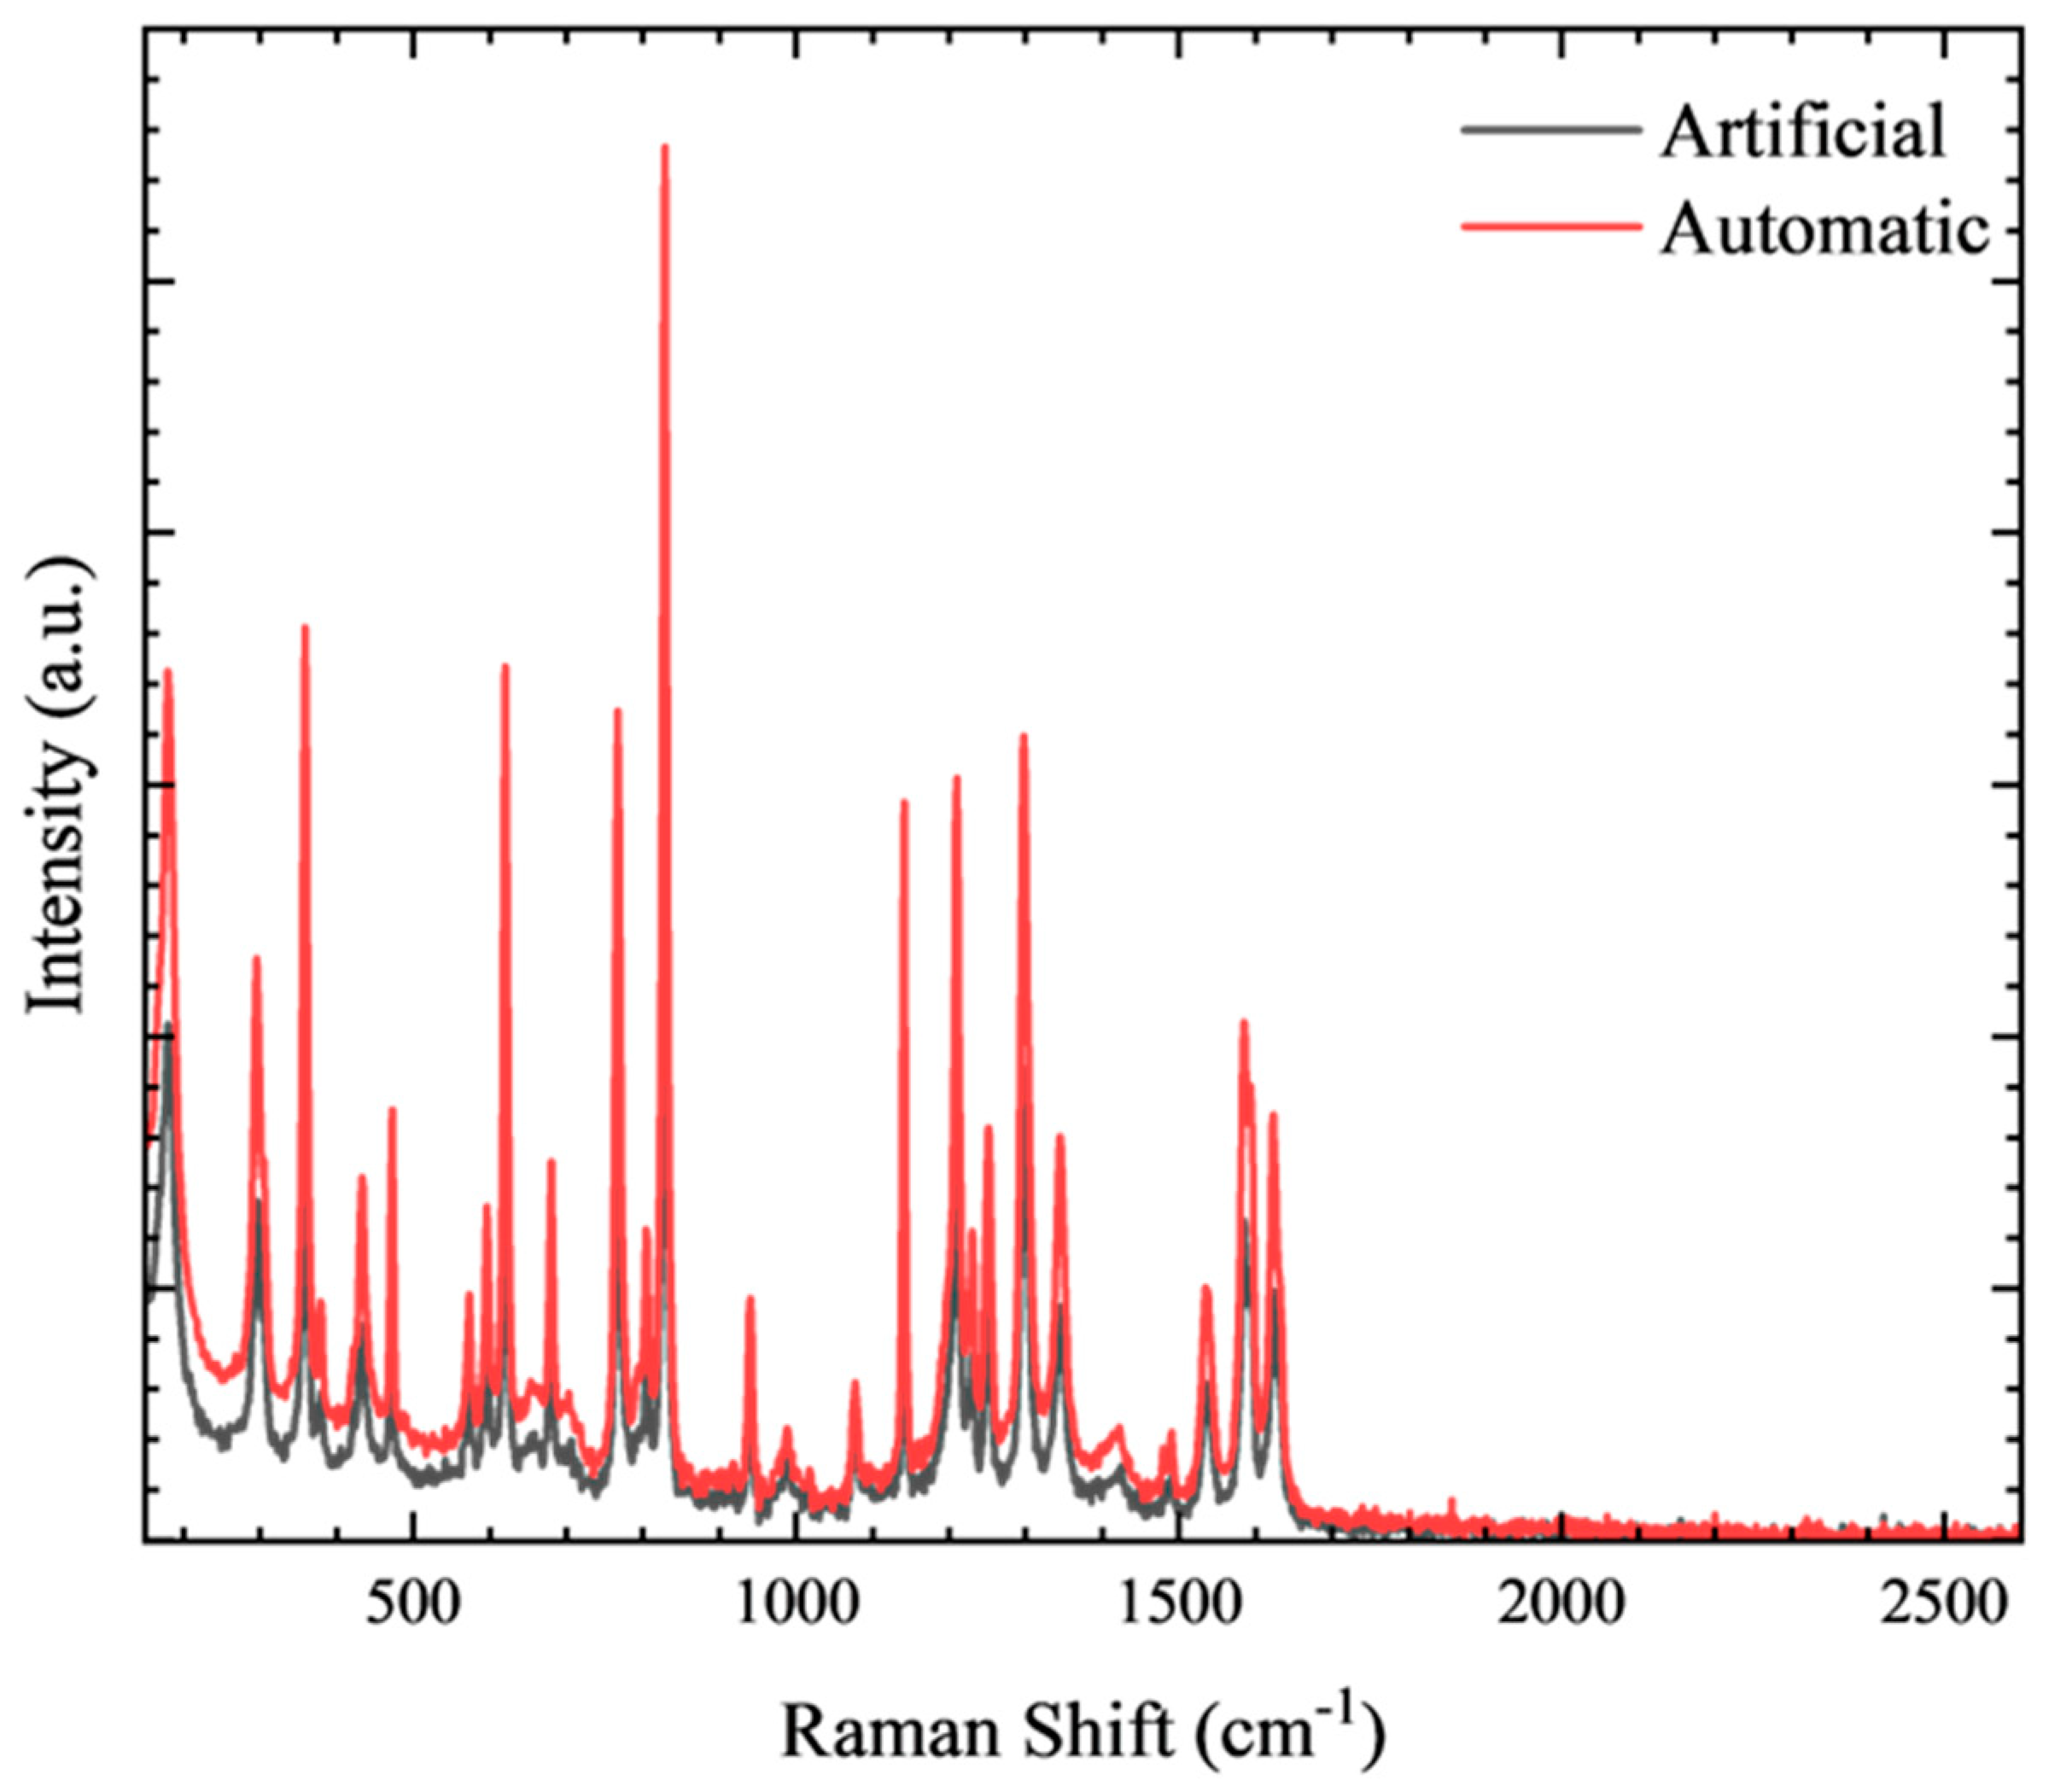
During the measurement of paracetamol, we utilized the aforementioned method to validify the advantage of automatic focusing compared to artificial focusing. The results show that our automatic focusing method is better than artificial focusing both in terms of the quality of spectra and focusing time. Moreover, automatic focusing can avoid artificial deviation when focusing on different samples. It can be easily gleaned from
Figure 6 that there is a great difference between the intensity of the spectra acquired automatically and artificially. To quantify this difference, we compared the SNRs of these two focusing methods. To calculate the SNR, the Raman peak was fitted using mixed Gaussian and Lorentzian function, and the intensity of the signal was taken to be the height of the function. The noise of the spectrum is accepted as the standard deviation of a flat section near the peak we calculate SNR [
32]. We calculate the SNR of the highest peak at 858 cm
−1, and since there were no Raman peaks, we selected the spectrum between 870 and 925 cm
−1 to evaluate the noise. Accordingly, the SNR of the paracetalmol sample that was focused automatically is 129.49, while the SNR of the spectrum focused artificially is 108.54. Namely, the SNR of the automatical focusing method is 42.24 dB, and the SNR of the artificial focusing method is 40.71 dB.
The reasons for the disparity between these focusing methods are as follows. In combination with the laser spots on the sample surface generated after the focusing procedure, we discovered that the spots generated after the automatic focusing procedure was applied (~190 μm) were slightly larger than the artificial ones (~120 μm). This was because the artificial focusing procedure consistently minimize the laser spot, indicating that the lens focused the laser well. However, this condition is not necessarily the best signal collection condition. Therefore, by optimizing this weak Raman scattering light, this automatic focusing method achieves good excitation and collection conditions at the same time. Under the combined effect of good excitation and collection, the intensity of the Raman spectra was significantly enhanced.
4. Discussion and Implications
This study solved the shortcomings emerging from the laser Raman spectroscopy system application. More importantly, the overall spectrometer performed well with the confocal imager and the matched beam splitting component removed, thereby reducing the complexity of the overall spectrometer. Through the implementation of a spectrum-based auto-focusing method and validation using a Raman spectrum acquisition system, we designed a Raman spectrometer which can focus automatically. After comparing between several FEFs and ESSs, the most efficient ones were elected and utilized in our weak-signal optimized method.
4.1. Performance of the FEF
When the focal plane coincides with the surface of the sample to be measured, an FEF shows an extreme value. In other words, the FEF extreme value point should correspond precisely to the focusing point. In this article, several FEFs based on spectral signals are compared. Full spectra integration with the continuum removed was applied as an FEF, revealing excellent robustness that can avoid infection of shot noise from CCD or cosmic rays from interplanetary space.
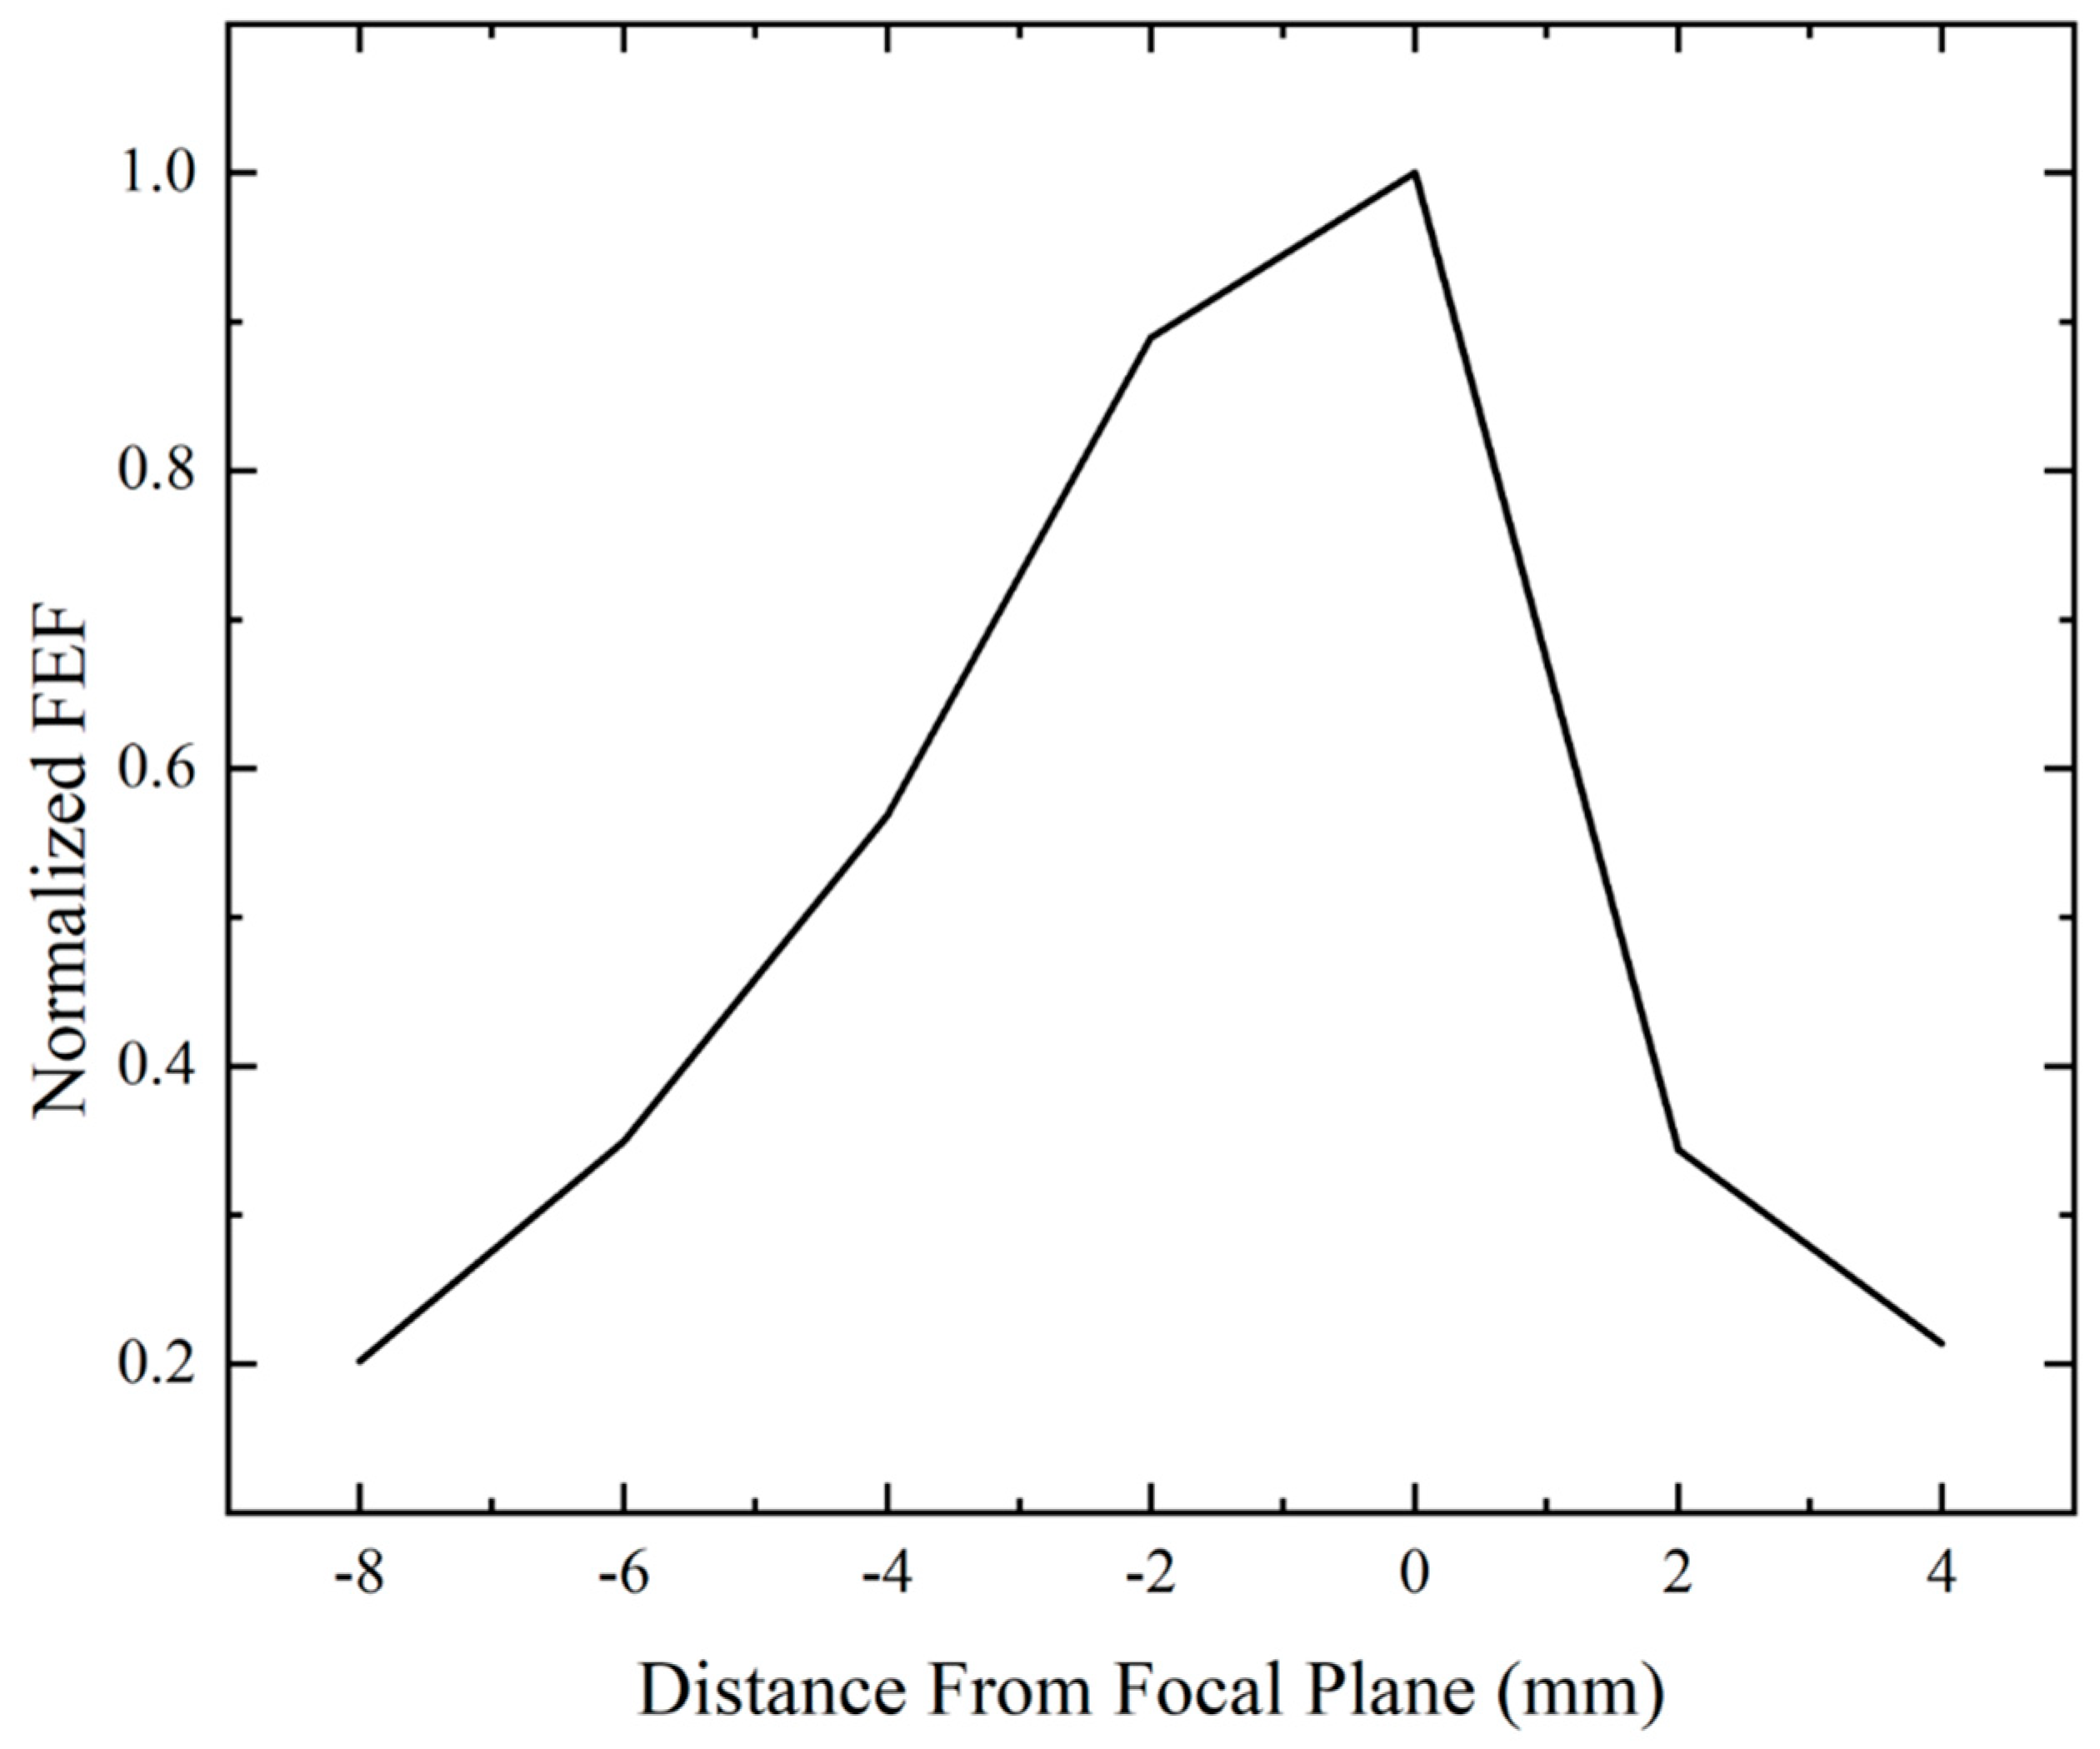
To visualize how the FEF varies with the distance from the focal plane, we performed multiple acquisitions on the paracetamol sample with a step of 2 mm. The variation trend of the FEF was calculated according to these spectra and are shown in
Figure 7. In this figure, the FEF shows asymmetry on each side of the focus. We suspect that although the light cone of a focused laser is symmetric on both sides of the focal point, the solid angles of the collecting light cone on each side of the focal plane are not symmetric. Therefore, the Raman scattering light collected into the lens is asymmetrical on each side of the focal plane, and the FEF falls sharply on the far side of the focal plane.
4.2. Performance of the ESS
The selection of an ESS is one of the critical factors governing for the focusing function’s ability to find the best focusing position. In the circumstance in which the performance of an FEF is indistinguishable, a better ESS can significantly improve the efficiency of the focusing procedure. The ESS in this article was a one-dimensional ESS with fewer calculations and high accuracy. Inspired by the extremum searching method of a unimodal function, we designed an ESS using trichotomy to narrow the focusing area and finally cause the focal plane to approach the sample surface. The trichotomy search strategy acquires Raman spectra as little as possible. The process of Raman spectrum characterization consumes vast amounts of time. Therefore, the corresponding focusing efficiency can be significantly improved by reducing the number of Raman spectrum acquisitions. Utilizing trichotomy as an ESS yields the following benefits.
The trichotomy search is simple in principle, fast in terms of operation, accurate in terms of its results, and robust in terms of applications.
The focusing precision can be adjusted to meet the requirements. For samples with intense Raman scattering light, the focusing precision can achieve a sub-millimeter level with the aid of a high-precision stepper motor.
In the focusing procedure, each acquisition takes up roughly 500–1000 ms of the Raman scattering efficiency for the target materials. In other words, spectra with identifiable peaks are sufficient for calculating FEFs in the focusing procedure, thereby significantly reducing the acquisition time in the focusing procedure. In this work, the automatic focusing procedure takes roughly 40 circulations to achieve a 0.2 mm accuracy. To sum up, by utilizing this weak-signal-based automatic focusing method, we can accomplish a 20 s focusing procedure for samples with a rather high Raman scattering cross section like organics, and a 40 s focusing procedure for samples with weak Raman scattering light like silicates.
4.3. Implications for Planetary Raman Applications
Because of their unique advantages in terms of the classification and identification of planetary materials, Raman spectroscopic instruments have been widely suggested to be used on Mars [
15,
16], the Moon [
33], and asteroid research [
18]. However, there are various difficulties in the application of Raman spectroscopic instruments in deep space exploration. Our auto-focusing method offers a possible solution to these difficulties.
Firstly, the offset between the focal plane of the spectrometer and the imaging system cannot be easily eliminated. In other words, when the image system is focused, there remains the possibility that the spectrometer system is not focused in the best position. To correct this offset error, an additional focus position calibration is required. The SuperCam team tested the offset between the focus of the telescope and the spectrometer at different distances and temperatures [
15]. After the imaging system is focused, the focus of a Raman spectrometer and other instruments can be estimated based on the focus of the telescope and the distance tested on the ground in similar environmental conditions. When using this focusing strategy, it is difficult to evaluate the focus conditions, thereby precluding the normalization of different spectra. Without normalization, the comparison of the peak intensities between different spectra is not viable. But in this method, we utilize criteria which correlate with the Raman spectra directly. Using these spectral criteria, this method allows for the focusing of the spectrometer instead, which may lead to better spectra and better robustness in planetary missions.
Secondly, in consideration of robustness, the instruments used for planetary surfaces explorations are often limited in terms of computational power. Compared to the personal computers available nowadays, the FPGA chip wildly using in exploration mission is much less powerful. For this reason, every algorithm should be simple enough to allow the FPGA to respond in time. In our method, the Focus Evaluation Function used “plus” only, constituting the easiest operation for computers. In other words, this method requires little computational power, making it more suitable for planetary surface explorations.
Last, but not least, this method offers a low redundancy design of Raman spectrometer in planetary exploration missions. In asteroid explorations, the lander or rover should be light enough to adapt to the micro-gravity environment on the asteroid surface. Therefore, the payload onboard the lander or rover should be lightweight and integrated. By utilizing this signal-based auto-focusing method, it is not necessary to integrate imaging functions into a Raman spectrometer or other weak-signal-detection instruments. In this way, the weight of Raman spectroscopic payload can be compressed, which is beneficial for the weight control of a lander or rover system.
Moreover, the focusing procedure can be faster in specific applications. For instance, if the relationship between motor steps and focal distances has been tested previously on the ground, the focusing procedure can take advantage of this curve and realize a more efficient auto-focusing method.


