Article

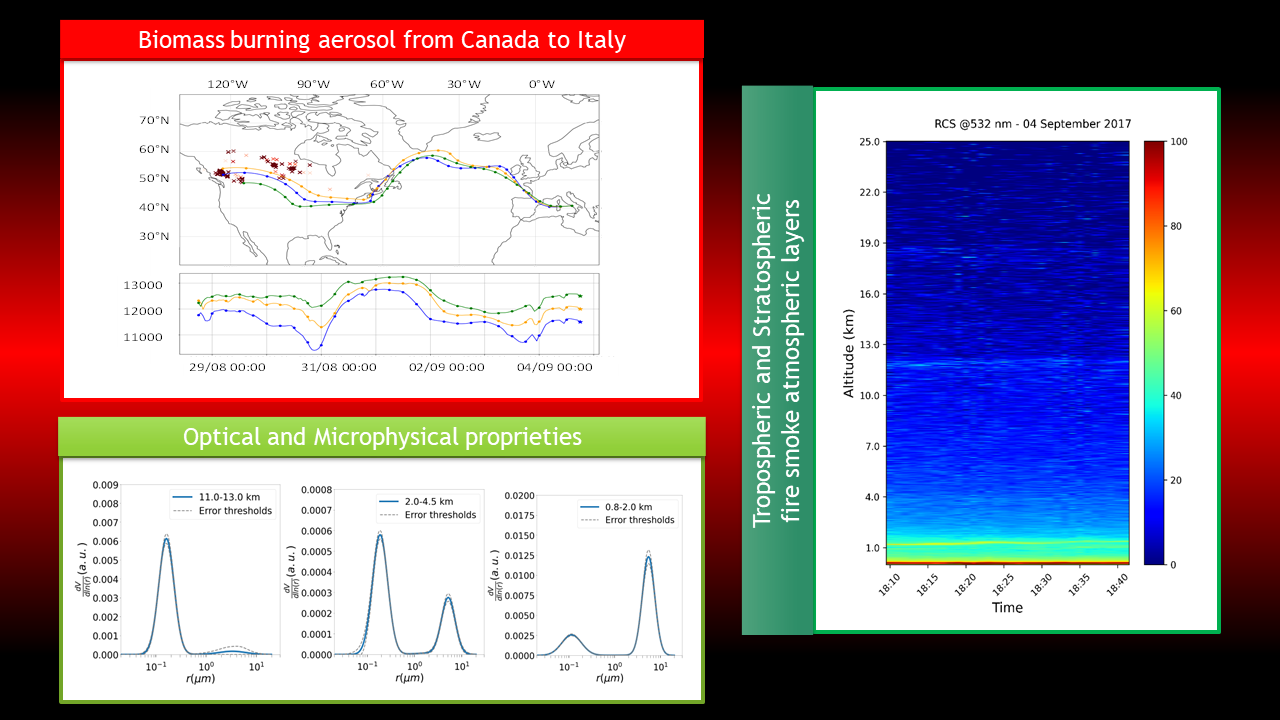
Lidar Optical and Microphysical Characterization of Tropospheric and Stratospheric Fire Smoke Layers Due to Canadian Wildfires Passing over Naples (Italy)

1
Dipartimento di Fisica “Ettore Pancini”, Università di Napoli Federico II, Complesso Universitario di Monte S. Angelo, Via Cintia, I-80126 Napoli, Italy
2
Consiglio Nazionale delle Ricerche, Istituto di Metodologie per l’Analisi Ambientale, C.da S. Loja, 85050 Tito Scalo, Potenza, Italy
*
Author to whom correspondence should be addressed.
Remote Sens. 2024, 16(3), 538; https://doi.org/10.3390/rs16030538
Submission received: 20 December 2023 / Revised: 26 January 2024 / Accepted: 29 January 2024 / Published: 31 January 2024
(This article belongs to the Special Issue Advances in Remote Sensing and Atmospheric Optics)

Abstract

:
In the summer of 2017, huge wildfires in the British Columbia region (Canada) led to the injection of a remarkably high concentration of biomass burning aerosol in the atmosphere. These aerosol masses reached the city of Naples, Italy, at the end of August 2017, where they were characterized by means of a multiwavelength lidar and a sun–sky–lunar photometer. Here we report on the optical and microphysical properties of this aerosol in an intriguing condition, occurring on 4 September 2017, which is characterized by an interesting multi-layered vertical distribution of the aerosol. The Lidar profiles highlighted the presence of four aerosol layers, with two located in the lower troposphere and the other two at stratospheric altitudes. A rather thorough characterization of the biomass burning aerosol was carried out. The aerosol depolarization ratio showed an increasing dependence on the altitude with averaged values of 2–4% for the tropospheric layers, which are indicative of almost spherical smoke particles, and larger values in the stratospheric layers, suggestive of aspheric particles. Lidar-derived size distributions were retrieved for the first three aerosol layers, highlighting a higher particle concentration in the fine-mode fraction for the layers observed at higher altitudes. A dominance of fine particles in the atmosphere (fine-mode fraction > 0.8) with low absorption properties (absorption AOD < 0.0025 and SSA > 0.97) was also observed over the whole atmospheric column by sun photometer data. The space-resolved results provided by the lidar data are consistent with the columnar features retrieved by the AERONET sun photometer, thus evidencing the reliability and capability of lidar characterization of atmospheric aerosol in a very interesting condition of multiple aerosol layers originating from Canadian fires overpassing the observation station.

Graphical Abstract

1. Introduction

Biomass burning aerosol mainly originates from wildfires and constitutes an important natural source of the atmospheric aerosol that influences the Earth’s radiation budget and affects atmospheric circulation and regional climate [1,2]. It is primarily composed of light-absorbing components, such as brown and black carbon, representing the main source of organic aerosol in the atmosphere [3]. Biomass burning aerosol plays an important role in the radiation budget because it influences the scattering or absorption of solar radiation and acts as cloud condensation nuclei or ice nuclei. Moreover, its radiative effect can be either direct or indirect [4]. The chemical and physical properties of biomass burning aerosol can vary during the transport in the atmosphere, as a consequence of both aging effects and mixing with aerosol originated by other sources, and significantly influence the impact of wildfires on climate changes and air quality [5]. The vertical transport of smoke particles through the tropopause remains hitherto unclear, and hence still under investigation; recent studies have reported observation or modeling analyses of smoke particle layers produced by late wildfire episodes in the lower stratosphere [6,7,8,9,10]. In this altitude range, the particles are confined for a long time and can reach areas located many kilometers away from their source region. During the transport, the particles influence the atmospheric circulation and interact with clouds, eventually reducing the precipitation rate [11]. Moreover, major fire events can even lead to stratospheric ozone depletion in the Arctic and Antarctic regions [12].
Lidars have been extensively used to study long-range smoke transport, as they can retrieve the vertical profile of their optical and microphysical properties. Lidar measurements are usually analyzed in synergy with data provided by other instruments, like sun photometers [13,14,15], spaceborne instruments [7,16], or nephelometers [17].
The year 2017 was marked by instances of intense fire activities in several areas of the world. Low precipitation, high temperatures, and dry soils favored the development of many wildfire events that led to a huge impact on both the economy and the environment. In particular, the summer of 2017 was one of the most intense fire seasons that caused unprecedented high temperatures across Europe. In this period, multiple wildfire events affected several Mediterranean countries (e.g., Spain, France, Italy, and Greece). In June and October 2017, two extreme events took place in Central Portugal [18,19] that caused not only the dire loss of vegetation on a large scale but also affected many human lives. Moreover, in July 2017 there was one of the most severe wildfires in Croatian history, mainly due to extremely high temperatures registered in this period [20]. Between 10 and 17 July 2017, a huge fire event occurred also on Mount Vesuvius (Italy). The area of the Vesuvius National Park was affected by intense fire activity that resulted in significant damage to the forest heritage. In the same period, fire activity also struck the area close to Astroni Natural WWF Reserve. This extraordinary event was studied by means of vertically resolved lidar measurements that allowed for characterizing fresh biomass burning aerosol near the source [21].
In the summer of 2017, huge wildfires in the British Columbia region (Canada) led to the injection of an unusually high concentration of biomass burning aerosol in the atmosphere, which was observed even over Europe in the following weeks. An uncommon load of smoke was released on 12 August 2017 in the troposphere and lower stratosphere over the western area, and during successive weeks it was transported by air flow all over the Northern Hemisphere, also reaching the tropics [22]. Its presence was detected by many European observation stations during the following weeks. In Leipzig on 22 August 2017, three lidars analyzed the optical and microphysical properties of two atmospheric smoke layers: one in the troposphere and one in the lower stratosphere; the former showed smaller and less depolarizing particles than the latter [23]. In Kosetice, Czech Republic, a smoke layer rising from 12 km to 16 km altitude was detected by a lidar from 20 to 23 August 2017 [6]. Ref. [7] reported on the observation of a smoke layer from the spaceborne CALIOP lidar and the ground-based lidars located at the Observatoire de Haute-Provence, in Southern France, whereas Ref. [9] characterized the smoke plume with simultaneous lidar and sun photometer observations in Lille and Palaiseau. Smoke layers were observed up to 20 km altitude and persisted in the atmosphere until the first months of 2018 [22,24].
Between 29 December 2019 and 4 January 2020, another noteworthy outbreak of pyrocumulonimbus, due to the Australian bushfire season, was observed in the Southern Hemisphere; it was dubbed the Black Summer due to the unprecedented intensity of the wildfires, which caused vast land damage [25]. The smoke particles arrived up to the lower stratosphere and the transportation event was observed by lidars located in Punta Arenas (Chile) and Río Grande (Argentina) [26,27].
Here we report on aged biomass burning aerosol, coming from North America during the summer of 2017, observed over the observation station of Naples, Italy. The aerosol optical and microphysical properties were characterized by exploiting both a multi-wavelength elastic/Raman lidar and a sun–sky–lunar photometer.

2. Materials and Methods

The Naples observation station for aerosol remote sensing is part of the ACTRIS research infrastructure (Aerosol, Clouds, and Trace Gases Research Infrastructure) [28].
As part of ACTRIS community, the instruments and algorithms have been quality assured through intercomparison experiments and several standard procedures; tools developed previously in the framework of the European Aerosol Research Lidar Network (EARLINET) are also available [29,30]. Tests for quality assurance are regularly performed and submitted to the Center of Aerosol Remote Sensing (CARS) of ACTRIS in order to monitor the lidar measurement quality and to make the data ACTRIS compliant.
The station is located in Southern Italy (40.838°N, 14.183°E, 118 m a.s.l.) and its position is a crossroad of aerosols coming from different sources: sea spray aerosol from the Mediterranean Basin, urban and continental aerosol from Central Europe, and Saharan dust from Northern Africa. Long-range transported particles can also be observed, like aged biomass burning aerosol coming from Canada and North American regions during intense forest fire events. Measurements are routinely carried out with both passive and active ground-based remote sensing instruments. Here, we will illustrate and discuss data registered by the lidar and sun–sky–lunar photometer of the observational station described hereafter.

2.1. MALIA Multi-Wavelength Lidar

A multiwavelength Raman/elastic lidar system, MALIA, is used for the aerosol optical and microphysical characterization. The system uses as transmitter an Nd:YAG laser source providing beams at fundamental (1064 nm), second (532 nm), and third harmonics (355 nm) at a repetition rate of 20 Hz. The receiver is a Newtonian telescope with a focal length of 120 cm and a diameter of 30 cm. The lidar can retrieve Raman signals from N2, at wavelengths of 386 nm and 607 nm, and from H2O, at 407 nm. Data are acquired with 1 min temporal resolution and 15 m spatial resolution. MALIA can retrieve the aerosol backscatter β(z) profile at three different wavelengths (355 nm, 532 nm, and 1064 nm) and the aerosol extinction profile α(z) at two different wavelengths (355 nm and 532 nm), fulfilling the minimum requirements (3β + 2α) for the application of data inversion algorithms retrieving aerosol microphysical properties like refractive index and volume particle size distribution; in the present study, an inversion algorithm based on a Bayesian model run with Monte Carlo simulations was used [31,32]. The Klett–Fernald method [33,34] was exploited in order to obtain β(z) from elastic diurnal measurements, whereas the Raman method [35] was used for nocturnal measurements. The retrieval algorithms for aerosol optical properties comply with the EARLINET quality assurance program detailed in Refs. [36,37]. With the Raman method, α(z) and β(z) are retrieved independently and the lidar ratio L R = α ( z ) / β ( z ) can be estimated without any assumption. β(z) and α(z) profiles are retrieved with a final spatial vertical resolution of 60 m and 180 m, respectively, and a temporal resolution of 30 min. Errors in the retrieved parameters are evaluated using a Monte Carlo method that reproduces uncertainties in the β(z) and α(z) final values in the range of 5–30% and 10–50%, respectively, at nighttime. MALIA can also perform depolarization measurements at 532 nm wavelength, obtaining the aerosol depolarization ratio δ(z) from the lidar echo signals registered at the same and crossed polarizations with respect to the transmitted linearly polarized laser beam. Calibrated δ(z) profiles are obtained using the inversion procedure described in Refs. [38,39]. LR and δ can be used for aerosol typing since both parameters depend on specific aerosol properties such as size, shape, and refractive index. Finally, the backscattering Ångström exponent BAE (or color ratio) and extinction Ångstrom exponent EAE can also be retrieved using the relationships:
B A E = log β λ 1 β λ 2 log λ 1 λ 2   ;   E A E = log α λ 1 α λ 2 log λ 1 λ 2
where λ 1 = 355 nm and λ 2 = 532 nm. Both these are intensive parameters that can provide useful information for aerosol properties classification. In particular, they are closely related to aerosol size: higher values of the Ångström exponents are associated with a prevalence of particles with a smaller size [40]. Moreover, the combination of LR, depolarization ratio, and Angstrom exponents can allow gaining more data for a reliable typing of the aerosol [41].

2.2. AERONET Sun Photometer

Columnar aerosol measurements were carried out, simultaneously with lidar measurements, using a CIMEL CE318T [42], AERONET (Aerosol Robotic Network) [43,44] sun–sky–lunar photometer. The photometer collects daily radiance data at eight different wavelengths (340, 380, 440, 500, 675, 870, 1020, and 1640 nm) that through the inversion with AERONET algorithms [45,46] allow for retrieving many optical and microphysical aerosol properties, like aerosol optical depth (AOD), Angstrom exponent (αAE), volume particle size distribution, single scattering albedo (SSA), asymmetry factor, absorption AOD, and real and imaginary parts of the refractive index. The temporal variation and wavelength dependence of these parameters can provide information on the columnar properties of aerosol and its evolution during the day. AOD is linked to the aerosol load in the atmospheric column and is related to aerosol extinction. AOD values larger than 1 are representative of polluted atmospheric conditions, whereas AOD values less than 1 stand for clean atmosphere. The αAE parameter depends on the aerosol size and results larger than 1 when fine particles (e.g., black carbon or sulfate particles) are dominant; conversely, smaller αAE values are indicative of aerosol with larger dimensions, corresponding mainly to coarse components (e.g., mineral dust or sea salt aerosol) [47]. In this study, αAE for the 440/870 nm wavelengths combination is used to gather information on the aerosol size [40]. The SSA is the ratio of the scattering process to the total (scattering and absorption) extinction, and it is a key parameter in aerosol radiative forcing study; higher SSA values close to 1 are linked to more scattering aerosols (e.g., sulfate and nitrate), whereas values lower than 0.5 are indicative of more absorbing particles (e.g., black carbon, mineral dust, and brown carbon) [48,49]. Particle size information is also given by the aerosol size distribution and the wavelength dependence of the asymmetry factor. The latter is an important factor for assessing the aerosol radiative forcing. The absorption AOD considers only the absorption part of the total AOD. Together with the imaginary part of the refractive index and the SSA, it is important to study the absorption properties of the particles over the atmospheric column.
AERONET-derived AOD has an estimated error of about 0.02 at 440 nm, as reported by Ref. [50]; meanwhile, αAE has an error of about 0.25 at the wavelengths of 440 and 870 nm for AOD larger than 0.1 [51]. Accurate error description for the inversion products is reported in Ref. [52]. Diurnal AOD and Ångström exponent level 2.0 quality-controlled AERONET data are analyzed in this work, whereas only level 1.5 cloud-screened are available for lunar data and inversion products. Data are available in open access on https://aeronet.gsfc.nasa.gov (last visited on 16 December 2023).

2.3. Fire Aerosol Identification

The HYSPLIT (HYbrid Single-Particle Lagrangian Integrated Trajectory) model, developed by the U.S. National Atmospheric and Oceanic Administration (NOAA) Air Resources Laboratory (ARL) [53], is a well-established tool for the identification of aerosol source location. It can estimate the aerosol’s back trajectory for the days before its arrival at the station of interest using a hybrid Eulerian and Lagrangian mathematical approach. The model was used to calculate back trajectories up to 20 days from the date of interest and in a wide range of heights, locating the aerosol origin and the possible presence of other aerosol sources. This analysis allows us to identify the different aerosol components that arrive over the observational station in a mixed state.
HYSPLIT model was used in synergy with the NASA Fire Information for Resource Management System (FIRMS) [54], developed in 2007 by the University of Maryland, for the identification of aged biomass burning aerosol that arrives over the observational station. It provides near real-time fire data, derived from MODIS AQUA/TERRA and VIIRS instruments that are on board satellites, on a global scale. Data are available in open access on https://firms.modaps.eosdis.nasa.gov/ website (accessed on 16 December 2023).
In this study, the FIRMS model was used to identify fire events during August 2017 for the Canadian region. Data were crossed with HYSPLIT back trajectories to show the prevalent biomass burning composition of the aerosol layers arriving at the Naples observation station on 4 September 2017.

3. Results

During August 2017, intense fires developed in the British Columbia region (Canada), leading to the injection of an unusually high concentration of biomass burning aerosol in the atmosphere. Large amounts of fire smoke were lifted to the tropopause, even reaching the lower stratosphere. The lifting of these particles to the high troposphere was very fast due to the high radiative power of the wildfire event, preventing mixing with other aerosol or atmospheric constituents and leading to the peculiar compositional and shape properties observed for this event [23]. In the following weeks, higher altitude layers of this aerosol were transported by winds from the source site throughout Europe, where they were observed in many locations and with different methodologies.
A first signature of a stratospheric aerosol layer was observed over the Naples station, on 31 August 2017. This aerosol layer is clearly addressed in the map of the range corrected lidar signals (RCS) registered at 532 nm reported in Figure 1a and extends over an altitude range going from 18.2 to 19.4 km. In the same figure, a clear signature of cirrus clouds is present at about 10–11 km of altitude. Unfortunately, it was not possible to characterize this aerosol layer at 355 nm and 1064 nm, due to the lower signal-to-noise ratio achieved for these two wavelengths at such a high altitude. Aerosol depolarization ratio at 532 nm was (16.7 ± 5.5)%; such a value, which is rather unusual for inter-continental transported fire smoke particles, is in agreement with the observations described in other works reporting measurements carried out in the stratosphere over Europe [6,7,8,9].
The aerosol wildfire transport episode continued in the successive period, and a very interesting situation was registered on 4 September 2017, as displayed in Figure 1b. The map of Figure 1b evidences the presence of various aerosol layers at different altitudes in the atmosphere over the station. In addition to the persistence of a smoke aerosol layer at about 19 km, already addressed on 31 August 2017 in Figure 1a, it is possible to recognize three other weak layers: the first extends from 11 to 13 km, the second is in the lower troposphere at an altitude between 2 and 4.5 km, and the third below 2 km. A thorough characterization of these smoke aerosol layers can be carried out for the data reported in the map of Figure 1b since Raman measurements are also available in addition to the elastic ones. Hereafter, we will focus on this last observation with the aim of characterizing the features of these various aerosol layers.
Figure 2 illustrates the back trajectories of the air masses that arrived over the measurement area on 4 September 2017 at the different altitude levels of interest for the three layers identified above. The HYSPLIT model clearly identifies Canada as the common origin of the observed layers; the symbols in the three panels of Figure 2 show FIRMS maps highlighting the locations of wildfires over the area of interest, which was severely damaged by their intense activity during the August of 2017.
The fire locations reported in the three maps of Figure 2 correspond to those observed in the days at which the back trajectories, eventually ending over the observation station on 4 September 2017 at 18:00 UTC, passed over Canada. This analysis confirms that all three layers observed by MALIA came from Canada and, therefore, are expected to present an important biomass burning component.
With the aim of characterizing the aerosol properties in each layer, we analyzed the lidar profiles measured at three wavelengths in terms of aerosol backscattering (β), aerosol extinction (α), and depolarization ratio (δ). Thirty-minute time-integrated lidar profiles (from 18:10 to 18:40 UTC) are reported in Figure 3.
In the left panel of Figure 3, only the profile at 532 nm reaches an altitude of up to 19 km due to the higher signal-to-noise ratio at these heights for such a wavelength, whereas the maximum level for the signals at 355 nm and 1064 nm is around 12–13 km. From the backscatter profiles in the left panel, the layers already identified in the false color map of the RCS signal in Figure 1b are clearly discernible. The backscatter and extinction profiles (left and right panels of Figure 3) allow estimating the average values of the lidar ratio (LR) for the layers located in the troposphere (range R1 and R2) and low stratosphere (range R3), respectively, for both 355 nm and 532 nm. For the tropospheric layers we estimate LRR1355 = (32 ± 10) and LRR1532 = (82 ± 17), LRR2355 = (20 ± 17) and LRR2532 = (32 ± 9), whereas for the stratospheric one the values are LRR3355 = (62 ± 16) and LRR3532 = (82 ± 47). The measured LR is in the range of values reported in the literature for biomass burning aerosols [23]; the lower LR values in the range R2 could be indicative of less absorbing particles in this layer [8]. The average aerosol depolarization ratios at 532 nm (central panel of Figure 3) for the layers located at R1, R2, and R3 are δR1 = (3.9 ± 0.3)%, δR2 = (2.5 ± 0.3)%, and δR3 = (6.6 ± 1.8)%, respectively; such values are suggestive of almost spherical smoke particles. In the range R4 (17.0–19.0 km), a higher value of δR4 = (29.8 ± 7.6)% was measured, which agrees with those reported in previous works that investigated the summer 2017 inter-continental transport of smoke particles from Canada to Europe [6,8,9], addressing the higher value mainly to different transport ways and relative humidity conditions that lead to different aging processes.
Mean values of β(z) and α(z) measured at 355 nm and 532 nm in the observed layers were used to retrieve the backscatter-related Ångström (BAE) and extinction-related Ångstrom (EAE) exponents, as well as the average values of the linear depolarization ratio (δ) and lidar ratio (LR). The estimated values of these lidar-derived aerosol parameters are summarized in Table 1. The values of BAE range from (1.1 ± 0.7) to (4.4 ± 4.9) and EAE varies from −(1.0 ± 0.5) to (2.9 ± 4.0), in agreement with those reported in earlier works characterizing the properties of the biomass burning aerosol layers observed in Europe. Ref. [55] analyzed the transport of biomass burning aerosol over Thessaloniki from regions with intense fire activity, reporting BAE values in the range of 0.5–2.4. Moreover, in a recent study of Ref. [56] related to long-term lidar observations of biomass burning aerosol over Warsaw, the EAE values range from −0.8 to 2.8, depending on the air mass origin, the lowest values corresponding to aged smoke particles. In the same study, the BAE values range from 1 to 2.7. In the present case, the retrieved values of BAE and EAE increase with altitude, although affected by a larger uncertainty for higher altitudes. This may indicate that the smoke particles in the ranges R1 and R2 have larger dimensions compared to those in the R3 range. Conversely, Ref. [23] in their study on Western Canadian wildfire smoke observed in Leibniz measured higher values in the troposphere than in the stratosphere, which is suggestive of larger particles in the stratosphere probably related to different aging processes.
Mean values of β(z) and α(z) measured at different wavelengths were also used to retrieve vertically resolved volume particle size distributions (VPSDs) [57]. The size distribution averaged over all the measured atmospheric columns obtained from the lidar data is reported in Figure 4a. The blue solid line refers to the mean value, whereas the two grey dotted curves define the error thresholds, corresponding to the minimum and maximum retrieved values. The lidar-derived size distribution, obtained from the profiles measured at about 18:00 UTC and discussed above, shows a bimodal shape with two peaks, whose mode radius values lie at about 0.20 µm and 3.46 µm. The lidar-derived size distribution results in fairly good agreement with the columnar particle size distribution provided by the AERONET sun photometer data reported in Figure 4b. In particular, for the AERONET size distribution measured at the time closest to the lidar observations, i.e., 14:42 UTC, the peak mode radius values sit at about 0.15 µm and 3.86 µm, respectively. The differences between the mode radii of the two distributions are likely due to the different measurement time intervals. We want to point out that the higher peak at 05:56:57 (blue line) corresponding to fine-mode aerosol does not depend on the observed layering that appears in the lidar profiles during the afternoon; moreover, the retrieved columnar parameters (see the following Figures) showed, at this time, different values that can be ascribed to more absorbing particles originating from local anthropogenic emissions.
The overall consistency of the columnar size distributions derived from lidar and sun photometer data demonstrates the reliability of the lidar inversion algorithm, thus encouraging the gaining of further insights into the features of the three aerosol layers recognized in the map in Figure 1b. In this respect, it is worth recalling that the size distribution derived from sun photometer data is not vertically resolved; therefore, the possibility of gaining space-resolved size distribution offered by lidar is a unique and complementary source of information to characterize complex aerosol multi-layered conditions, such as those that occurred on 4 September 2017.
The lidar-derived size distributions for the ranges R1, R2, and R3 are reported in Figure 5. All three size distributions are bimodal, similar to the columnar one discussed above (Figure 4). However, some interesting differences can be distinguished. For the higher layers at ranges R2 and R3, a larger concentration of fine particles is observed, whose peak mode radius is about 0.2 µm in both cases; the second, less populated fraction of particles is characterized by a peak mode radius of 5.2 µm and 3.5 µm, respectively, for the ranges R2 and R3. A different situation is, instead, observed for the layer located at the range R1, i.e., below 2 km of altitude. For such a layer, the size distribution evidences a predominance of particles in the coarse mode fraction, with a peak radius of about 5.5 µm. The comparison between the three size distributions in Figure 5 shows that the relative fraction of the fine-mode particles progressively increases with the altitude. The larger fraction of coarse particles observed in the lower troposphere can be rationalized as mainly due to deposition phenomena towards the ground.
It is worth noticing that the predominance of the fine-mode particles in the atmosphere revealed by the lidar data from 18:10 to 18:40 UTC agrees with the columnar aerosol properties derived by the sun photometer. In fact, as shown in Figure 6, AERONET data evidence a progressive increase in the fine-mode aerosol fraction in the atmospheric column since 14:00 UTC and an even larger dominance of the small particles (fine-mode fraction > 0.8) after 16:00 UTC, in agreement with the lidar observations.
Further information on the aerosol features can be gained by resorting to the columnar parameters provided by the sun photometer. The columnar AOD440 and α440/870 measured by diurnal and nocturnal sun photometer observations show AOD440 and α440/870 values larger than 0.1 and 1.3, respectively, namely in the afternoon. This observation, in turn, suggests a higher content of fine particles in the atmospheric column, in agreement with the analyses reported above. In addition, as asserted by Ref. [58], the observed value of α440/870 can be considered representative of pure brown carbon or black carbon cores coated in non-absorbing matter.
The dominance of fine particles in the atmospheric column is further supported by the spectral dependence of the asymmetry factor reported in Figure 7a, which shows a decreasing trend with the wavelength in the afternoon that can be ascribed to a more efficient scattering at lower wavelengths typical of the fine aerosol. The observed values of the asymmetry factor below 0.7 at 440 nm agree with those reported in the literature for biomass burning aerosol; for example, Ref. [8] registered a mean value of 0.7 at 440 nm for aged smoke plumes observed in the Iberian Peninsula on 7 and 8 September 2017. Figure 7b,c also show SSA and AOD absorption evidencing large values of the SSA (>0.97) and low AOD absorption (<0.0025) at 440 nm. These values are coherent with the results obtained in previous studies related to biomass burning aerosol, which reported SSA values in the range of 0.91–0.99. For example, Ref. [59] estimated an average SSA at 440 nm ranging from 0.95 to 0.97 for smoke aerosol, with slightly larger values for more aged plumes. Moreover, studies on the biomass burning aerosol observed in Europe and originating from North America [8,60,61] attributed these values mainly to the transformation of the biomass burning aerosol and its mixing with non-absorbing aerosol species during their transport. Ref. [8] asserted that the low absorption (SSA > 0.98) of the smoke particles observed over the Iberian Peninsula on 7 and 8 September 2017 might result from smoldering combustion at the source, which gives rise to aerosol whose absorption properties are lower than those generated during a flaming phase.
The high SSA values discussed above are associated with small values of the imaginary part of the refractive index, as shown in Figure 8, which since 13:32 UTC lowers to less than 0.001, suggesting a low black carbon fraction in the smoke particles probably due to a predominance of smoldering combustion [62]. The spectral dependence of the imaginary part of the refractive index shows a somewhat decreasing trend with the wavelength, possibly due to the absorption by organic carbon [63]. The real part of the refractive index in the afternoon in Figure 8 levels at a value of about 1.60 independent of the wavelength, whereas in the morning hours vary between 1.4 and 1.6. These values are consistent with those reported in the literature; for example, Ref. [64] observed values in the range 1.54–1.69 at 475 nm, with an average of (1.635 ± 0.056) for the low black carbon fires, Ref. [65] measured values in the range 1.47–1.64 for biomass burning organic aerosol, showing that its variations could depend on the combustion efficiency. Moreover, values of the real part of the refractive index varying from 1.47 to 1.58 were also reported by Ref. [52] for biomass burning aerosol.

4. Conclusions

Biomass burning aerosol is a natural source of atmospheric aerosol with an important influence on the climate and Earth’s radiation budget. In the boreal hemisphere, the summer of the year 2017 was a period of intense fire activities and biomass burning aerosol spreading by air mass ensued the extensive wildfires that occurred in different regions. A remarkable example is provided by the extensive wildfires that occurred in the British Columbia region (Canada), whose wildfires generated aerosol that reached Europe where they were characterized by different approaches.
The biomass burning aerosol arriving over Naples, Italy, from North America in the aftermath of the British Columbia wildfires of the summer of 2017 were characterized in terms of their optical and microphysical properties with both a multi-wavelength elastic/Raman lidar of the ACTRIS research infrastructure and an AERONET sun–sky–lunar photometer. We selected, as a case study, the peculiar condition that occurred on 4 September 2017, which showed the presence of four aerosol layers in the lidar profiles: two layers were located in the lower troposphere, namely below 2 km (R1) and in the range 2–4.5 km (R2), and the other two weak layers extended from 11 to 13 km (R3) and from 17 to 19 km (R4), respectively. This condition offers the chance to test the capability of the lidar observations in typifying the aerosol characteristics at different altitudes, complementing the columnar data provided by the photometer. The lidar measurements provided mean LR values at 355 nm and 532 nm in the first three layers equal to (32 ± 10) and (82 ± 17) for the R1 tropospheric layer, (20 ± 17) and (32 ± 9) for the R2 tropospheric layer, and (62 ± 16) and (82 ± 47) for the lower stratospheric layer R3, respectively. The aerosol depolarization ratio showed an increasing dependence on the altitude with averaged values of (3.9 ± 0.3)%, (2.5 ± 0.3)%, (5.5 ± 0.5)%, and (29.8 ± 7.6)% for the different layers located at progressively larger heights. These observations are indicative of almost spherical smoke particles at the lower altitudes and aspheric particles at the highest range, probably because of aging processes, and assess the capability of discerning a variation in the aerosol features with the quote induced by the processes that occurred during the air mass transport.
The multi-wavelength capabilities of the lidar system also allowed for retrieving the volume particle size distributions for the first three aerosol layers. Our findings highlight that the particles observed in the troposphere have a slightly larger dimension than those present at higher altitudes, mainly due to deposition phenomena towards the ground. Moreover, the layers located at ranges R2 and R3 related to smoke particles evidence a larger content of fine-mode aerosol with peak mode radius values at 0.2 µm and 0.1 µm, respectively. Also, AERONET columnar properties revealed a dominance of fine particles in the atmosphere with low absorption properties (absorption AOD < 0.0025 and SSA > 0.97) and addressed aerosol properties in good agreement with those evidenced by the lidar observations.
Finally, we would like to anticipate some results on the refractive index estimated by using an improved version of our lidar data inversion method [31] that will be the subject of a future publication [66]. These data allow gaining further information on the different aerosol layers recognized by the lidar measurement since they provide slightly different values of the refractive index for the three aerosol layers located at the ranges R1, R2, and R3. At a wavelength of 355 nm, the retrieved values of the refractive index are (1.4 ± 0.03i) for R1, (1.5 ± 0.008i) for R2, and (1.4 ± 0.01i) for R3. The higher real refractive index in the layer at R2 could be due to the aging processes that occurred during the air masses transport; the lower imaginary part of the refractive index suggests a lower black carbon fraction in R2, in agreement with lower LR values measured by lidar that suggested particles with a lower absorption at those altitudes [61]. In addition, the columnar value of the refractive index obtained by using our inversion method resulted to be (1.5 ± 0.03i), addressing a good consistency with the columnar data provided by the sun photometer, and agreeing with the columnar values reported by other authors [67]. These observations eventually highlight that long-range transported aged smoke particles are less absorptive. Moreover, the space-resolved results on the refractive index are consistent with AERONET sun photometer retrieved values, thus evidencing the reliability and capability of lidar characterization of atmospheric aerosol in a very interesting condition of multiple aerosol layers originating from Canadian fires overpassing the observation station.
In conclusion, we carried out a thorough characterization of biomass burning aerosol transported over our station in the aftermath of the extensive wildfire events that affected the British Columbia region of Canada in the summer of 2017. The peculiar atmospheric conditions with the presence of multiple aerosol layers at different altitudes allowed for assessing the good capabilities of the lidar observations in addressing differences in the corresponding aerosol characteristics. Our findings clearly show how the multiwavelength lidar observations, complemented with appropriate data inversion methods, provide a valuable route to gain sound spatially resolved knowledge of the aerosol features, effectively complementing the columnar data provided by the AERONET photometer.

Author Contributions

Conceptualization, A.B.; Methodology, R.D. and A.S.; Software, A.S. and A.B.; Validation, S.A.; Formal analysis, R.D., A.S. and A.B.; Investigation, R.D. and A.S.; Writing—original draft, R.D. and A.B.; Writing—review & editing, S.A.; Visualization, R.D., A.S. and A.B.; Supervision, S.A. All authors have read and agreed to the published version of the manuscript.

Funding

The research leading to these results received funding from the European Union’s Horizon 2020 Framework Program for Research and Innovation (grant agreement no. 654109—ACTRIS-2 Aerosols, Clouds, and Trace Gases Research InfraStructure). A.S. acknowledges the support by the Ministero dell’Istruzione, dell’Università e della Ricerca in the frame of PIANO STRALCIO RICERCA E INNOVAZIONE 2015–2017 “PNIR-Programma Nazionale Infrastrutture di Ricerca”, Rafforzamento del capitale umano delle Infrastrutture di Ricerca (CIR01_00015).

Data Availability Statement

Dataset available on request from the authors.

Acknowledgments

The authors acknowledge ITINERIS, Italian Integrated Environmental Research Infrastructures System (D.D. n. 130/2022—CUP B53C22002150006) Funded by EU—Next Generation EU PNRR- Mission 4 “Education and Research”—Component 2: “From research to business”—Investment 3.1: “Fund for the realization of an integrated system of research and innovation infrastructures”. The authors gratefully acknowledge the NOAA Air Resource Laboratory (ARL) for the provision of the HYSPLIT transport and dispersion model and/or READY website used in this publication. Data and/or from the BSC- DREAM8b (Dust Regional Atmospheric Model) model were operated by the Barcelona Supercomputing Center (http://www.bsc.es/ess/bsc-dust-daily-forecast/ accessed on 20 November 2023). The authors thank ALA Advanced Lidar Applications s.r.l. for providing the PAPRICA software ver. 1.8.4.0 for the lidar microphysical properties retrieval.

Conflicts of Interest

The authors declare no conflicts of interest. The funders had no role in the design of the study; in the collection, analyses, or interpretation of data; in the writing of the manuscript; or in the decision to publish the results.

References

  1. Linares, C.; Carmona, R.; Salvador, P.; Díaz, J. Impact on Mortality of Biomass Combustion from Wildfires in Spain: A Regional Analysis. Sci. Total Environ. 2018, 622–623, 547–555. [Google Scholar] [CrossRef]
  2. Alonso-Blanco, E.; Castro, A.; Calvo, A.I.; Pont, V.; Mallet, M.; Fraile, R. Wildfire Smoke Plumes Transport under a Subsidence Inversion: Climate and Health Implications in a Distant Urban Area. Sci. Total Environ. 2018, 619–620, 988–1002. [Google Scholar] [CrossRef]
  3. Reid, J.S.; Koppmann, R.; Eck, T.F.; Eleuterio, D.P. A Review of Biomass Burning Emissions Part II: Intensive Physical Properties of Biomass Burning Particles. Atmos. Chem. Phys. 2005, 5, 799–825. [Google Scholar] [CrossRef]
  4. Fiebig, M.; Petzold, A.; Wandinger, U.; Wendisch, M.; Kiemle, C.; Stifter, A.; Ebert, M.; Rother, T.; Leiterer, U. Optical Closure for an Aerosol Column: Method, Accuracy, and Inferable Properties Applied to a Biomass-Burning Aerosol and Its Radiative Forcing. J. Geophys. Res. Atmos. 2002, 107, LAC 12-1–LAC 12-15. [Google Scholar] [CrossRef]
  5. Hodshire, A.L.; Akherati, A.; Alvarado, M.J.; Brown-Steiner, B.; Jathar, S.H.; Jimenez, J.L.; Kreidenweis, S.M.; Lonsdale, C.R.; Onasch, T.B.; Ortega, A.M.; et al. Aging Effects on Biomass Burning Aerosol Mass and Composition: A Critical Review of Field and Laboratory Studies. Environ. Sci. Technol. 2019, 53, 10007–10022. [Google Scholar] [CrossRef]
  6. Ansmann, A.; Baars, H.; Chudnovsky, A.; Mattis, I.; Veselovskii, I.; Haarig, M.; Seifert, P.; Engelmann, R.; Wandinger, U. Extreme Levels of Canadian Wildfire Smoke in the Stratosphere over Central Europe on 21–22 August 2017. Atmos. Chem. Phys. 2018, 18, 11831–11845. [Google Scholar] [CrossRef]
  7. Khaykin, S.M.; Godin-Beekmann, S.; Hauchecorne, A.; Pelon, J.; Ravetta, F.; Keckhut, P. Stratospheric Smoke With Unprecedentedly High Backscatter Observed by Lidars Above Southern France. Geophys. Res. Lett. 2018, 45, 1639–1646. [Google Scholar] [CrossRef]
  8. Sicard, M.; Granados-Muñoz, M.J.; Alados-Arboledas, L.; Barragán, R.; Bedoya-Velásquez, A.E.; Benavent-Oltra, J.A.; Bortoli, D.; Comerón, A.; Córdoba-Jabonero, C.; Costa, M.J.; et al. Ground/Space, Passive/Active Remote Sensing Observations Coupled with Particle Dispersion Modelling to Understand the Inter-Continental Transport of Wildfire Smoke Plumes. Remote Sens. Environ. 2019, 232, 111294. [Google Scholar] [CrossRef]
  9. Hu, Q.; Goloub, P.; Veselovskii, I.; Bravo-Aranda, J.-A.; Popovici, I.E.; Podvin, T.; Haeffelin, M.; Lopatin, A.; Dubovik, O.; Pietras, C.; et al. Long-Range-Transported Canadian Smoke Plumes in the Lower Stratosphere over Northern France. Atmos. Chem. Phys. 2019, 19, 1173–1193. [Google Scholar] [CrossRef]
  10. Ohneiser, K.; Ansmann, A.; Witthuhn, J.; Deneke, H.; Chudnovsky, A.; Walter, G.; Senf, F. Self-Lofting of Wildfire Smoke in the Troposphere and Stratosphere: Simulations and Space Lidar Observations. Atmos. Chem. Phys. 2023, 23, 2901–2925. [Google Scholar] [CrossRef]
  11. Rosenfeld, D.; Fromm, M.; Trentmann, J.; Luderer, G.; Andreae, M.O.; Servranckx, R. The Chisholm Firestorm: Observed Microstructure, Precipitation and Lightning Activity of a Pyro-Cumulonimbus. Atmos. Chem. Phys. 2007, 7, 645–659. [Google Scholar] [CrossRef]
  12. Ansmann, A.; Ohneiser, K.; Chudnovsky, A.; Knopf, D.A.; Eloranta, E.W.; Villanueva, D.; Seifert, P.; Radenz, M.; Barja, B.; Zamorano, F.; et al. Ozone Depletion in the Arctic and Antarctic Stratosphere Induced by Wildfire Smoke. Atmos. Chem. Phys. 2022, 22, 11701–11726. [Google Scholar] [CrossRef]
  13. Alados-Arboledas, L.; Müller, D.; Guerrero-Rascado, J.L.; Navas-Guzmán, F.; Pérez-Ramírez, D.; Olmo, F.J. Optical and Microphysical Properties of Fresh Biomass Burning Aerosol Retrieved by Raman Lidar, and Star-and Sun-Photometry. Geophys. Res. Lett. 2011, 38. [Google Scholar] [CrossRef]
  14. De Rosa, B.; Amato, F.; Amodeo, A.; D’Amico, G.; Dema, C.; Falconieri, A.; Giunta, A.; Gumà-Claramunt, P.; Kampouri, A.; Solomos, S.; et al. Characterization of Extremely Fresh Biomass Burning Aerosol by Means of Lidar Observations. Remote Sens. 2022, 14, 4984. [Google Scholar] [CrossRef]
  15. Ansmann, A.; Ohneiser, K.; Mamouri, R.-E.; Knopf, D.A.; Veselovskii, I.; Baars, H.; Engelmann, R.; Foth, A.; Jimenez, C.; Seifert, P.; et al. Tropospheric and Stratospheric Wildfire Smoke Profiling with Lidar: Mass, Surface Area, CCN, and INP Retrieval. Atmos. Chem. Phys. 2021, 21, 9779–9807. [Google Scholar] [CrossRef]
  16. Baars, H.; Radenz, M.; Floutsi, A.A.; Engelmann, R.; Althausen, D.; Heese, B.; Ansmann, A.; Flament, T.; Dabas, A.; Trapon, D.; et al. Californian Wildfire Smoke Over Europe: A First Example of the Aerosol Observing Capabilities of Aeolus Compared to Ground-Based Lidar. Geophys. Res. Lett. 2021, 48, e2020GL092194. [Google Scholar] [CrossRef]
  17. Adam, M.; Pahlow, M.; Kovalev, V.A.; Ondov, J.M.; Parlange, M.B.; Nair, N. Aerosol Optical Characterization by Nephelometer and Lidar: The Baltimore Supersite Experiment during the Canadian Forest Fire Smoke Intrusion. J. Geophys. Res. Atmos. 2004, 109. [Google Scholar] [CrossRef]
  18. Bento, V.A.; Lima, D.C.A.; Santos, L.C.; Lima, M.M.; Russo, A.; Nunes, S.A.; DaCamara, C.C.; Trigo, R.M.; Soares, P.M.M. The Future of Extreme Meteorological Fire Danger under Climate Change Scenarios for Iberia. Weather Clim. Extrem. 2023, 42, 100623. [Google Scholar] [CrossRef]
  19. Turco, M.; Jerez, S.; Augusto, S.; Tarín-Carrasco, P.; Ratola, N.; Jiménez-Guerrero, P.; Trigo, R.M. Climate Drivers of the 2017 Devastating Fires in Portugal. Sci. Rep. 2019, 9, 13886. [Google Scholar] [CrossRef]
  20. Čavlina Tomašević, I.; Cheung, K.K.W.; Vučetić, V.; Fox-Hughes, P.; Horvath, K.; Telišman Prtenjak, M.; Beggs, P.J.; Malečić, B.; Milić, V. The 2017 Split Wildfire in Croatia: Evolution and the Role of Meteorological Conditions. Nat. Hazards Earth Syst. Sci. 2022, 22, 3143–3165. [Google Scholar] [CrossRef]
  21. Boselli, A.; Sannino, A.; D’Emilio, M.; Wang, X.; Amoruso, S. Aerosol Characterization during the Summer 2017 Huge Fire Event on Mount Vesuvius (Italy) by Remote Sensing and In Situ Observations. Remote Sens. 2021, 13, 2001. [Google Scholar] [CrossRef]
  22. Kloss, C.; Berthet, G.; Sellitto, P.; Ploeger, F.; Bucci, S.; Khaykin, S.; Jégou, F.; Taha, G.; Thomason, L.W.; Barret, B.; et al. Transport of the 2017 Canadian Wildfire Plume to the Tropics via the Asian Monsoon Circulation. Atmos. Chem. Phys. 2019, 19, 13547–13567. [Google Scholar] [CrossRef]
  23. Haarig, M.; Ansmann, A.; Baars, H.; Jimenez, C.; Veselovskii, I.; Engelmann, R.; Althausen, D. Depolarization and Lidar Ratios at 355, 532, and nm and Microphysical Properties of Aged Tropospheric and Stratospheric Canadian Wildfire Smoke. Atmos. Chem. Phys. 2018, 18, 11847–11861. [Google Scholar] [CrossRef]
  24. Baars, H.; Ansmann, A.; Ohneiser, K.; Haarig, M.; Engelmann, R.; Althausen, D.; Hanssen, I.; Gausa, M.; Pietruczuk, A.; Szkop, A.; et al. The Unprecedented 2017–2018 Stratospheric Smoke Event: Decay Phase and Aerosol Properties Observed with the EARLINET. Atmos. Chem. Phys. 2019, 19, 15183–15198. [Google Scholar] [CrossRef]
  25. Peterson, D.A.; Fromm, M.D.; McRae, R.H.D.; Campbell, J.R.; Hyer, E.J.; Taha, G.; Camacho, C.P.; Kablick, G.P.; Schmidt, C.C.; DeLand, M.T. Australia’s Black Summer Pyrocumulonimbus Super Outbreak Reveals Potential for Increasingly Extreme Stratospheric Smoke Events. npj Clim. Atmos. Sci. 2021, 4, 38. [Google Scholar] [CrossRef]
  26. Ohneiser, K.; Ansmann, A.; Baars, H.; Seifert, P.; Barja, B.; Jimenez, C.; Radenz, M.; Teisseire, A.; Floutsi, A.; Haarig, M.; et al. Smoke of Extreme Australian Bushfires Observed in the Stratosphere over Punta Arenas, Chile, in January 2020: Optical Thickness, Lidar Ratios, and Depolarization Ratios at 355 and 532 nm. Atmos. Chem. Phys. 2020, 20, 8003–8015. [Google Scholar] [CrossRef]
  27. Ohneiser, K.; Ansmann, A.; Kaifler, B.; Chudnovsky, A.; Barja, B.; Knopf, D.A.; Kaifler, N.; Baars, H.; Seifert, P.; Villanueva, D.; et al. Australian Wildfire Smoke in the Stratosphere: The Decay Phase in 2020/2021 and Impact on Ozone Depletion. Atmos. Chem. Phys. 2022, 22, 7417–7442. [Google Scholar] [CrossRef]
  28. Wandinger, U.; Nicolae, D.; Pappalardo, G.; Mona, L.; Comerón, A. ACTRIS and Its Aerosol Remote Sensing Component. EPJ Web Conf. 2020, 237, 05003. [Google Scholar] [CrossRef]
  29. Freudenthaler, V.; Linné, H.; Chaikovski, A.; Rabus, D.; Groß, S. EARLINET Lidar Quality Assurance Tools. Atmos. Meas. Tech. Discuss. 2018, 1–35. [Google Scholar] [CrossRef]
  30. Wandinger, U.; Freudenthaler, V.; Baars, H.; Amodeo, A.; Engelmann, R.; Mattis, I.; Groß, S.; Pappalardo, G.; Giunta, A.; D’Amico, G.; et al. EARLINET Instrument Intercomparison Campaigns: Overview on Strategy and Results. Atmos. Meas. Tech. 2016, 9, 1001–1023. [Google Scholar] [CrossRef]
  31. Sorrentino, A.; Sannino, A.; Spinelli, N.; Piana, M.; Boselli, A.; Tontodonato, V.; Castellano, P.; Wang, X. A Bayesian Parametric Approach to the Retrieval of the Atmospheric Number Size Distribution from Lidar Data. Atmos. Meas. Tech. 2022, 15, 149–164. [Google Scholar] [CrossRef]
  32. Samoilova, S.V. Simultaneous Reconstruction of the Complex Refractive Index and the Particle Size Distribution Function from Lidar Measurements: Testing the Developed Algorithms. Atmos. Ocean. Opt. 2019, 32, 628–642. [Google Scholar] [CrossRef]
  33. Klett, J.D. Stable Analytical Inversion Solution for Processing Lidar Returns. Appl. Opt. AO 1981, 20, 211–220. [Google Scholar] [CrossRef] [PubMed]
  34. Fernald, F.G. Analysis of Atmospheric Lidar Observations: Some Comments. Appl. Opt. AO 1984, 23, 652–653. [Google Scholar] [CrossRef]
  35. Ansmann, A.; Riebesell, M.; Wandinger, U.; Weitkamp, C.; Voss, E.; Lahmann, W.; Michaelis, W. Combined Raman Elastic-Backscatter LIDAR for Vertical Profiling of Moisture, Aerosol Extinction, Backscatter, and LIDAR Ratio. Appl. Phys. B 1992, 55, 18–28. [Google Scholar] [CrossRef]
  36. Böckmann, C.; Wandinger, U.; Ansmann, A.; Bösenberg, J.; Amiridis, V.; Boselli, A.; Delaval, A.; Tomasi, F.D.; Frioud, M.; Grigorov, I.V.; et al. Aerosol Lidar Intercomparison in the Framework of the EARLINET Project. 2. Aerosol Backscatter Algorithms. Appl. Opt. AO 2004, 43, 977–989. [Google Scholar] [CrossRef] [PubMed]
  37. Pappalardo, G.; Amodeo, A.; Pandolfi, M.; Wandinger, U.; Ansmann, A.; Bösenberg, J.; Matthias, V.; Amiridis, V.; De Tomasi, F.; Frioud, M.; et al. Aerosol Lidar Intercomparison in the Framework of the EARLINET Project. 3. Raman Lidar Algorithm for Aerosol Extinction, Backscatter, and Lidar Ratio. Appl. Opt. 2004, 43, 5370–5385. [Google Scholar] [CrossRef]
  38. Biele, J.; Beyerle, G.; Baumgarten, G. Polarization Lidar: Corrections of Instrumental Effects. Opt. Express OE 2000, 7, 427–435. [Google Scholar] [CrossRef]
  39. Freudenthaler, V.; Esselborn, M.; Wiegner, M.; Heese, B.; Tesche, M.; Ansmann, A.; Müller, D.; Althausen, D.; Wirth, M.; Fix, A.; et al. Depolarization Ratio Profiling at Several Wavelengths in Pure Saharan Dust during SAMUM 2006. Tellus B 2009, 61, 165–179. [Google Scholar] [CrossRef]
  40. Schuster, G.L.; Dubovik, O.; Holben, B.N. Angstrom Exponent and Bimodal Aerosol Size Distributions. J. Geophys. Res. Atmos. 2006, 111, D07207. [Google Scholar] [CrossRef]
  41. Song, Y.; Zhang, B.; Shi, G.; Li, S.; Di, H.; Yan, Q.; Hua, D. Correlation between the Lidar Ratio and the Ångström Exponent of Various Aerosol Types. Particuology 2018, 40, 62–69. [Google Scholar] [CrossRef]
  42. Barreto, Á.; Cuevas, E.; Granados-Muñoz, M.-J.; Alados-Arboledas, L.; Romero, P.M.; Gröbner, J.; Kouremeti, N.; Almansa, A.F.; Stone, T.; Toledano, C.; et al. The New Sun-Sky-Lunar Cimel CE318-T Multiband Photometer &ndash; a Comprehensive Performance Evaluation. Atmos. Meas. Tech. 2016, 9, 631–654. [Google Scholar] [CrossRef]
  43. Holben, B.N.; Eck, T.F.; Slutsker, I.; Tanré, D.; Buis, J.P.; Setzer, A.; Vermote, E.; Reagan, J.A.; Kaufman, Y.J.; Nakajima, T.; et al. AERONET—A Federated Instrument Network and Data Archive for Aerosol Characterization. Remote Sens. Environ. 1998, 66, 1–16. [Google Scholar] [CrossRef]
  44. Rolph, G.; Stein, A.; Stunder, B. Real-Time Environmental Applications and Display sYstem: READY. Environ. Model. Softw. 2017, 95, 210–228. [Google Scholar] [CrossRef]
  45. Dubovik, O.; King, M. A Flexible Inversion Algorithm for Retrieval of Aerosol Optical Properties from Sun and Sky Radiance Measurements. J. Geophys. Res. 2000, 105, 20673–20696. [Google Scholar] [CrossRef]
  46. Holben, B.N.; Tanré, D.; Smirnov, A.; Eck, T.F.; Slutsker, I.; Abuhassan, N.; Newcomb, W.W.; Schafer, J.S.; Chatenet, B.; Lavenu, F.; et al. An Emerging Ground-Based Aerosol Climatology: Aerosol Optical Depth from AERONET. J. Geophys. Res. Atmos. 2001, 106, 12067–12097. [Google Scholar] [CrossRef]
  47. Huang, K.; Fu, J.S.; Lin, N.-H.; Wang, S.-H.; Dong, X.; Wang, G. Superposition of Gobi Dust and Southeast Asian Biomass Burning: The Effect of Multisource Long-Range Transport on Aerosol Optical Properties and Regional Meteorology Modification. J. Geophys. Res. Atmos. 2019, 124, 9464–9483. [Google Scholar] [CrossRef]
  48. Bergstrom, R.W.; Pilewskie, P.; Russell, P.B.; Redemann, J.; Bond, T.C.; Quinn, P.K.; Sierau, B. Spectral Absorption Properties of Atmospheric Aerosols. Atmos. Chem. Phys. 2007, 7, 5937–5943. [Google Scholar] [CrossRef]
  49. Wang, S.-H.; Lin, N.-H.; Chou, M.-D.; Woo, J.-H. Estimate of Radiative Forcing of Asian Biomass-Burning Aerosols during the Period of TRACE-P. J. Geophys. Res. Atmos. 2007, 112, D102022. [Google Scholar] [CrossRef]
  50. Eck, T.; Holben, B.N.; Reid, J.; Dubovik, O.; Smirnov, A.; Neill; Slutsker, I.; Kinne, S. Wavelength Dependence of the Optical Depth of Biomass Burning, Urban, and Desert Dust Aerosols. J. Geophys. Res. 1999, 104, 31333–31349. [Google Scholar] [CrossRef]
  51. Toledano, C.; Cachorro, V.E.; Berjon, A.; de Frutos, A.M.; Sorribas, M.; de la Morena, B.A.; Goloub, P. Aerosol optical depth and Ångström exponent climatology at El Arenosillo AERONET site (Huelva, Spain). Q. J. R. Meteorol. Soc. 2007, 133, 795–807. [Google Scholar] [CrossRef]
  52. Dubovik, O.; Smirnov, A.; Holben, B.N.; King, M.D.; Kaufman, Y.J.; Eck, T.F.; Slutsker, I. Accuracy Assessments of Aerosol Optical Properties Retrieved from Aerosol Robotic Network (AERONET) Sun and Sky Radiance Measurements. J. Geophys. Res. Atmos. 2000, 105, 9791–9806. [Google Scholar] [CrossRef]
  53. Stein, A.F.; Draxler, R.R.; Rolph, G.D.; Stunder, B.J.B.; Cohen, M.D.; Ngan, F. NOAA’s HYSPLIT Atmospheric Transport and Dispersion Modeling System. Bull. Am. Meteorol. Soc. 2015, 96, 2059–2077. [Google Scholar] [CrossRef]
  54. Davies, D.K.; Ilavajhala, S.; Wong, M.M.; Justice, C.O. Fire Information for Resource Management System: Archiving and Distributing MODIS Active Fire Data. IEEE Trans. Geosci. Remote Sens. 2009, 47, 72–79. [Google Scholar] [CrossRef]
  55. Amiridis, V.; Balis, D.S.; Giannakaki, E.; Stohl, A.; Kazadzis, S.; Koukouli, M.E.; Zanis, P. Optical Characteristics of Biomass Burning Aerosols over Southeastern Europe Determined from UV-Raman Lidar Measurements. Atmos. Chem. Phys. 2009, 9, 2431–2440. [Google Scholar] [CrossRef]
  56. Janicka, L.; Davuliene, L.; Bycenkiene, S.; Stachlewska, I.S. Long Term Observations of Biomass Burning Aerosol over Warsaw by Means of Multiwavelength Lidar. Opt. Express OE 2023, 31, 33150–33174. [Google Scholar] [CrossRef] [PubMed]
  57. Sannino, A.; Amoruso, S.; Damiano, R.; Scollo, S.; Sellitto, P.; Boselli, A. Optical and Microphysical Characterization of Atmospheric Aerosol in the Central Mediterranean during Simultaneous Volcanic Ash and Desert Dust Transport Events. Atmos. Res. 2022, 271, 106099. [Google Scholar] [CrossRef]
  58. Lack, D.A.; Cappa, C.D. Impact of Brown and Clear Carbon on Light Absorption Enhancement, Single Scatter Albedo and Absorption Wavelength Dependence of Black Carbon. Atmos. Chem. Phys. 2010, 10, 4207–4220. [Google Scholar] [CrossRef]
  59. Nikonovas, T.; North, P.R.J.; Doerr, S.H. Smoke Aerosol Properties and Ageing Effects for Northern Temperate and Boreal Regions Derived from AERONET Source and Age Attribution. Atmos. Chem. Phys. 2015, 15, 7929–7943. [Google Scholar] [CrossRef]
  60. Markowicz, K.M.; Chilinski, M.T.; Lisok, J.; Zawadzka, O.; Stachlewska, I.S.; Janicka, L.; Rozwadowska, A.; Makuch, P.; Pakszys, P.; Zielinski, T.; et al. Study of Aerosol Optical Properties during Long-Range Transport of Biomass Burning from Canada to Central Europe in July 2013. J. Aerosol Sci. 2016, 101, 156–173. [Google Scholar] [CrossRef]
  61. Ortiz-Amezcua, P.; Guerrero-Rascado, J.L.; Granados-Muñoz, M.J.; Benavent-Oltra, J.A.; Böckmann, C.; Samaras, S.; Stachlewska, I.S.; Janicka, Ł.; Baars, H.; Bohlmann, S.; et al. Microphysical Characterization of Long-Range Transported Biomass Burning Particles from North America at Three EARLINET Stations. Atmos. Chem. Phys. 2017, 17, 5931–5946. [Google Scholar] [CrossRef]
  62. Eck, T.F.; Holben, B.N.; Reid, J.S.; Sinyuk, A.; Hyer, E.J.; O’Neill, N.T.; Shaw, G.E.; Castle, J.R.V.; Chapin, F.S.; Dubovik, O.; et al. Optical Properties of Boreal Region Biomass Burning Aerosols in Central Alaska and Seasonal Variation of Aerosol Optical Depth at an Arctic Coastal Site. J. Geophys. Res. 2009, 114, D11201. [Google Scholar] [CrossRef]
  63. Kirchstetter, T.W.; Novakov, T.; Hobbs, P.V. Evidence That the Spectral Dependence of Light Absorption by Aerosols Is Affected by Organic Carbon. J. Geophys. Res. Atmos. 2004, 109, D21208. [Google Scholar] [CrossRef]
  64. Womack, C.C.; Manfred, K.M.; Wagner, N.L.; Adler, G.; Franchin, A.; Lamb, K.D.; Middlebrook, A.M.; Schwarz, J.P.; Brock, C.A.; Brown, S.S.; et al. Complex Refractive Indices in the Ultraviolet and Visible Spectral Region for Highly Absorbing Non-Spherical Biomass Burning Aerosol. Atmos. Chem. Phys. 2021, 21, 7235–7252. [Google Scholar] [CrossRef]
  65. Luo, B.; Kuang, Y.; Huang, S.; Song, Q.; Hu, W.; Li, W.; Peng, Y.; Chen, D.; Yue, D.; Yuan, B.; et al. Parameterizations of Size Distribution and Refractive Index of Biomass Burning Organic Aerosol with Black Carbon Content. Atmos. Chem. Phys. 2022, 22, 12401–12415. [Google Scholar] [CrossRef]
  66. Sannino, A.; Damiano, R.; Sorrentino, A.; Spinelli, N.; Wang, X.; Boselli, A. Retrieving Atmospheric Number Size Distribution and Complex Refractive Index from Lidar Data. To be published 2024.
  67. López-Cayuela, M.-Á.; Herrera, M.E.; Córdoba-Jabonero, C.; Pérez-Ramírez, D.; Carvajal-Pérez, C.V.; Dubovik, O.; Guerrero-Rascado, J.L. Retrieval of Aged Biomass-Burning Aerosol Properties by Using GRASP Code in Synergy with Polarized Micro-Pulse Lidar and Sun/Sky Photometer. Remote Sens. 2022, 14, 3619. [Google Scholar] [CrossRef]
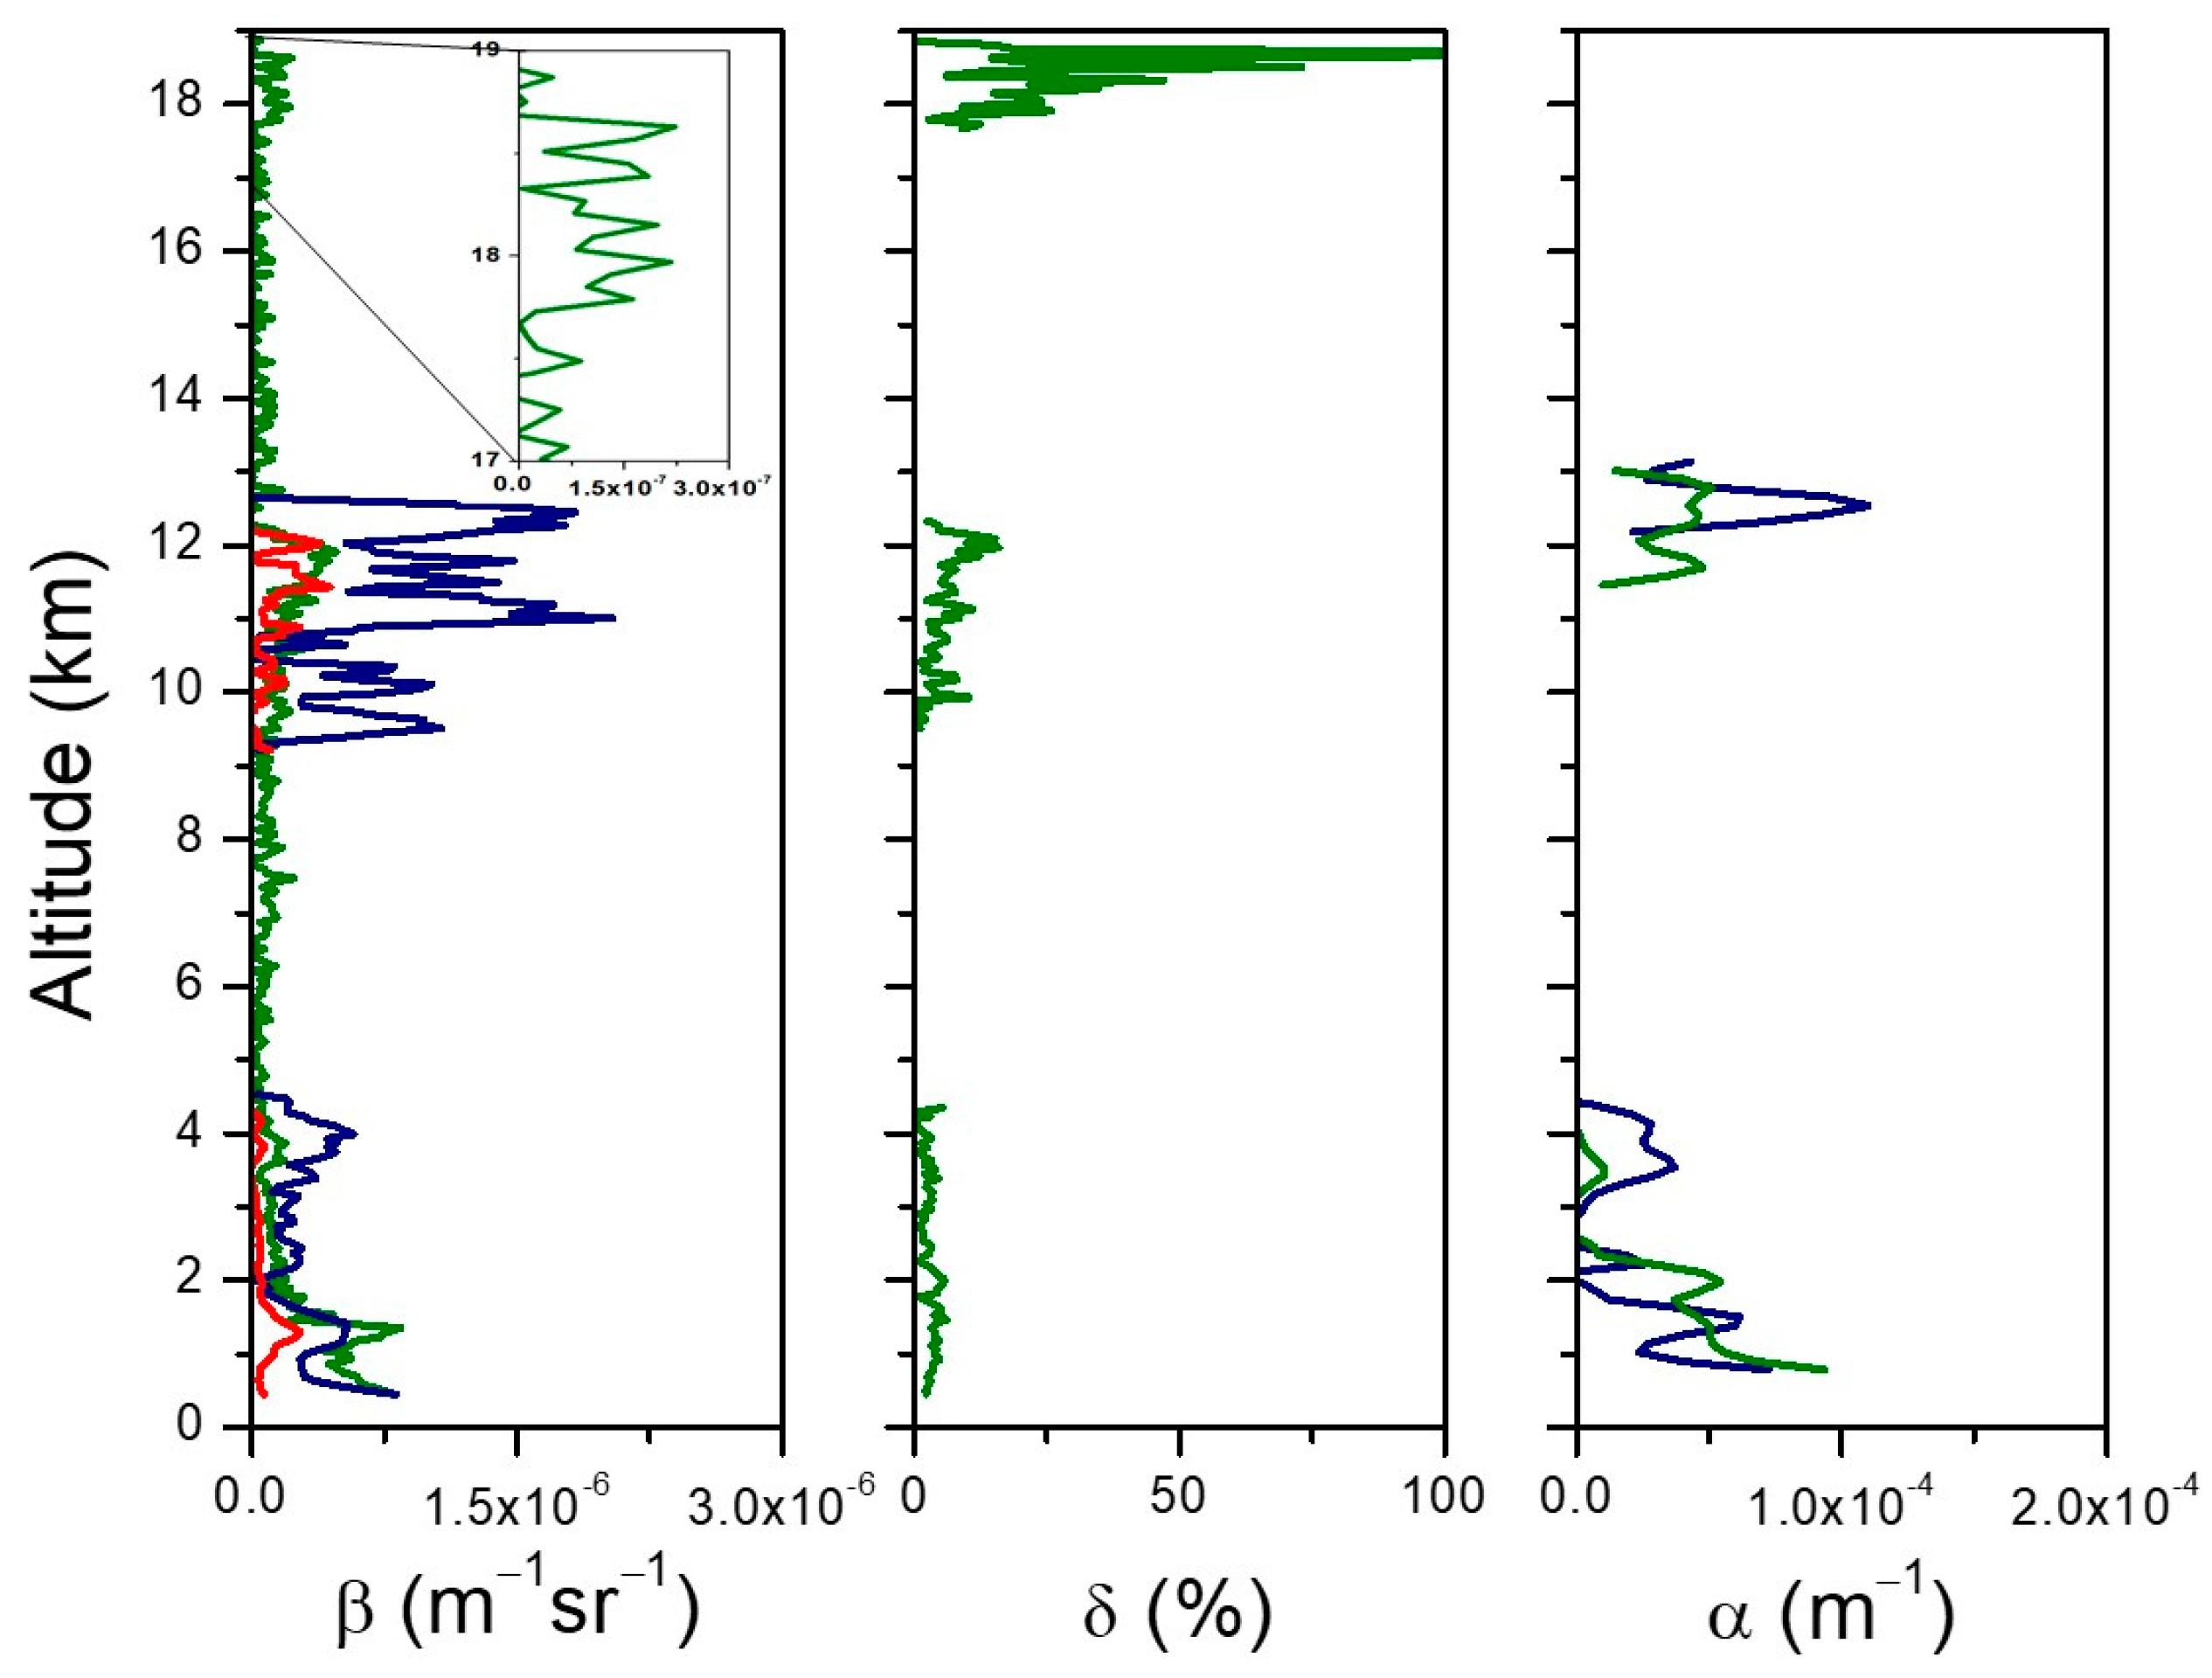
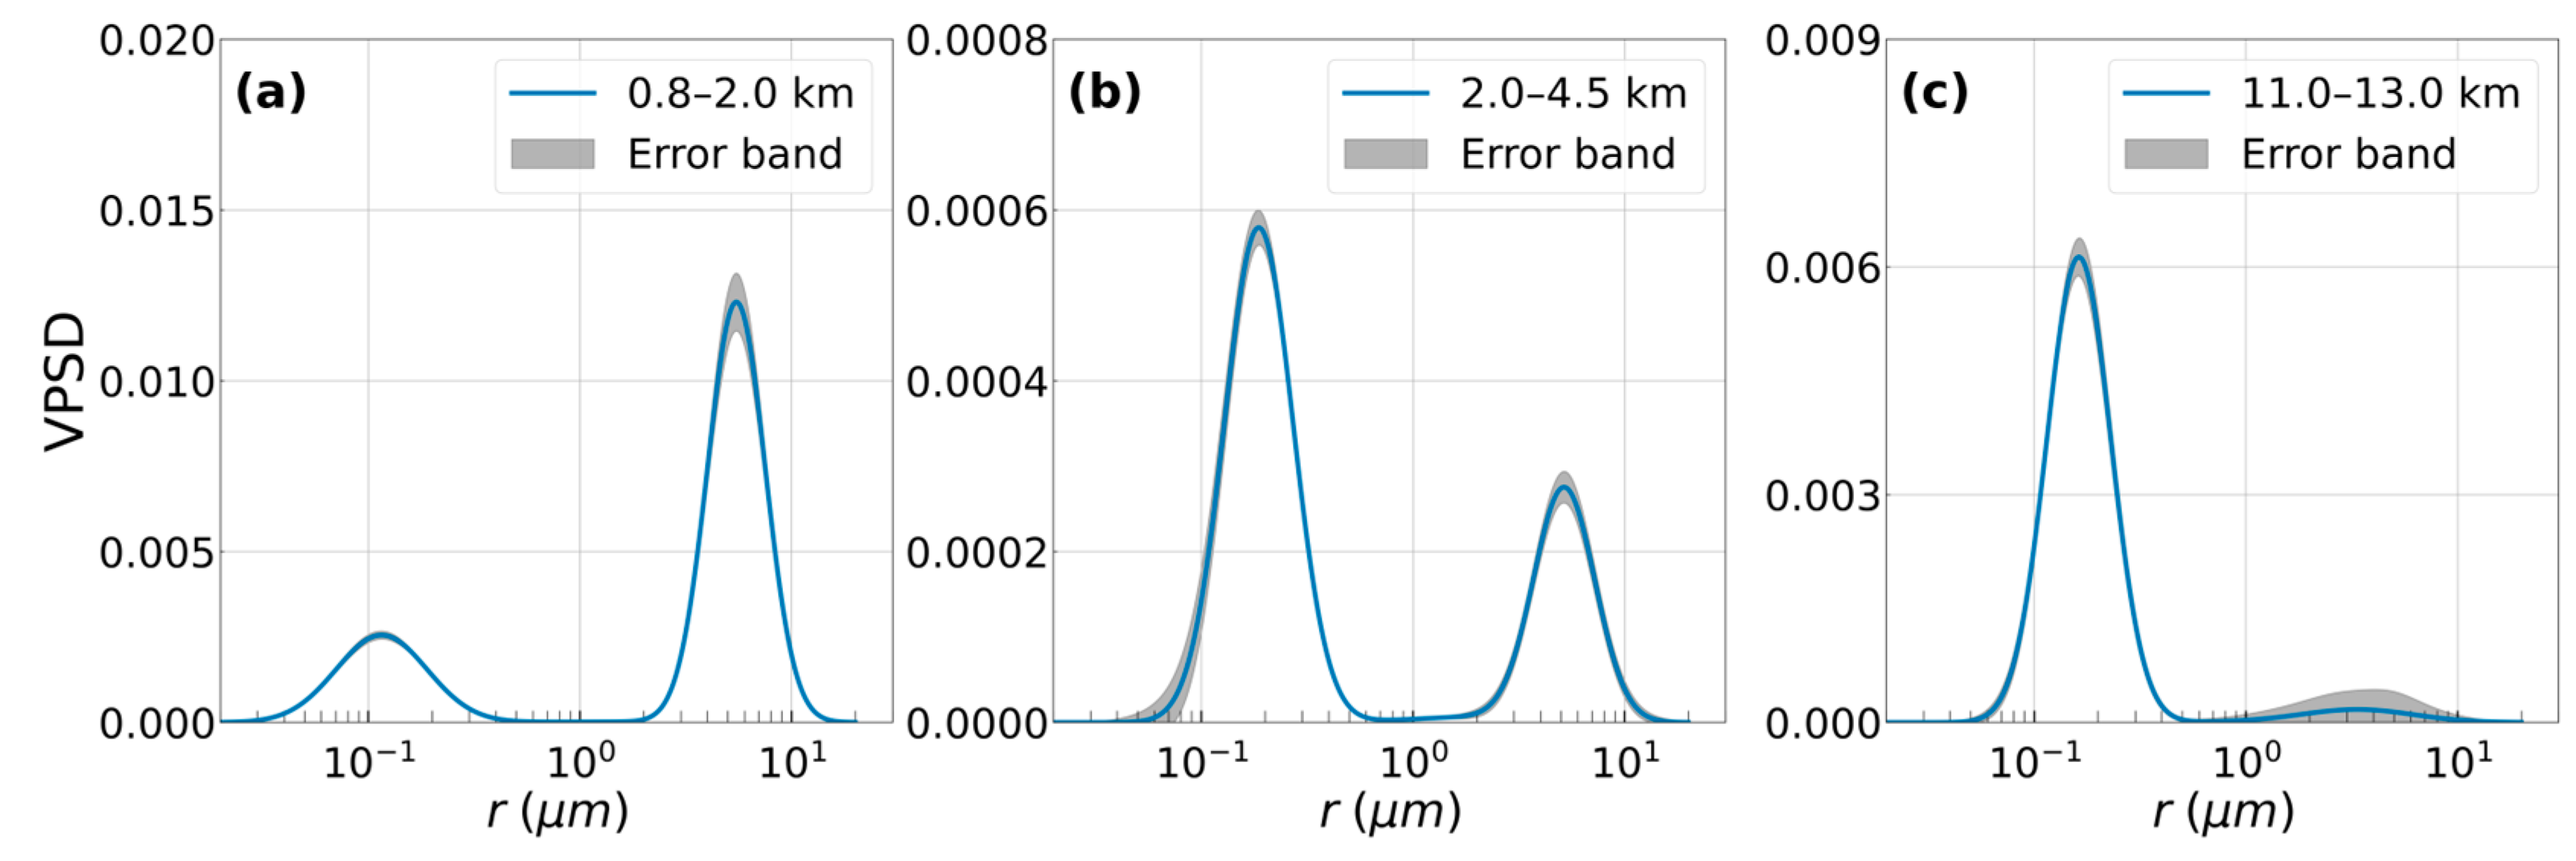
Figure 1. False color maps of the time series of the range-corrected lidar signal (RCS) measured at 532 nm. Panel (a) reports the observation corresponding to 31 August 2017, from 17:05 to 18:40, whereas panel (b) displays the situation registered on 4 September 2017, from 18:10 to 18.40. Times are shown in UTC.
Remotesensing 16 00538 g001
Figure 2. HYSPLIT back trajectories ending over the measurement area on 4 September 2017 at 18:00 UTC. Red crosses represent hotspot fire location from FIRMS. The altitude for the air masses trend is reported in meters. For the troposphere layer (a) and the tropopause layer (b) FIRMS hot spot fire locations are shown between 29 and 30 August 2017, whereas for the stratospheric layer (c) hotspot fire locations are shown between 17 and 18 August 2017.
Remotesensing 16 00538 g002
Figure 3. Lidar profiles of aerosol backscattering (β), linear depolarization ratio (δ), and extinction (α) derived from the observations carried out from 18:10 to 18:40 UTC on 4 September 2017. The left panel displays the β profiles at the three wavelengths (red line—1064 nm; green line—532 nm; blue line—355 nm); the inset shows a zoomed view of the 532 nm signal at high altitude evidencing the upper aerosol layer. The central panel reports the profile of δ at 532 nm, whereas the right panel displays the profile of α for the UV (blue line) and green (green line) wavelengths.
Remotesensing 16 00538 g003
Figure 4. Columnar volume particle size distributions (VPSDs) derived from lidar (a) and sun photometer (b) data.
Remotesensing 16 00538 g004
Figure 5. Volume particle size distributions (VPSDs) as derived from lidar data for the three aerosol layers located at different ranges: (a) R1 (0.8–2.0 km), (b) R2 (2.0–4.5 km), and (c) R3 (11–13 km).
Remotesensing 16 00538 g005
Figure 6. Fine-mode fraction at 500 nm derived from AERONET data on 4 September 2017.
Remotesensing 16 00538 g006
Figure 7. Wavelength dependence of asymmetry factor (a), SSA (b), and AOD absorption (c) at different times derived from AERONET data on 4 September 2017. Data refer to wavelengths 440, 675, 870, and 1020 nm.
Remotesensing 16 00538 g007
Figure 8. Wavelength dependence of real (blue lines, left axis) and imaginary (red lines, right axis) refractive index at different times (identified by different markers).
Remotesensing 16 00538 g008
Table 1. Aerosol parameters measured in the smoke layers observed over Napoli area and derived by multi-wavelength lidar observations carried out on 4 September 2017.
Range (km)δ (%)LR355LR532BAEEAE
R1 (0.8–2.0)3.9 ± 0.332 ± 1082 ± 171.1 ± 0.7−1.0 ± 0.5
R2 (2.0–4.5)2.5 ± 0.320 ± 1732 ± 93.4 ± 2.1−0.5 ± 3.0
R3 (11.0–13.0)6.6 ± 1.865 ± 3582 ± 474.4 ± 4.92.9 ± 4.0
R4 (17.0–19.0)29.8 ± 7.6
Disclaimer/Publisher’s Note: The statements, opinions and data contained in all publications are solely those of the individual author(s) and contributor(s) and not of MDPI and/or the editor(s). MDPI and/or the editor(s) disclaim responsibility for any injury to people or property resulting from any ideas, methods, instructions or products referred to in the content.

