Review

The Rising Concern for Sea Level Rise: Altimeter Record and Geo-Engineering Debate

1
The Pillars of Hercules Foundation, Sidney, BC V8L 4B2, Canada
2
Tethys Research Institute, 20121 Milan, Italy
*
Author to whom correspondence should be addressed.
Remote Sens. 2024, 16(2), 262; https://doi.org/10.3390/rs16020262
Submission received: 29 September 2023 / Revised: 21 December 2023 / Accepted: 22 December 2023 / Published: 9 January 2024
(This article belongs to the Special Issue Oceans from Space V)

Abstract

:
The Oceans from Space V Symposium, held in Venice, Italy, on 24–27 October 2022, devoted special sessions to sea level rise, as described by a series of satellite altimeters, and to remediations of consequent calamities in vulnerable mediterranean seas. It emerged that various aspects of climate change can be modelled in time as a Single Exponential Event (SEE), with a similar trend (a 54–year e–folding time) for CO2 concentration in the Earth’s atmosphere, global average sea surface temperature, and global average sea level. The sea level rise record, combining tide gauges data starting in 1850, as well as more recent altimeter data, for the last 30 years, is already 25 cm above historical values. If the curve continues to follow the exponential growth of the simple SEE model, it will reach about 40 cm by the year 2050, 1 m by 2100, and 2.5 m by 2150. As a result, dramatic impacts would be expected for most coastal areas in the next century. Decisive remediations, based on geo-engineering at the basin scale, are possible for semi-enclosed seas, such as the Mediterranean and Black Seas. Damming the Strait of Gibraltar would provide an alternative to the conclusion that coastal sites such as the City of Venice are inevitably doomed.

1. Introduction

A friend recently told me her son had bought a water-front lot, but was worried about building a cabin on it. He had heard alarming news about future sea level rise. She asked for my advice. All I could say was that the only way of knowing the future for certain is to wait and see, but in this case, we can be fairly sure of what the immediate future holds. I suggested her son go ahead and build his cabin, and enjoy the coast (his lot is on Hornby Island, British Columbia, along the magnificent Pacific coast of Canada), but to be prepared for a global rise of almost half-a-metre in the first half of this century, and a full metre rise, or even more, by 2100. Hornby Island is far from flat, and unless he has bought a coastal marsh, he should be able to handle this. For other parts of the world, the danger is much more immediate, and will have vastly greater impact”.
Sea level rise is now a common topic for routine talks, in the wake of a growing public concern for the impending consequences of climate change, and for scientific conferences alike, in search of a holistic approach to its causes, effects, and remedies. The Oceans from Space V Symposium [1], held in Venice, Italy, on 24–27 October 2022, was no exception. The conference, the fifth in a series held at 10-year intervals since 1980 (with the latest delayed two years by the COVID-19 pandemic), aimed to review progress in the use of satellites to study the oceans [2]. Special sessions were devoted to the assessment of sea level rise by virtue of altimetric techniques [3], as well as to possible remediations to the expected damages on the coastal environment of marginal and enclosed seas [4] (a subject to be reviewed by Appendix A, in particular for the special case of the Mediterranean Sea and Black Sea). At the same time, as in previous editions, attendees had a chance to witness first hand the increasing impact of sea level variations on the City of Venice, as well as the city’s response, most recently entrusted to the movable barriers of the MOSE (acronym of the Italian MOdulo Sperimentale Elettromeccanico, alluding in a secondary meaning to the biblical character Moses, or Mosè in Italian, who is credited for parting the sea), capable of sealing off the Venetian Lagoon from the Adriatic Sea, and now nearly operational [5].
Symposium participants were able to tour the MOSE control station, on the artificial island built in the middle of the Venetian Lagoon’s main opening on the Adriatic Sea, from which the system is operated (see Appendix B for details on Venice, its periodic floodings known as Acqua Alta, and the MOSE project). Raising the movable barriers from the bottom platform, they were told, can provide temporary defence against short-term flooding events, which are due to the combined effects of tides and wind. However, the MOSE is not designed to protect against the long-term sea level rise due to climate change. Taking inspiration from the MOSE field trip, the conference sessions devoted to altimetry and sea level rise were somewhat expanded to discuss (a) impacts of sea level rise on semi-enclosed marine basins, with the Mediterranean Sea and Black Sea providing the most classical of examples; (b) the ecological danger of widespread coastal reinforcements, which might be adopted in the effort to prevent erosion and flooding; and (c) possible future actions that might be undertaken to protect coastal sites, infrastructures and urban settlements, of which Venice represents the archetype. The present review aims to provide a record of the main presentations delivered during these sessions and of the ensuing discussion themes as a contribution to the development of a public debate, advocated by several conference participants.
Global average sea level is indeed rising at an alarming rate [6]. In general, the media tend to over-emphasize immediate dangers of climate change, recently presenting the Thwaites Glacier in Antarctica, e.g., as “Doomsday Glacier” [7], possibly able to raise sea level in steps, causing sudden floods at uncertain times. But, in fact, observations of global sea level rise have, up to present, closely followed an unambiguous growth rate, pointing inexorably upwards into the future. A target rise of about 1 m by 2100 seems to be generally agreed upon in the literature [8], and such a value implies an exponential increase. This can be represented by the Single Exponential Event (SEE) model introduced during the Oceans from Space V Symposium (to be set out in the following section), which climate change indicators appear to be following precisely, and which shows no sign of sudden surges, or of slowing down. The parameters considered here, atmospheric concentration of carbon dioxide (CO2), global mean Sea Surface Temperature (SST) and sea level can all be seen following the same trend (see Figure 1, Figure 2 and Figure 3). This analysis is discussed in the following, where some of the key factors related to the changing level of the oceans [9] are reviewed. The sea level record, as defined in the last few decades by a number of altimeter space missions [10], is also reviewed. Finally, the main aspects of the Oceans from Space V discussion on impacts and defenses foreseeable (for the Mediterranean basin) is reported. More details about the envisioned geo-engineering possibilities and problems, and the particular case of Venice, will be deferred to the closing Appendices.

2. Single Exponential Event Model

It is becoming increasingly evident that the world is facing a major climate change disaster [11], driven by the ever-growing concentration of greenhouse gases in the Earth’s atmosphere, attributable to anthropogenic causes [12]. The rate of change of atmospheric CO2 concentration can be simulated by a simple mathematical model of the expected (exponential) form, which also provides a good approximation for a number of related parameters (i.e., global average SST and sea level, as will be seen later in this section), with a comparable e-folding time. The SEE-type trend has been ascribed to the impact of increasing anthropogenic pressure, as already debated in the scientific literature for almost a century [13]. The initial tendency was partly driven by the surge in human population, which was exponential up to about 1990, but has been significantly slower since then [14]. Industrial development and CO2 production, however, have not slowed down. As a result, the Keeling Curve [15], plotted in Figure 1 as monthly averages of CO2 concentration, with annual cycle removed, together with a best fit exponential for comparison, continues to show the same growing trend, in spite of all international efforts, led by the United Nations (UN), aiming at the reduction of human-caused carbon emissions [16].
Such efforts formally got under way with the establishment of the United Nations Framework Convention on Climate Change (UNFCCC), following the “Earth Summit”—in fact, the United Nations Conference on Environment and Development (UNCED)—held in Rio de Janeiro, Brazil, in 1992 [17], and continued with the 1997 Kyoto Protocol [18] and its 2012 Doha Amendment [19]. More recently, the Paris Agreement, reached by the parties to the UNFCCC at the 21st Conference of the Parties (COP), held in Paris, France, in 2015, originated a five-year cycle of “increasingly ambitious climate action” carried out by participating countries [20]. As a consequence, since 2020, countries have been submitting their first national climate action plans, or Nationally Determined Contributions (NDCs). However, given the UN’s Intergovernamental Panel on Climate Change (IPCC) warning of “more severe climate change impacts, including more frequent and severe droughts, heatwaves and rainfall”, should global warming cross the 1.5 °C threshold, the 27th COP, held in Sharm el-Sheikh, Egypt, in 2022, called for accelerated action and requested parties to “revisit and strengthen the 2030 targets in their NDCs, to align with the Paris Agreement temperature goal by the end of 2023” [21]. But, in the meantime, CO2 concentrations shown by the Keeling Curve continue to rise, exhibiting the same exponential growth rate, with no effect apparent from these efforts.
Figure 1. The Keeling Curve, showing the 1956–2022 evolution of CO2 concentration [ppm] in the Earth’s atmosphere (red line: CO2 concentration monthly averages, seasonal cycle removed; public data obtained from [22]); compared to the best-fit exponential curve of the SEE model (black line).
Remotesensing 16 00262 g001

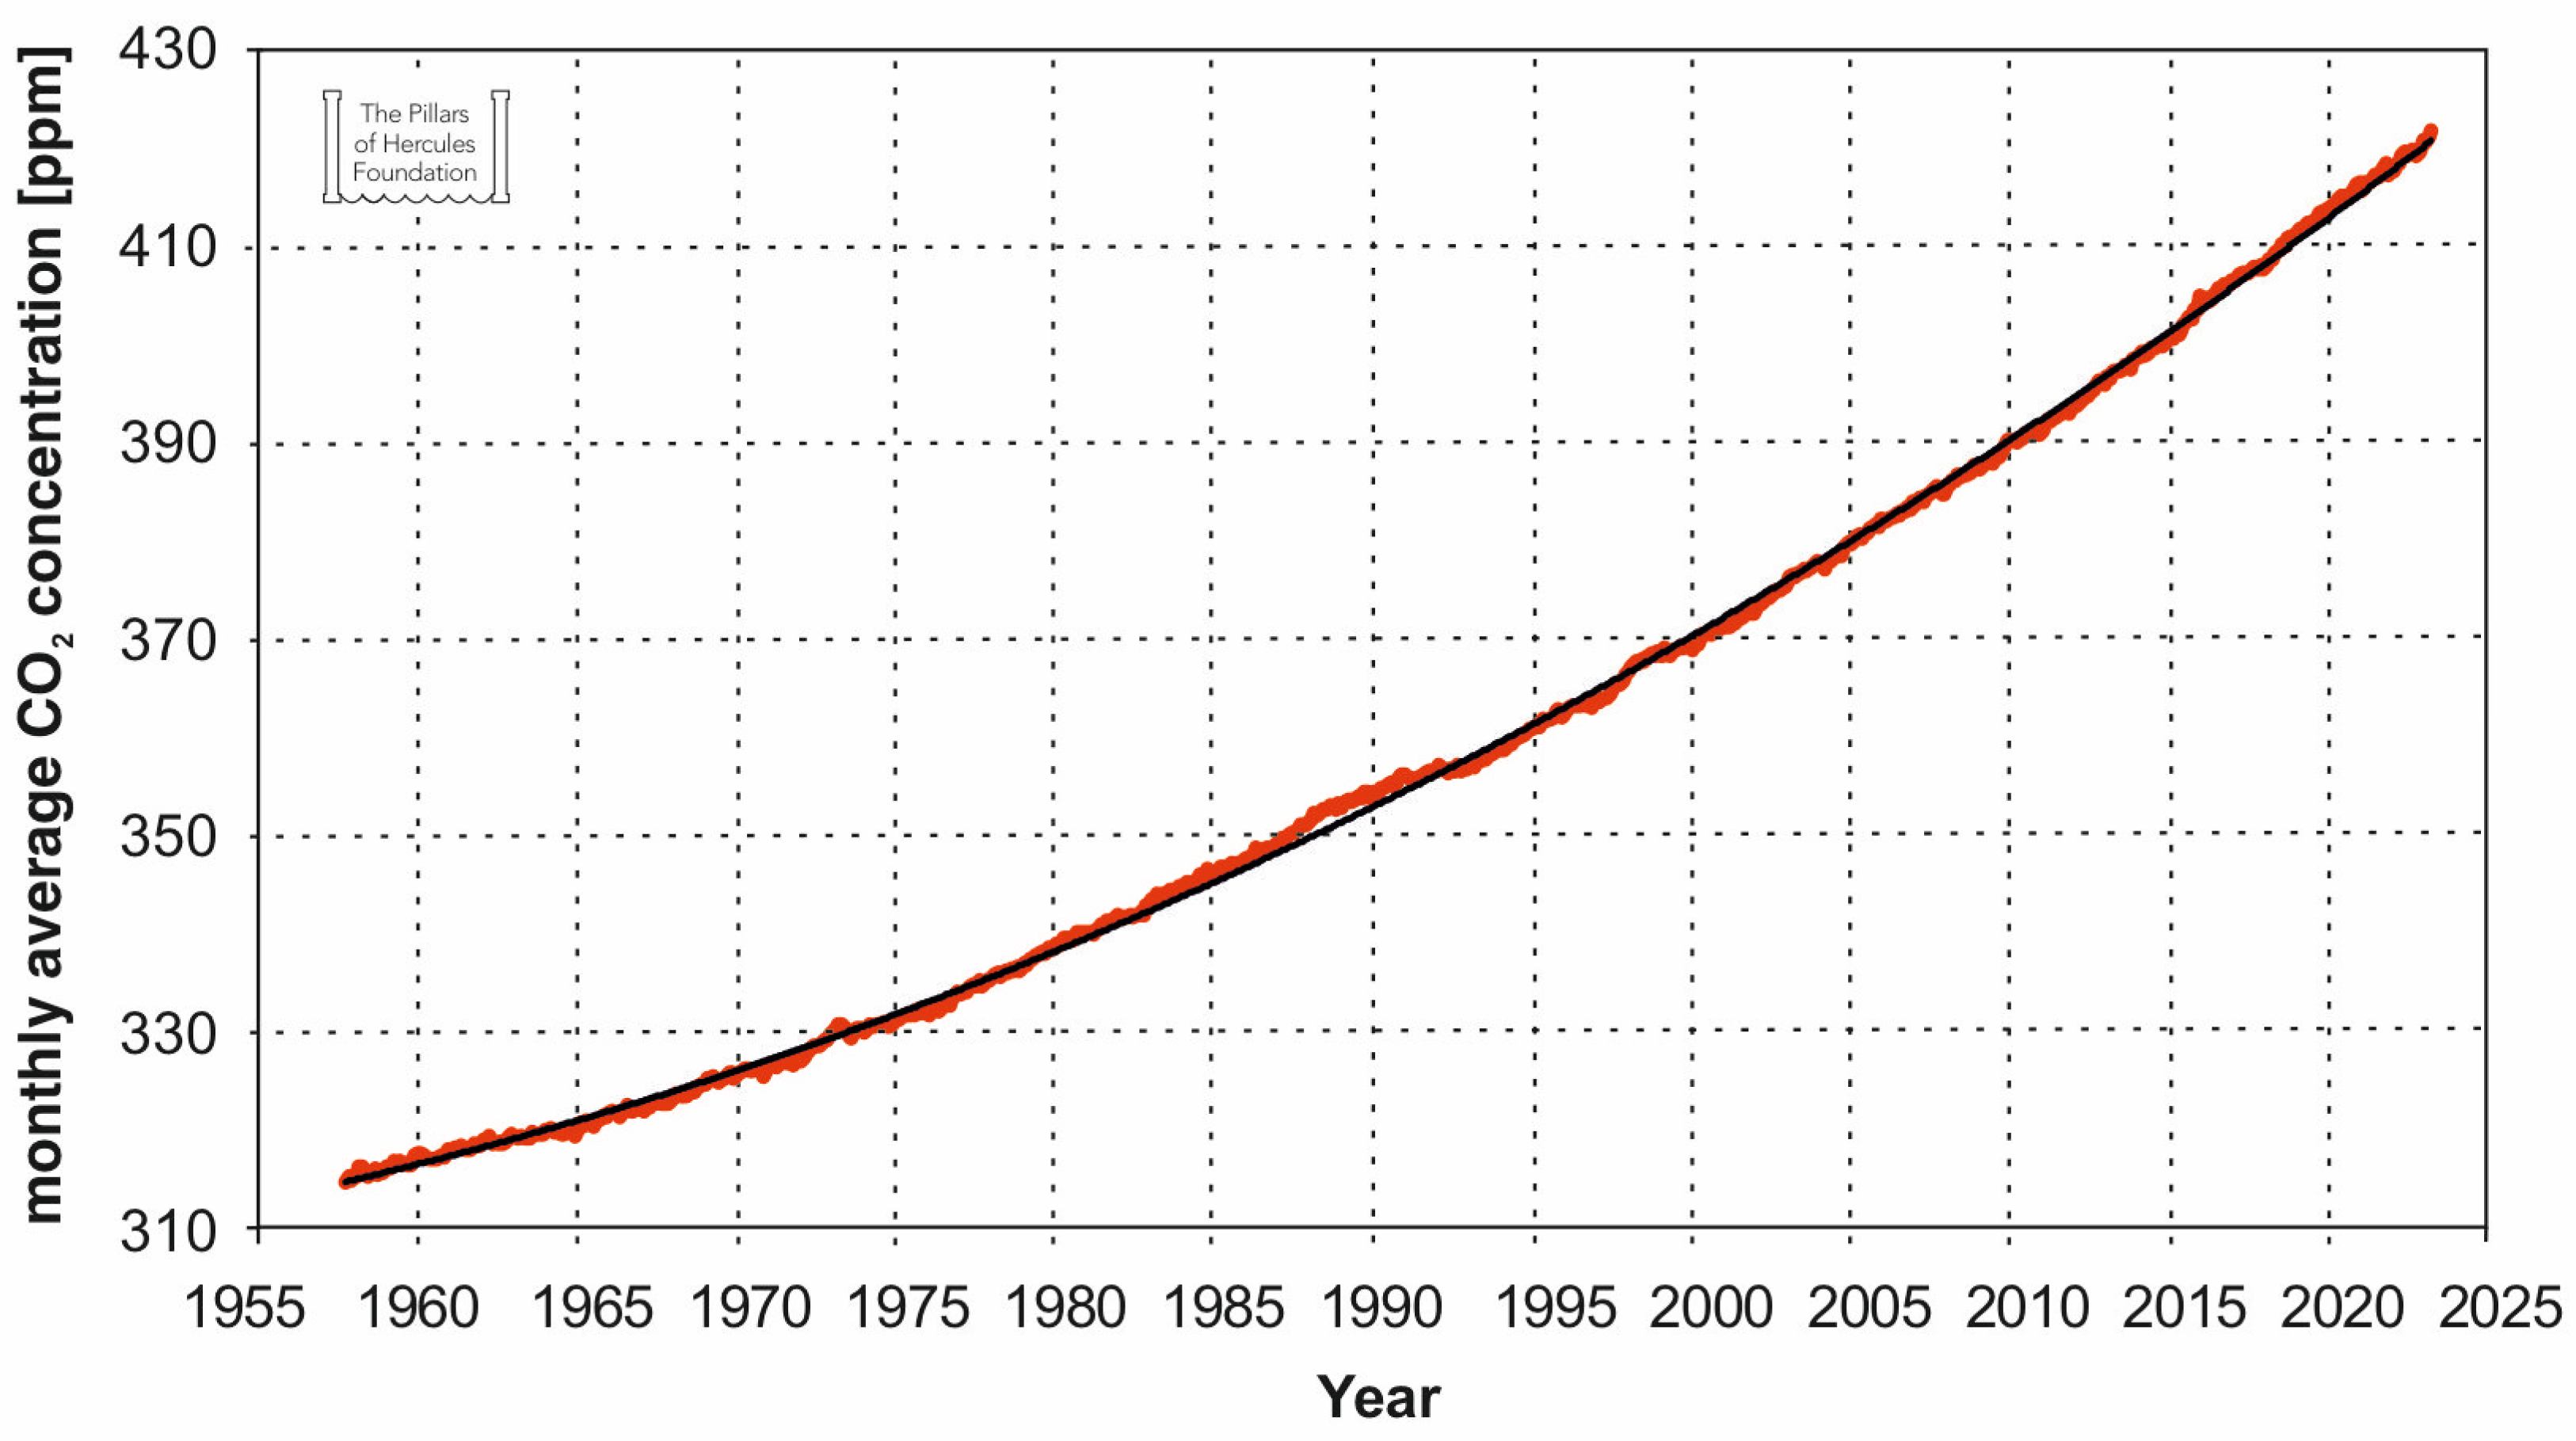
2.1. The Keeling Curve

Data collection at the Mauna Loa Observatory—located on the north flank of the Mauna Loa Volcano, on the Big Island of Hawaii, at an elevation of 3397 m above sea level—on which the Keeling Curve is based, started in 1958 and continues through the present, albeit from a nearby station, with updates published regularly [23]. Actual measurements at the original facility stopped following the late 2022 eruption of Mauna Loa’s Volcano, when a lava flow across the road leading to the site cut both access and power lines. Thanks to an emergency set-up, the same atmospheric sampling has been resumed at a temporary facility, using existing infrastructures on Maunakea, a dormant volcano located approximately 21 miles north of Mauna Loa [24]. Both observation points lie above the local marine temperature inversion layer, which separates the lower portions of the atmosphere from the above-standing cleaner troposphere. These remote locations, offering undisturbed conditions, with minimal influences of vegetation or human activity, are ideal for monitoring air constituents that can affect climate change. Thanks to the continuity of such measurements, well over 60 years of continuous CO2 observations are now available, showing occasional minor dips and bumps due to volcanic eruptions and El Niño events, but staying depressingly close to the same exponential, in spite of the growing concern about the Earth’s climate and the consequent UNFCCC-led actions recalled earlier in this section. So far, at least judging from the trend of the Keeling Curve, ongoing human activities apparently continue to generate the exponential greenhouse effect driving force [8]. The exponential best-fit, shown in Figure 1, gives an e-folding time of 54 years, with a baseline value of 269 ppm in the pre-industrial era, consistent with estimates of peak concentrations reached during warm interglacial periods in the last 800,000 years [25], based on Antarctic ice core data [26]. Concentrations have recently reached 420 ppm, 1.5 times the pre-industrial value. As of today, in 2023, the CO2 amount is still growing exponentially, with no signs of any significant down-turn. By the year 2100, the SEE scenario reaches a value of 905 ppm, over three times the pre-industrial level.
Figure 2. The 1850–2022 global monthly average SST anomaly [°C], as computed by the UK Hadley Centre, with 0.35 °C added to change anomaly reference date from the 1961 to 1990 period to the distant past (red line: SST anomaly monthly averages; HADSST4 public data set obtained from [27]); compared to the best-fit exponential curve, assuming the SEE 54-year e-folding time (black line).
Remotesensing 16 00262 g002

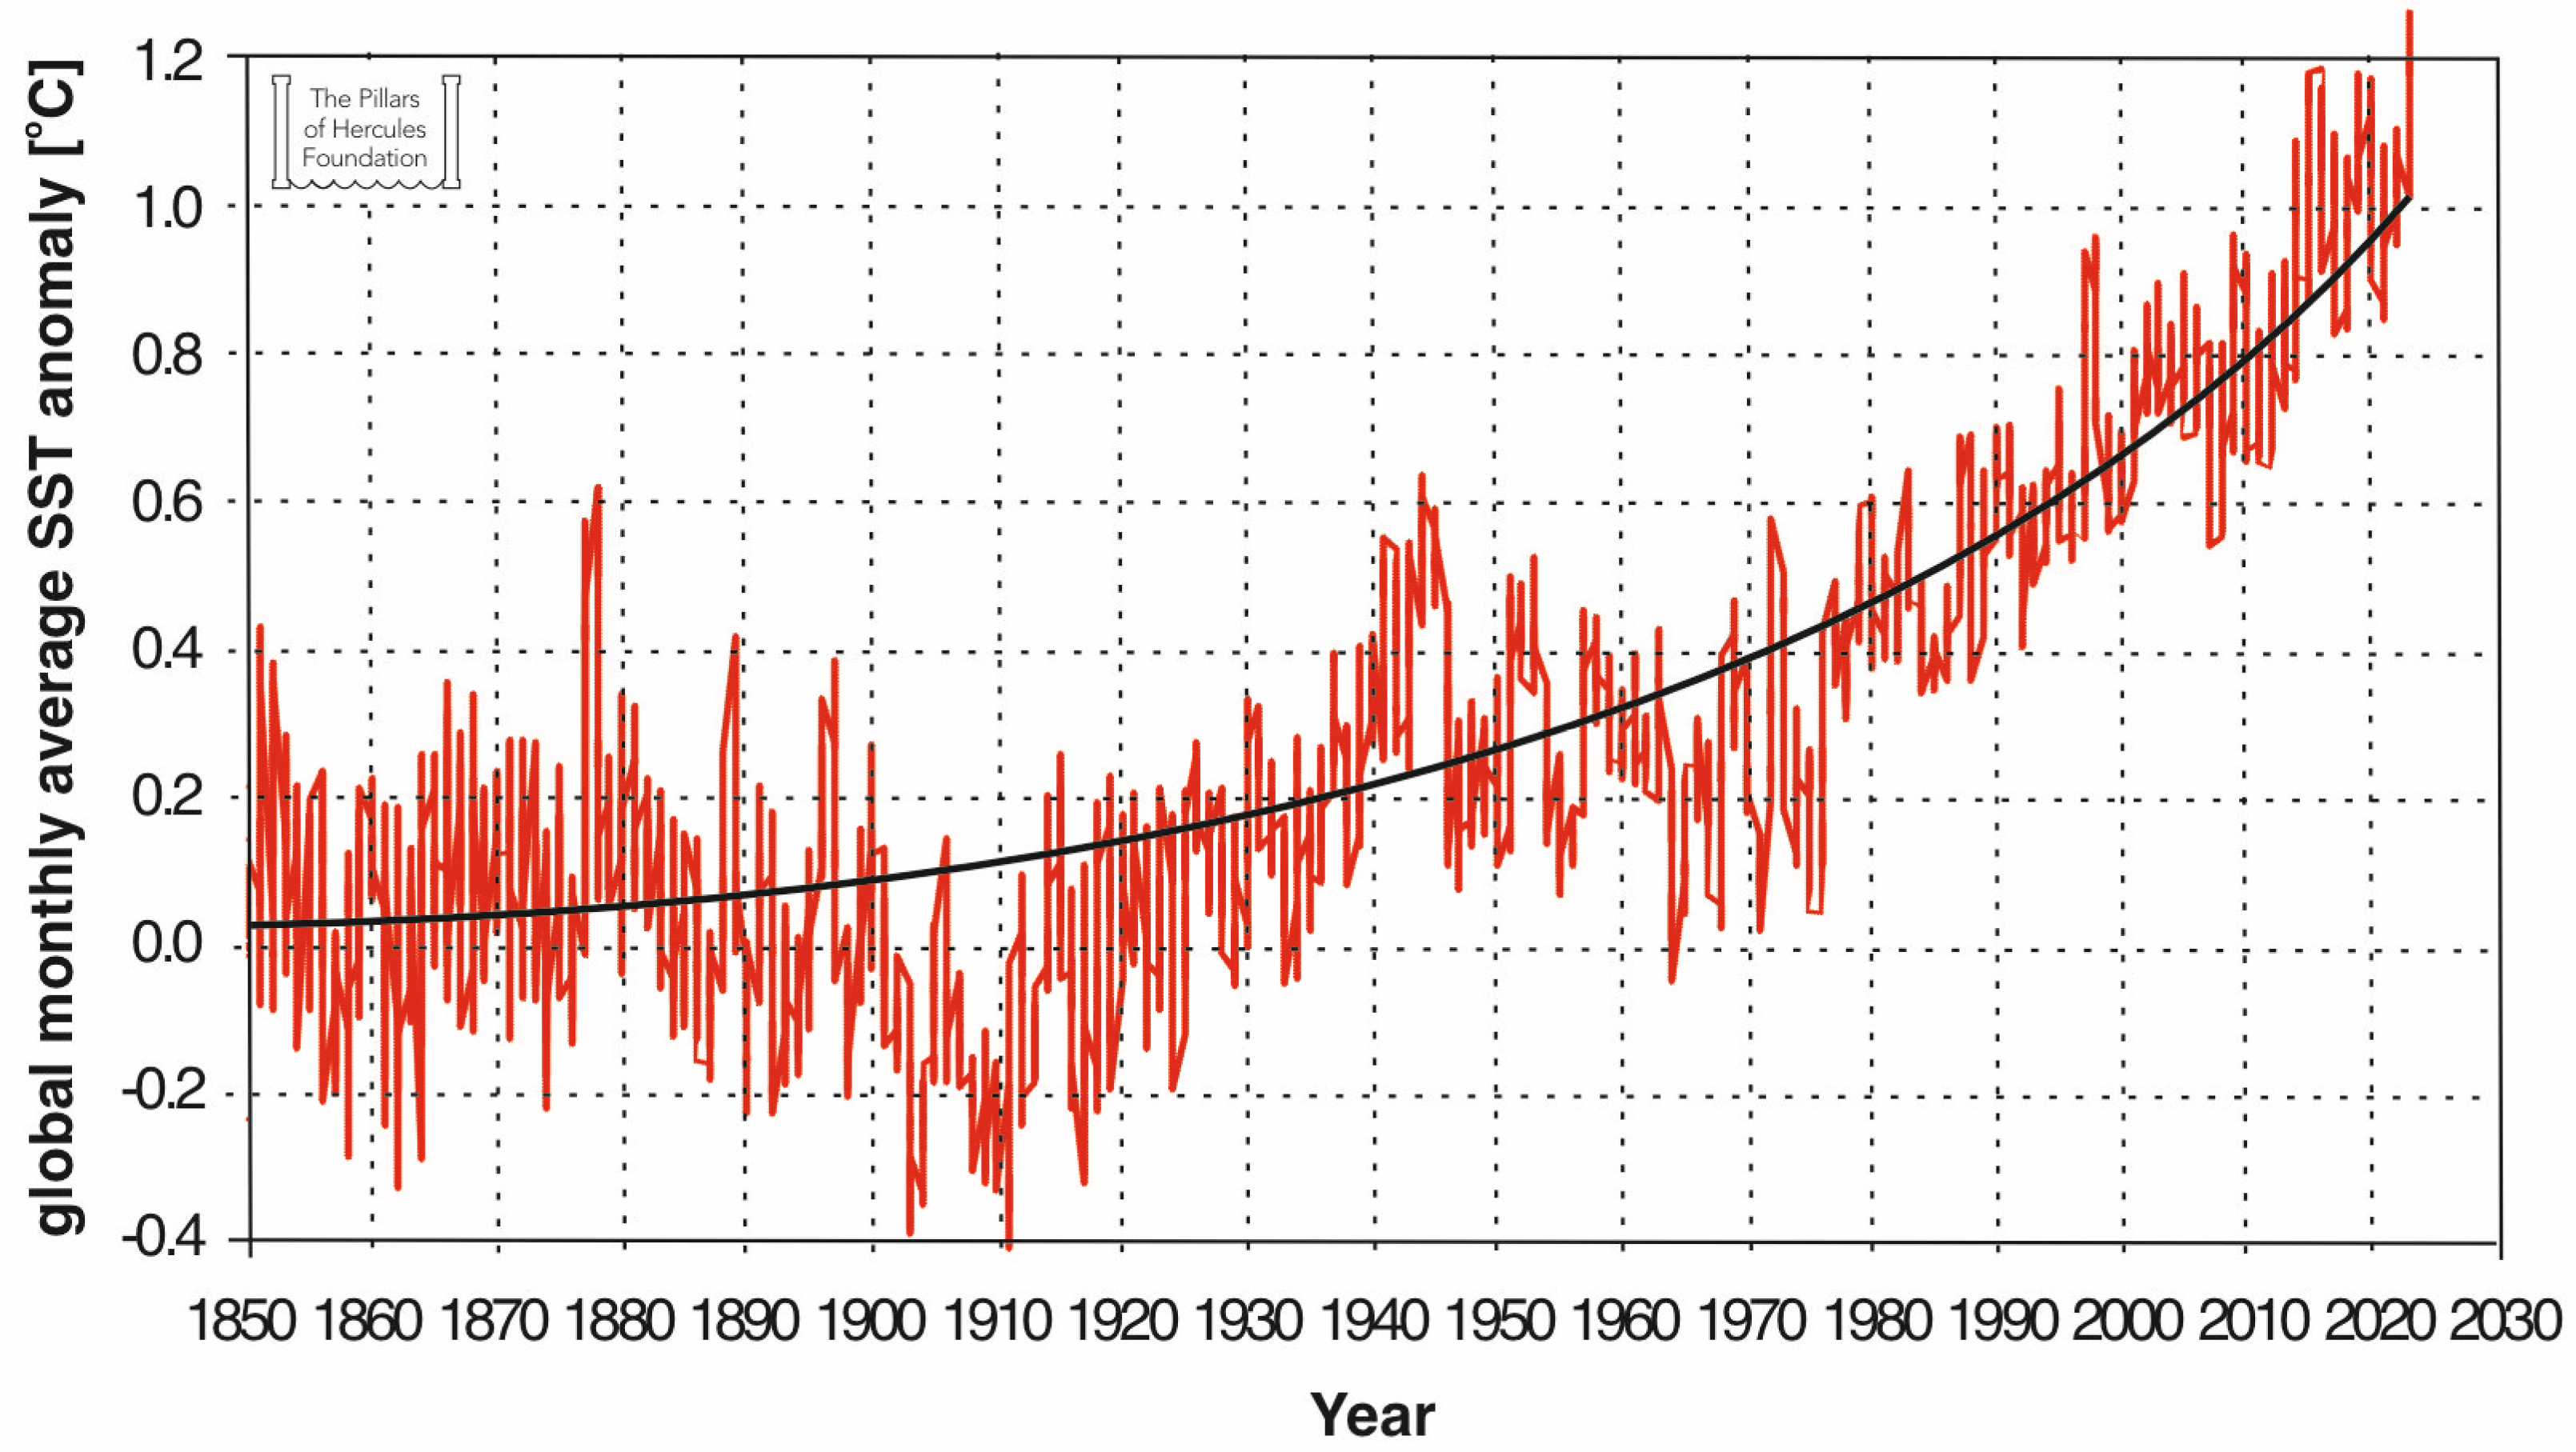
2.2. Global Average Sea Surface Temperature

In comparison to the Keeling Curve for CO2 concentration, the global average SST data from the UK Hadley Centre (HADSST4) shows more short-term and long-term variations [28], but with a longer data series, starting in 1850 (Figure 2). An exponential with an e-folding time of 54 years (also shown in Figure 2) again gives a good fit, with warming of 1.5 °C (the value that UN’s IPCC reports [29] warn not to exceed) by 2046, 2 °C by 2062, and just over 4 °C by 2100. If the SEE model is taken as a prediction, this is clearly the most significant change of all those affecting sea level rise, given the most recent record temperatures reached in some basins of the northern hemisphere (e.g., in the summer of 2023 for the Mediterranean Sea [30]). Continued exponential growth, to 10 °C in 2150 and 26 °C in 2200, represents a run-away greenhouse effect that would eventually sterilize the Earth, in a Venus-like fashion [31]. Indeed, additional sources of CO2, like the increasingly common wildfires raging in several regions of both the northern and southern hemispheres, must now be adding to the problem.

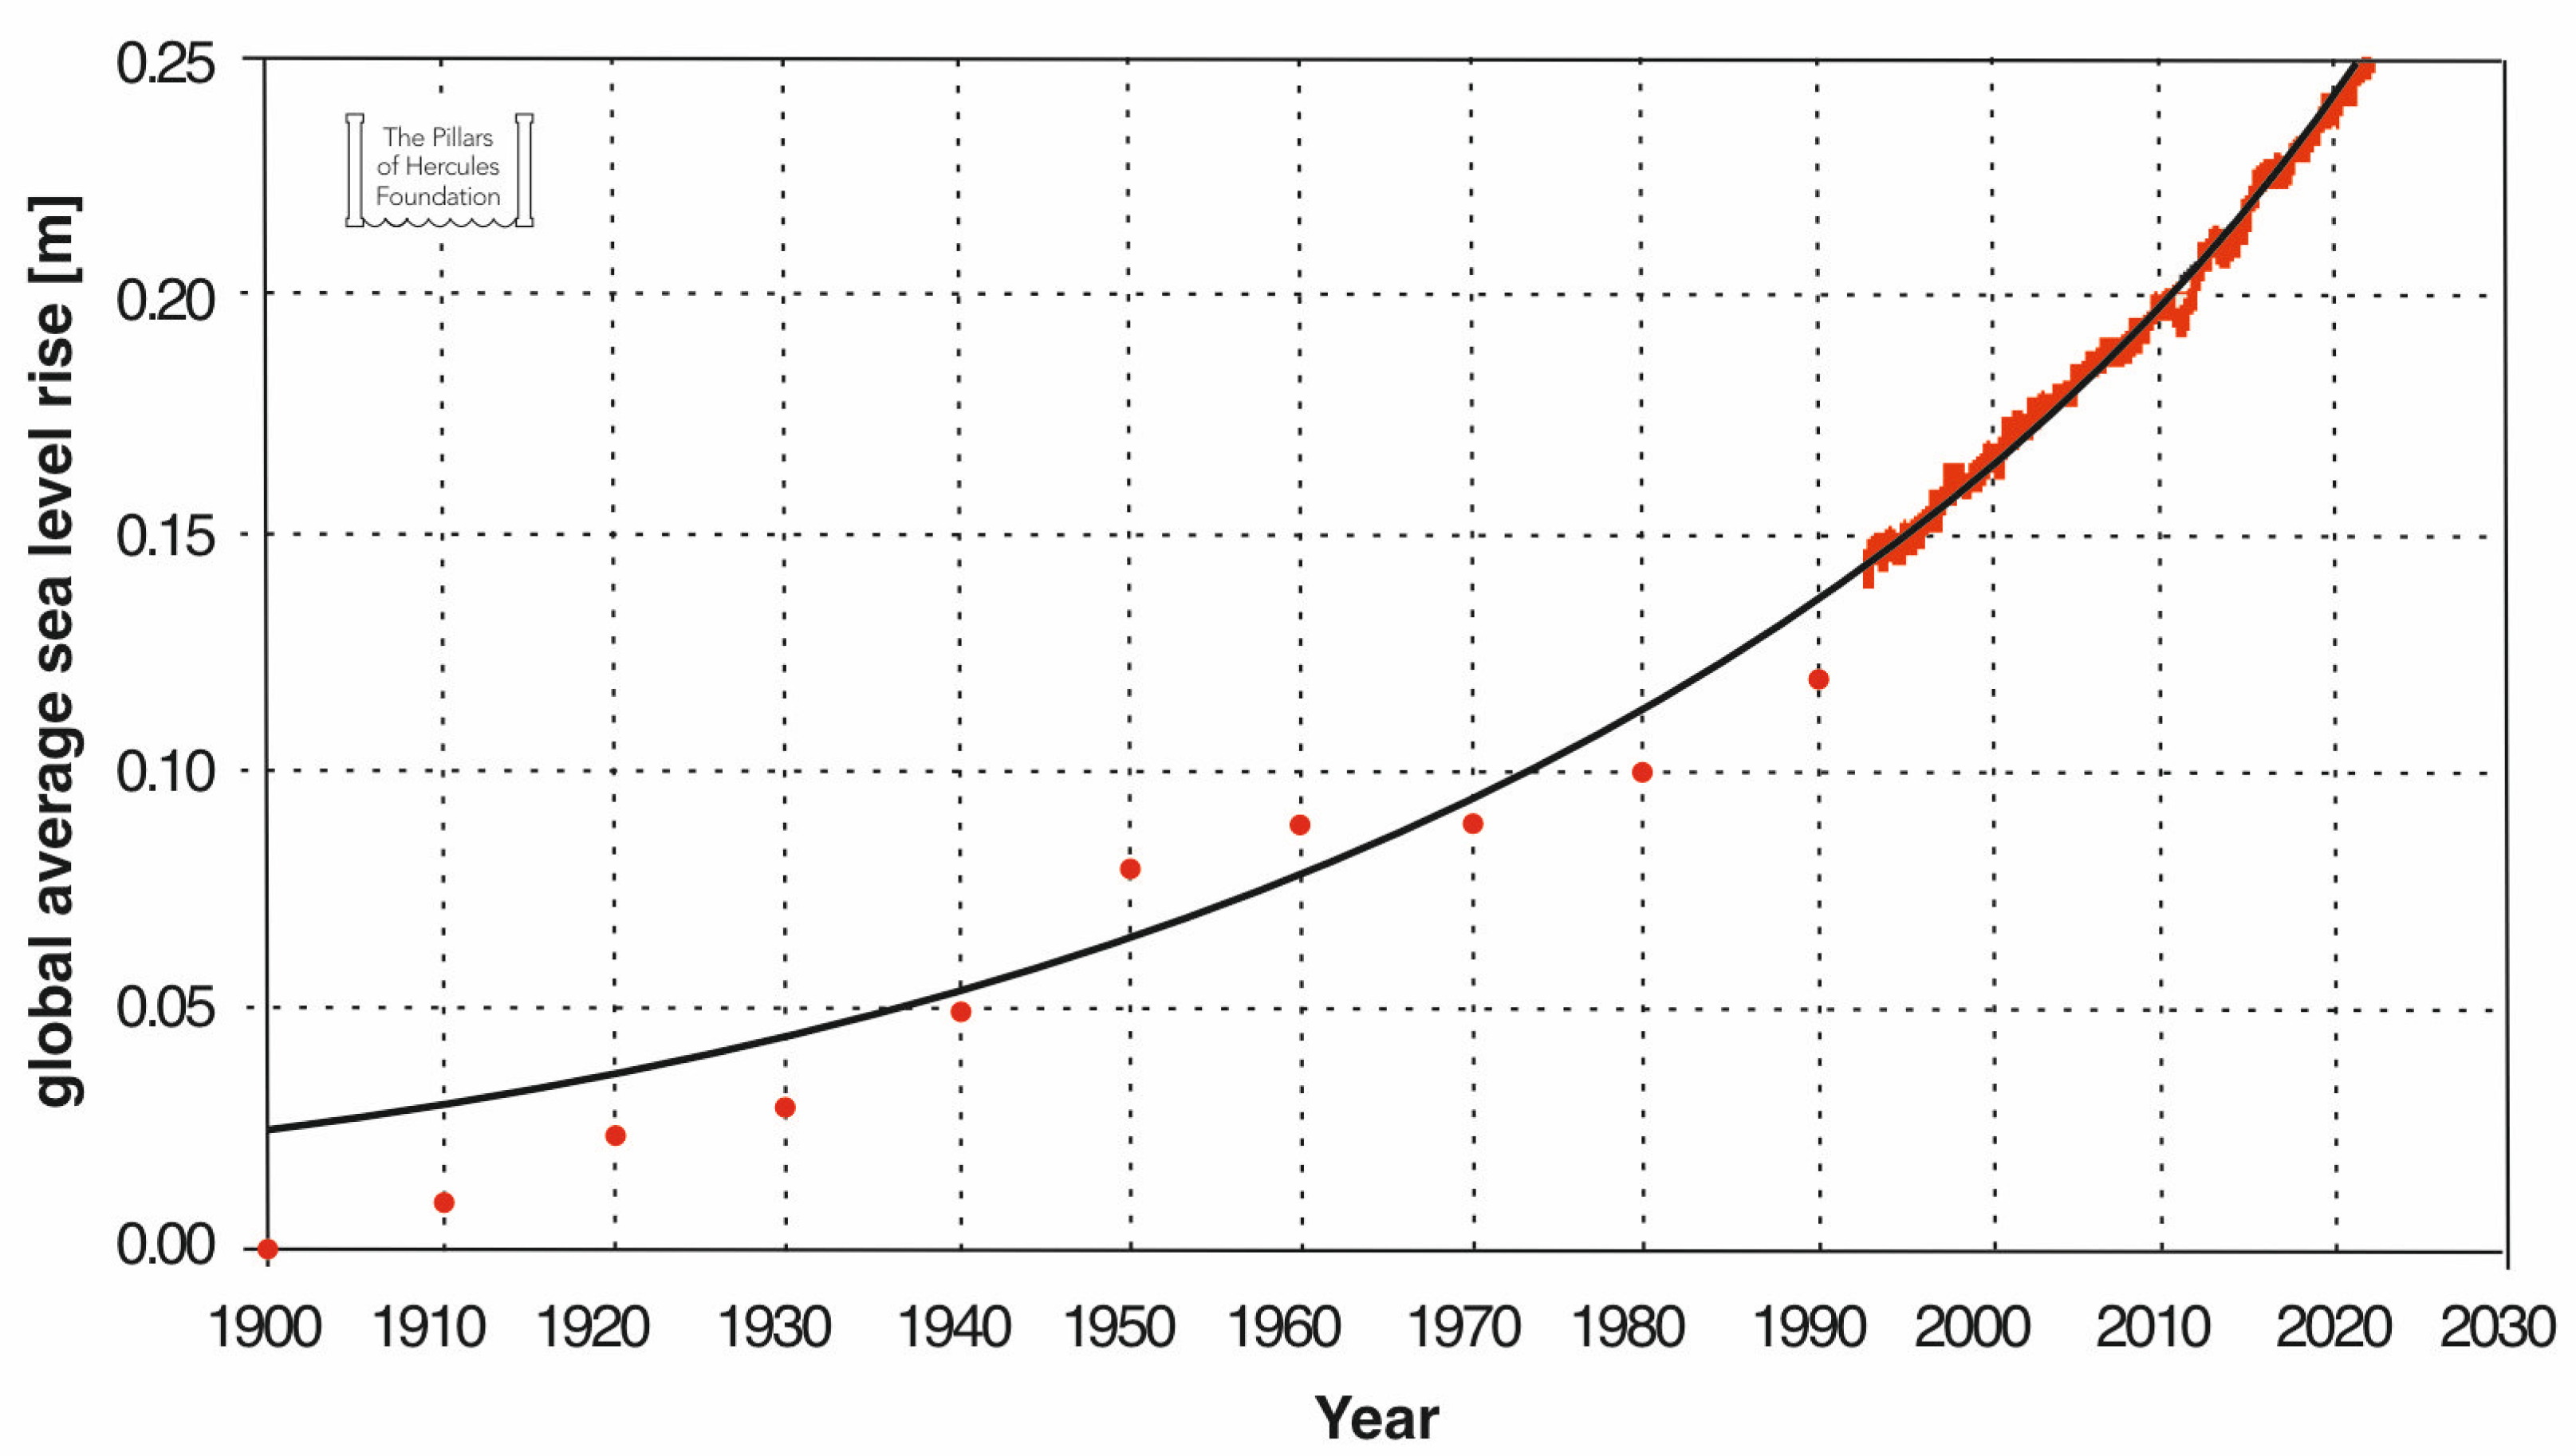
2.3. Global Average Sea Level

The global average sea level, as measured by satellite altimeters since the early 1990s [32], shows a similarly rising exponential curve (Figure 3), with the same e-folding time of about 54 years already introduced earlier. The more precise satellite data record is still rather short, so the e-folding time value is not yet well-determined, but the 54-year apparent figure is somewhat confirmed by the Reconstructed Sea Level [33], based on tide gauge data (also shown in Figure 3), going back to before 1900. The rise has amounted to 16 cm by the year 2000, and 24 cm by 2020; small amounts so far, but enough to start causing erosion and floods, locally and around the world [34]. The satellite altimeter data exhibit dips of up to 1 cm in years 2010 to 2016, which have been explained as large-area rain events, when water evaporated from the oceans has taken several months to flow back from land [35], but continues to follow rather precisely the SEE model. The difference between model and observed values for the period 1993 to 2022 shows a standard deviation of 2.5 mm, while the level has increased by 10 cm.
Figure 3. Global average sea level [m], as derived from tide gauge measurements before 1993 (red dots: reconstructed sea level based on [36], public data obtained from [37]), and by satellite altimeters after 1993 (red line: public data obtained from [38]), with 0.145 m added to change the height reference date from 1993; compared to the best-fit exponential curve (black line), assuming the SEE 54-year e-folding time.
Remotesensing 16 00262 g003
These numbers are starting to attract widespread attention, though the rise is not yet large enough to cause the alarm that it deserves. The SEE model represents a continuing exponential rise, to 1 m in 2100, 2.6 m in 2150, even to 6.6 m in 2200. Of course, there’s no way to be certain that the actual rise will continue to follow the model curve into the next century, but the present trend is clear and gives a good indication of what future to expect in the next few decades. If the model continues to be realistic, then sea level rise will have to be recognized as a really serious problem by the same national and international bodies mentioned above, which are now trying to reduce climate change, as well as by the general public at large (although global warming per se, rather than just rising sea levels, will probably continue to be the issue attracting the most attention).

3. Satellite Altimetry Data Record

Historical sea level changes cover a broad spectrum of space and time scales, resulting from complex processes taking place within the Earth system, as well as to external forcing due to both natural phenomena and anthropogenic factors [39]. In the last three decades, spaceborne instruments have detected accelerations in sea level rise, and in the evolution of other indicators of climate change, which are to be expected when the planet warms, based on current understanding of Earth’s history and climate physics [40]. Most of the observed global sea level rise (in excess of ≈3.3 mm/year, in the satellite measurements record; see following paragraphs) is estimated to come from the melting of land-based ice, which adds to the ocean’s volume (≈2.1 mm/year), and from the thermal expansion of ocean water as it warms (≈1.3 mm/year) [41]. Changes in land-water storage (e.g., due to the enlargement of surface reservoirs or the depletion of underground aquifers), as well as changes in global precipitation patterns, also make small contributions [42]. Vertical land motions, due to subsidence and/or to rebounding of the Earth’s crust since the end of the Last Glacial Maximum, contribute to site-specific, regional variations in sea level [43]. The amount and speed of sea level rise also varies by location, and from near-coastal to open ocean areas, mainly due to the Earth’s uneven distribution of mass, as well as to the changing physical properties of seawater and its dynamics [44]. In the present climate change context, both models and observations seem to agree that the dominant trend of sea level rise over most of the globe will follow the exponential increase exhibited by the global average curve (Figure 3). Prominent exceptions will occur wherever glacial isostatic adjustment is significant, either from the last ice age, as in Northern Europe, or from the ongoing land ice melting, over Greenland and Antarctica.

3.1. Relative Sea Level

Before the satellite altimetry era, tide gauges, which record the height of the water level with respect to a local land reference, were the only means to directly observe sea level variability [45]. Such measurements, limited to specific and unevenly distributed coastal sites, show relative changes due to the combination of absolute water level variations and local or regional vertical land movements. To derive absolute sea level changes from tide gauge records, these have to be corrected, in general by using global positioning systems [46]. Various methods are available to process tide gauge records over long periods and provide long-term mean values in which shorter-term variations are greatly reduced, so that local changes in sea level can be estimated to an accuracy at or below the cm level [47]. This renders the coverage of such in situ sensors invaluable, at least at their specific location, in following the evolution of average sea level, and of other coastal processes as well. The strong heterogeneity in tide gauge locations worldwide represents a main limitation at the global scale. Nevertheless, these data are also useful to validate numerical models and even to detect errors or drifts in altimeter datasets [48]. Reconstructed sea level data can also be obtained, combining the tide gauges data (and/or other in situ data) with satellite altimeters data, in order to estimate the pre-satellite era sea level. For example, an Empirical Orthogonal Function (EOF) can be fitted to the satellite record in order to generate an algorithm that uses tide gauge data back in time to extrapolate past global sea levels [49].

3.2. Geocentric Sea Level

Unlike tide gauges, satellite altimetry from the Earth’s orbit can provide a measure of geocentric sea level variations [50]. Altimeters map the sea surface by measuring the satellite-to-surface return travel time of successive radar pulses in order to determine the height of the satellite above the water, i.e., its altimetric range. The difference between altimetric range and satellite altitude above a reference surface gives the height of the sea surface with respect to the same reference surface. The altimetric range must be corrected to mitigate effects caused by atmospheric refraction, sea state, and instrumental biases; a number of corrections due to different geophysical effects are also taken into account [51]. The proximity of land contaminates the return signal of the altimeter, so algorithms are used to provide corrections in coastal zones [52]. The measurements are collected along the ground tracks, the projection of the altimeter orbits on the Earth’s surface, in any weather conditions and regardless of the time of overpass. Covering the oceans with repeated tracks, at repetition rates of some days, satellite altimeters can provide (quasi) global monitoring of sea surface height to an accuracy of 1 to 2 cm. Combining data from several satellites, by removing their respective biases, a continuous time series between mission can be obtained [53]. This provides unprecedented, detailed insights in the redistribution of water masses, thermal expansion and contraction, currents and eddies, thermohaline density variations, ocean–atmosphere coupling, and impact of fresh waters, including melting ice sheets and glaciers.

3.3. Satellite Altimeter Missions

For the last three decades, a string of diverse but coherent altimetry missions has been measuring routinely climate-related sea level dynamics, at both regional and global scales. A remarkable international group of space agencies is behind the realization of such a long-term series of satellite altimeters, and it includes the US National Aeronautics and Space Administration (NASA) and National Oceanographic and Atmospheric Administration (NOAA); the European Space Agency (ESA) and European Organisation for the Exploitation of Meteorological Satellites (EUMETSAT); the French Centre National d’Etudes Spatial (CNES); the Indian Space Research Organization (ISRO); the Canadian Space Agency (CSA); and the United Kingdom Space Agency (UKSA). Their early attempts to collect data on the structure of the sea surface, i.e., its elevation (with respect to the geoid) and roughness (as a function of winds, waves, wakes, slicks) started with the very first generation of ocean-viewing satellites, namely, Skylab in 1973 and Geos-3 in 1975 [54], carrying a suite of (active) microwave sensors, in particular altimeter and Synthetic Aperture Radar (SAR) prototypes. The 1978 SEASAT mission, also carrying a radar altimeter, as well as a number of other microwave sensors, explicitly aimed to validate the feasibility of global ocean monitoring by satellite, and to define the requirements of future operational satellite systems for ocean remote sensing [55].
More than a decade later, a series of follow-up quasi-operational altimeter missions begun to develop [56]. The sequence was initiated by the European ERS-1 and ERS-2, launched in 1991 and 1995, respectively, and by the American-French TOPEX/Poseidon, launched in 1992. American–European cooperative missions were continued by the Jason satellite series, i.e., Jason-1 in 2001, the Ocean Surface Topography Mission OSTM/Jason-2 in 2008, and Jason-3 in 2016. Next came the all-European Envisat, in 2002 [57]; the Indian-French altimetry mission SARAL/ALtiKa, launched in 2013 [58]; and, again, the European Sentinel 3A and Sentinel 3B, in 2016 and 2018, respectively; and Sentinel-6 Michael Freilich (S6MF) in 2020 [59]. Sentinel-3A and 3B (together with CryoSat-1, lost in 2005 due to a launch failure, and Cryosat-2, launched in 2010 [60]) were the first satellites to operate SAR (Delay-Doppler) mode altimeters, achieving major refinements, over both open ocean and coastal zone, improving the accuracy of measurements, mapping previously unresolvable features, and providing measurements closer to the coast than ever before. S6MF has ensured continuity of such observations. With the new digital altimeter technology and dedicated onboard processing of S6MF, more precise measurements of sea surface height are possible, as well as information on coastal ocean dynamics within a few kilometers of the coast.
Finally, the short-lived American–French, with Canadian and British contributions, Surface Water & Ocean Topography (SWOT) latest altimetry mission, with enhanced technologies for higher resolution data, was launched in late 2022 [61]. It will be followed by Sentinel-6B, scheduled for launch in 2025. SWOT, with new Ka band radar interferometer technology and a nadir altimeter, provided the first high-resolution measurements of both marine and other surface water features, obtained with a single satellite mission, resolving lakes of 250 m2 in size, rivers 100 m wide, and sub-mesoscale ocean features.
The current time series of global mean sea level rise has been created essentially using Topex/Poseidon, the three Jason series, and S6MF. These have produced the unique, long-term, continuous time series of data, constituting the later, post-1992 part of the graph shown in Figure 3 [62]. While the historical data record indicates that sea level rose by about 15 cm on average, between 1900 and 1993, the altimetry-based global mean sea level has risen on average at a rate of 3.3 ± 0.3 mm per year, between the years of 1993 and 2022. This corresponds to a post-1990 average increase of almost 10 cm over the following 30 years, clearly showing acceleration of the rise. Moreover, the altimeter-derived sea level rise has been around 2.6 mm per year, between 1993 and 2008, but the rate of rise has grown to 4.2 mm per year, considering the period from 2007 to 2022 [35].
The SEE model curve, shown in Figure 3, displays an exponential increase, which has reached 25 cm above pre-1900 values in 2022 and will reach 40 cm by the year 2050, followed by 1 m by 2100 and 2.5 m by 2150. Institutions responsible for satellite altimetry in both the US and Europe have in the past suggested a much more moderate rise by publicizing only the linear best-fit trend of the satellite record. Until this year, 2023, websites of the US NOAA [63], the University of Colorado [64], and the French AVISO [65] all prominently displayed only a linear rise rate, close to 3.5 mm per year. This gives a much less alarming picture, but promotes a value from 15 years in the past (mean date of the satellite record is 2008) and suggests linear extrapolation for future prediction, to about 50 cm by 2100 and 85 cm in 2200, much less than the rise suggested by exponential growth. The most recent update of the NOAA website now emphasizes acceleration, and the University of Colorado website links to this. Only the French AVISO website continues to promote the linear rise. Presumably, this will be updated soon.

4. Coastal Areas: Impacts and Defenses

In the next 10 to 100 years, the dramatic effects of global sea level rise are expected to seriously affect most of the world’s coastal regions (while in regions such as Greenland, or Antarctica, and nearby areas, the effects of significant glacial rebound will tend to prevail, as land ice melts so that loading plus gravitational attraction are removed). If the SEE scenario outlined above, showing exponential rates of sea level rise, continues to prove correct, then relatively soon, most of the world’s coasts, which are not natural rock, will be either heavily reinforced artificially, or heavily eroded. One implication is that most of the present beaches are going to be lost [66]—a perspective that might be acceptable, as long as the coastline’s changing structure were capable of evolving until it reaches a new equilibrium. But, of course, concern arises for the consequent anthropogenic stiffening of coastal environments, artificially reinforced or outright covered with concrete, to protect existing formations, which hinders the natural system’s ability to adjust and adapt to the changes. In addition, there exist already large amounts of coastal infrastructures, along several stretches of coastline, worth retaining for environmental, cultural, or economic reasons (e.g., the City of Venice). A widespread discussion should be initiated on possible actions to be taken, including how to preserve some unchanged, natural coastline for future generations, as well as how to plan the future of presently modified coastline, which will have to be either abandoned or defended.
While sea level rise impacts and responses will need to be considered for all shorelines worldwide, the coastal areas of marginal and enclosed seas, especially those exhibiting high residential density, abundance of historical and cultural sites, and great economic value, due to local maritime activities such as tourism, commerce, transportation, aquaculture and fisheries, will represent special cases to be notably considered. The cluster of semi-enclosed basins in the Mediterranean region (Figure 4) embodies such a critical hotspot, where geography and history combine to create the cradle of (western) civilization [67]. At the same time, the basins’ morphology offers an almost unique opportunity to study possible remediations to uncontrolled sea level rise, which near Gibraltar will be close to the global average [44], based on environmental engineering at the basin scale. A possible solution—proposed at the Oceans from Space V Symposium—to provide long-term, sustainable, and possibly affordable protection for all coastlines of the Mediterranean Sea, and Black Sea as well in fact, would be to close the Strait of Gibraltar with a dam, thereby regulating the water through-flow to and from the Atlantic Ocean and ultimately controlling sea level within the whole basin.
The notion of a Gibraltar Dam is not new. In the 1930s, for example, such a dam was proposed by Herman Sörgel as part of the Atlantropa Project, designed to lower the Mediterranean Sea level by up to 200 m, in order to gain new coastal lands and allow power generation from the resulting inflow at Gibraltar and the Bosphorous [68]. In 1958, Scientific American published an article by Henry Stommel, which mentioned the ‘‘entertaining fantasy’’ of controlling climate by building a Gibraltar Dam, blocking the deep outflow from the Mediterranean Sea and thus achieving climatic modifications that might possibly improve the planet for human habitation [69]. In 1977, a controversial paper by Roger Johnson, published in the EOS Transactions of the American Geophysical Union (AGU), claimed that damming the Strait of Gibraltar would prevent the onset of a new ice age, triggered by an increased salt outflow from the Mediterranean Sea, which in turn was a consequence of building the Aswan Dam on the river Nile [70]. More recently, in 2015, a precursor of the present review, published in Natural Hazards, revived the issue by advocating “a sea surface height control dam at the Strait of Gibraltar”, aimed to stabilize the Mediterranean Sea and Black Sea at the present level, thus preventing the future loss of countless coastal sites of great economic and cultural value [71]. The debate was resumed once again at Oceans from Space V, during two ad hoc Sea Level Rise sessions, foreseen by the Symposium program for this very purpose, of which the present review constitutes a concise report.
The Strait of Gibraltar has been blocked in the process of continental drift, during the Messinian stage (the uppermost stage of the Miocene, in the geologic timescale), between 7.2 and 5.3 million years ago (Ma), with catastrophic consequences for the marine environment of the inner basins [72]. In the latter part of this stage, the connection between Atlantic Ocean and Mediterranean Sea was progressively restricted by tectonic movements, until its total closure during the Messinian salinity crisis, starting from 5.9 Ma [73]. Consequently, the Mediterranean basin went into a cycle of repeated partial desiccations, turning into a deep desert surrounding a number of residual extensive brine pools. After the Strait of Gibraltar precursor closed for the last time, around 5.6 Ma, the Mediterranean basin dried out almost completely within a thousand years [74]. The Messinian salinity crisis ended 5.3 Ma, when the Atlantic breached the closure once again and rapidly filled up the Mediterranean basin in what is known as the Zanclean flood [75].
A modern, artificial closure of the Strait of Gibraltar would require a careful evaluation of its effects, difficult international agreements, long realization plans, and relatively high costs (see [71] and references therein). If such a project could ever be realized, the long-term stability of water levels, as well as of the resulting new environmental equilibrium, would require an appropriate water flow management. Both positive and negative effects would result. On the positive side, the closure would allow an effective regulation of sea level and provide coastal protection throughout the inner basins, as well as a significant power generation potential and a land link between Europe and Africa. Adverse effects would include still unknown results of limiting the water exchange with the Atlantic Ocean; rising salinity in the Mediterranean Sea and possibly stronger stratification in the Black Sea; changes in nutrient cycling and ensuing ecological repercussions, including disrupted migration patterns of various species; and the need for maritime traffic to go through locks at both Gibraltar and Suez. No particular intervention would be required for the Black Sea sub-basin, where no alternative protection could be obtained by damming the Bosphorous, since the large freshwater inflow would eventually, and rather quickly, raise the water level. Appendix A offers a summary of this entire topic, as discussed during the Sea Level Rise sessions at Oceans from Space V, together with additional details and proper referencing for most of the issues above.
The general idea of responding to the effects of climate change with some form of “geo-engineering”—where a negative connotation might be given to the idea of solving a human-induced problem by tampering even more with nature, only to cause even worse side effects [76]—leads to important ethical considerations. Indeed, any plan for large-scale interference with Earth sub-systems implies the risk of unintentional disruptions of some natural balance and may result in a dilemma that such disruptions could be more damaging than the very damage they were meant to offset. Some geo-engineering proposals, in particular when related to climate change remediation, have been highly controversial, due to the large uncertainties about their effectiveness, their possible side effects, and just the outright possibility of unforeseen consequences [77]. However, the risks of adopting such interventions must be seen, eventually, in the context of the outcome of continuing climate change without them [78]. The proposed Gibraltar Dam does represent a major modification of environmental equilibria, but this is in response to the on-going global, albeit unplanned, “geo-engineering” that has so significantly increased the CO2 concentration in the Earth’s atmosphere and altered the climate in the first place.
A second ethical point to be noted is that a group of countries could unilaterally implement geo-engineering plans, which may be beneficial for themselves, but hurt others. Damming the Strait of Gibraltar to lower sea level in the Mediterranean basin would help riparian countries to safeguard their coastlines, and ease expected problems [79], but it would impose some level of hardship on low-lying countries in the rest of the world. In fact, should the Mediterranean Sea level stop rising in the future, the global ocean rise rate would increase by 0.8% (corresponding to the Mediterranean basin’s share of the world’s ocean area). This seems a relatively small fractional increase, but in principle it would add to the existing sea level problem worldwide (e.g., an 8 mm rise in global sea level for a drop of 1 m in Mediterranean Sea level). In this respect, the construction of a Gibraltar Dam has been labeled as “colonial” geo-engineering, in that Mediterranean countries would protect themselves at the expense of other countries, which would simply have to suffer the consequences of such imposition. This argument could be rejected on the basis of its relative scale: in fact, if even a microscopic rise is forbidden, then all flood protection becomes illegal, as in all cases water is being diverted to somewhere else, only to become somebody else’s problem. Moreover, the Mediterranean basin is the only large marine area that could be dammed in this way (with the exception perhaps of the Red Sea and the Persian Gulf, although similar measures have been proposed also for the North Sea and Baltic Sea [80]), so there is little danger that similar solutions would proliferate, though major coastal defenses must be expected elsewhere, around the world. And, in the end, the whole climate change problem could be called “colonial”, in that an initially small group of developed countries have already discharged their CO2 waste into the Earth’s atmosphere to further increase their own economic development, causing hardship to all (including themselves).

5. Concluding Remarks

The unfolding changes in the Earth’s climate due to greenhouse gases emissions will have enduring consequences for the natural ecosystem—which, in some cases, may last up to one hundred thousand years [81]. They will also have immediate effects on human society. So far, commitments to cut emissions have proven unable to achieve the goals set by international agreements [82], so that various kinds of interim measures have been proposed [83]. While reducing emissions remains the foremost immediate priority, at least in the (very) long run, contingency plans would also be advisable to deal with the resulting changes that are already in progress, including sea level rise [84]. Instead of trying to modify the entire Earth’s climate, though, as some of the geo-engineering plans recalled earlier would do, perhaps locally targeted interventions should be employed, aimed at specific high-leverage locations [85]. For sea level rise, future actions may encompass both traditional coastal protection and focused, regional, basin-scale geo-engineering.
As discussed at Oceans from Space V (more information on the conference and its contents can be obtained as indicated in the Supplementary Materials endnote), the simple SEE model proposes that climate change can be represented as a single exponential event in time, with a similar shape (a 54-year e-folding time) for indicators such as CO2 concentration, average global SST, and global average sea level as well. An international suite of satellite altimeter missions has contributed a continuous 30-year time series to the long-term record of sea level observations. So far, the altimetry component indicates that global average sea level is rising at an increasing rate, and this suggests that the exponential increase, which has already reached 25 cm above historic values, will climb to about 40 cm by the year 2050, 1 m by 2100, and 2.5 m by 2150. Future satellite missions will help clarify the issue by extending the data record into the next decade and beyond [86]. Measurements at higher resolution and closer to coastlines, where the impact of level rise on coastal communities and infrastructures is expected to be the most significant, will also have relevance. But for now, the global altimeter measurements closely follow a growing exponential, indicative of a runaway greenhouse effect. Should this continue to be true, big changes are to be expected for the world’s coastal regions [87]. To bring this situation back under control, at some point in the next two decades a concrete response will be required, in order for the curves of the various indicators to start bending down, below the present growth rate. This may include ambitious, possibly even daring, regional geo-engineering plans, to ensure that coastal icons such as the city of Venice may be spared.
Of course, managing sea level rise at its very source, mitigating and then reversing climate change by reducing the concentration of CO2 in the Earth’s atmosphere, offers the advantage of benefiting the entire planet, while a management strategy that aims just at local coastal protection represents an every-man-for-himself approach that may leave others behind. But still, local, targeted interventions, focusing on specific areas, do offer a softer alternative to global-scale geo-engineering. With enough research on all aspects of the proposal, it is plausible that damming the Strait of Gibraltar may prove itself as a solution that is both effective and achievable in order to protect in a single stroke the whole Mediterranean and Black Seas. A large amount of data collection, modeling, planning, testing, as well as of technological and logistical development, not to mention public discussion and political debate, will be needed before such a project is undertaken. The hypothesis that emerged from the Oceans from Space V debate, reported here (Appendices A and B) in some detail, can only be the starting point for a long incremental process of design upgrades that will be required, before the international community can agree on the merits of such a solution. Perhaps, after careful consideration, basin-scale geo-engineering may reveal to be not so viable, after all, while site-specific coastal protection, coupled to inland retreat where no protection measures would prove feasible or economical, may emerge as the proper answer. We shall SEE …

Author Contributions

This paper is based on a series of private communications provided by J.G., later complemented with additional material and structured in the present form by V.B. All authors have read and agreed to the published version of the manuscript.

Funding

This research received no external funding.

Data Availability Statement

No new data were created or analyzed in this study. Data sharing is not applicable to this article.

Acknowledgments

Special thanks are due to A. Filipkowska, Technical Advisor, The Pillars of Hercules Foundation, for her invaluable help in the realization of the graphical part of this paper. Appreciation is expressed also to five anonymous reviewers for their contribution to the substantial improvement of the original manuscript. Finally, the authors are in debt with the “Oceans from Space V” Symposium attendees, who participated in the Sea Level Rise sessions and the ensuing discussions, from which this paper originates. “Oceans from Space V”, scheduled for 2020, but delayed for 2 years due to the COVID-19 pandemic, and finally convened in Venice, Italy, on 24–27 October 2022, has been the latest event in a conference series held at 10-year intervals since 1980 to review uses of remote sensing from Earth’s orbit in the study of the oceans.

Conflicts of Interest

The authors declare no conflicts of interest.

Appendix A

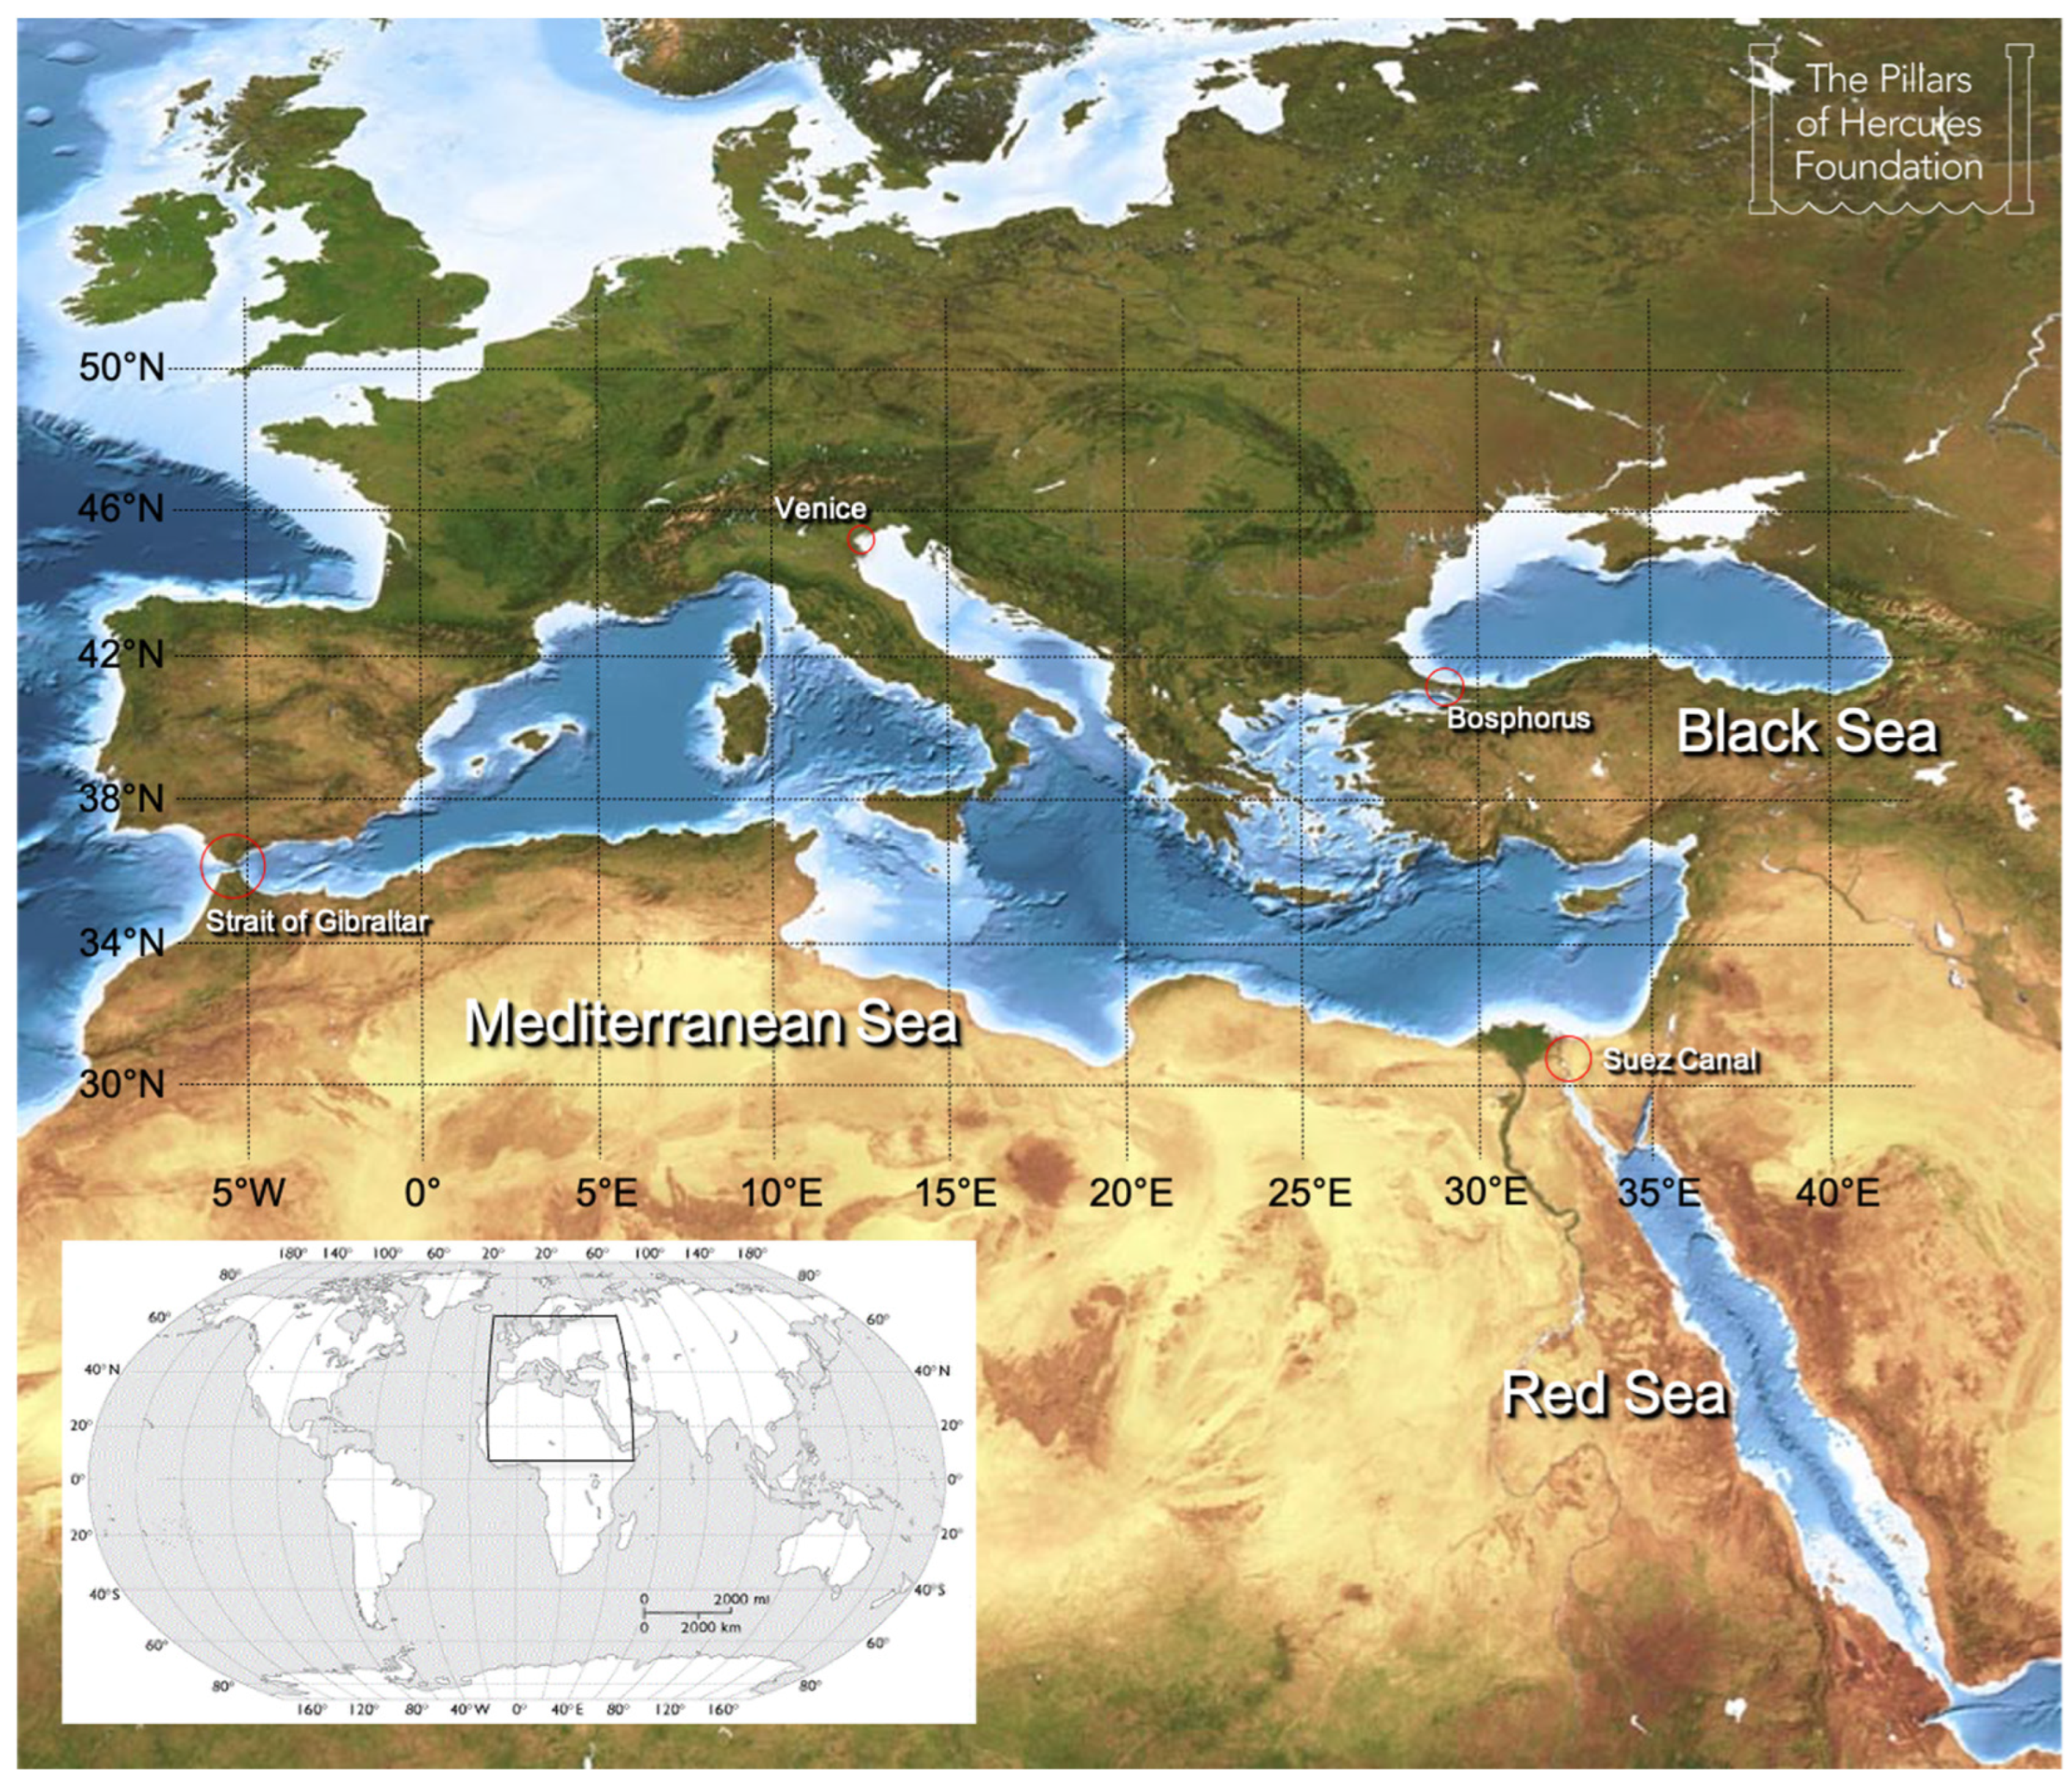
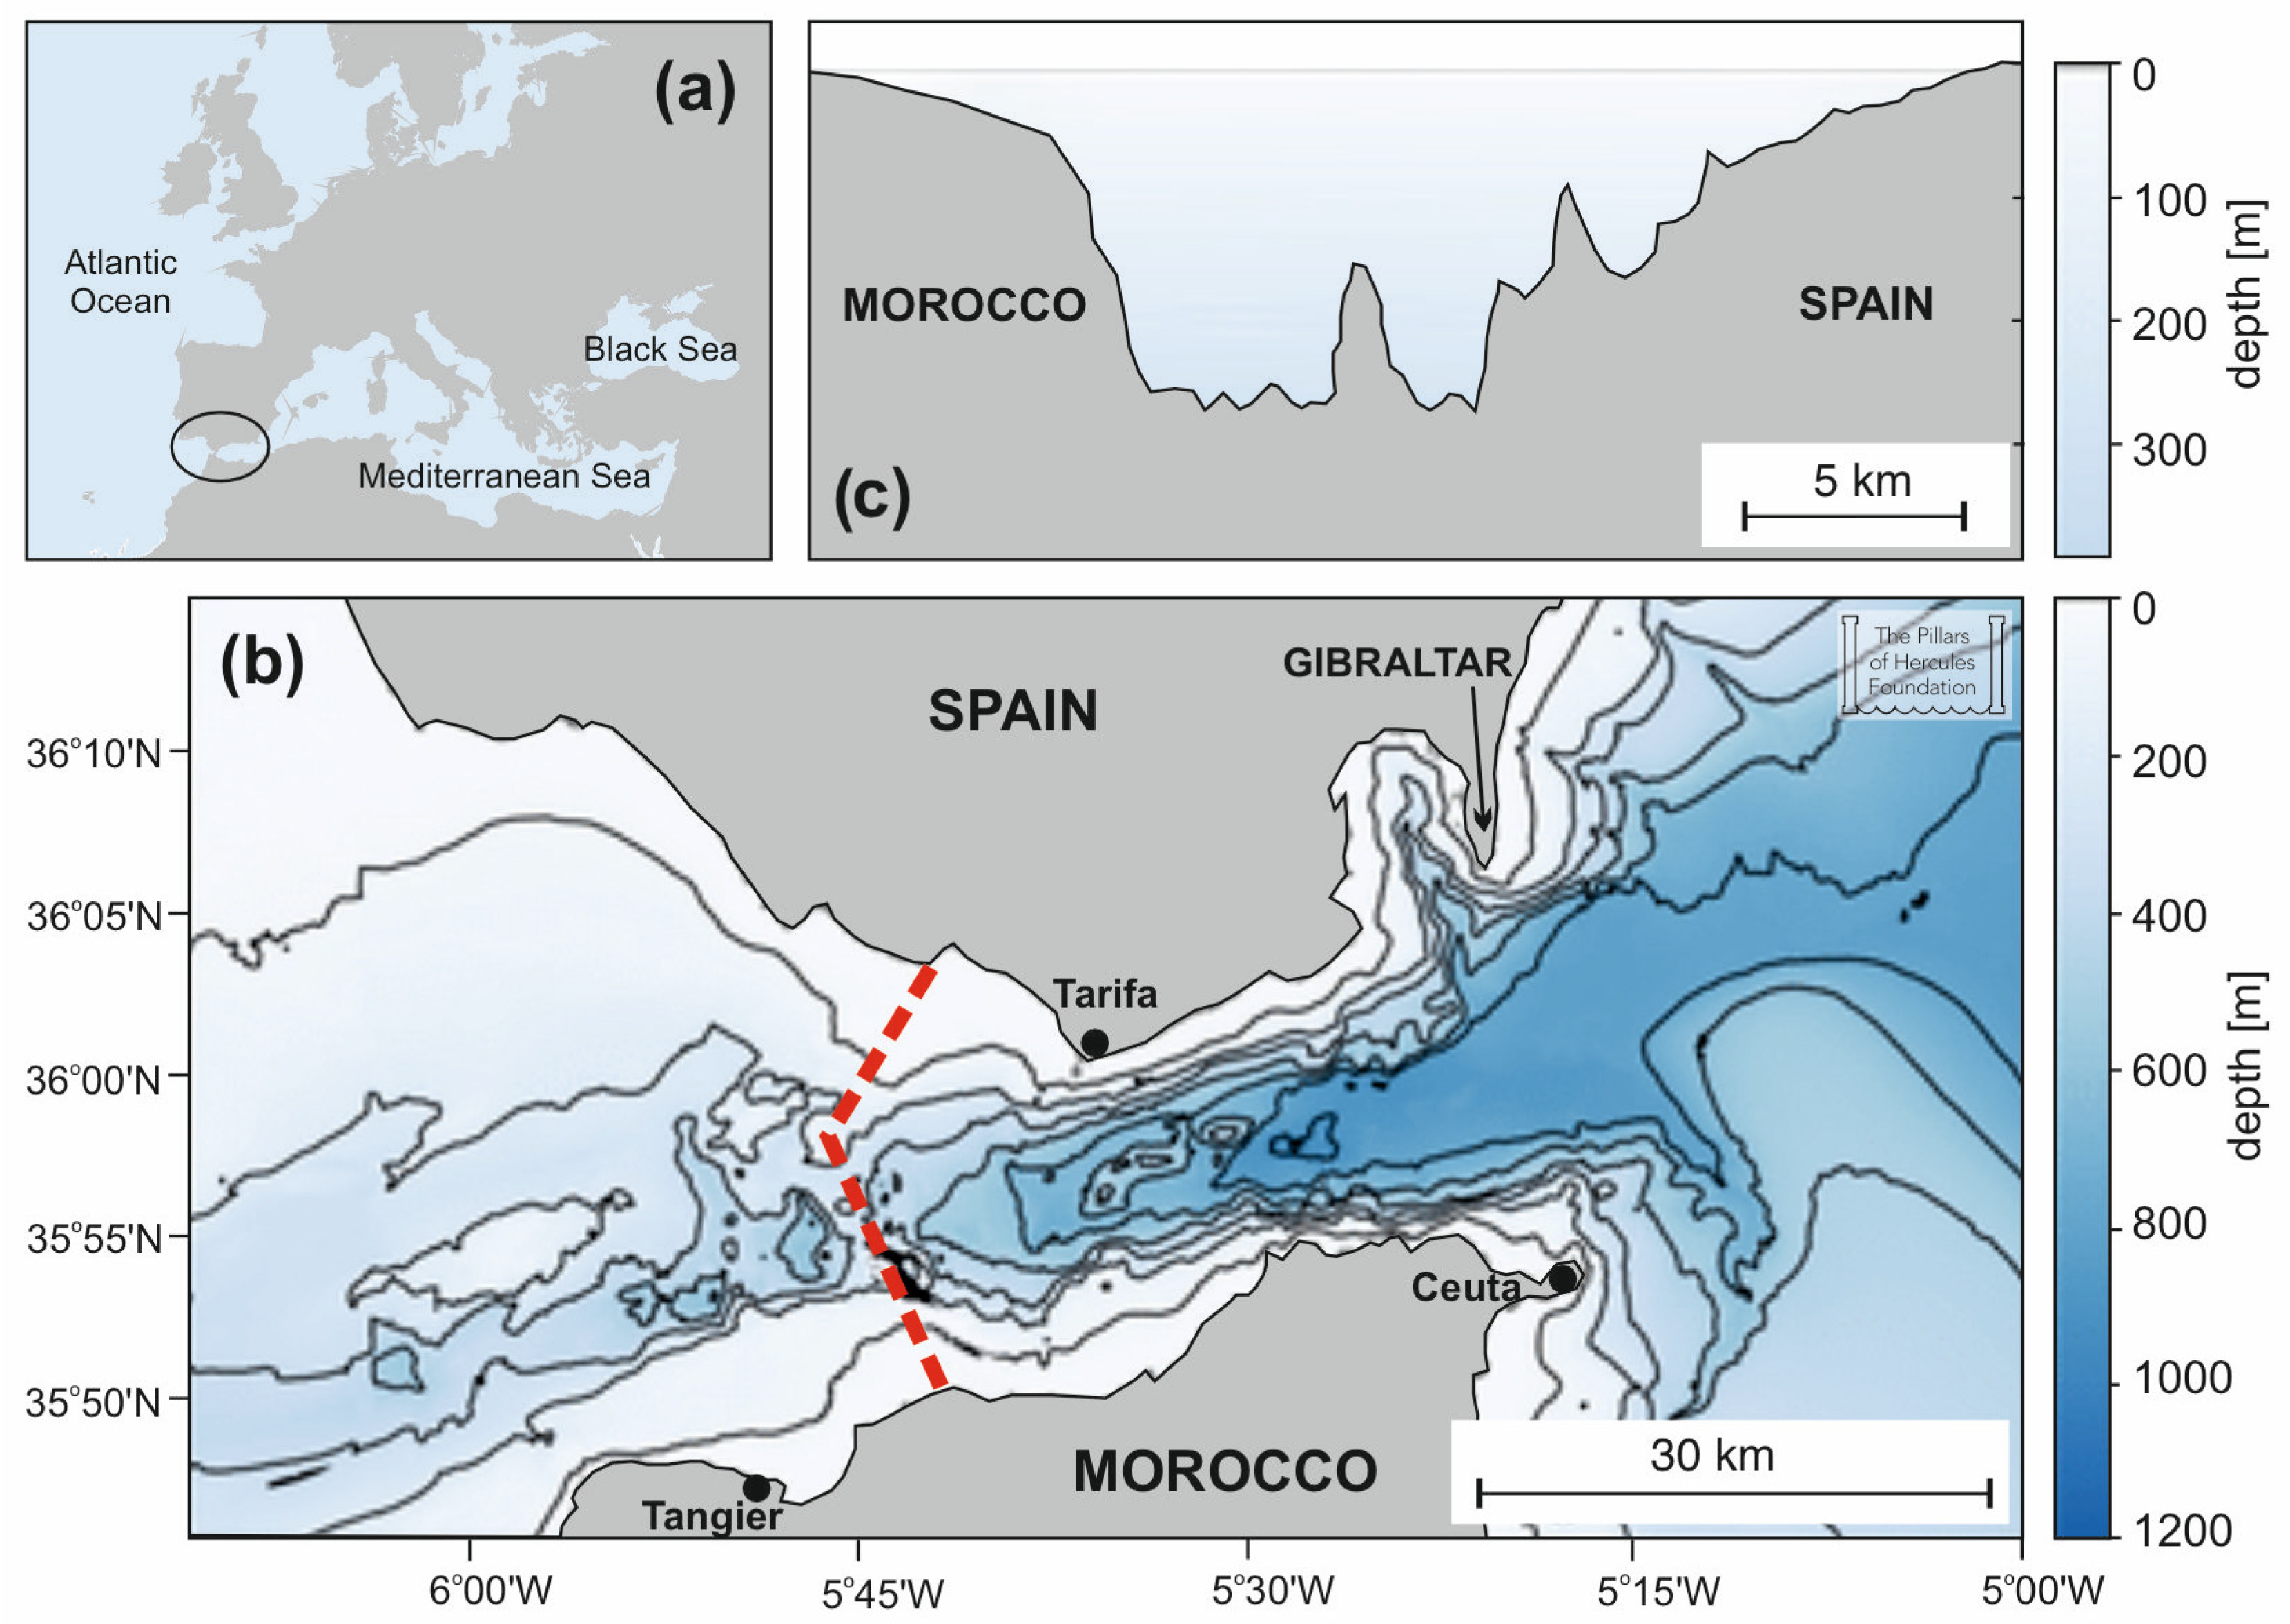
  • The Pillars of Hercules: Damming the Strait of Gibraltar
The Pillars of Hercules have stood for centuries at the separation of the Mediterranean Sea and the Atlantic Ocean [88]. They are commonly identified with the high mountain relief standing on both sides of the Strait of Gibraltar, and they are forever linked to the demigod Hercules—or Heracles, as he was known in the ancient Greek world—who ventured beyond the outer limits of the known world to perform one of his Twelve Labors [89]. According to Greek mythology, also shared by Etruscans and Romans, the Strait was opened by the hero himself in the mountain range that joined Africa and Europe. Both Seneca and later Pliny the Elder, in the first century AD, recall how Hercules decided not to go around the obstacle, but rather split the mountains with a blow from his sword, and then passed through the narrow strait. Conversely, in the preceding century, Diodorus Siculus, favoring an alternate school of thought on this matter, held that instead of smashing through an isthmus to create the Gibraltar opening, Hercules actually narrowed an existing, larger strait to prevent sea monsters of the Atlantic Ocean from entering the Mediterranean [90]. This second mythological hypothesis seems to point at a similar labor which faces mankind today: how to prevent the Atlantic Ocean itself from entering the semi-enclosed seas at the southern edges of the European continent, engulfing their coasts, submerging their riches, destroying their valuable infrastructures. The sea-level-rise monster is here, menacing to burst into Mare Nostrum, nullifying any effort to properly manage its present near-coastal environment.
The Pillars of Hercules Foundation—a vitual non-governamental organization born in the wake of the Oceans from Space V Symposium, held in Venice, Italy, in October 2022 [91]—was created to continue the debate started during the conference on climate change and its clear consequences for sites of the Venice class. Now that sea level rise is starting to be increasingly seen as a real and immediate danger, the advantages offered by regulating water flows at the Strait of Gibraltar (Figure A1), to provide protection for all coastlines of the Mediterranean and Black Seas, appear clearer than ever. The main outcome emerging from the 2022 Venice discussions is that the idea of countering the rising sea water level with a dam—for one of the few places in the world where a long-term, large-scale defense against sea level changes might indeed be practical—should be studied in greater detail. Planning and construction of a dam closing the Mediterranean Sea would be a major project, requiring complex negotiations and international agreements, not to mention significant resources. But most of all, the environmental impacts of controlling sea level in a semi-enclosed basin with a dam need to be carefully assessed. Certainly, such a project could not be undertaken any time soon, but discussions should start as early as possible in order to quantify uncertainties and impacts, benefits and drawbacks, alternatives and costs. The present paper should be seen as a contribution to this debate, aimed at highlighting what is known, or not known, about the southern European Seas, and what are the chances of mitigating problems foreseen in future sea level rise scenarios.
The Gibraltar Dam—a barrage, actually, meant to stabilize sea level with a relatively minor sea-level difference between its two sides, rather than a wall of concrete holding back water with a height difference of many metres—would be positioned along the Camarinal Sill, crossing the shallowest channel in the western part of the Strait. It should be designed to initially cause a height difference between its two sides of about 1 m, allowing inflow of Atlantic water to balance surface evaporation in the inner basin, and possibly a residual deep outflow from the Mediterranean itself. Such a design would need to accommodate the fact that height differences could increase significantly in future years, even up to 10 m within a century or so. The barrage would be built of loosely piled rock, dropped from ships or barges, or from the dam itself, with an angle of repose small enough to ensure stability. Since the structure would need to be designed so as to be stable in the event of at least moderate earthquakes, an angle of repose from 30° to 20° has been suggested [92], with the smaller angle giving increased dam stability. It could be on the order of 100 m wide at the top and about 10 m in height above the outer ocean level, to protect against high tides and storm surges. Being positioned west of the narrowest part of the Strait, it would be about 25 km long, following a shallow water line where the maximum depth is 284 m (rather than 800 m in the narrowest part of the Strait). Simple geometry gives an approximate required volume of rock, ranging from 1.23 km3 at an angle of repose of 30°, to 1.45 km3 at 25°, and to 1.78 km3 at 20° (about the same order of magnitude as the whole Rock of Gibraltar).
Figure A1. The Strait of Gibraltar, connecting Atlantic Ocean and Mediterranean Sea. Panel (a): location of the Strait at the westernmost end of the Mediterranean basin (black circle). Panel (b): bathymetry of the Strait and surrounding area, from [93]. Contours are shown at 150 m intervals. The red line indicates the approximate position for a barrage, along the Camarinal Sill, in the western part of the Strait. Panel (c): depth profile along the shallowest water line proposed for the barrage.
Remotesensing 16 00262 g0a1
A cost estimate can be derived by comparison with large-scale mining operations. For example, 1.5 km3, or 5 billion tons, of rock is about half the volume of material mined from the 4.3 × 3.0 km2 wide, 0.9 km deep Chuquicamata copper mine in northern Chile [94]. The total value of the copper extracted from this mine can be estimated at USD 50 billion. By comparison, if the dam is not built, the estimated total cost of coastal defenses could be considerably higher [95,96]. At the global scale, with about 200 million people living within coastal floodplains—and with 2 million km2 of land and USD 1 trillion worth of assets lying less than 1 m above current sea level—sea-level rise is considered to be one of the major socio-economic hazards associated with global warming [97].
Power generation would also be possible at the dam, especially as the water level difference across the two sides increases in future years, offsetting over time the construction and maintenance cost of the infrastructure. A further major benefit of the dam would be a land link between Europe and Africa. Security for illegal immigration would need to be handled, but a major road and rail corridor between Spain and Morocco should help reduce the economic gap between Western Europe and North Africa. At present, both countries have royal commissions charged with designing an underground rail tunnel under the Strait [98,99] to improve this transport link. A tunnel would have to contend with the unstable geology of the Strait. The surface link provided by the dam (along the same route as the tunnel) would be simpler, safer, and of much higher capacity. The dam would face the same unstable geology, and could be subject to occasional slumping, but assuming it is built of loose rock, it should be relatively easily repaired.
Unfavorable effects of the dam would include the disruption of present water flow patterns, rising salinity, changes in nutrient cycling, and still unclear biological impacts. Partially blocking the inflow of surface water from the Atlantic Ocean would cause sea level behind the dam to drop, because evaporation in the Mediterranean region exceeds the sum of river inflow and precipitation [100]. Sluices would be needed to allow and control water inflow to compensate for this drop. Evaporation would cause Mediterranean salinity to increase. Under present climate conditions, this average salinity increase is estimated at about 0.01 psu per year, or 1 psu every 100 years. This slow trend would eventually cause serious effects, but should give sufficient time (several hundred years) for climate change problems to be solved.
The outflow of deep, saline water into the Atlantic Ocean might also need to be preserved [101]. Numerical models of the global ocean, in which the exchange through the Strait of Gibraltar could be modulated at will, should be able to clarify this matter. Modeling of the Mediterranean itself would show the impact of changing stratification and vertical mixing patterns, affecting both oxygen ventilation of deeper layers, patterns of nutrients dynamics, and primary/secondary production. It remains to be seen whether fish and marine mammal migrations could be maintained via the dam openings (i.e., the sluices above). Ultimately, though, without a dam to control sea level rise, the trend to increase coastal reinforcements would lead to a catastrophic degeneration of a large part of the coastline, with dramatic impacts on the entire basin’s flora and fauna [102].
Shipping would need to be regulated at the dam with locks, possibly built together with port facilities located to the north and to the south of the barrage, west of Tarifa, Spain, and east of Tangier, Morocco, for redundancy. Locks would also be needed for the Suez Canal. These could be installed in both the south and north sections of the waterway, allowing the central Bitter Lakes to return to the higher salinity that previously blocked invasive species from the Red Sea [103]. The locks would increase transit times for marine traffic, reducing the competitiveness of the Mediterranean shipping route. Moreover, undetected passage of submarines would become impossible, but that may prove not to be such a negative occurrence.

Appendix B

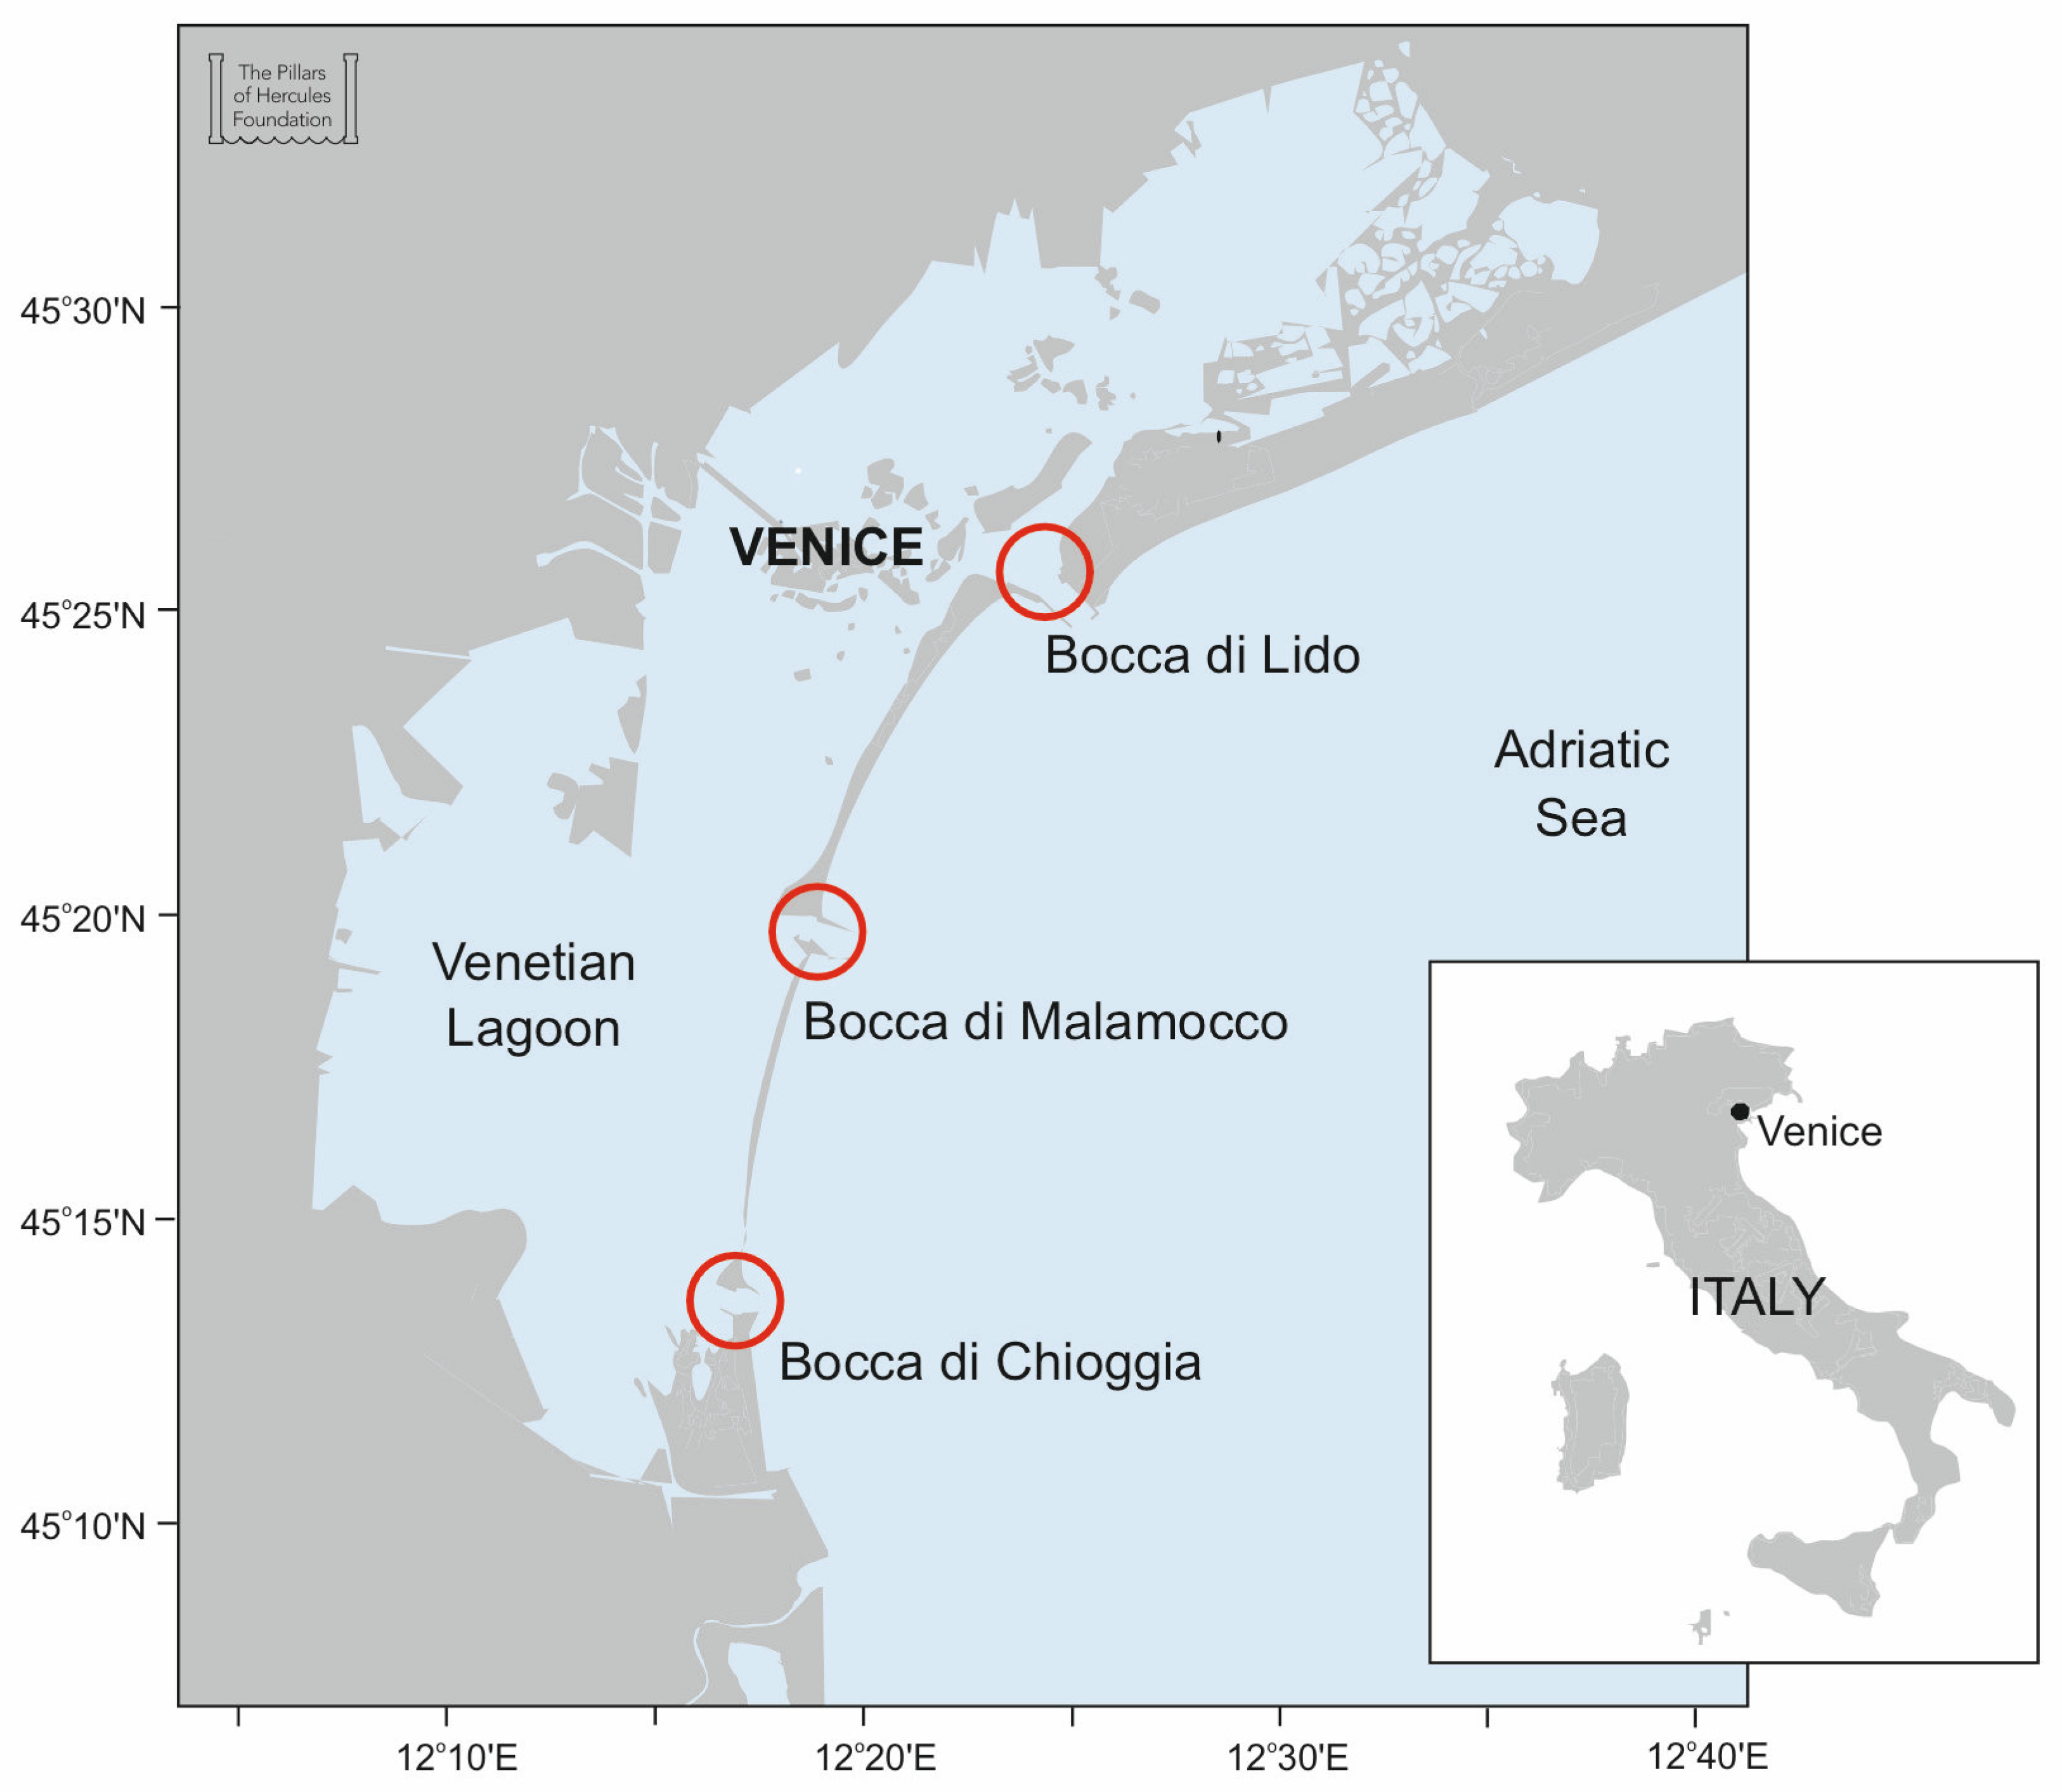
  • Saving the City of Venice
A barrage in the Strait of Gibraltar, regulating water exchanges with the Atlantic Ocean, together with proper locks in the Suez Canal, could protect all coastal environments and infrastructures throughout the Mediterranean Sea and Black Sea, eliminating the need for any other coastal defense against rising sea levels. A recent report by UNESCO [104] concluded that, due to the connection of the Mediterranean to the global ocean through the Strait of Gibraltar, the MOSE system of movable barriers is inadequate to defend the City of Venice on the long term [105]. The report states that ‘‘the sea will eventually rise to a level where even continuous closures will not be able to protect the city from flooding”, and that “the question is not if this will happen, but only when”.
Closing Gibraltar is an alternative to the conclusion that cities such as Venice are inevitably doomed. Clearly, this proposal needs to be studied and discussed. But it is also clear that a significant length of unchanged, natural Mediterranean coastline would be preserved if the dam were built. The dam would protect many historic cities and archeological sites which were designed for the low tidal range of the Mediterranean basin, and which have survived (with a few notable exceptions) thanks to the relatively stable sea level of the most recent centuries. The exponential increase in global sea level, which has already reached 25 cm above historic values, will reach 40 cm by the year 2050, 1 m by 2100, and 2.5 m by 2150. The present systems to prevent flooding in the City of Venice will find it hard to operate with an additional sea level rise of even 40 cm.
The MOdulo Sperimentale Elettromeccanico (MOSE), now nearly operational, is Venice’s response to the recurring episodes of Acqua Alta, which combine storm surges and high astronomical tides (up to 187 cm, on 13 November 2019 [106], second highest only after the 194 cm record of 4 November 1966). These episodes cause repeated, picturesque, but devastating flooding in the city. The MOSE movable barriers rest on the bottom of the Venetian Lagoon openings (the three Bocche di Porto, i.e., Lido, Malamocco, and Chioggia) and can be raised from a control station on the artificial island built in the middle of the Bocca di Lido (Figure A2). Their closure seals off the Lagoon from the Adriatic Sea, preventing any water level rise in the city’s historical centre, and in all other Lagoon sites. The MOSE, however, is designed to provide short-term defense from Acqua Alta, not from the long-term rise due to climate change. Ultimately, even if all Mediterranean coastlines were protected against the global sea level rise by a dam at Gibraltar, Acqua Alta would still occur in Venice, and the MOSE would still be required. The combination of MOSE and the dam would seem the best, and probably the only, long-term solution.
Figure A2. Location of the Venetian Lagoon’s three main inlets, or Bocca di Porto (Lido, Malamocco, Chioggia), where the MOSE floodgates are located (red circles).
Remotesensing 16 00262 g0a2
In the past 100 years, natural land subsidence lowered the City of Venice by 3 cm, and water pumping from underground aquifers caused additional lowering by 9 cm. In the same period, global sea level rise amounted to 13 cm. The total relative rise of about 25 cm is expected to grow by an additional 50 cm by the end of the century. By that time, a climate-change-driven sea level rise of 1 m and a possible 2 m Acqua Alta could give a grand total of 4 m! This would be well beyond the capability of the MOSE, which was designed to handle exceptional surges of up to 3 m, and to be closed only a few times per year. As of today, in 29 months of MOSE test operations, there have already been 44 closures, about 20 per year, a rate almost 10 times higher than expected [107].
The book “Venice shall rise again”, subtitled “Engineered uplift of Venice through seawater injection” [108], promotes the idea of raising by about 30 cm a circle of land ≈3.5 km in radius, centered under Venice, with lesser uplift out to a distance of ≈25 km. An obvious danger is that differential uplift could damage buildings, but the authors point out that the reverse procedure, i.e., the extraction of water for urban usage, has caused a drop by a significant fraction (about 30%) of the planned rise, without significant damage. Measurements of subsidence in the years 1950 to 1970 provide data on the differential movements due to extraction, and hence those to be expected during injection. The cost estimate appears to be modest, in comparison to that of MOSE, but, so far, the idea has not been pursued further.
Action to save Venice, if it is to include major projects like a Gibraltar Dam, requires active support by the entire Mediterranean community. Indeed, other countries are facing similar problems, due to the present and foreseen sea level rise. Egypt is a prime example, where the entire Nile delta is in danger of disappearing, while coastal cities, such as Alexandria, are struggling with the combined effects of sinking land and rising sea. It seems that an unprecedented level of collaboration would not be unlikely in the region. In the Mediterranean and Black Seas, the Gibraltar Dam would be a possible alternative to the massive intervention on coastal landscapes and infrastructures required by global sea level rise. But the present standard reaction to proposals to initiate a public debate on the subject appears to be quiet disbelief, probably directed more at the international cooperation needed for success, rather than at the reality of the coming sea level rise.

References

  1. Barale, V.; Gower, J.F.R.; Alberotanza, L. (Eds.) Proceedings of the “Oceans from Space” V, Venice 2022; NSA GROUP: Rome, Italy, 2022; p. 252. [Google Scholar] [CrossRef]
  2. Robinson, I.S. Measuring the Oceans from Space. The Principles and Methods of Satellite Oceanography; Springer-Praxis Books in Geophysical Sciences; Springer: Berlin/Heidelberg, Germany; New York, NY, USA, 2004. [Google Scholar]
  3. Benveniste, J.; Bonnefond, P. 25 Years of Progress in Radar Altimetry. Adv. Space Res. 2021, 68, 317–1242. [Google Scholar] [CrossRef]
  4. Zhou, D. Marginal Seas. In Encyclopedia of Marine Geosciences; Harff, J., Meschede, M., Petersen, S., Thiede, J., Eds.; Encyclopedia of Earth Sciences Series; Springer: Dordrecht, The Netherlands, 2016. [Google Scholar]
  5. The Mobile Barriers for the Protection of Venice from High Tides. Available online: https://www.mosevenezia.eu/project/?lang=en (accessed on 17 May 2023).
  6. Von Schuckmann, K.; Le Traon, P.Y.; Smith, N.; Pascual, A.; Djavidnia, S.; Gattuso, J.P.; Grégoire, M. Copernicus Marine Service Ocean State Report, Issue 5. J. Oper. Oceanogr. 2021, 14 (Suppl. S1), s1–s185. [Google Scholar] [CrossRef]
  7. Gramling, C. The ‘Doomsday’ Glacier May Soon Trigger a Dramatic Sea-Level Rise. Available online: https://www.snexplores.org/article/antarctica-thwaites-glacier-ice-shelf-collapse-climate-5-years (accessed on 2 April 2023).
  8. Intergovernmental Panel on Climate Change (IPCC). Climate Change 2023: Synthesis Report. Contribution of Working Groups I, II and III to the Sixth Assessment Report of the Intergovernmental Panel on Climate Change; Core Writing Team, Lee, H., Romero, J., Eds.; IPCC: Geneva, Switzerland, 2023; p. 184. [Google Scholar] [CrossRef]
  9. Forster, P.M.; Smith, C.J.; Walsh, T.; Lamb, W.F.; Lamboll, R.; Hauser, M.; Ribes, A.; Rosen, D.; Gillett, N.; Palmer, M.D.; et al. Indicators of Global Climate Change 2022: Annual update of large-scale indicators of the state of the climate system and human influence. Earth Syst. Sci. Data 2023, 15, 2295–2327. [Google Scholar] [CrossRef]
  10. Cazenave, A.; Palanisamy, H.; Ablain, M. Contemporary sea level changes from satellite altimetry: What have we learned? What are the new challenges? Adv. Space Res. 2018, 62, 1639–1653. [Google Scholar] [CrossRef]
  11. Pulhin, J.M.; Inoue, M.; Shaw, R. (Eds.) Climate Change, Disaster Risks, and Human Security; Book Series on Disaster Risk Reduction; Springer: Singapore, 2022; 450p. [Google Scholar]
  12. Fox-Kemper, B.; Hewitt, H.T.; Xiao, C.; Aðalgeirsdóttir, G.; Drijfhout, S.S.; Edwards, T.L.; Golledge, N.R.; Hemer, M.; Kopp, R.E.; Krinner, G.; et al. Ocean, cryosphere, and sea level change. In Climate Change 2021: The Physical Science Basis. Contribution of Working Group I to the Sixth Assessment Report of the Intergovernmental Panel on Climate Change; Masson-Delmotte, V., Zhai, P., Pirani, A., Connors, S.L., Péan, C., Berger, S., Caud, N., Chen, Y., Goldfarb, L., Gomis, M.I., et al., Eds.; Cambridge University Press: Cambridge, UK, 2021. [Google Scholar]
  13. Callendar, G.S.; Stewart, G. The artificial production of carbon dioxide and its influence on temperature. Q. J. R. Meteorol. Soc. 1938, 64, 223–240. [Google Scholar] [CrossRef]
  14. Ritchie, H.; Rodés-Guirao, L.; Mathieu, E.; Gerber, M.; Ortiz-Ospina, E.; Hasell, J.; Roser, M. Population Growth; Our World in Data: Oxford, UK, 2023; Available online: https://ourworldindata.org/population-growth (accessed on 18 August 2023).
  15. Keeling, R.F. Recording Earth’s Vital Signs. Science 2008, 319, 1771–1772. [Google Scholar] [CrossRef] [PubMed]
  16. United Nations Climate Change. Available online: https://unfccc.int (accessed on 14 August 2023).
  17. Barcena, A. An Overview of the Oceans in Agenda 21 of the 1992 United Nations Conference on Environment and Development. Mar. Pollut. Bull. 1992, 25, 107–111. [Google Scholar] [CrossRef]
  18. Breidenich, C.; Magraw, D.; Anne Rowley, A.; Rubin, J.W. The Kyoto Protocol to the United Nations Framework Convention on Climate Change. Am. J. Int. Law 1998, 92, 315–331. [Google Scholar] [CrossRef]
  19. Mayer, B. The Curious Fate of the Doha Amendment. Available online: https://www.ejiltalk.org/the-curious-fate-of-the-doha-amendment/ (accessed on 1 September 2023).
  20. Schneider, L.; La Hoz Theuer, S. Environmental integrity of international carbon market mechanisms under the Paris Agreement. Clim. Policy 2019, 19, 386–400. [Google Scholar] [CrossRef]
  21. Sharm El-Sheikh Climate Change Conference 2022. Available online: https://unfccc.int/cop27 (accessed on 17 May 2023).
  22. NOAA. Global Monitoring Laboratory, Earth System Research Laboratories. Trends in Atmospheric Carbon Dioxide. Available online: https://gml.noaa.gov/ccgg/trends/data.html (accessed on 17 August 2023).
  23. Thoning, K.W.; Crotwell, A.M.; Mund, J.W. Atmospheric Carbon Dioxide Dry Air Mole Fractions from continuous measurements at Mauna Loa, Hawaii, Barrow, Alaska, American Samoa and South Pole. 1973–2022 Version 2023-08-08 National Oceanic and Atmospheric Administration (NOAA), Global Monitoring Laboratory (GML), Boulder, Colorado, USA. Available online: https://doi.org/10.15138/yaf1-bk21 (accessed on 11 August 2023).
  24. Gillespie, A. University of Hawaii, NOAA to Gather Climate Change Data Following Mauna Loa Eruption. Available online: https://www.noaa.gov/news-release/university-of-hawaii-noaa-to-gather-climate-change-data-following-mauna-loa-eruption (accessed on 17 August 2023).
  25. NOAA. Climate.gov. Carbon Dioxide over 800,000 Years. Available online: https://www.climate.gov/ (accessed on 4 September 2023).
  26. Lüthi, D.; Le Floch, M.; Bereiter, B.; Blunier, T.; Barnola, J.M.; Siegenthaler, U.; Raynaud, D.; Jouzel, J.; Fischer, H.; Kawamura, K.; et al. High-resolution carbon dioxide concentration record 650,000–800,000 years before present. Nature 2008, 453, 379–382. [Google Scholar] [CrossRef]
  27. Met Office Hadley Centre Observations Datasets. Available online: https://www.metoffice.gov.uk/hadobs/hadsst4/data/download.html (accessed on 17 August 2023).
  28. Kennedy, J.J.; Rayner, N.A.; Atkinson, C.P.; Killick, R.E. An ensemble data set of sea surface temperature change from 1850: The Met Office Hadley Centre HadSST.4.0.0.0 data set. J. Geophyical. Res. Atmos. 2019, 124, 7719–7763. [Google Scholar] [CrossRef]
  29. Intergovernmental Panel on Climate Change (IPCC). Climate Change 2023, Synthesis Report, Summary for Policimakers. Available online: https://www.ipcc.ch/report/ar6/syr/downloads/report/IPCC_AR6_SYR_SPM.pdf (accessed on 17 May 2023).
  30. Copernicus. OBSERVER: Record-Breaking Marine Heatwaves in the Mediterranean and Safeguarding Marine Ecosystems. Available online: https://www.copernicus.eu/en/news/news/observer-record-breaking-marine-heatwaves-mediterranean-and-safeguarding-marine (accessed on 1 September 2023).
  31. Way, M.J.; Del Genio, A.D.; Aleinov, I.; Clune, T.L.; Kelley, M.; Kiang, N.Y. Climates of Warm Earth-like Planets. I. 3D Model Simulations. Astrophys. J. Suppl. Ser. 2018, 239, 24. [Google Scholar] [CrossRef]
  32. Guerou, A.; Meyssignac, B.; Prandi, P.; Ablain, M.; Ribes, A.; Bignalet-Cazalet, F. Current observed global mean sea level rise and acceleration estimated from satellite altimetry and the associated uncertainty. Ocean. Sci. 2023, 19, 431–451. [Google Scholar] [CrossRef]
  33. Church, J.A.; White, N.J. A 20th century acceleration in global sea level rise. Geophys. Res. Lett. 2006, 33, L01602. [Google Scholar] [CrossRef]
  34. Grases, A.; Gracia, V.; García-León, M.; Lin-Ye, J.; Sierra, J.P. Coastal Flooding and Erosion under a Changing Climate: Implications at a Low-Lying Coast (Ebro Delta). Water 2020, 12, 346. [Google Scholar] [CrossRef]
  35. Copernicus. Climate Indicators. Sea Level. Available online: https://climate.copernicus.eu/climate-indicators/sea-level (accessed on 5 September 2023).
  36. Church, J.A.; White, N.J. Sea-level rise from the late 19th to the early 21st Century. Surv. Geophys. 2011, 32, 585–602. [Google Scholar] [CrossRef]
  37. CSIRO. Sea Level Rise. Available online: https://www.cmar.csiro.au/sealevel/sl_data_cmar.html (accessed on 17 August 2023).
  38. CNES. AVISO+, Satellite Altimetry Data. Data Access. Available online: https://www.aviso.altimetry.fr/en/data/data-access.html (accessed on 17 August 2023).
  39. Church, J.A.; Clark, P.U.; Cazenave, A.; Gregory, J.M.; Jevrejeva, S.; Levermann, A.; Merrifield, M.A.; Milne, G.A.; Nerem, R.S.; Nunn, P.D.; et al. Sea Level Change. In Climate Change 2013: The Physical Science Basis. Contribution of Working Group I to the Fifth Assessment Report of the Intergovernmental Panel on Climate Change; Stocker, T.F., Qin, D., Plattner, G.K., Tignor, M., Allen, S.K., Boschung, J., Nauels, A., Xia, Y., Bex, V., Midgley, P.M., Eds.; Cambridge University Press: Cambridge, UK; New York, NY, USA, 2013. [Google Scholar]
  40. Cazenave, A.; Moreira, L. Contemporary sea-level changes from global to local scales: A review. Proc. R. Soc. A 2022, 478, 20220049. [Google Scholar] [CrossRef]
  41. NASA Earth Data. Sea Level Change. Observations from Space. Understanding Sea Level. Global Mean Sea Level. Available online: https://sealevel.nasa.gov/understanding-sea-level/global-sea-level/overview (accessed on 27 September 2023).
  42. Pokhrel, Y.N.; Hanasaki, N.; Yeh, P.J.; Yamada, T.J.; Kanae, S.; Oki, T. Model estimates of sea-level change due to anthropogenic impacts on terrestrial water storage. Nat. Geosci. 2012, 5, 389–392. [Google Scholar] [CrossRef]
  43. Moucha, R.; Forte, A.M.; Mitrovica, J.X.; Rowley, D.B.; Quéré, S.; Simmons, N.A.; Grand, S.P. Dynamic topography and long-term sea-level variations: There is no such thing as a stable continental platform. Earth Planet. Sci. Lett. 2008, 271, 101–108. [Google Scholar] [CrossRef]
  44. Kopp, R.E.; Hay, C.C.; Little, C.M.; Mitrovica, J.X. Geographic Variability of Sea-Level Change. Curr. Clim. Change Rep. 2015, 1, 192–204. [Google Scholar] [CrossRef]
  45. Woodworth, P.L.; Pugh, D.T.; Plater, A.J. Sea level measurements from tide gauges. In Handbook of Sea-Level Research, 1st ed.; Shennan, I., Long, A.J., Horton, B.P., Eds.; John Wiley & Sons Ltd.: Oxford, UK, 2015; pp. 557–574. [Google Scholar]
  46. Boretti, A. Nonlinear absolute sea-level patterns in the long-term-trend tide gauges of the East Coast of North America. Nonlinear Eng. 2021, 10, 1–15. [Google Scholar] [CrossRef]
  47. Gobron, K.; de Viron, O.; Wöppelmann, G.; Poirier, É.; Ballu, V.; Van Camp, M. Assessment of Tide Gauge Biases and Precision by the Combination of Multiple Collocated Time Series. J. Atmos. Ocean. Technol. 2019, 36, 1983–1996. [Google Scholar] [CrossRef]
  48. Mitchum, G.T. Monitoring the Stability of Satellite Altimeters with Tide Gauges. J. Atmos. Ocean. Technol. 1998, 15, 721–730. [Google Scholar] [CrossRef]
  49. Mu, D.; Yan, H.; Feng, W. Assessment of sea level variability derived by EOF reconstruction. Geophys. J. Int. 2018, 214, 79–87. [Google Scholar] [CrossRef]
  50. Fu, L.L.; Cazenave, A. (Eds.) Satellite Altimetry and Earth Sciences: A Handbook of Techniques and Applications; International Geophysics Series; Academic Press: San Diego, CA, USA, 2001; Volume 69, 463p. [Google Scholar]
  51. Nerem, R.S.; Mitchum, G.T. Chapter 6 Observation of sea level change from satellite altimetry. In Sea Level Rise: History and Consequences; Douglas, B.C., Kearney, M.S., Leatherman, S.P., Eds.; International Geophysics Series; Academic Press: San Diego, CA, USA, 2001; Volume 75, pp. 21–163. [Google Scholar] [CrossRef]
  52. Vignudelli, S.; Birol, F.; Benveniste, J.; Fu, L.L.; Picot, N.; Raynal, M.; Roinard, H. Satellite Altimetry Measurements of Sea Level in the Coastal Zone. Surv. Geophys. 2019, 40, 1319–1349. [Google Scholar] [CrossRef]
  53. Watson, C.; White, N.; Church, J.; King, M.A.; Butgette, R.J.; Legresy, B. Unabated global mean sea-level rise over the satellite altimeter era. Nat. Clim. Change 2015, 5, 565–568. [Google Scholar] [CrossRef]
  54. Apel, J.R. Three Decades of Satellite Oceanography: The View from on High. In Space Remote Sensing of Subtropical Oceans, Proceedings of the COSPAR Colloquium on Space Remote Sensing of Subtropical Oceans (SRSSO), Taiwan, 12–17 September 1995; Liu, C.T., Ed.; COSPAR Colloquia Series; Pergamon: Oxford, UK, 1997; Volume 8, pp. 11–19. [Google Scholar] [CrossRef]
  55. Born, G.H.; Dunne, J.A.; Lame, D.B. Seasat Mission Overview. Science 1979, 204, 1405–1406. [Google Scholar] [CrossRef]
  56. Wilson, W.S.; Fellous, J.L.; Kawamura, H.; Mitnik, L.M. A History of Oceanography from Space. In Remote Sensing of the Marine Environment; Ryerson, R.A., Ed.; Manual of Remote Sensing; American Society for Photogrammetry and Remote Sensing: Bethesda, MD, USA, 2006; Volume 6, pp. 1–31. [Google Scholar]
  57. ESA, Earth Online, ENVISAT. Available online: https://earth.esa.int/eogateway/missions/envisat (accessed on 25 May 2023).
  58. Steunou, N.; Desjonquères, J.D.; Picot, N.; Sengenes, P.; Noubel, J.; Poisson, J.C. AltiKa Altimeter: Instrument Description and In-Flight Performance. Mar. Geod. 2015, 38 (Suppl. S1), 22–42. [Google Scholar] [CrossRef]
  59. ESA, Sentinel Online. Available online: https://sentinel.esa.int/web/sentinel/missions (accessed on 4 September 2023).
  60. ESA, Earth Online, CryoSat. Available online: https://earth.esa.int/eogateway/missions/cryosat (accessed on 4 September 2023).
  61. Fu, L.L.; Alsdorf, D.; Rodriguez, E.; Morrow, R.; Mognard, N.; Lambin, J.; Vaze, P.; Lafon, T. The SWOT (Surface Water and Ocean Topography) Mission: Spaceborne Radar Interferometry for Oceanographic and Hydrological Applications. In Proceedings of the OceanObs’09, Venice, Italy, 21–25 September 2009. [Google Scholar]
  62. JPL, PODAAC, MEaSUREs—Integrated Multi-Mission Ocean Altimeter Data for Climate Research (MEaSUREs-SHH). Available online: https://podaac.jpl.nasa.gov/MEaSUREs-SSH (accessed on 30 August 2023).
  63. Lindsey, R. Climate Change: Global Sea Level. NOAA Science & Information for a Climate-Smart Nation. Available online: https://www.climate.gov/news-features/understanding-climate/climate-change-global-sea-level (accessed on 25 May 2023).
  64. University of Colorado, Sea Level Research Group. Available online: https://sealevel.colorado.edu/ (accessed on 25 May 2023).
  65. CNES. AVISO+, Satellite Altimetry Data. Mean Sea Level. Available online: https://www.aviso.altimetry.fr/en/data/products/ocean-indicators-products/mean-sea-level.html (accessed on 25 May 2023).
  66. Thiéblemont, R.; Le Cozannet, G.; Toimil, A.; Meyssignac, B.; Losada, I.J. Likely and High-End Impacts of Regional Sea-Level Rise on the Shoreline Change of European Sandy Coasts Under a High Greenhouse Gas Emissions Scenario. Water 2019, 11, 2607. [Google Scholar] [CrossRef]
  67. Reimann, L.; Vafeidis, A.T.; Brown, S.; Hinkel, J.; Tol, R.S.J. Mediterranean UNESCO World Heritage at risk from coastal flooding and erosion due to sea-level rise. Nat. Commun. 2018, 9, 4161. [Google Scholar] [CrossRef]
  68. Wikipedia. Atlantropa. Available online: https://en.wikipedia.org/wiki/Atlantropa (accessed on 6 September 2023).
  69. Stommel, H. The circulation of the abyss. Sci. Am. 1958, 199, 85–90. Available online: https://sciam-cms.s3.amazonaws.com/sciam/cache/file/C39DA9C7-9B4C-4975-839909C607633730.pdf (accessed on 5 September 2023). [CrossRef]
  70. Johnson, R.G. Climate control requires a dam in the Strait of Gibraltar. Eos Trans. Am. Geophys. Union 1997, 78, 277–282. [Google Scholar] [CrossRef]
  71. Gower, J. A sea surface height control dam at the Strait of Gibraltar. Nat. Hazards 2015, 78, 2109–2120. [Google Scholar] [CrossRef]
  72. Gradstein, F.M.; Ogg, J.G.; Smith, A.G. (Eds.) A Geologic Time Scale 2004; Cambridge University Press: Cambridge, UK; New York, NY, USA, 2005; p. 589. [Google Scholar]
  73. Ruggieri, G.; Sprovieri, R. Messinian salinity crisis and its paleogeographical implications. Palaeogeogr. Palaeoclimatol. Palaeoecol. 1976, 20, 13–21. [Google Scholar] [CrossRef]
  74. Hsü, K.J. The Mediterranean Was a Desert; Princeton University Press: Princeton, NJ, USA, 1983; p. 197. [Google Scholar]
  75. Caruso, A.; Blanc-Valleron, M.M.; Da Prato, S.; Pierre, C.; Rouchy, J.M. The late Messinian “Lago-Mare” event and the Zanclean Reflooding in the Mediterranean Sea: New insights from the Cuevas del Almanzora section (Vera Basin, South-Eastern Spain). Earth-Sci. Rev. 2020, 200, 102993. [Google Scholar] [CrossRef]
  76. Carlisle, D.P.; Feetham, P.M.; Wright, M.J.; Teagle, D.A.H. The public remain uninformed and wary of climate engineering. Clim. Change 2020, 160, 303–322. [Google Scholar] [CrossRef]
  77. Kitchen, D. Geoengineering Sounds Like a Quick Climate Fix, But without More Research and Guardrails, It’s a Costly Gamble—With Potentially Harmful Results. Available online: https://theconversation.com/geoengineering-sounds-like-a-quick-climate-fix-but-without-more-research-and-guardrails-its-a-costly-gamble-with-potentially-harmful-results-211705 (accessed on 7 September 2023).
  78. Wagner, G. Geoengineering: The Gamble; Polity Press: Cambridge, UK; Oxford, UK; Boston, MA, USA; New York, NY, USA, 2021; p. 208. [Google Scholar]
  79. Marcos, M.; Jorda, G.; Le Cozannet, G. Sea level rise and its impacts on the Mediterranean. In The Mediterranean Region under Climate Change: A Scientific Update; Moatti, J.P., Thiébault, S., Eds.; IRD Éditions: Marseille, France, 2016; pp. 265–275. [Google Scholar]
  80. Groeskamp, S.; Kjellsson, J. NEED: The Northern European Enclosure Dam for if Climate Change Mitigation Fails. Bull. Am. Meteorol. Soc. 2020, 101, E1174–E1189. [Google Scholar] [CrossRef]
  81. Archer, D. Fate of fossil fuel CO2 in geologic time. J. Geophys. Res. Oceans 2005, 110, C09S05. [Google Scholar] [CrossRef]
  82. INDEPENDENT. Climate. News. COP21: Paris Deal Far too Weak to Prevent Devastating Climate Change, Academics Warn, by T. Bawden. Available online: https://www.independent.co.uk/environment/climate-change/cop21-paris-deal-far-too-weak-to-prevent-devastating-climate-change-academics-warn-a6803096.html (accessed on 11 September 2023).
  83. Shepherd, J.; Caldeira, K.; Cox, P.; Haigh, J.; Keith, D.; Launder, B.; Mace, G.; MacKerron, G.; Pyle, J.; Rayner, S.; et al. Geoengineering the Climate: Science, Governance, and Uncertainty; Royal Society Policy Document, 10/09; The Royal Society Publishing: London, UK, 2009; p. 82. [Google Scholar]
  84. Arnell, N.W. The implications of climate change for emergency planning. Int. J. Disaster Risk Reduct. 2022, 83, 103425. [Google Scholar] [CrossRef]
  85. Moore, J.C.; Gladstone, R.; Zwinger, T.; Wolovick, M. Geoengineer polar glaciers to slow sea-level rise. Nature 2018, 555, 303–305. [Google Scholar] [CrossRef]
  86. International Altimetry Team; Verron, J.; Ryan, B.; Bonnefond, P.; Benveniste, J. Altimetry for the future: Building on 25 years of progress. Adv. Space Res. 2021, 68, 319–363. [Google Scholar] [CrossRef]
  87. Nieves, V.; Radin, C.; Camps-Valls, G. Predicting regional coastal sea level changes with machine learning. Nat. Sci. Rep. 2021, 11, 7650. [Google Scholar] [CrossRef]
  88. Wikipedia. Pillars of Hercules. Available online: https://en.wikipedia.org/wiki/Pillars_of_Hercules (accessed on 8 May 2023).
  89. Wikipedia. Labours of Hercules. Available online: https://en.wikipedia.org/wiki/Labours_of_Hercules (accessed on 8 May 2023).
  90. Siculus, D. Library of History, Volume II: Books 2.35-4.58; Oldfather, C.H., Translator; Loeb Classical Library No. 303; Harvard University Press: Cambridge, MA, USA, 1935. [Google Scholar]
  91. Oceans from Space. Available online: https://www.oceansfromspacevenice2020.org (accessed on 11 September 2023).
  92. Breeze, P. Chapter 3—Dams and Barrages. In Hydropower; Breeze, P., Ed.; Academic Press: Cambridge, MA, USA, 2018; pp. 23–33. [Google Scholar] [CrossRef]
  93. EMODnet Bathymetry Consortium. EMODnet Digital Bathymetry (DTM 2018); EMODnet High Resolution Seabed Mapping Project: Madeira, Portugal, 2018. [Google Scholar] [CrossRef]
  94. USGS. Chuquicamata Mine, Chile. Available online: https://eros.usgs.gov/media-gallery/earthshot/chuquicamata-mine-chile (accessed on 11 September 2023).
  95. Hallegatte, S.; Green, C.; Nicholls, R.J.; Corfee-Morlot, J. Future flood losses in major coastal cities. Nat. Clim. Change 2013, 3, 802–806. [Google Scholar] [CrossRef]
  96. Hinkel, J.; Lincke, D.; Vafeidis, A.T.; Perrette, M.; Nicholls, R.J.; Tol, R.S.J.; Marzeion, B.; Fettweis, X.; Ionescu, C.; Levermann, A. Coastal flood damage and adaptation costs under 21st century sea level rise. Proc. Natl. Acad. Sci. USA 2014, 111, 9–3292. [Google Scholar] [CrossRef] [PubMed]
  97. Stern, N. The Economics of Climate Change: The Stern Review; Cambridge University Press: Cambridge, UK, 2007. [Google Scholar] [CrossRef]
  98. Sociedad Espanola de Estudios Para la Communicion Fija a Traves del Estrecho de Gibraltar (SECEGSA), Agenda 2030. Available online: https://www.secegsa.gob.es/secegsa/lang_castellano/ (accessed on 25 May 2023).
  99. Ste Nationale d’Etudes du Detroit de Gibraltar (SNEDG). Available online: https://www.charika.ma/societe-ste-nationale-d-etudes-du-detroit-de-gibraltar-17101 (accessed on 25 May 2023).
  100. Mariotti, A.; Struglia, M.V.; Zeng, N.; Lau, K.M. The hydrological cycle in the Mediterranean region and implications for the water budget of the Mediterranean Sea. J. Clim. 2002, 15, 1674–1690. [Google Scholar] [CrossRef]
  101. Rahmstorf, S. Influence of Mediterranean outflow on climate. Eos Trans. Am. Geophys. Union 1998, 79, 281–282. [Google Scholar] [CrossRef]
  102. Meinesz, A. Proteger la Biodiversite Marine; Odile Jacob: Nice, France, 2021; 304p. [Google Scholar]
  103. Galil, B.S. Taking stock: Inventory of alien species in the Mediterranean Sea. Biol. Invasions 2009, 11, 359–372. [Google Scholar] [CrossRef]
  104. Umgiesser, G. From Global to Regional: Local Sea Level Rise Scenarios, Focus on the Mediterranean Sea and the Adriatic Sea. The Future of Venice and Its Lagoon in the Context of Climate Change; UNESCO Office Venice and Regional Bureau for Science and Culture in Europe: Venice, Italy, 2011; Available online: https://unesdoc.unesco.org/ark:/48223/pf0000215105?posInSet=8&queryId=92c0667e-e72d-4198-bf42-dc33119acd56 (accessed on 17 May 2023).
  105. Bras, R.L.; Harleman, D.R.F.; Rinaldo, A.; Rizzoli, P. Obsolete? No. Necessary? Yes. The gates will save Venice. EOS Trans. 2002, 83, 217–224. [Google Scholar] [CrossRef]
  106. Harlan, C.; Pitrelli, S. Venice Submerged by Highest Tides in Half a Century. Washington Post, 13 November 2019. Available online: https://www.washingtonpost.com/world/europe/venice-partly-submerged-by-highest-tides-in-half-a-century/2019/11/13/fa36566e-05fa-11ea-8292-c46ee8cb3dce_story.html (accessed on 16 August 2023).
  107. Umgiesser, G. The impact of operating the mobile barriers in Venice (MOSE) under climate change. J. Nat. Conserv. 2020, 54, 125783. [Google Scholar] [CrossRef]
  108. Gambolati, G.; Teatini, P. Venice Shall Rise Again, 1st ed.; Elsevier Insights: London, UK, 2013; 100p. [Google Scholar]
Figure 4. The semi-enclosed Mediterranean Sea, Black Sea, and Red Sea. The Mediterranean Sea is connected to the Atlantic Ocean by the Strait of Gibraltar; to the Black Sea by the Bosphorus; and to the Red Sea by the Suez Canal (all identifyed by red circles). The location of the Lagoon and City of Venice is also shown. The colour coding of sea areas indicates approximate bathymetry, from shallower waters (lighter blue tones) to deeper waters (darker blue tones), while that of land areas indicates vegetation cover (green tones) and desert areas (yellow and brown tones).
Remotesensing 16 00262 g004
Disclaimer/Publisher’s Note: The statements, opinions and data contained in all publications are solely those of the individual author(s) and contributor(s) and not of MDPI and/or the editor(s). MDPI and/or the editor(s) disclaim responsibility for any injury to people or property resulting from any ideas, methods, instructions or products referred to in the content.

