

Synchronized and Co-Located Ionospheric and Atmospheric Anomalies Associated with the 2023 Mw 7.8 Turkey Earthquake

 , , and
Abstract
: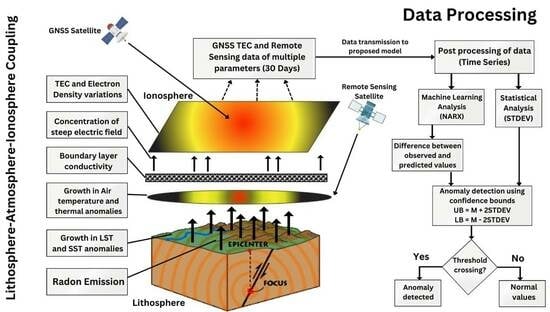
1. Introduction
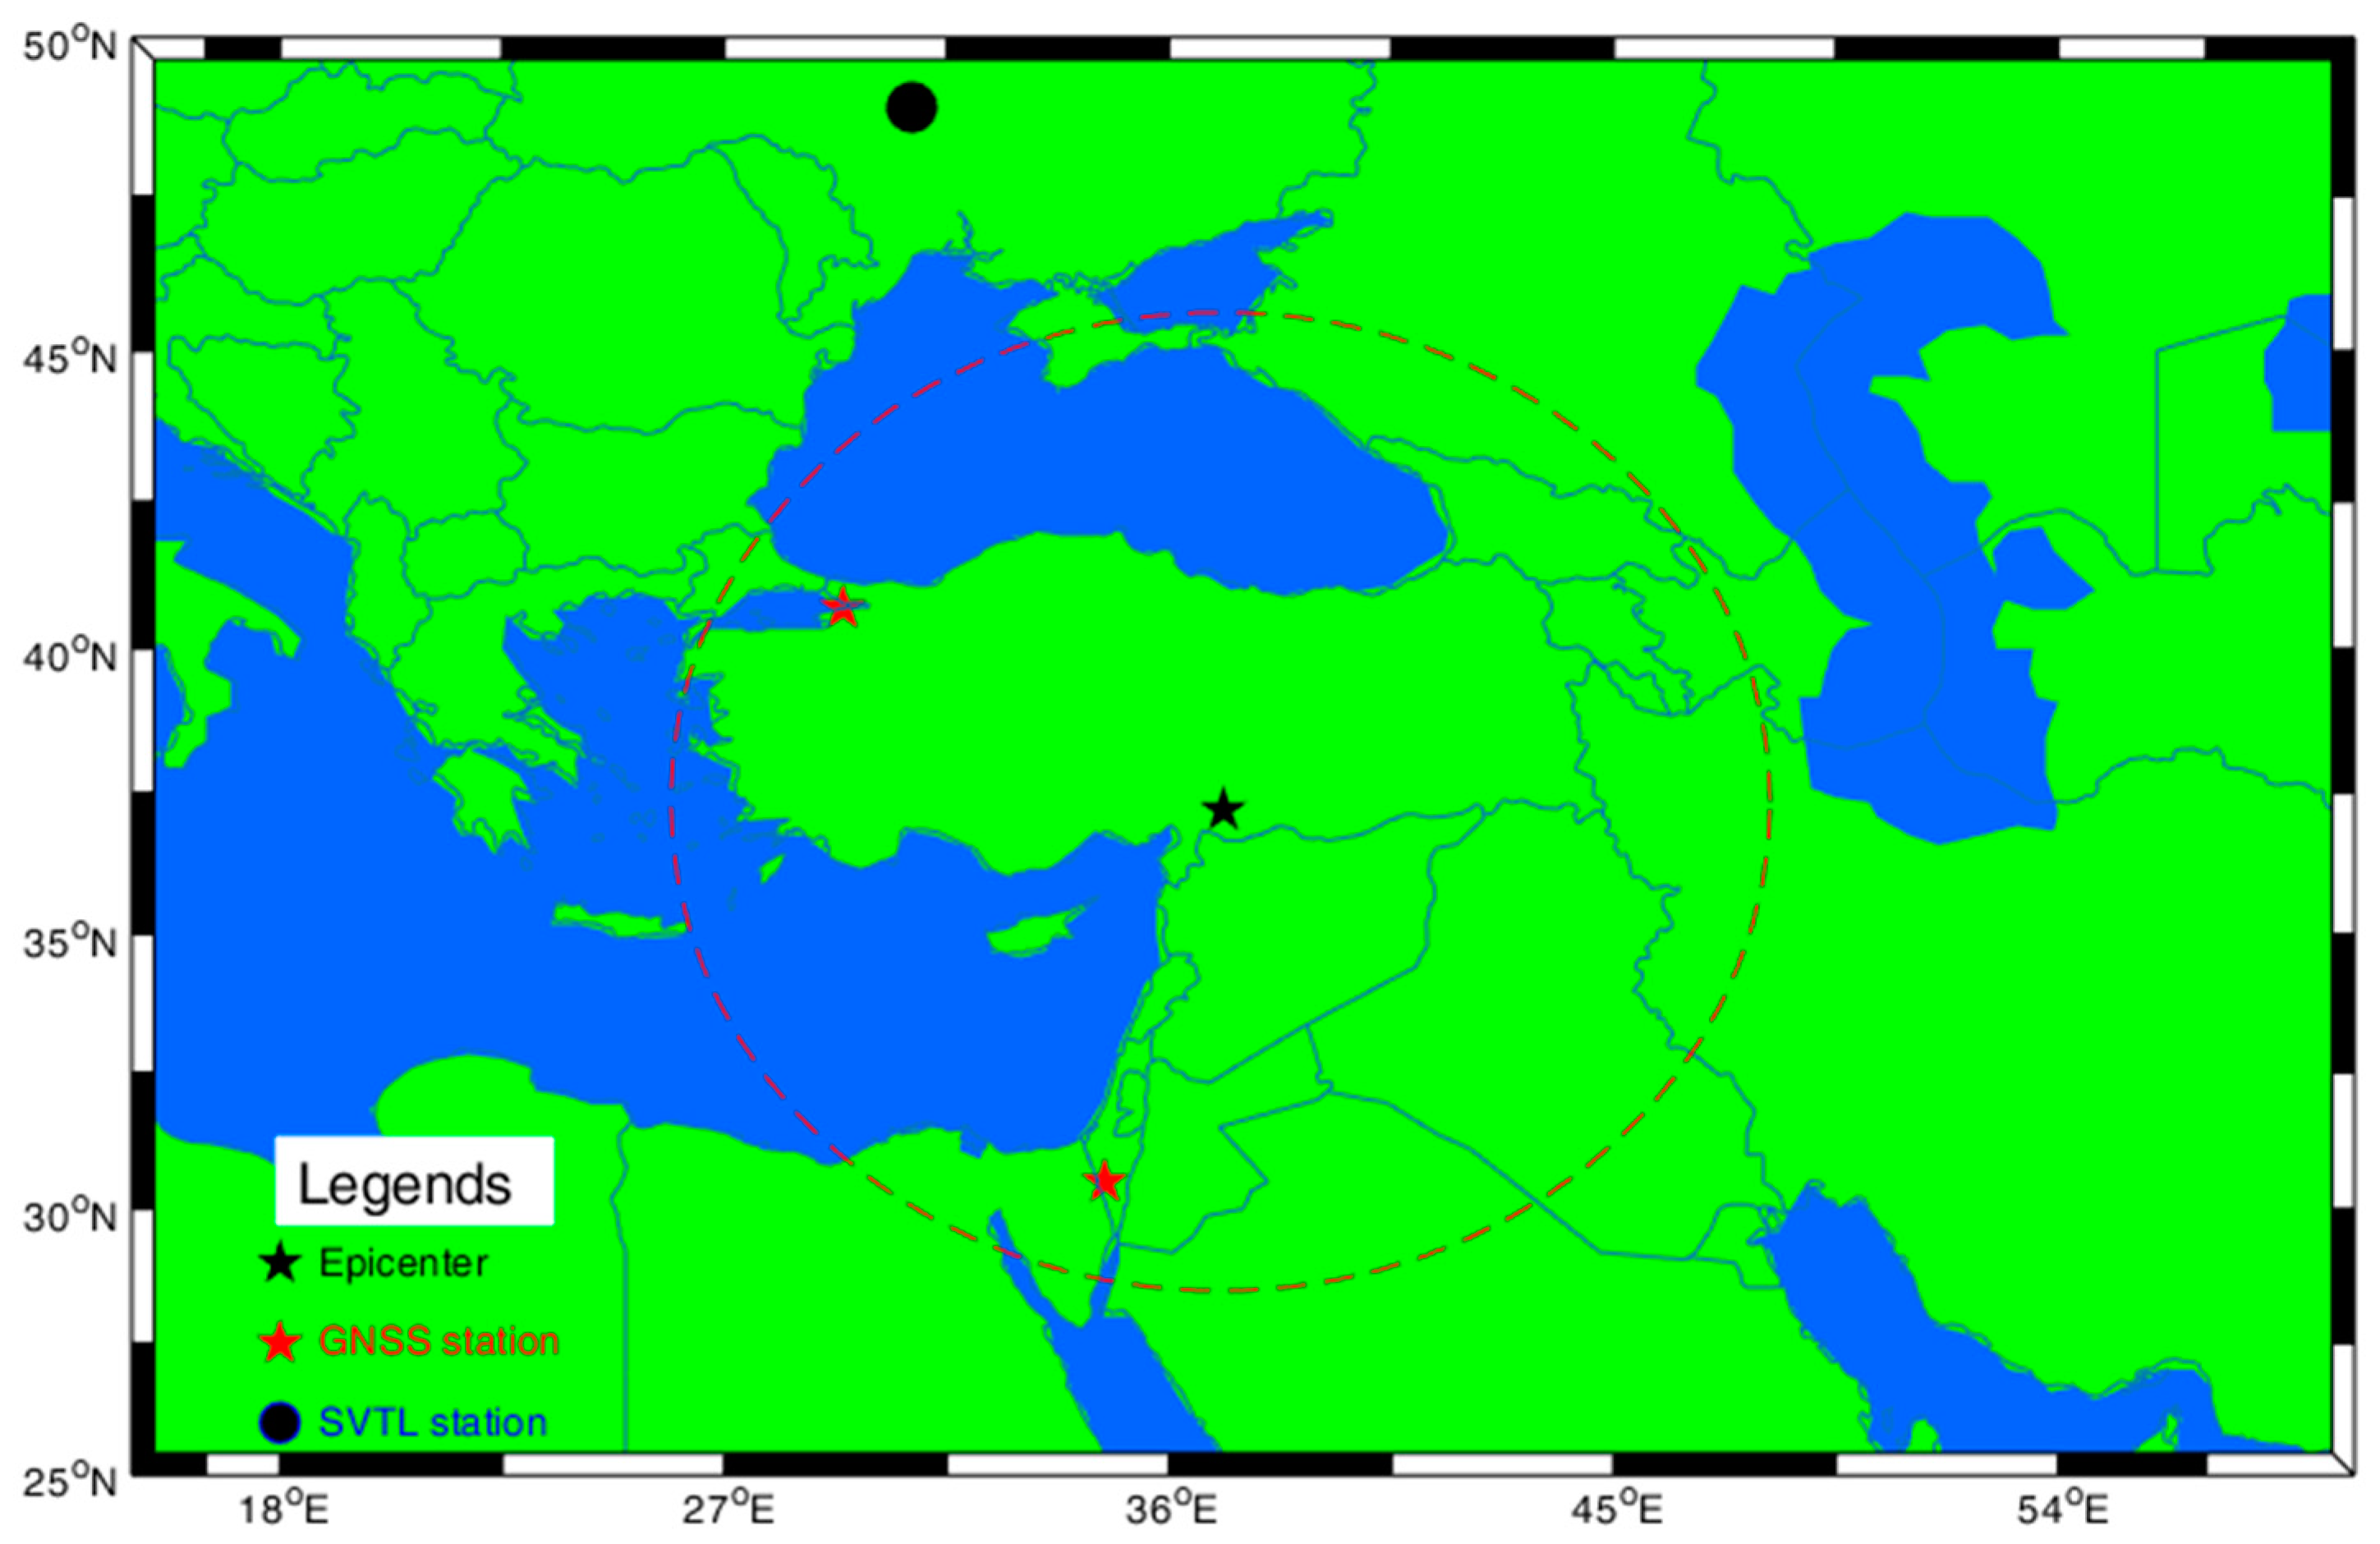
2. Area of Study
3. Data and Methods
3.1. Data
3.2. Methods
3.2.1. Statistical Method
3.2.2. NARX
4. Results
5. Discussion
6. Conclusions
Author Contributions
Funding
Data Availability Statement
Conflicts of Interest
References
- Tronin, A. Remote Sensing and Earthquakes: A Review. Phys. Chem. Earth 2006, 31, 138–142. [Google Scholar] [CrossRef]
- Lu, K.; Hou, M.; Jiang, Z.; Wang, Q.; Sun, G.; Liu, J. Understanding Earthquake from the Granular Physics Point of View-Causes of Earthquake, Earthquake Precursors and Predictions. Int. J. Mod. Phys. B 2018, 32, 1850081. [Google Scholar] [CrossRef]
- Sun, R.; Wang, J.; Cheng, Q.; Mao, Y.; Ochieng, W.Y. A New IMU-Aided Multiple GNSS Fault Detection and Exclusion Algorithm for Integrated Navigation in Urban Environments. GPS Solut. 2021, 25, 147. [Google Scholar] [CrossRef]
- Pikridas, C.; Bitharis, S.; Katsougiannopoulos, S.; Spanakaki, K.; Karolos, I.-A. Study of TEC Variations Using Permanent Stations GNSS Data in Relation with Seismic Events. Application on Samothrace Earthquake of 24 May 2014. Geod. Cartogr. 2019, 45, 137. [Google Scholar] [CrossRef]
- Jiao, Z.; Shan, X. Pre-Seismic Temporal Integrated Anomalies from Multiparametric Remote Sensing Data. Remote Sens. 2022, 14, 2343. [Google Scholar] [CrossRef]
- Xiong, P.; Shen, X.H.; Bi, Y.X.; Kang, C.L.; Chen, L.Z.; Jing, F.; Chen, Y. Study of Outgoing Longwave Radiation Anomalies Associated with Haiti Earthquake. Nat. Hazards Earth Syst. Sci. 2010, 10, 2169–2178. [Google Scholar] [CrossRef]
- Akyol, A.A.; Arikan, O.; Arikan, F. A Machine Learning-Based Detection of Earthquake Precursors Using Ionospheric Data. Radio Sci. 2020, 55, 1–21. [Google Scholar] [CrossRef]
- Dong, W.; Yang, Y.; Qu, J.; Xiao, S.; Li, Y. Local Information-Enhanced Graph-Transformer for Hyperspectral Image Change Detection with Limited Training Samples. IEEE Trans. Geosci. Remote Sens. 2023, 61, 5509814. [Google Scholar] [CrossRef]
- Vesnin, A.; Yasyukevich, Y.; Perevalova, N.; Şentürk, E. Ionospheric Response to the 6 February 2023 Turkey–Syria Earthquake. Remote Sens. 2023, 15, 2336. [Google Scholar] [CrossRef]
- Draz, M.U.; Shah, M.; Jamjareegulgarn, P.; Shahzad, R.; Hasan, A.M.; Ghamry, N.A. Deep Machine Learning Based Possible Atmospheric and Ionospheric Precursors of the 2021 Mw 7.1 Japan Earthquake. Remote Sens. 2023, 15, 1904. [Google Scholar] [CrossRef]
- Carter, B.A.; Kellerman, A.C.; Kane, T.A.; Dyson, P.L.; Norman, R.; Zhang, K. Ionospheric Precursors to Large Earthquakes: A Case Study of the 2011 Japanese Tohoku Earthquake. J. Atmos. Sol. Terr. Phys. 2013, 102, 290–297. [Google Scholar] [CrossRef]
- Colonna, R.; Filizzola, C.; Genzano, N.; Lisi, M.; Tramutoli, V. Optimal Setting of Earthquake-Related Ionospheric TEC (Total Electron Content) Anomalies Detection Methods: Long-Term Validation over the Italian Region. Geosciences 2023, 13, 150. [Google Scholar] [CrossRef]
- Maletckii, B.; Astafyeva, E.; Sanchez, S.A.; Kherani, E.A.; de Paula, E.R. The 6 February 2023 Türkiye Earthquake Sequence as Detected in the Ionosphere. J. Geophys. Res. Space Phys. 2023, 128, e2023JA031663. [Google Scholar] [CrossRef]
- Adil, M.A.; Şentürk, E.; Pulinets, S.A.; Amory-Mazaudier, C. A Lithosphere–Atmosphere–Ionosphere Coupling Phenomenon Observed Before M 7.7 Jamaica Earthquake. Pure Appl. Geophys. 2021, 178, 3869–3886. [Google Scholar] [CrossRef]
- Hafeez, A.; Shah, M.; Ehsan, M.; Jamjareegulgarn, P.; Ahmed, J.; Tariq, M.A.; Iqbal, S.; Naqvi, N.A. Possible Atmosphere and Ionospheric Anomalies of the 2019 Pakistan Earthquake Using Statistical and Machine Learning Procedures on MODIS LST, GPS TEC, and GIM TEC. IEEE J. Sel. Top. Appl. Earth Obs. Remote Sens. 2021, 14, 11126–11133. [Google Scholar] [CrossRef]
- Pulinets, S.; Ouzounov, D. Lithosphere–Atmosphere–Ionosphere Coupling (LAIC) Model—An Unified Concept for Earthquake Precursors Validation. J. Asian Earth Sci. 2011, 41, 371–382. [Google Scholar] [CrossRef]
- Shah, M.; Draz, M.U.; Saleem, T. A Comprehensive Study on the synchronized Outgoing Longwave Radiation and Relative Humidity Anomalies related to global Mw ≥ 6.5 Earthquakes. Nat. Hazards 2023, 7, 24–46. [Google Scholar] [CrossRef]
- Venkatanathan, N.; Kaarthick, B.; Priyadharshini, C. OLR Anomalies Prior to Big Earthquakes (Mw > 6.0)-a Case Study on Earthquakes of India’s Neighboring Region Occurred during the Year 2012. New Concepts Glob. Tecton. 2013, 1, 34–44. [Google Scholar]
- Alvan, H.V.; Azad, F.H.; Mansor, S. Latent Heat Flux and Air Temperature Anomalies along an Active Fault Zone Associated with Recent Iran Earthquakes. Adv. Space Res. 2013, 52, 1678–1687. [Google Scholar] [CrossRef]
- Mahmood, I.; Iqbal, M.F.; Shahzad, M.I.; Qaiser, S. Investigation of Atmospheric Anomalies Associated with Kashmir and Awaran Earthquakes. J. Atmos. Sol. Terr. Phys. 2017, 154, 75–85. [Google Scholar] [CrossRef]
- De Santis, A.; Abbattista, C.; Alfonsi, L.; Amoruso, L.; Campuzano, S.A.; Carbone, M.; Cesaroni, C.; Cianchini, G.; De Franceschi, G.; De Santis, A.; et al. Geosystemics View of Earthquakes. Entropy 2019, 21, 412. [Google Scholar] [CrossRef] [PubMed]
- Lizunov, G.; Skorokhod, T.; Hayakawa, M.; Korepanov, V. Formation of Ionospheric Precursors of Earthquakes—Probable Mechanism and Its Substantiation. Open J. Earthq. Res. 2020, 9, 142–169. [Google Scholar] [CrossRef]
- Du, W.; Wang, G. Fully probabilistic seismic displacement analysis of spatially distributed slopes using spatially correlated vector intensity measures. Earthq. Eng. Struct. Dyn. 2014, 43, 661–679. [Google Scholar] [CrossRef]
- Hayakawa, M.; Izutsu, J.; Schekotov, A.; Yang, S.-S.; Solovieva, M.; Budilova, E.; Nikolopoulos, D.; Martinez-Frias, J. Lithosphere-Atmosphere-Ionosphere Coupling Effects Based on Multiparameter Precursor Observations for February–March 2021 Earthquakes (M~7) in the Offshore of Tohoku Area of Japan. Geosciences 2021, 11, 481. [Google Scholar] [CrossRef]
- Tariq, M.A.; Shah, M.; Hernández-Pajares, M.; Iqbal, T. Pre-Earthquake Ionospheric Anomalies before Three Major Earthquakes by GPS-TEC and GIM-TEC Data during 2015–2017. Adv. Space Res. 2019, 63, 2088–2099. [Google Scholar] [CrossRef]
- Akhoondzadeh, M.; Parrot, M.; Saradjian, M.R. Electron and Ion Density Variations before Strong Earthquakes (M > 6.0) Using DEMETER and GPS Data. Nat. Hazards Earth Syst. Sci. 2010, 10, 7–18. [Google Scholar] [CrossRef]
- Chen, J.; Wen, L.; Bi, C.; Liu, Z.; Liu, X.; Yin, L.; Zheng, W. Multifractal analysis of temporal and spatial characteristics of earthquakes in Eurasian seismic belt. Open Geosci. 2023, 15, 20220482. [Google Scholar] [CrossRef]
- Zhou, G.; Zhang, H.; Xu, C.; Zhou, X.; Liu, Z.; Zhao, D.; Wu, G. A Real-Time Data Acquisition System for Single-Band Bathymetric LiDAR. IEEE Trans. Geosci. Remote Sens. 2023, 61, 5702721. [Google Scholar] [CrossRef]
- Freund, F. Charge Generation and Propagation in Igneous Rocks. J. Geodyn. 2002, 33, 543–570. [Google Scholar] [CrossRef]
- Yin, L.; Wang, L.; Ge, L.; Tian, J.; Yin, Z.; Liu, M.; Zheng, W. Study on the Thermospheric Density Distribution Pattern during Geomagnetic Activity. Appl. Sci. 2023, 13, 5564. [Google Scholar] [CrossRef]
- Liu, X.; Zhang, Q.; Shah, M.; Hong, Z. Atmospheric-Ionospheric Disturbances Following the April 2015 Calbuco Volcano from GPS and OMI Observations. Adv. Space Res. 2017, 60, 2836–2846. [Google Scholar] [CrossRef]
- Satti, M.S.; Ehsan, M.; Abbas, A.; Shah, M.; de Oliveira-Júnior, J.F.; Naqvi, N.A. Atmospheric and Ionospheric Precursors Associated with Mw≥ 6.5 Earthquakes from Multiple Satellites. J. Atmos. Sol. Terr. Phys. 2022, 227, 105802. [Google Scholar] [CrossRef]
- Shah, M.; Shahzad, R.; Jamjareegulgarn, P.; Ghaffar, B.; Oliveira-Júnior, J.F.d.; Hassan, A.M.; Ghamry, N.A. Machine-Learning-Based Lithosphere-Atmosphere-Ionosphere Coupling Associated with Mw > 6 Earthquakes in America. Atmosphere 2023, 14, 1236. [Google Scholar] [CrossRef]
- Eleftheriou, A.; Filizzola, C.; Genzano, N.; Lacava, T.; Lisi, M.; Paciello, R.; Pergola, N.; Vallianatos, F.; Tramutoli, V. Long-Term RST Analysis of Anomalous TIR Sequences in Relation with Earthquakes Occurred in Greece in the Period 2004–2013. Pure Appl. Geophys. 2016, 173, 285–303. [Google Scholar] [CrossRef]
- Su, Y.C.; Liu, J.Y.; Chen, S.P.; Tsai, H.F.; Chen, M.Q. Temporal and Spatial Precursors in Ionospheric Total Electron Content of the 16 October 1999 Mw7.1 Hector Mine Earthquake. J. Geophys. Res. Space Phys. 2013, 118, 6511–6517. [Google Scholar] [CrossRef]
- Xiong, P.; Tong, L.; Zhang, K.; Shen, X.; Battiston, R.; Ouzounov, D.; Iuppa, R.; Crookes, D.; Long, C.; Zhou, H. Towards Advancing the Earthquake Forecasting by Machine Learning of Satellite Data. Sci. Total Environ. 2021, 771, 145256. [Google Scholar] [CrossRef]
- Li, R.; Zhang, H.; Chen, Z.; Yu, N.; Kong, W.; Li, T.; Liu, Y. Denoising method of ground-penetrating radar signal based on independent component analysis with multifractal spectrum. Measurement 2022, 192, 110886. [Google Scholar] [CrossRef]
- Hafeez, A.; Ehsan, M.; Abbas, A.; Shah, M.; Shahzad, R. Machine Learning-Based Thermal Anomalies Detection from MODIS LST Associated with the Mw 7.7 Awaran, Pakistan Earthquake. Nat. Hazards 2022, 111, 2097–2115. [Google Scholar] [CrossRef]
- Jing, F.; Shen, X.H.; Kang, C.L.; Xiong, P. Variations of Multi-Parameter Observations in Atmosphere Related to Earthquake. Nat. Hazards Earth Syst. Sci. 2013, 13, 27–33. [Google Scholar] [CrossRef]
- Khan, M.M.; Ghaffar, B.; Shahzad, R.; Khan, M.R.; Shah, M.; Amin, A.H.; Eldin, S.M.; Naqvi, N.A.; Ali, R. Atmospheric Anomalies Associated with the 2021 Mw 7.2 Haiti Earthquake Using Machine Learning from Multiple Satellites. Sustainability 2022, 14, 14782. [Google Scholar] [CrossRef]
- Shi, K.; Guo, J.; Liu, X.; Liu, L.; You, X.; Wang, F. Seismo-Ionospheric Anomalies Associated with Mw 7.8 Nepal Earthquake on 2015 April 25 from CMONOC GPS Data. Geosci. J. 2020, 24, 391–406. [Google Scholar] [CrossRef]
- Abbasi, A.R.; Shah, M.; Ahmed, A.; Naqvi, N.A. Possible Ionospheric Anomalies Associated with the 2009 Mw 6.4 Taiwan Earthquake from DEMETER and GNSS TEC. Acta Geod. Geophys. 2021, 56, 77–91. [Google Scholar] [CrossRef]
- Schaer, S.; Société Helvétique des Sciences Naturelles; Commission Géodésique. Mapping and Predicting the Earth’s Ionosphere Using the Global Positioning System; Schweizerische Geodätische Kommission Zürich: Zürich, Switzerland, 1999; Volume 59. [Google Scholar]
- Dobrovolsky, I.P.; Zubkov, S.I.; Miachkin, V.I. Estimation of the Size of Earthquake Preparation Zones. Pure Appl. Geophys. 1979, 117, 1025–1044. [Google Scholar] [CrossRef]
- Nekoee, M.; Shah-Hosseini, R. Thermal Anomaly Detection Using NARX Neural Network Method to Estimate the Earthquake Occurrence Time. Earth Obs. Geomat. Eng. 2020, 4, 98–108. [Google Scholar] [CrossRef]
- Nugroho, H.A.; Joelianto, E.; Widiyantoro, S. Time Series Estimation of Earthquake Occurrences in Bali and Its Surroundings Using NARX Network Model. In Proceedings of the 2013 3rd International Conference on Instrumentation, Control and Automation, ICA 2013, Ungasan, Indonesia, 28–30 August 2013; pp. 251–256. [Google Scholar]
- Shah, M.; Jin, S.G. Statistical characteristics of seismo-ionospheric GPS TEC disturbances prior to global Mw ≥ 5.0 earthquakes (1998–2014). J. Geodyn. 2015, 92, 42–49. [Google Scholar] [CrossRef]
- Rawat, V.; Saraf, A.K.; Das, J.; Sharma, K.; Shujat, Y. Anomalous Land Surface Temperature and Outgoing Long-Wave Radiation Observations Prior to Earthquakes in India and Romania. Nat. Hazards 2011, 59, 33–46. [Google Scholar] [CrossRef]
- Shah, M.; Tariq, M.A.; Naqvi, N.A. Atmospheric Anomalies Associated with Mw>6.0 Earthquakes in Pakistan and Iran during 2010–2017. J. Atmos. Sol. Terr. Phys. 2019, 191, 105056. [Google Scholar] [CrossRef]
- Watada, S.; Kunugi, T.; Hirata, K.; Sugioka, H.; Nishida, K.; Sekiguchi, S.; Oikawa, J.; Tsuji, Y.; Kanamori, H. Atmospheric Pressure Change Associated with the 2003 Tokachi-Oki Earthquake. Geophys. Res. Lett. 2006, 33, L24306. [Google Scholar] [CrossRef]
- Shah, M.; Calabia, A.; Tariq, M.A.; Ahmed, J.; Ahmed, A. Possible ionosphere and atmosphere precursory analysis related to Mw >6.0 earthquakes in Japan. Remote Sens. Environ. 2020, 239, 111620. [Google Scholar] [CrossRef]
- Shah, M.; Ahmed, A.; Ehsan, M.; Khan, M.; Tariq, M.A.; Calabia, A.; Rahman, Z. Total electron content anomalies associated with earthquakes occurred during 1998–2019. Acta Astronaut. 2020, 175, 268–276. [Google Scholar] [CrossRef]
- Troyan, V.N.; Hayakawa, M. Seismo Electromagnetics: Lithosphere-Atmosphere-Ionosphere Coupling. In Seismo Electromagnetics: Lithosphere-Atmosphere-Ionosphere Coupling; Terrapub: Tokyo, Japan, 2002. [Google Scholar]
- Freund, F.T.; Takeuchi, A.; Lau, B.W.S.; Al-Manaseer, A.; Fu, C.C.; Bryant, N.A.; Ouzounov, D. Stimulated Infrared Emission from Rocks: Assessing a Stress Indicator. eEarth 2007, 2, 7–16. [Google Scholar] [CrossRef]
- Walker, R.; Jackson, J. Offset and Evolution of the Gowk Fault, SE Iran: A Major Intra-Continental Strike-Slip System. J. Struct. Geol. 2002, 24, 1677–1698. [Google Scholar] [CrossRef]
- Mohamed, E.K.; Elrayess, M.; Omar, K. Evaluation of Thermal Anomaly Preceding Northern Red Sea Earthquake, the 16th June 2020. Arab. J. Sci. Eng. 2022, 47, 7387–7406. [Google Scholar] [CrossRef]
- Ouzounov, D.; Freund, F. Mid-Infrared Emission Prior to Strong Earthquakes Analyzed by Remote Sensing Data. Adv. Space Res. 2004, 33, 268–273. [Google Scholar] [CrossRef]
- Ondoh, T. Anomalous Sporadic-E Layers Observed before M7. 2 Hyogo-Ken Nanbu Earthquake; Terrestrial Gas Emanation Model. Adv. Polar Up. Atmos. Res. 2003, 17, 96–108. [Google Scholar]
- Kuo, C.L.; Huba, J.D.; Joyce, G.; Lee, L.C. Ionosphere Plasma Bubbles and Density Variations Induced by Pre-Earthquake Rock Currents and Associated Surface Charges. J. Geophys. Res. Space Phys. 2011, 116, A10317. [Google Scholar] [CrossRef]
- Zhou, G.; Xu, J.; Hu, H.; Liu, Z.; Zhang, H.; Xu, C.; Zhao, Y. Off-Axis Four-Reflection Optical Structure for Lightweight Single-Band Bathymetric LiDAR. IEEE Trans. Geosci. Remote Sens. 2023, 61, 1000917. [Google Scholar] [CrossRef]
- Shahzad, F.; Shah, M.; Riaz, S.; Ghaffar, B.; Ullah, I.; Eldin, S.M. Integrated Analysis of Lithosphere-Atmosphere-Ionospheric Coupling Associated with the 2021 Mw 7.2 Haiti Earthquake. Atmosphere 2023, 14, 347. [Google Scholar] [CrossRef]
- Zhao, Z.; Xu, G.; Zhang, N.; Zhang, Q. Performance analysis of the hybrid satellite-terrestrial relay network with opportunistic scheduling over generalized fading channels. IEEE Trans. Veh. Technol. 2022, 71, 2914–2924. [Google Scholar] [CrossRef]
- Wu, M.; Ba, Z.; Liang, J. A procedure for 3D simulation of seismic wave propagation considering source-path-site effects: Theory, verification and application. Earthq. Eng. Struct. Dyn. 2022, 51, 2925–2955. [Google Scholar] [CrossRef]
- Ma, S.; Qiu, H.; Yang, D.; Wang, J.; Zhu, Y.; Tang, B.; Cao, M. Surface multi-hazard effect of underground coal mining. Landslides 2023, 20, 39–52. [Google Scholar] [CrossRef]
- Zheng, B.; Lin, D.; Qi, S.; Hu, Y.; Jin, Y.; Chen, Q.; Yan, R. Turbulent skin-friction drag reduction by annular dielectric barrier discharge plasma actuator. Phys. Fluids 2023, 35, 125129. [Google Scholar] [CrossRef]
- Yin, H.; Wu, Q.; Yin, S.; Dong, S.; Dai, Z.; Soltanian, M.R. Predicting mine water inrush accidents based on water level anomalies of borehole groups using long short-term memory and isolation forest. J. Hydrol. 2023, 616, 128813. [Google Scholar] [CrossRef]
- Qasim, M.; Shah, M.; Shahzad, R.; Jamjareegulgarn, P. Atmospheric precursors from multiple satellites associated with the 2020 Mw 6.5 Idaho (USA) earthquake. Adv. Space Res. 2023, 73, 440–455. [Google Scholar] [CrossRef]
- Morales, A.M.; Becerra, G.E.V.; Almaraz, J.R.M.; Felix, C.A.M.; Shah, M. Applying support vector machine (SVM) using GPS-TEC and Space Weather parameters to distinguish ionospheric disturbances possibly related to earthquakes. Adv. Space Res. 2023, 72, 4420–4434. [Google Scholar] [CrossRef]
- Zhang, S.; Bai, X.; Zhao, C.; Tan, Q.; Luo, G.; Wang, J.; Xi, H. Global CO2 Consumption by Silicate Rock Chemical Weathering: Its Past and Future. Earth’s Future 2021, 9, e1938E–e2020E. [Google Scholar] [CrossRef]
- Yin, L.; Wang, L.; Li, J.; Lu, S.; Tian, J.; Yin, Z.; Zheng, W. YOLOV4_CSPBi: Enhanced Land Target Detection Model. Land 2023, 12, 1813. [Google Scholar] [CrossRef]
- Liu, Q.Y.; Li, D.Q.; Tang, X.S.; Du, W. Predictive Models for Seismic Source Parameters Based on Machine Learning and General Orthogonal Regression Approaches. Bull. Seismol. Soc. Am. 2023, 113, 2363–2376. [Google Scholar] [CrossRef]
- Zhu, W.; Chen, J.; Sun, Q.; Li, Z.; Tan, W.; Wei, Y. Reconstructing of High-Spatial-Resolution Three-Dimensional Electron Density by Ingesting SAR-Derived VTEC into IRI Model. IEEE Geosci. Remote Sens. Lett. 2022, 19, 4508305. [Google Scholar] [CrossRef]
- Zhou, G.; Zhao, D.; Zhou, X.; Xu, C.; Liu, Z.; Wu, G.; Zou, L. An RF Amplifier Circuit for Enhancement of Echo Signal Detection in Bathymetric LiDAR. IEEE Sens. J. 2022, 22, 20612–20625. [Google Scholar] [CrossRef]
- Dong, W.; Zhao, J.; Qu, J.; Xiao, S.; Li, N.; Hou, S.; Li, Y. Abundance Matrix Correlation Analysis Network Based on Hierarchical Multihead Self-Cross-Hybrid Attention for Hyperspectral Change Detection. IEEE Trans. Geosci. Remote Sens. 2023, 61, 5501513. [Google Scholar] [CrossRef]
- Khan, A.Q.; Ghaffar, B.; Shah, M.; Ullah, I.; Oliveira-Júnior, J.F.; Eldin, S.M. Possible seismo-ionospheric anomalies associated with the 2016 Mw 6.5 Indonesia earthquake from GPS TEC and Swarm satellites. Front. Astron. Space Sci. 2022, 9, 1065453. [Google Scholar] [CrossRef]


| No. | Station Name | Distance from Epicenter (km) | Coordinates | Country | |
|---|---|---|---|---|---|
| Latitude | Longitude | ||||
| 1 | TUBI | 764 | 40.7°N | 29.4°E | Turkey |
| 2 | RAMO | 776 | 30.5°N | 34.7°E | Israel |
| 3 | SVTL | 2640 | 60.5°N | 29.7°E | Russia |
| Variable | Anomalous Days | Deviation from Bounds |
|---|---|---|
| OLR | −6 | 4.6 W/m2 |
| RH | −7, −6 | −0.5, −4.1% |
| AP | −6 | −0.51 kPa |
| AT | −6 | 3.26 K |
| SST | −7 | −1.6 K |
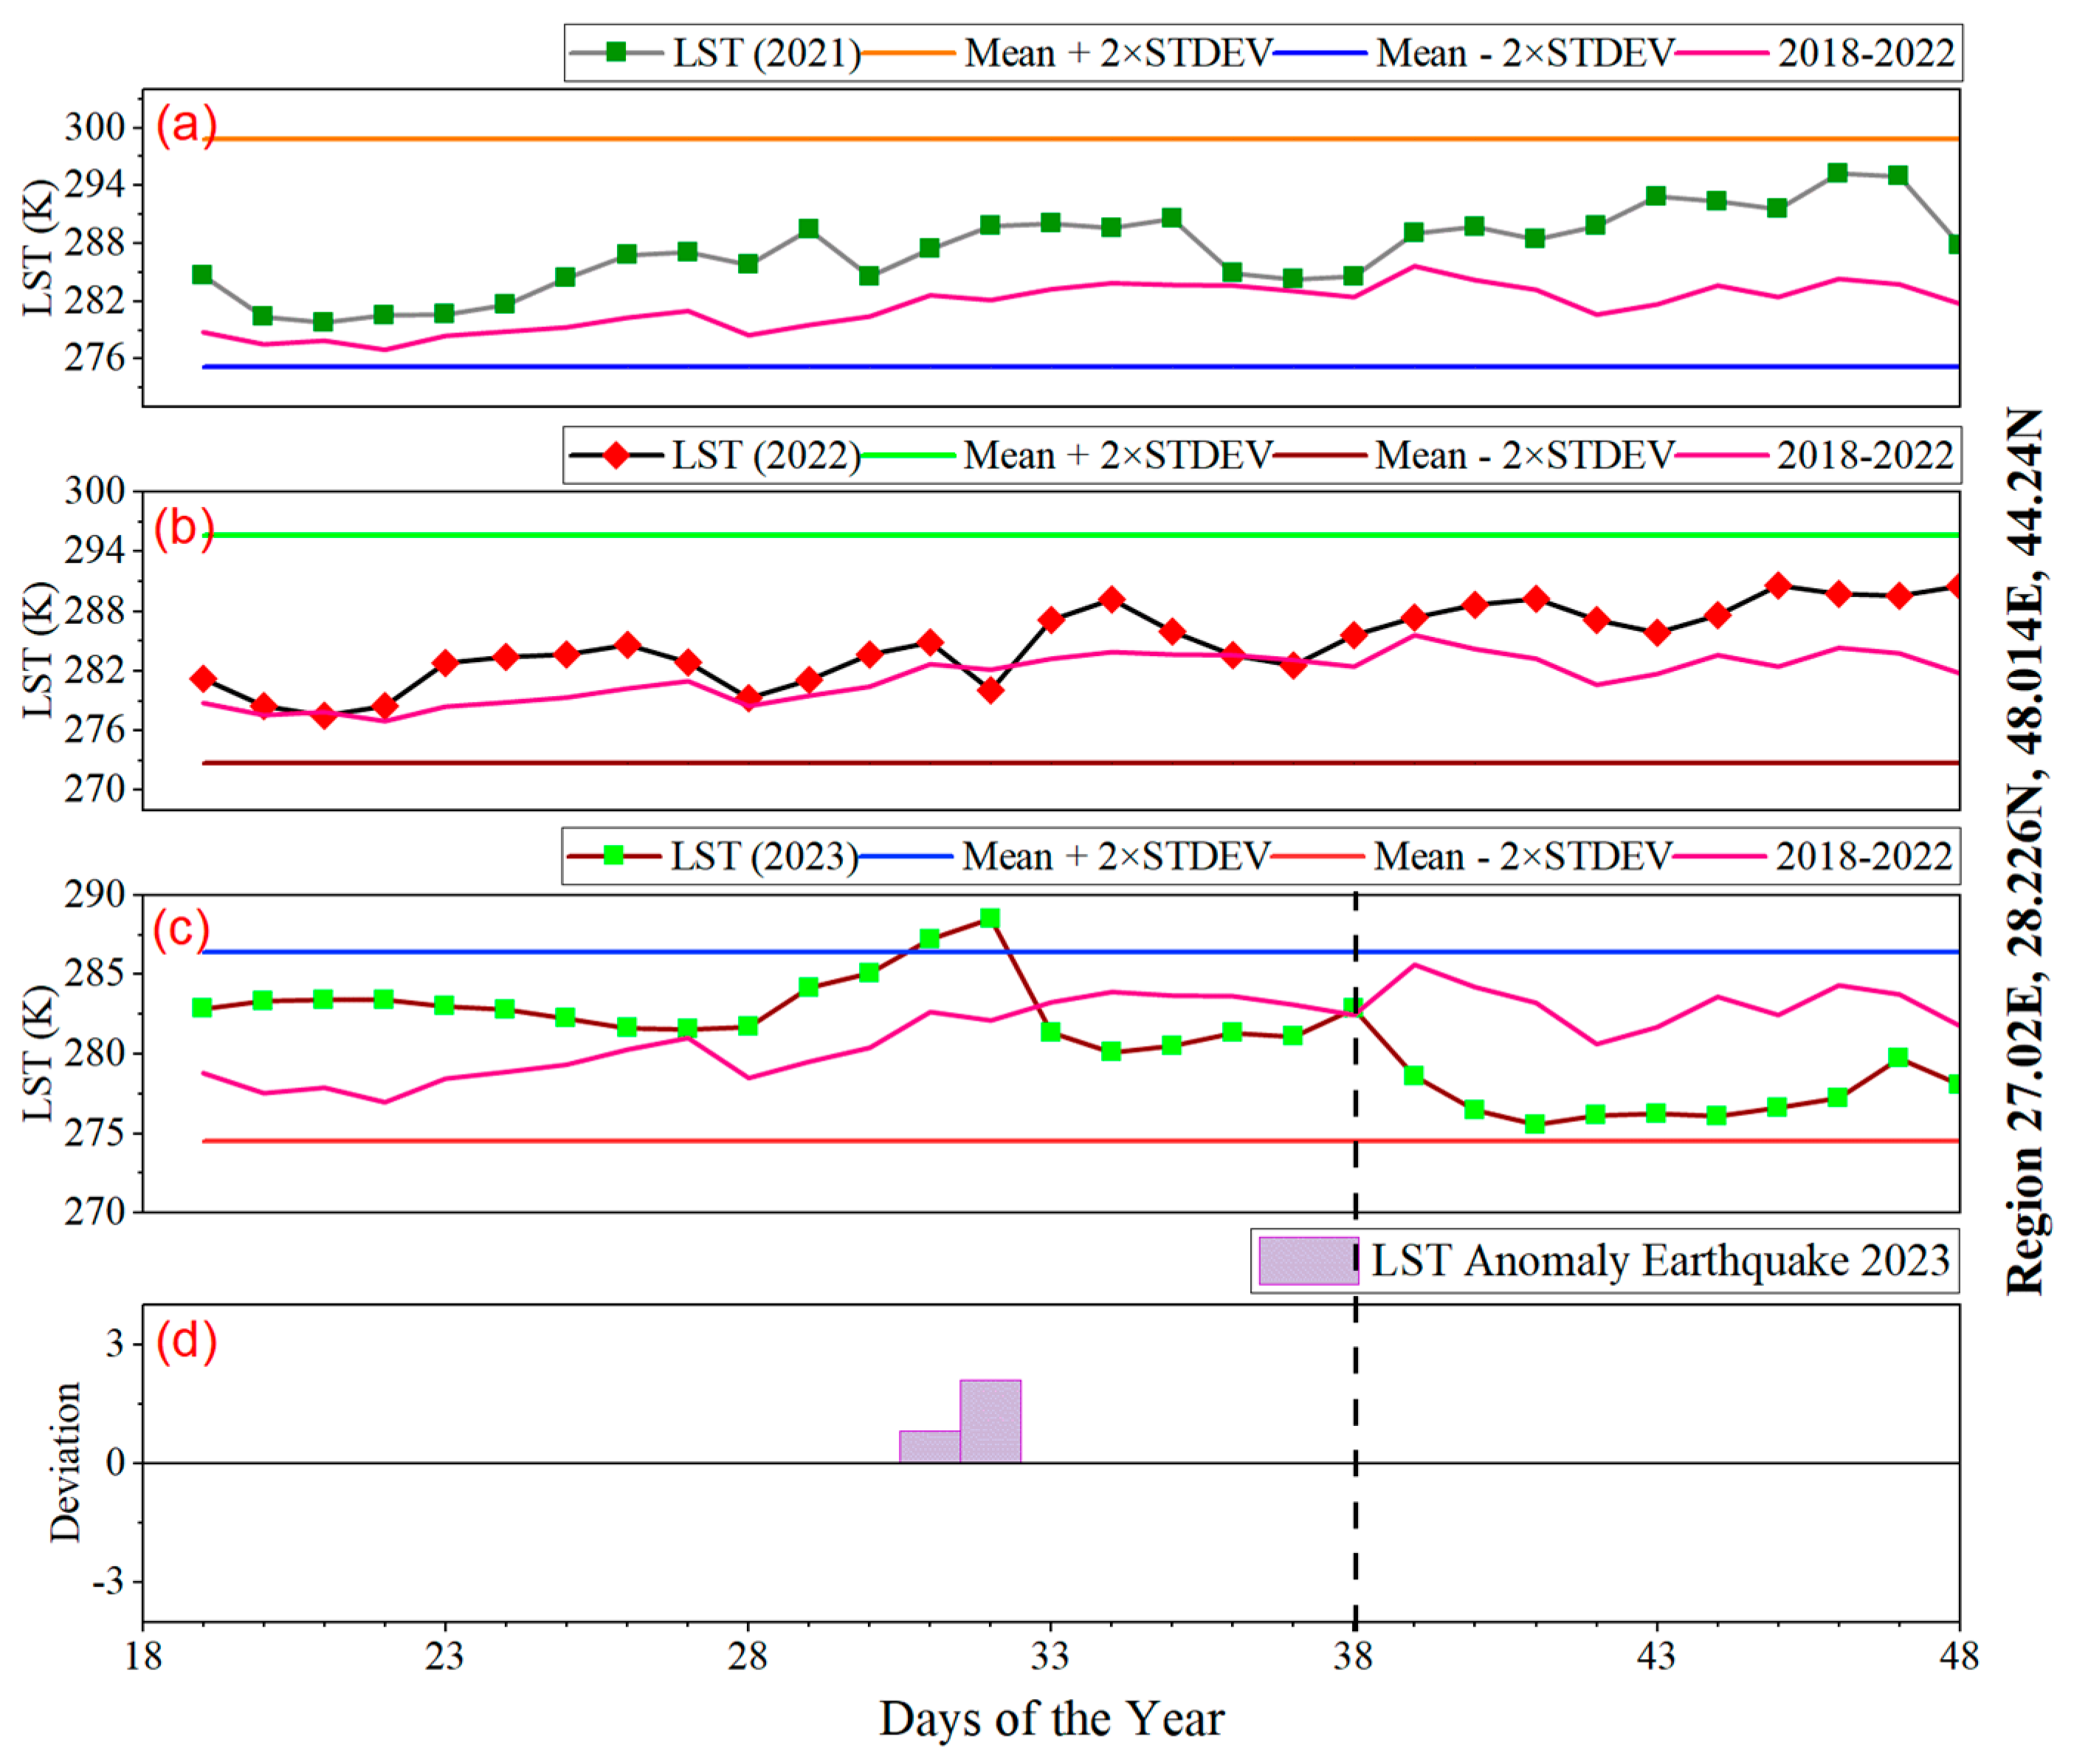
| LST | −7, −6 | 0.8, 2.1 K |
| TEC (TUBI) | −7, −6, 9 | 7.6, 3.9, 4.8 TECU |
| TEC (RAMO) | −7, −6, 9 | 9.5, 5.4, 2.7 TECU |
| TEC (SVTL) | 9 | 5.8 TECU |
| Variable | Anomalous Days | Variation from NARX-Estimated Value |
|---|---|---|
| OLR | −7, −6 | 7.1, 19.5 W/m2 |
| RH | −7, −6 | −7, −12% |
| AP | −6 | −1.75 kPa |
| AT | −7, −6 | 2.3, 6.7 K |
| SST | −7 | −6.7 K |
| LST | −7, −6 | 5.7, 7.1 K |
| TEC (TUBI) | −7, −6, 9 | 9.1, 7.7, 16.2 TECU |
| TEC (RAMO) | −7, −6, 9 | 12.5, 9.8, 8.2 TECU |
| TEC (SVTL) | 9 | 15.5 TECU |
Disclaimer/Publisher’s Note: The statements, opinions and data contained in all publications are solely those of the individual author(s) and contributor(s) and not of MDPI and/or the editor(s). MDPI and/or the editor(s) disclaim responsibility for any injury to people or property resulting from any ideas, methods, instructions or products referred to in the content. |
© 2024 by the authors. Licensee MDPI, Basel, Switzerland. This article is an open access article distributed under the terms and conditions of the Creative Commons Attribution (CC BY) license (https://creativecommons.org/licenses/by/4.0/).
Share and Cite
Haider, S.F.; Shah, M.; Li, B.; Jamjareegulgarn, P.; de Oliveira-Júnior, J.F.; Zhou, C. Synchronized and Co-Located Ionospheric and Atmospheric Anomalies Associated with the 2023 Mw 7.8 Turkey Earthquake. Remote Sens. 2024, 16, 222. https://doi.org/10.3390/rs16020222
Haider SF, Shah M, Li B, Jamjareegulgarn P, de Oliveira-Júnior JF, Zhou C. Synchronized and Co-Located Ionospheric and Atmospheric Anomalies Associated with the 2023 Mw 7.8 Turkey Earthquake. Remote Sensing. 2024; 16(2):222. https://doi.org/10.3390/rs16020222
Chicago/Turabian StyleHaider, Syed Faizan, Munawar Shah, Bofeng Li, Punyawi Jamjareegulgarn, José Francisco de Oliveira-Júnior, and Changyu Zhou. 2024. "Synchronized and Co-Located Ionospheric and Atmospheric Anomalies Associated with the 2023 Mw 7.8 Turkey Earthquake" Remote Sensing 16, no. 2: 222. https://doi.org/10.3390/rs16020222