Article

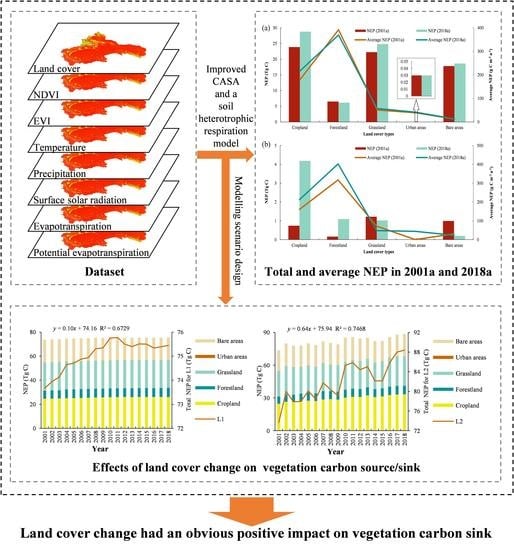
Effects of Land Cover Change on Vegetation Carbon Source/Sink in Arid Terrestrial Ecosystems of Northwest China, 2001–2018

1
State Key Laboratory of Desert and Oasis Ecology, Xinjiang Institute of Ecology and Geography, Chinese Academy of Sciences, Urumqi 830011, China
2
University of Chinese Academy of Sciences, Beijing 100049, China
3
CAS Research Center for Ecology and Environment of Central Asia, Urumqi 830011, China
4
Department of Geography, Ghent University, 9000 Ghent, Belgium
*
Author to whom correspondence should be addressed.
Remote Sens. 2023, 15(9), 2471; https://doi.org/10.3390/rs15092471
Submission received: 3 April 2023 / Accepted: 6 May 2023 / Published: 8 May 2023
(This article belongs to the Special Issue Remote Sensing of Interaction between Human and Natural Ecosystem)

Abstract

:
The arid terrestrial ecosystem carbon cycle is one of the most important parts of the global carbon cycle, but it is vulnerable to external disturbances. As the most direct factor affecting the carbon cycle, how land cover change affects vegetation carbon sources/sinks in arid terrestrial ecosystems remains unclear. In this study, we chose the arid region of northwest China (ARNWC) as the study area and used net ecosystem productivity (NEP) as an indicator of vegetation carbon source/sink. Subsequently, we described the spatial distribution and temporal dynamics of vegetation carbon sources/sinks in the ARNWC from 2001–2018 by combining the Carnegie-Ames-Stanford Approach (CASA) and a soil microbial heterotrophic respiration (RH) model and assessed the effects of land cover change on them through modeling scenario design. We found that land cover change had an obvious positive impact on vegetation carbon sinks. Among them, the effect of land cover type conversion contributed to an increase in total NEP of approximately 1.77 Tg C (reaching 15.55% of the original value), and after simultaneously considering the effect of vegetation growth enhancement, it contributed to an increase in total NEP of approximately 14.75 Tg C (reaching 129.61% of the original value). For different land cover types, cropland consistently contributed the most to the increment of NEP, and the regeneration of young and middle-aged forests also led to a significant increase in forest carbon sinks. Thus, our findings provide a reference for assessing the effects of land cover change on vegetation carbon sinks, and they indicated that cropland expansion and anthropogenic management dominated the growth of vegetation carbon sequestration in the ARNWC, that afforestation also benefits the carbon sink capacity of terrestrial ecosystems, and that attention should be paid to restoring and protecting native vegetation in forestland and grassland regions in the future.

Graphical Abstract

1. Introduction

As one of the three largest carbon pools on Earth, terrestrial ecosystems absorb approximately 28–31% of anthropogenic CO2 emissions from the atmosphere [1,2], so enhancing the carbon sink function of terrestrial ecosystems can be effective in mitigating rising atmospheric CO2 concentrations and limiting global warming [3]. The terrestrial ecosystem carbon cycle has great spatial and temporal heterogeneity, and monitoring its spatial and temporal variability is the key to accurately predicting future climate change and formulating climate negotiation strategies [4]. Therefore, the terrestrial ecosystem carbon cycle has become one of the core contents of research on global change and has received widespread attention from the international community [5].
Above all, the carbon sink effects provided by terrestrial ecosystems are essential for preserving nature and the survival of human society. However, such things as economic development and the intensification of human production activities (fossil fuel use, irrational land use, etc.) have led to increasing greenhouse gas emissions, which have disrupted the original source-sink balance of terrestrial ecosystems [6]. Among them, land cover change has altered the original land cover pattern, with a wide range and intensity of impact. Therefore, land cover change can directly disturb the terrestrial ecosystem carbon cycle [7] and have a great influence on terrestrial ecosystem functions [8].
Arid terrestrial ecosystems are generally fragile and vulnerable to external disturbances. However, the research regarding how land cover change affects vegetation carbon sources/sinks in arid regions is limited, and most studies have concentrated on the carbon fluxes of individual terrestrial ecosystems (e.g., grasslands, forests, etc.) without comparing the interactions between different terrestrial ecosystems [9]. The arid region of Northwest China (ARNWC) is far inland, experiences an arid climate with little rainfall, and its fragile ecosystems have a low self-regulatory capacity against external disturbances. Since the 1940s, the dramatic increase in population, socioeconomic development, and large-scale soil and water resource exploitation in the ARNWC have caused excessive depletion of resources, giving rise to many ecological issues, including land degradation and desertification, the degradation of riparian forest ecosystems, and the reduced carrying capacity of grasslands [10]. To solve these problems, a number of ecological restoration projects were launched in China between the late 1990s and the beginning of the 21st century, for instance, the grain for green program and the natural forest protection project, which were aimed at strengthening environmental restoration by closing hills for afforestation, planting trees on wastelands, and prohibiting grazing [11,12,13]. In this context, the land cover pattern of the ARNWC has experienced substantial changes [14]. However, the effects of land cover change on the ecosystem vegetation carbon sources/sinks in the ARNWC are still unclear, and whether the ARNWC, especially the bare areas that contain desert ecosystems, is a carbon source or a carbon sink remains uncertain [15,16,17,18]. Given these findings, it is crucial to analyze the spatial distribution and temporal variation characteristics of vegetation carbon sources/sinks and assess their impacts on land cover change in the ARNWC. This work can provide a scientific basis for the conservation and management of the ecological environment in arid regions, provide a reference for the rational use and planning of land resources, and regulate human activities under the premise of reducing carbon emissions.
The methods for estimating carbon sinks mainly include four approaches: field surveys [19,20,21,22], flux measurements [23,24,25], atmospheric inversions [26,27,28], and model simulations [29,30]. From an ecological perspective, carbon cycling processes and storage cycles in terrestrial ecosystems can also be calibrated based on biological productivity, which includes four parameters: gross primary productivity (GPP), net primary productivity (NPP), net ecosystem productivity (NEP), and net biome productivity (NBP) [31]. Among them, NEP is usually regarded as an indicator of terrestrial ecosystem carbon sources/sinks, and it is calculated by taking the gap between the carbon dioxide absorbed by vegetation through photosynthesis and the carbon consumed by vegetation autotrophic respiration (RA) and soil microbial heterotrophic respiration (RH), in which a positive NEP denotes a carbon sink and a negative NEP denotes a carbon source [32]. Therefore, terrestrial ecosystems’ vegetation carbon sink can be evaluated using a model simulation approach. NPP and RH are the two key factors in estimating NEP. The current models for estimating regional NPP fall into three types: statistical models, process-based models, and light use efficiency (LUE) models [33]. Among them, statistical models are simple to operate, but they are mainly based on climatic factors to construct models, which cannot deeply analyze the factors affecting biological productivity, especially the effects of land cover change due to human activities [34]. Process-based models estimate biological productivity by considering the physiological and ecological processes in plants, which helps to understand the interactions between vegetation and the environment, but their algorithms are more complex, have more input data, and are more computationally intensive, which makes it difficult to achieve large-scale biological productivity estimates with high spatial and temporal resolution [35]. LUE models are also well grounded in biophysics and are widely used due to their fewer parameters and higher accuracy of simulation. The Carnegie–Ames–Stanford Approach (CASA) is the most widely used representative of the LUE models [4]. However, CASA models are affected by varying input data sources and parameter localization, which may cause the estimates to be inaccurate in terms of local conditions [36], and therefore CASA models often need to be improved in the application process. Furthermore, current estimates of RH are mainly made by constructing empirical models of RH and its influencing factors [37,38]. Among them, the model proposed by Huang et al. can rapidly and accurately obtain the regional RH by requiring only two factors: precipitation and NPP. Its results were validated by two datasets from around the world, and it was found to be better than other models that consider more factors [37].
Therefore, the main focus of this study includes (1) analyzing the number and spatial distribution of land cover changes in the ARNWC from 2001 to 2018; (2) estimating the vegetation carbon sources/sinks in the ARNWC from 2001 to 2018 using an improved CASA model and a soil microbial heterotrophic respiration model with NEP as an indicator of carbon source/sink and analyzing its spatial distribution and temporal variation characteristics; and (3) assessing the impact of land cover change on vegetation carbon source/sink. The findings of this study can (1) provide a reference for whether arid regions, especially desert ecosystems, are sinks or sources, (2) help explore the impact of land cover change on vegetation carbon sources/sinks in drylands, and (3) provide scientific guidance for subsequent environmental management efforts.

2. Materials and Methods

2.1. Study Area

The arid region of northwest China (ARNWC), which lies between 73°44′E–106°46′E and 34°54′N–49°19′N, has a total area of about 2.35 million km2 (Figure 1). The ARNWC includes the whole territory of Xinjiang, the Hexi Corridor, the Qilian Mountains, the Alxa Plateau, and the area west of the Helan Mountains, and it is an important part of arid Central Asia [39]. The ARNWC has a unique and diverse landscape that includes mountains, oases, and deserts. Due to water shortages and high evapotranspiration rates, there is low vegetation coverage in this region. The native vegetation in this extremely fragile ecological environment includes plants with shallow roots and a large number of dry, drought-tolerant, salinity-tolerant vegetation that is also sand resistant [40].

2.2. Dataset

In this study, we collected a variety of sources of vegetation and climate data to drive the model (Table 1). To ensure data consistency and facilitate subsequent analysis, all data were unified to the Albers equal area conic projection with WGS 84 as the datum, and by using the neighbor assignment method and bilinear interpolation method, the spatial resolution of vegetation and meteorological data was further resampled to 500 m, respectively [41].
The Climate Change Initiative-Land Cover (CCI-LC) dataset was obtained from the European Space Agency (https://www.esa-landcover-cci.org (accessed on 22 September 2022)). We accessed data for each year from 2001 to 2018 and classified the land cover types as cropland, forestland, grassland, urban areas, and bare areas according to the IPCC classes considered for change detection. As we mainly considered the carbon source/sink of vegetation, we did not consider water bodies or land permanently covered by snow and ice; thus, these were excluded from this study. Ultimately, the total area of the five remaining land cover types in the study area is approximately 2.06 million km2. The MOD13Q1 vegetation index products (NDVI and EVI) were obtained from the National Aeronautics and Space Administration (https://ladsweb.modaps.eosdis.nasa.gov/search (accessed on 6 March 2022)). When we acquired this data. It was first pretreated by format conversion, mosaic, and projection, revised by its quality control layer, eliminating outliers and masks, and eventually synthesized to a monthly scale by applying the maximum synthesis method. For resampling these vegetation data, we chose the nearest neighbor assignment method that is suitable for discrete data, which will not change the pixel values and has a maximum spatial error of half the pixel size. The monthly average temperature and precipitation dataset for China was obtained from the National Earth System Science Data Center, National Science and Technology Infrastructure of China (http://www.geodata.cn (accessed on 4 March 2021)) [41]. The surface solar radiation dataset was obtained from the National Tibetan Plateau Data Center (https://data.tpdc.ac.cn (accessed on 8 March 2022)) [42]. The monthly scale potential evapotranspiration (PET) and evapotranspiration (ET) data were obtained from the University of California Climatology Laboratory (https://www.climatologylab.org/terraclimate.html (accessed on 29 April 2022)) [43]. These data were all pretreated by format conversion, projection, and mask. In addition, considering that meteorological data are continuous, we chose the bilinear interpolation method to resample these data to 500 m, as this method uses the weighted distance average of the four most adjacent pixels as the target pixel value, and the processing can produce a smoothing effect on the data, thus it is considered to be suitable for resampling continuous data.
The measured data are mainly from the work of Yang et al. [44] and Mohammat et al. [45]. They collected above-ground biomass in the wild from July to September of each year from 2001–2005. The locations included the Bayinbuluk Grassland Eco-System Research Station, the Chinese Academy of Sciences, and the temperate grasslands of northern China. In the sampling process, a large sample plot of 10 m × 10 m was first set up, from which five small sample plots were taken to investigate the vegetation species, height, cover, longitude and latitude, etc. Next, the above-ground part of the vegetation was mowed flush with the ground, removing the incidental soil and gravel, and taken back to the laboratory to be dried at 65 °C to a constant weight. Finally, the average value of above-ground biomass of the five small sample plots was taken as the value of the large sample plot and converted to carbon sequestration (g C/m2) by a 0.45 conversion factor. Eventually, a total of 21 measured points were collected for the validation of the NPP simulation results in our study.
The study area boundary was extracted from the 1:100,000 land desertification dataset for the ARNWC, which was obtained from the National Cryosphere Desert Data Center (http://www.ncdc.ac.cn (accessed on 9 January 2022)).

2.3. Methods

2.3.1. CASA Model

The CASA model belongs to the LUE models. It has been widely used due to its good biophysical basis and simplicity of calculation [4]. It works by taking two variables, including absorbed photosynthetically active radiation (APAR) and a light use efficiency factor (ε), as the main drivers of the model. Additionally, the model considers the influence of water and temperature stress on vegetation [46,47]. The relevant equations are as follows:
N P P = A P A R × ε
where NPP denotes the net primary productivity (g C/m2/month); APAR denotes the absorbed photosynthetically active radiation (MJ/m2/month); and ε denotes the actual light use efficiency (g C/MJ).
A P A R = S O L × F P A R × 0.5
ε = T ε 1 × T ε 2 × W ε × ε m a x
where SOL denotes the total solar radiation (MJ/m2/month); FPAR is the fraction of incident photosynthetically active solar radiation absorbed by the vegetation canopy; and the constant 0.5 denotes the fraction of available active solar radiation (from wavelengths between 0.4 and 0.7 μm) from the total solar radiation utilized by the vegetation. Tε1 and Tε2 denote the stress effect of low and high temperatures on light use efficiency; Wε is the water stress effect coefficient; εmax is the maximum light use efficiency under ideal conditions (g C/MJ).

2.3.2. Model Improvements

In order to obtain productivity results that are more consistent with arid regional ecosystems, we performed a partial improvement of the model. Firstly, there is an improvement to the FPAR simulation. We used MODIS-derived NDVI and EVI data, which provides a higher spatial resolution over the NOAA/AVHRR data applied for the original CASA model. It may cause the algorithm for the FPAR of the original model to no longer be applicable. Therefore, the value of FPAR could not be accurately simulated [36]. Considering that FPAR is well correlated with both NDVI and EVI and that the FPAR calculated from them is higher and lower, respectively, we took their average value and used it for the FPAR input to the model [48,49].
F P A R = α F P A R N D V I × 1 α F P A R E V I
F P A R N D V I = N D V I x , t N D V I i , m i n N D V I i , m a x N D V I i , m i n × F P A R m a x F P A R m i n + F P A R m i n
F P A R E V I = E V I x , t E V I i , m i n E V I i , m a x E V I i , m i n × F P A R m a x F P A R m i n + F P A R m i n
where FPARNDVI denotes FPAR calculated with NDVI; FPAREVI denotes FPAR calculated with EVI; the value of α is taken as 0.5; VI(x,t) denotes the vegetation index of pixel x in month t; VI(i,max) and VI(i,min) denote the maximum and minimum values of the vegetation index for the i-th vegetation type in month t, respectively; and FPARmin and FPARmax take the values of 0.001 and 0.95, respectively.
Furthermore, it is clear that εmax has a significant impact on the simulation results of NPP. The original CASA model used a constant value of 0.389 g C/MJ for εmax, but it varies for different vegetation types [50]. Therefore, we classified the land cover types in the ARNWC into five categories: cropland, forestland, grassland, urban areas, and bare areas, and determined the εmax for different land cover types with reference to the findings of previous studies (Table 2) [51,52]. In these studies, the εmax of different land cover types in the arid region was inverted by substituting the NPP-measured data into the formula of the CASA model and finally determined according to the principle of minimum error.

2.3.3. NEP Estimation Algorithm

Our study used NEP as an indicator of vegetation carbon source/sink. Since NPP is the carbon accumulated after deducting vegetation’s own respiratory consumption, NEP can be calculated as the difference between NPP and RH. The equations are as follows:
N E P = N P P R H
R H = 0.27 × R 0.52 × N P P 0.43
where R denotes the total monthly precipitation (mm). For the estimation of RH, we used the model proposed by Huang et al. [37].

2.3.4. Trend Analysis

The slope of the univariate linear equation over the same time period for each year from the starting year to the ending year was calculated using the least squares method for the variation in NEP over the year in that time period. Generally, a positive slope indicates an increase in NEP over the years, a negative slope indicates a decrease in NEP, and a slope equal to zero indicates a constant NEP.

2.3.5. Scenario Design

The main thought behind modeling scenario design is to control whether the input variables to the model change or remain constant. It is commonly used to decompose the magnitude of the impact of different factors on geographical phenomena [9,34].
In this study, we treat the impact of land cover change as a joint effort of land cover type conversion (abrupt change) and vegetation growth enhancement (gradual change). On this basis, two sets of five modeling scenarios were designed to analyze the impact of land cover change on vegetation carbon sources/sinks in the ARNWC (Table 3). Among them, the first group was used to simulate the impact of land cover change (including scenarios L1 and L2). Where scenario L1 only allows land cover type to change while keeping other factors consistent at the 2001 level, this scenario assesses the direct impact of land cover type conversion on vegetation carbon source/sink but fails to account for the impact of vegetation growth enhancement. Thereby, in order to assess the impact of vegetation growth enhancement, we use NDVI and EVI as indicators of natural vegetation growth and designed scenario L2, which allows for changes in land cover type, NDVI, and EVI with constant climate factors. This scenario assesses the combined effect of land cover type conversion and vegetation growth enhancement on vegetation carbon source/sink (i.e., the effect of land cover change). The second group contains three scenarios (LC1, LC2, and LC3), where LC1 is used to model annual NEP changes in the study area in a real scenario, which allows all model input variables to change. The results of scenarios LC2 and LC3 can reveal the direct and interactive effects of land cover type conversion and climate change, respectively, where scenario LC2 allows all factors except NDVI and EVI to change, while scenario LC3 allows only NDVI and EVI to change, and all other factors remain unchanged. Given that the modeling scenario design method generally has both direct and indirect strategies to assess the impact of land cover change, the difference in results between scenarios LC1 and LC2/LC3 can further demonstrate the reliability of the research findings.

3. Results

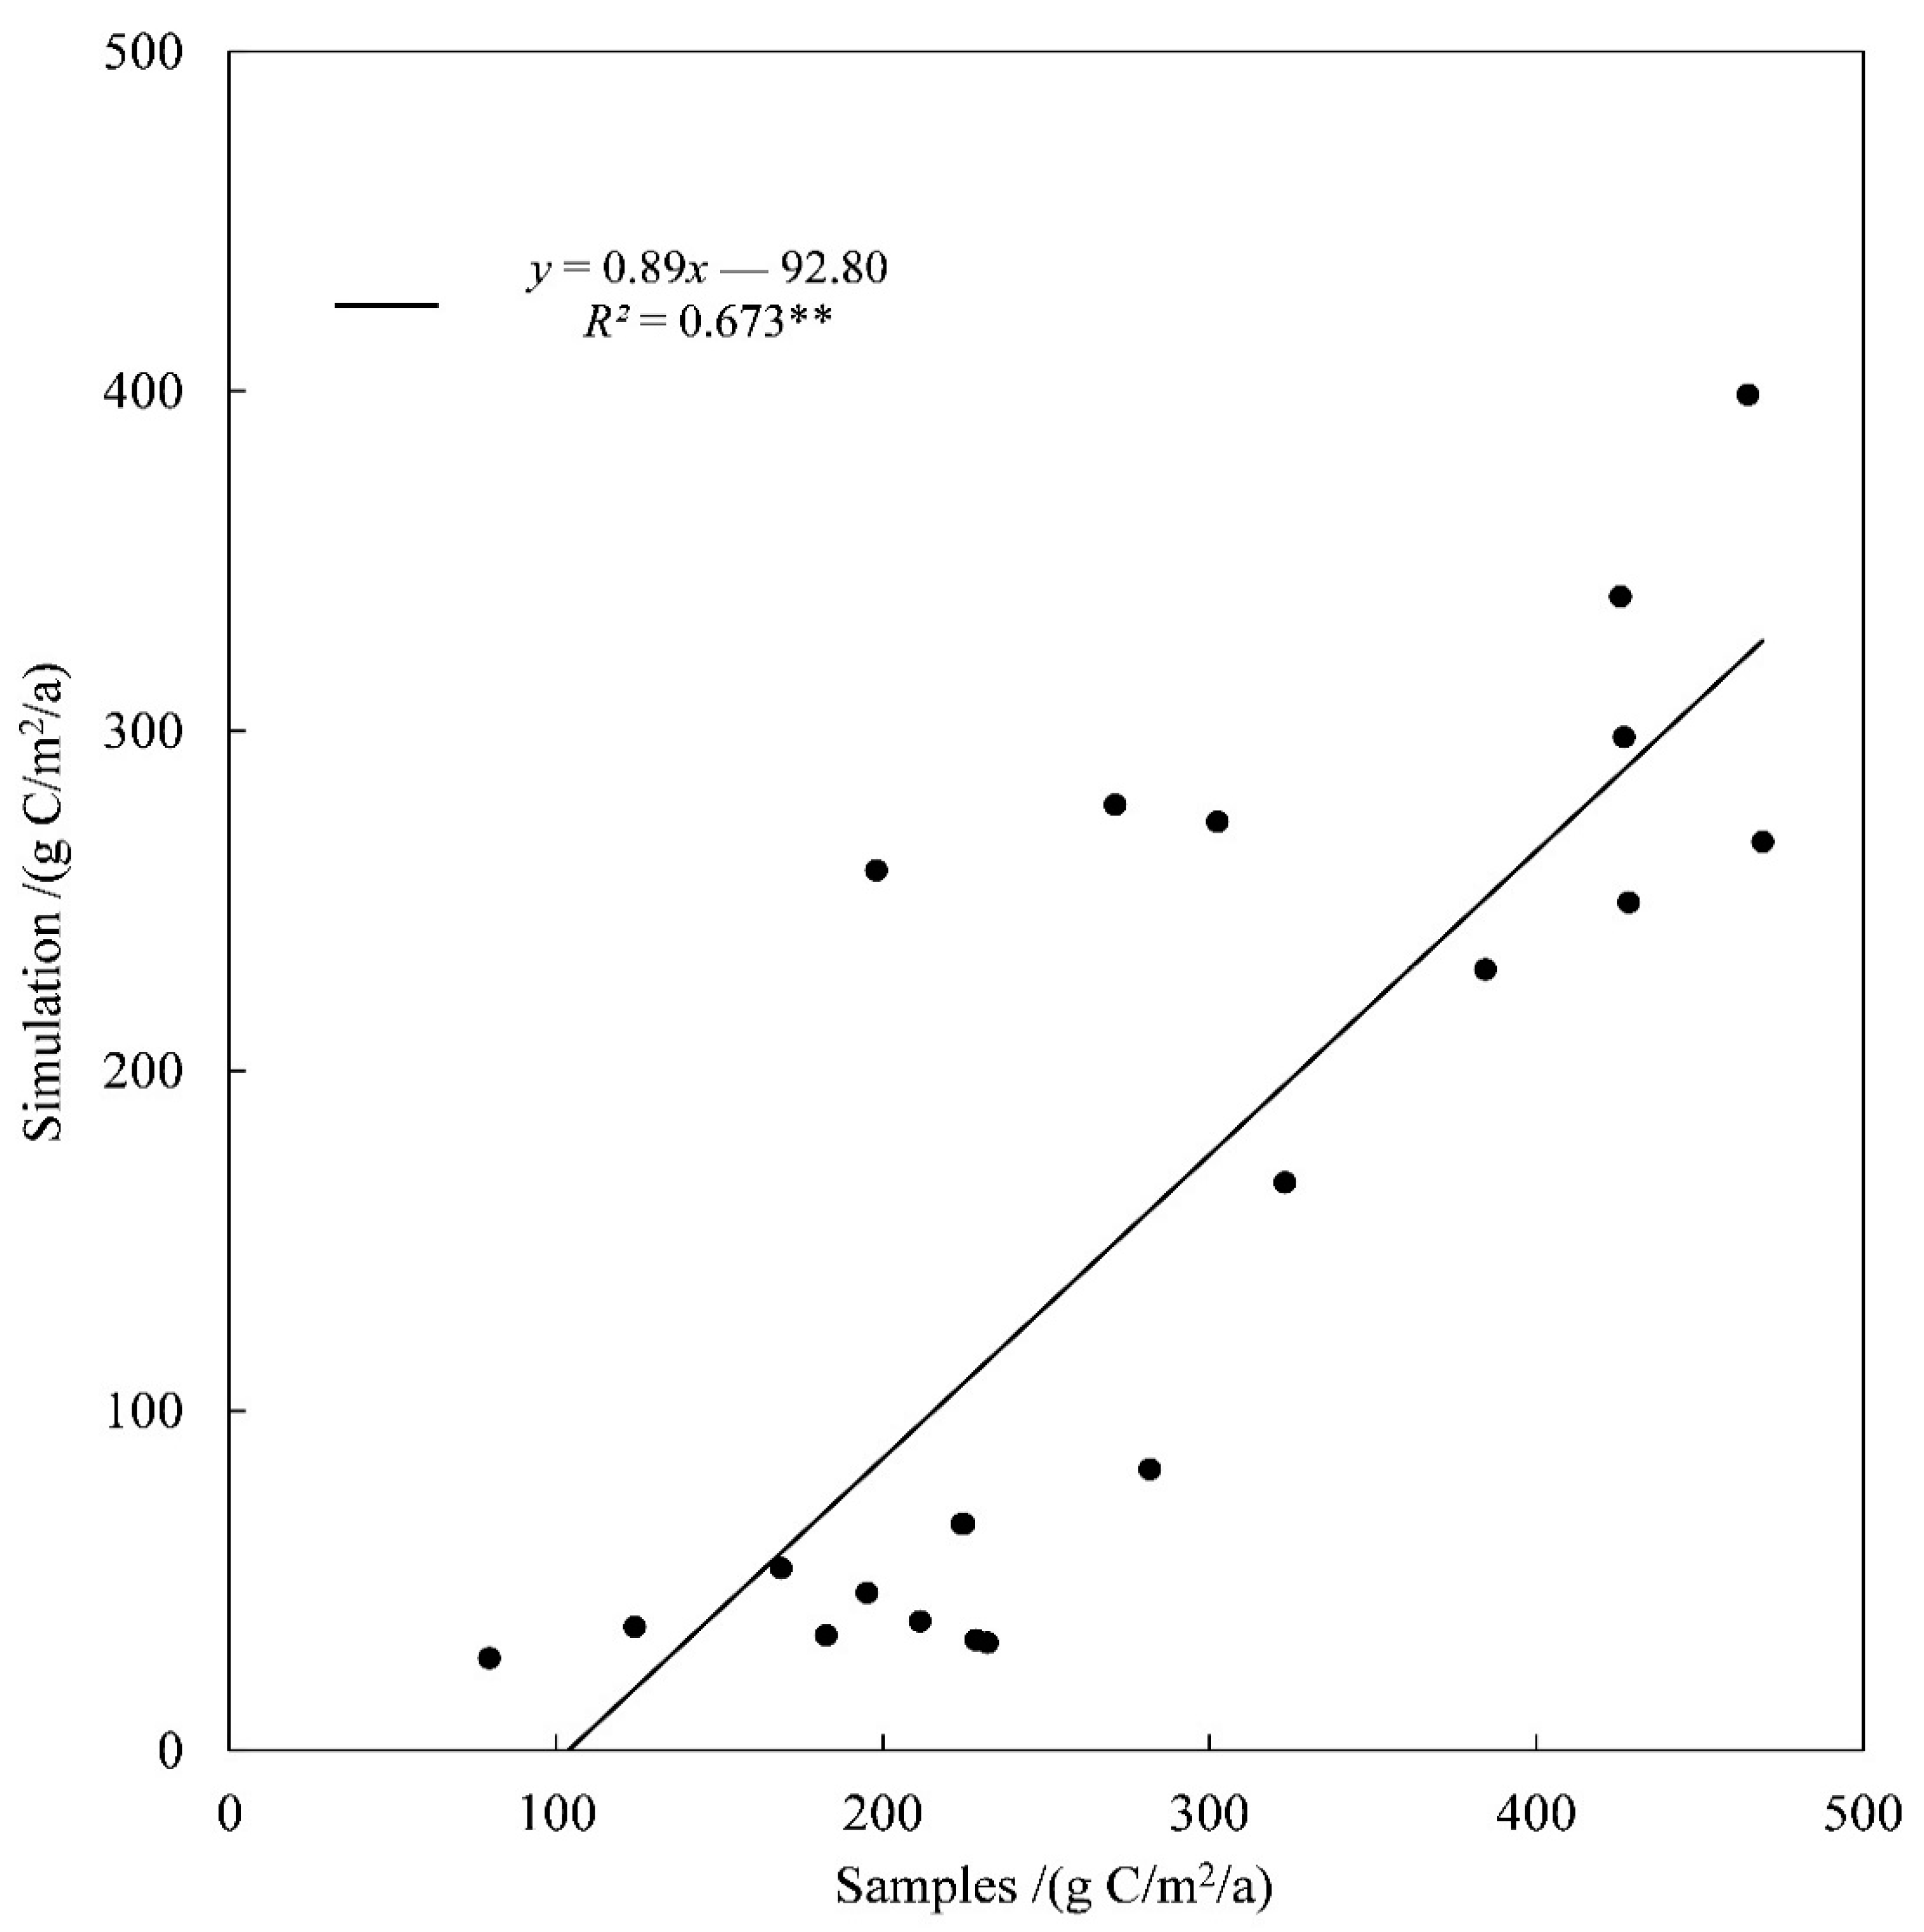
3.1. Validation of NPP Estimation Results

We use the measured data from 2001 to 2005 to validate the NPP results that are evaluated by the improved CASA model in the ARNWC [44,45]. In Figure 2, the correlation between the NPP estimation results and the observed data was significant (R2 = 0.673, p < 0.01), indicating that the NPP simulation results can be used for subsequent analysis.

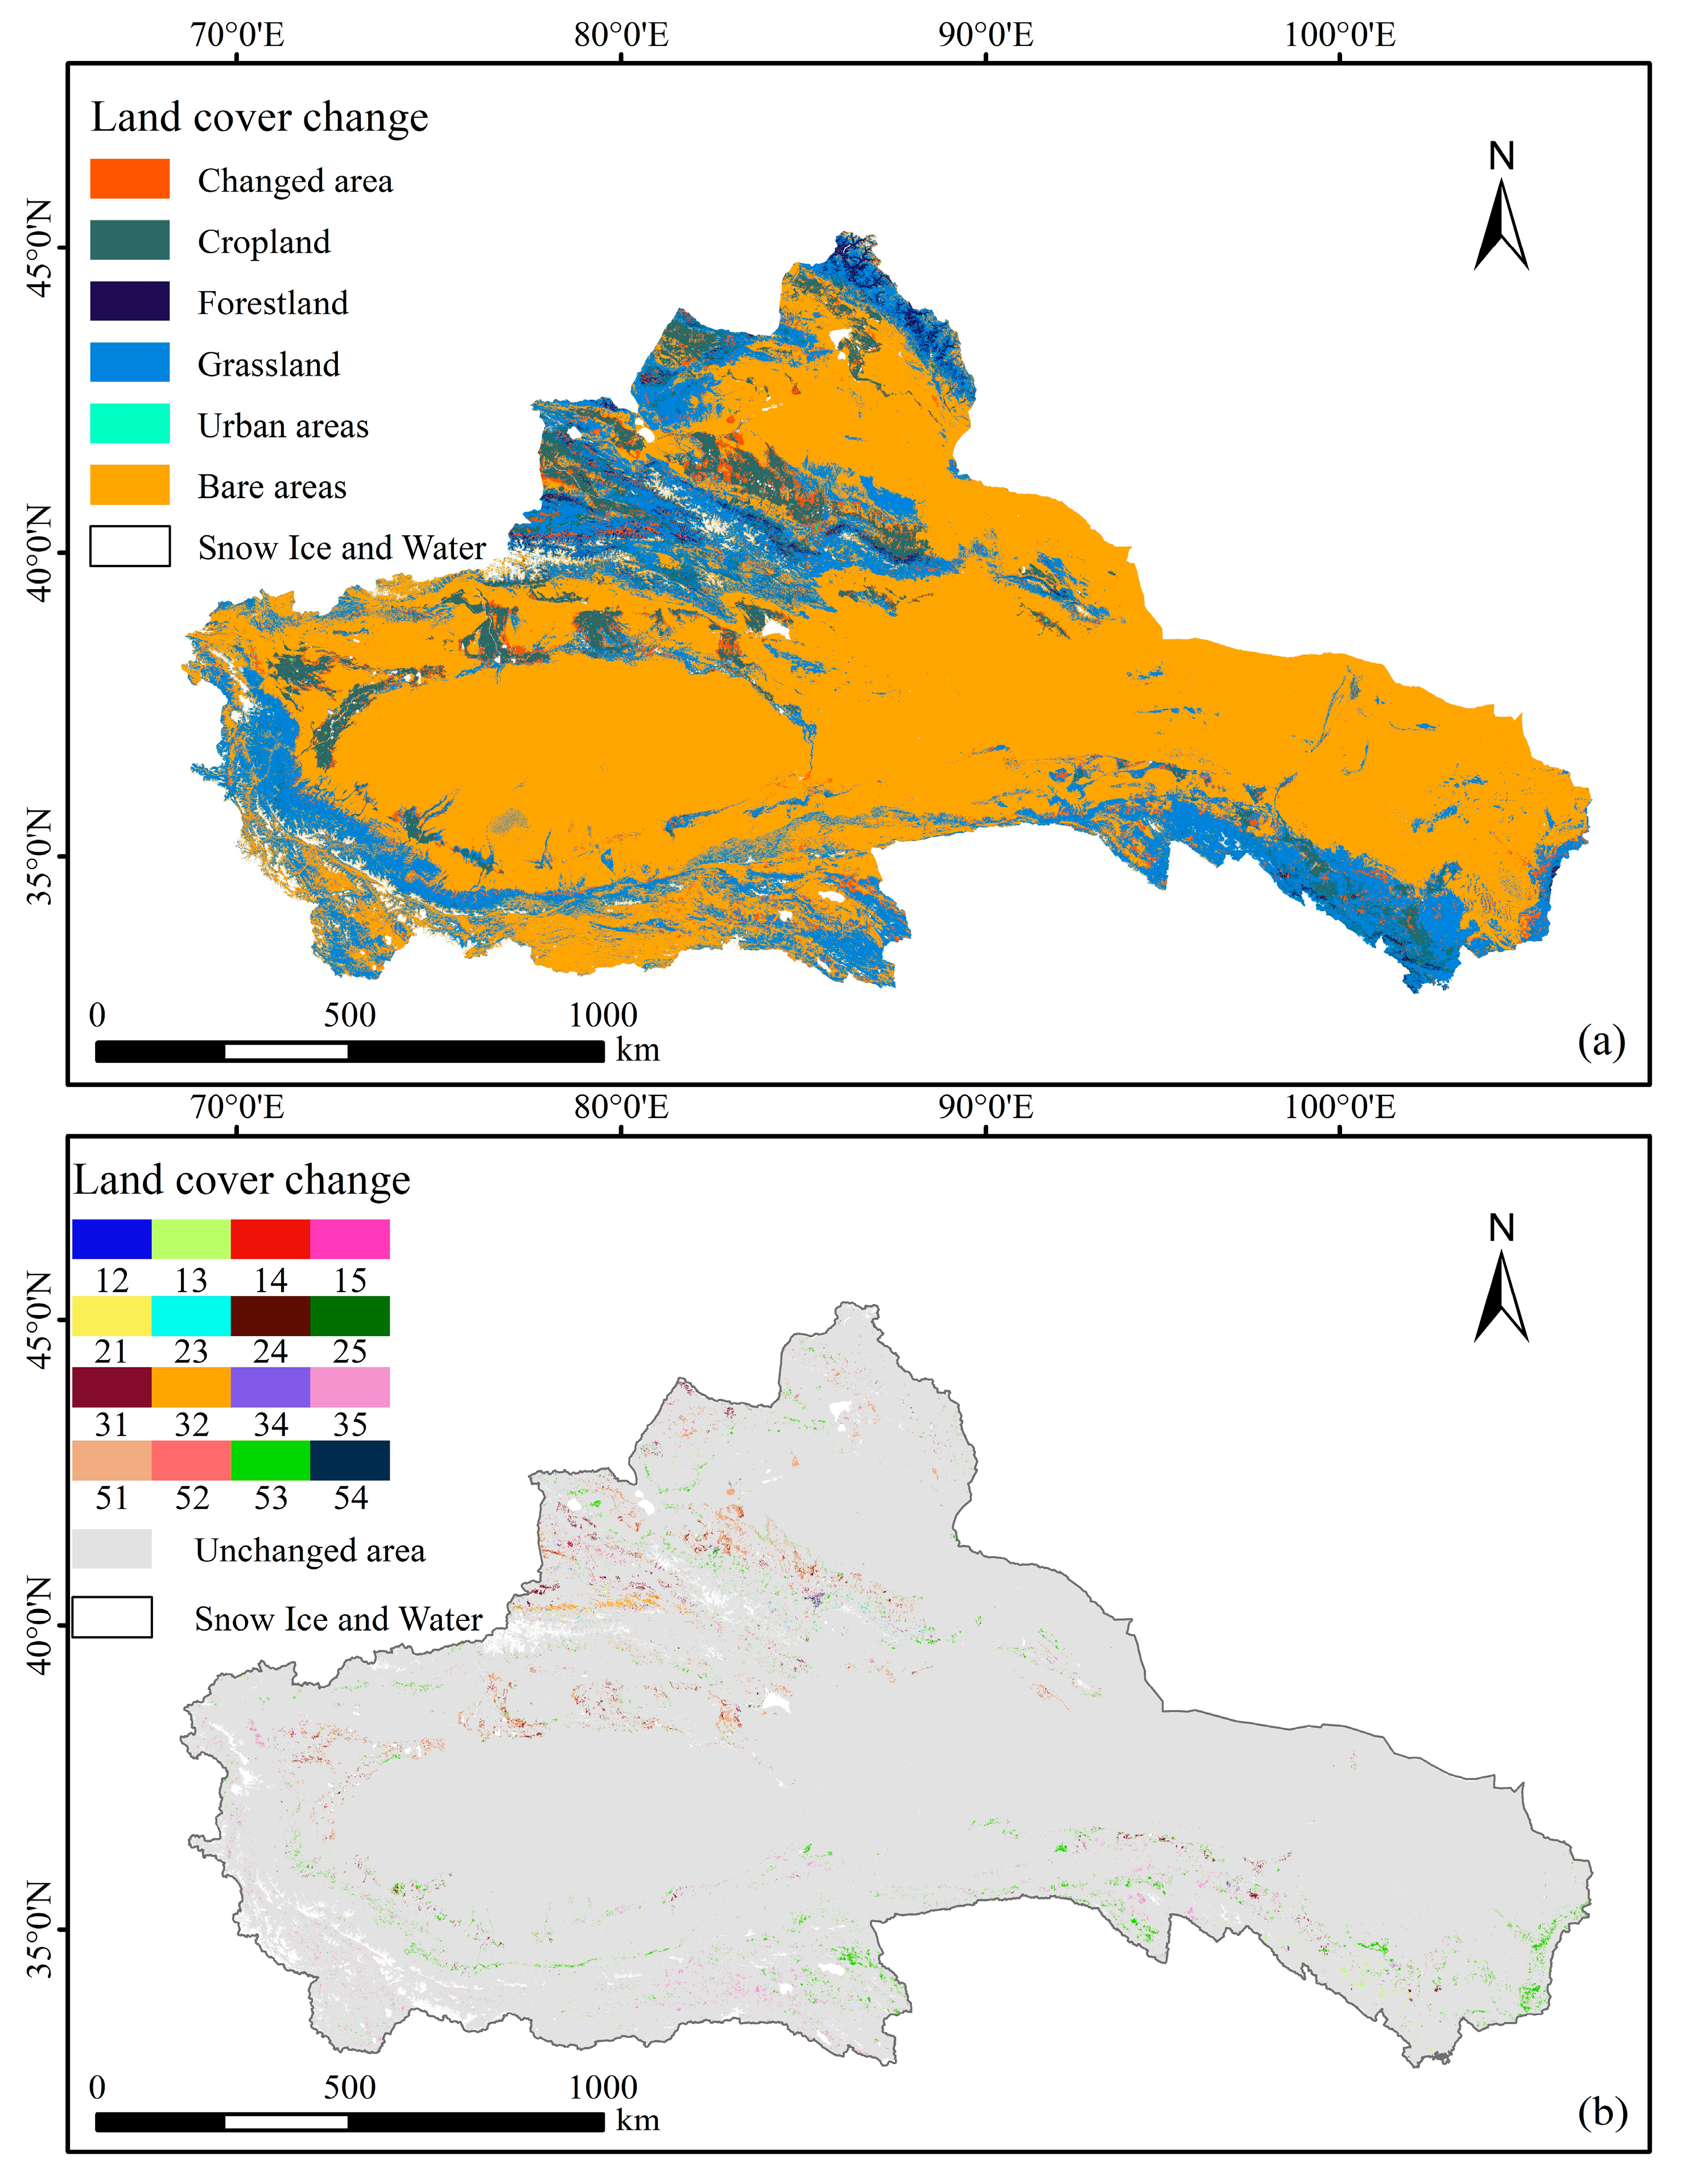
3.2. Land Cover Change during the Study Periods

In Table 4, the bare areas are dominant among each land cover type in the ARNWC, accounting for approximately 70% of the total area, which is distributed in the Alxa Plateau, Tuha Basin, Junggar Basin, and Tarim Basin. Grassland ranked second with an area of approximately 22%, mainly distributed in the Altai Mountains, the western part of the Tacheng Prefecture, the south and north slopes of the Tianshan Mountains, the Ili Region, the Kunlun Mountains, the Qilian Mountains, and the Helan Mountains. The area of cropland accounts for approximately 7% and is mainly distributed in the Irtysh River Basin, the northern part of the Tacheng Prefecture, the Ili Region, the economic belt on the northern slope of the Tianshan Mountains, the oasis belt around the Tarim Basin, and the Qilian Mountains. The area of forestland and urban areas is the smallest, both accounting for less than 1%. Among them, forestland is mainly distributed in mountainous areas, including the Altai Mountains, the Tianshan Mountains, and the Qilian Mountains.
The spatial distribution of land cover change in the ARNWC from 2001–2018 is illustrated in Figure 3. The most obvious characteristics are mainly shown by the expansion of cropland and forestland in the central part of the ARNWC and the interconversion of grassland and bare areas in the southern and central mountainous areas, combined with Table 4 and the results of the land use transfer matrix (Table 5). The total cropland area increased by 15,097.75 km2, which showed outward expansion through the occupation of bare areas and grassland on the edge of the Tarim Basin and the economic belt on the northern slope of the Tianshan Mountains. The total area of forestland increased by 2184 km2, showing the expansion of forestland located in the southern part of the Ili Region to external grassland and the conversion of grassland to forestland. The net increase in the total grassland area is 4084.25 km2, which is mainly the result of the conversion between bare areas and grassland, which mainly occurred in mountainous areas, including the Helan Mountains, Qilian Mountains, Kunlun Mountains, and Tianshan Mountains. The urban areas increased the least, approximately 1885 km2, but the tendency toward urban expansion was more significant because the urban area in 2018 was nearly four times that of 2001. The net decrease in total bare area of 23,251 km2 was mainly the result of bare areas being converted into cropland and grassland. Thus, land cover change in the ARNWC from 2001 to 2018 mainly occurred as a result of the conversion between cropland, grassland, and bare areas, and the expansion of cropland and urban areas is obvious. Due to the influence of national policies such as the Grain for Green Program, the forestland area is slowly and steadily increasing.

3.3. Spatial Distribution and Temporal Variation of Carbon Source/Sink

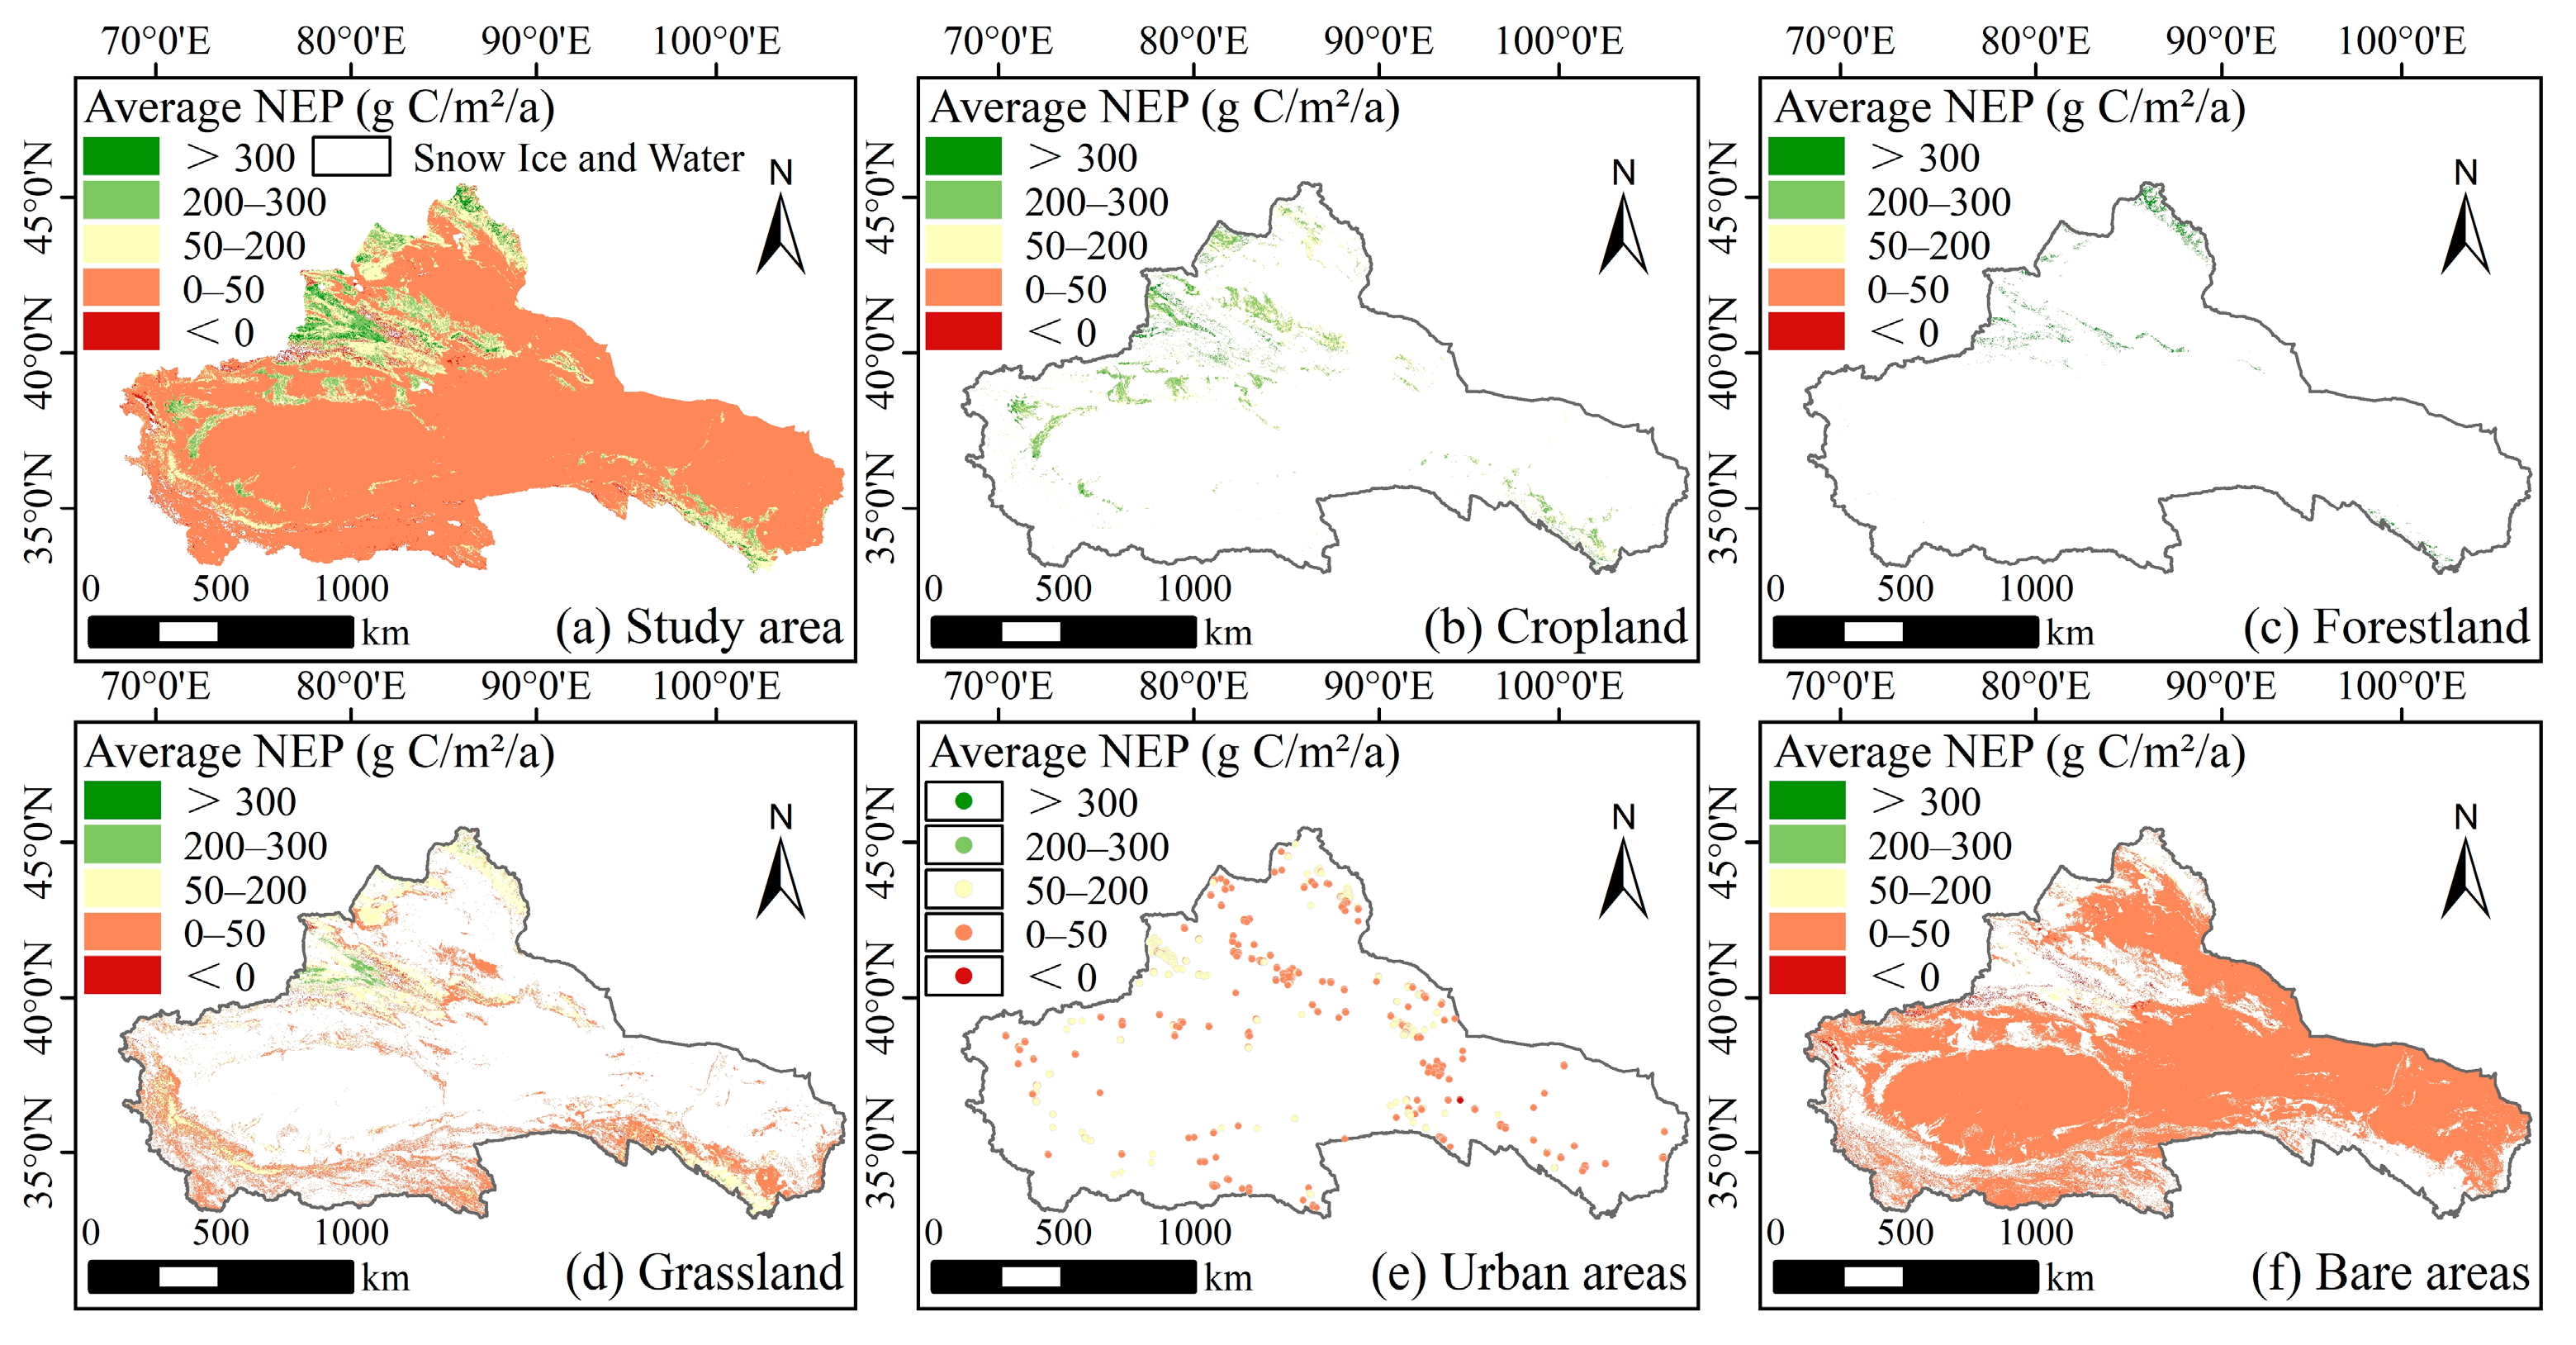
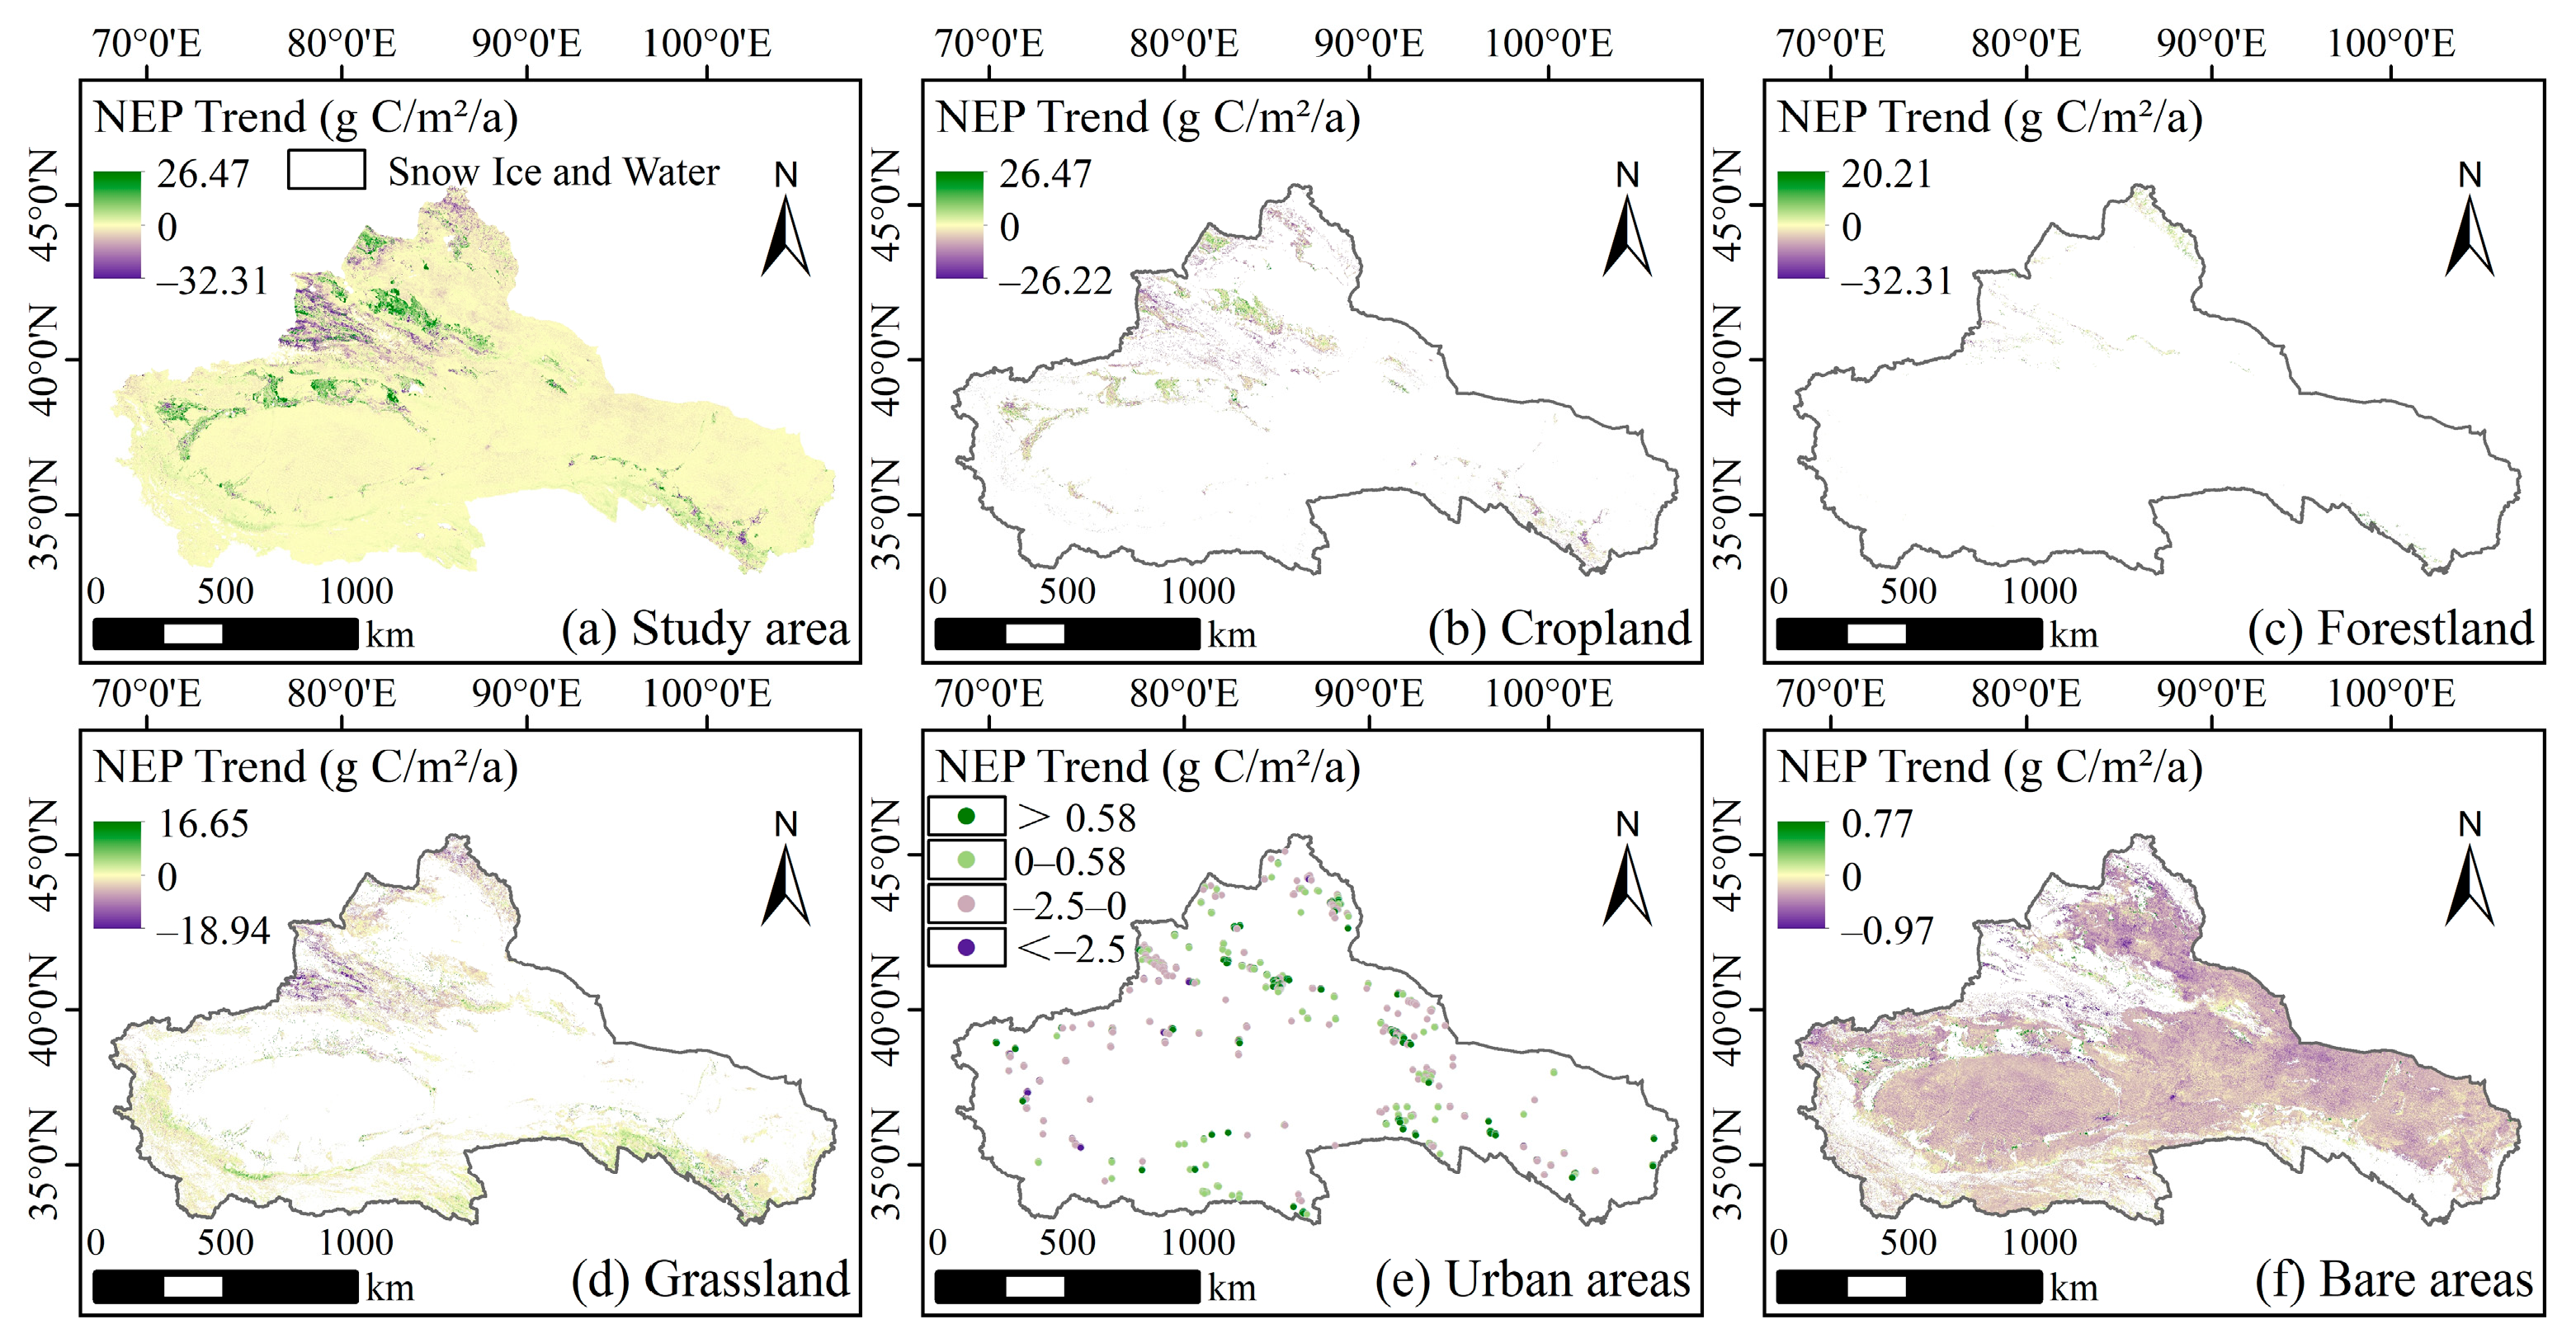
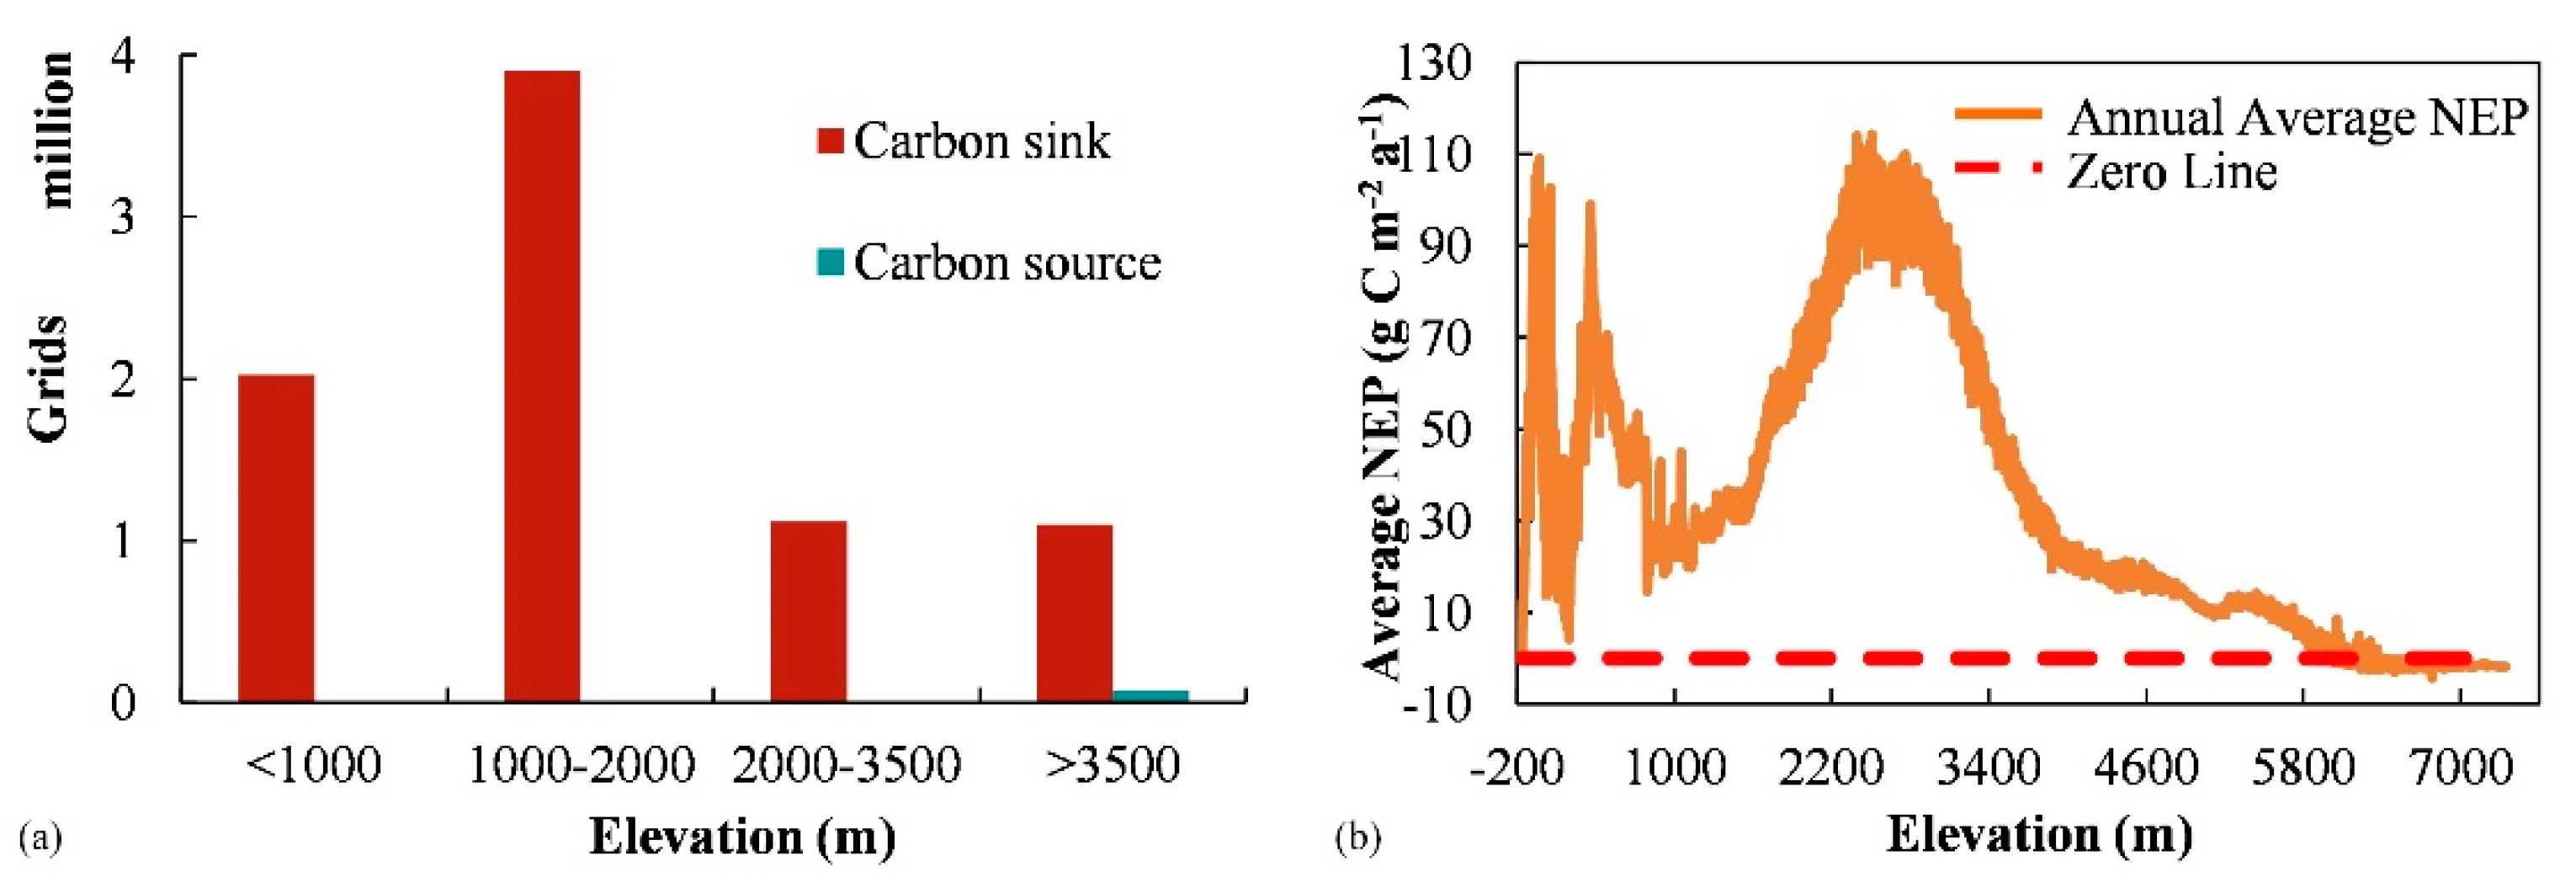
3.3.1. Spatial Distribution of Carbon Source/Sink

From 2001 to 2018, the vegetation carbon source/sink in the ARNWC had an obvious regional divergence (Figure 4). Generally, the region was mainly a carbon sink, and the total annual average carbon sequestration reached 80.34 Tg C (1 Tg = 1012 g). Among each land cover type, forestland had the largest NEP, reaching more than 300 g C m−2 a−1, which was mainly found in the higher altitude areas such as the Altai and Tianshan Mountains and Qilian Mountains. The regions with NEP greater than 200 g C m−2 a−1 were mainly spread throughout the oasis agricultural belt in the plain areas, such as the northern part of the Tacheng prefecture, the economic belt on the northern slope of the Tianshan Mountains, the Ili Valley region, and the edge of the Tarim Basin. It is also noteworthy that the sparsely vegetated areas in the Tarim Basin, Junggar Basin, Tuha Basin, and Alxa Plateau have also shown regional vegetation as a carbon sink in recent years, even if in a weak state (NEP > 0 g C m−2 a−1). The regions with NEP less than 0 g C m−2 a−1 are mainly distributed in parts of the bare areas on the southern and northern slopes of the Tianshan Mountains and the Kunlun Mountains.

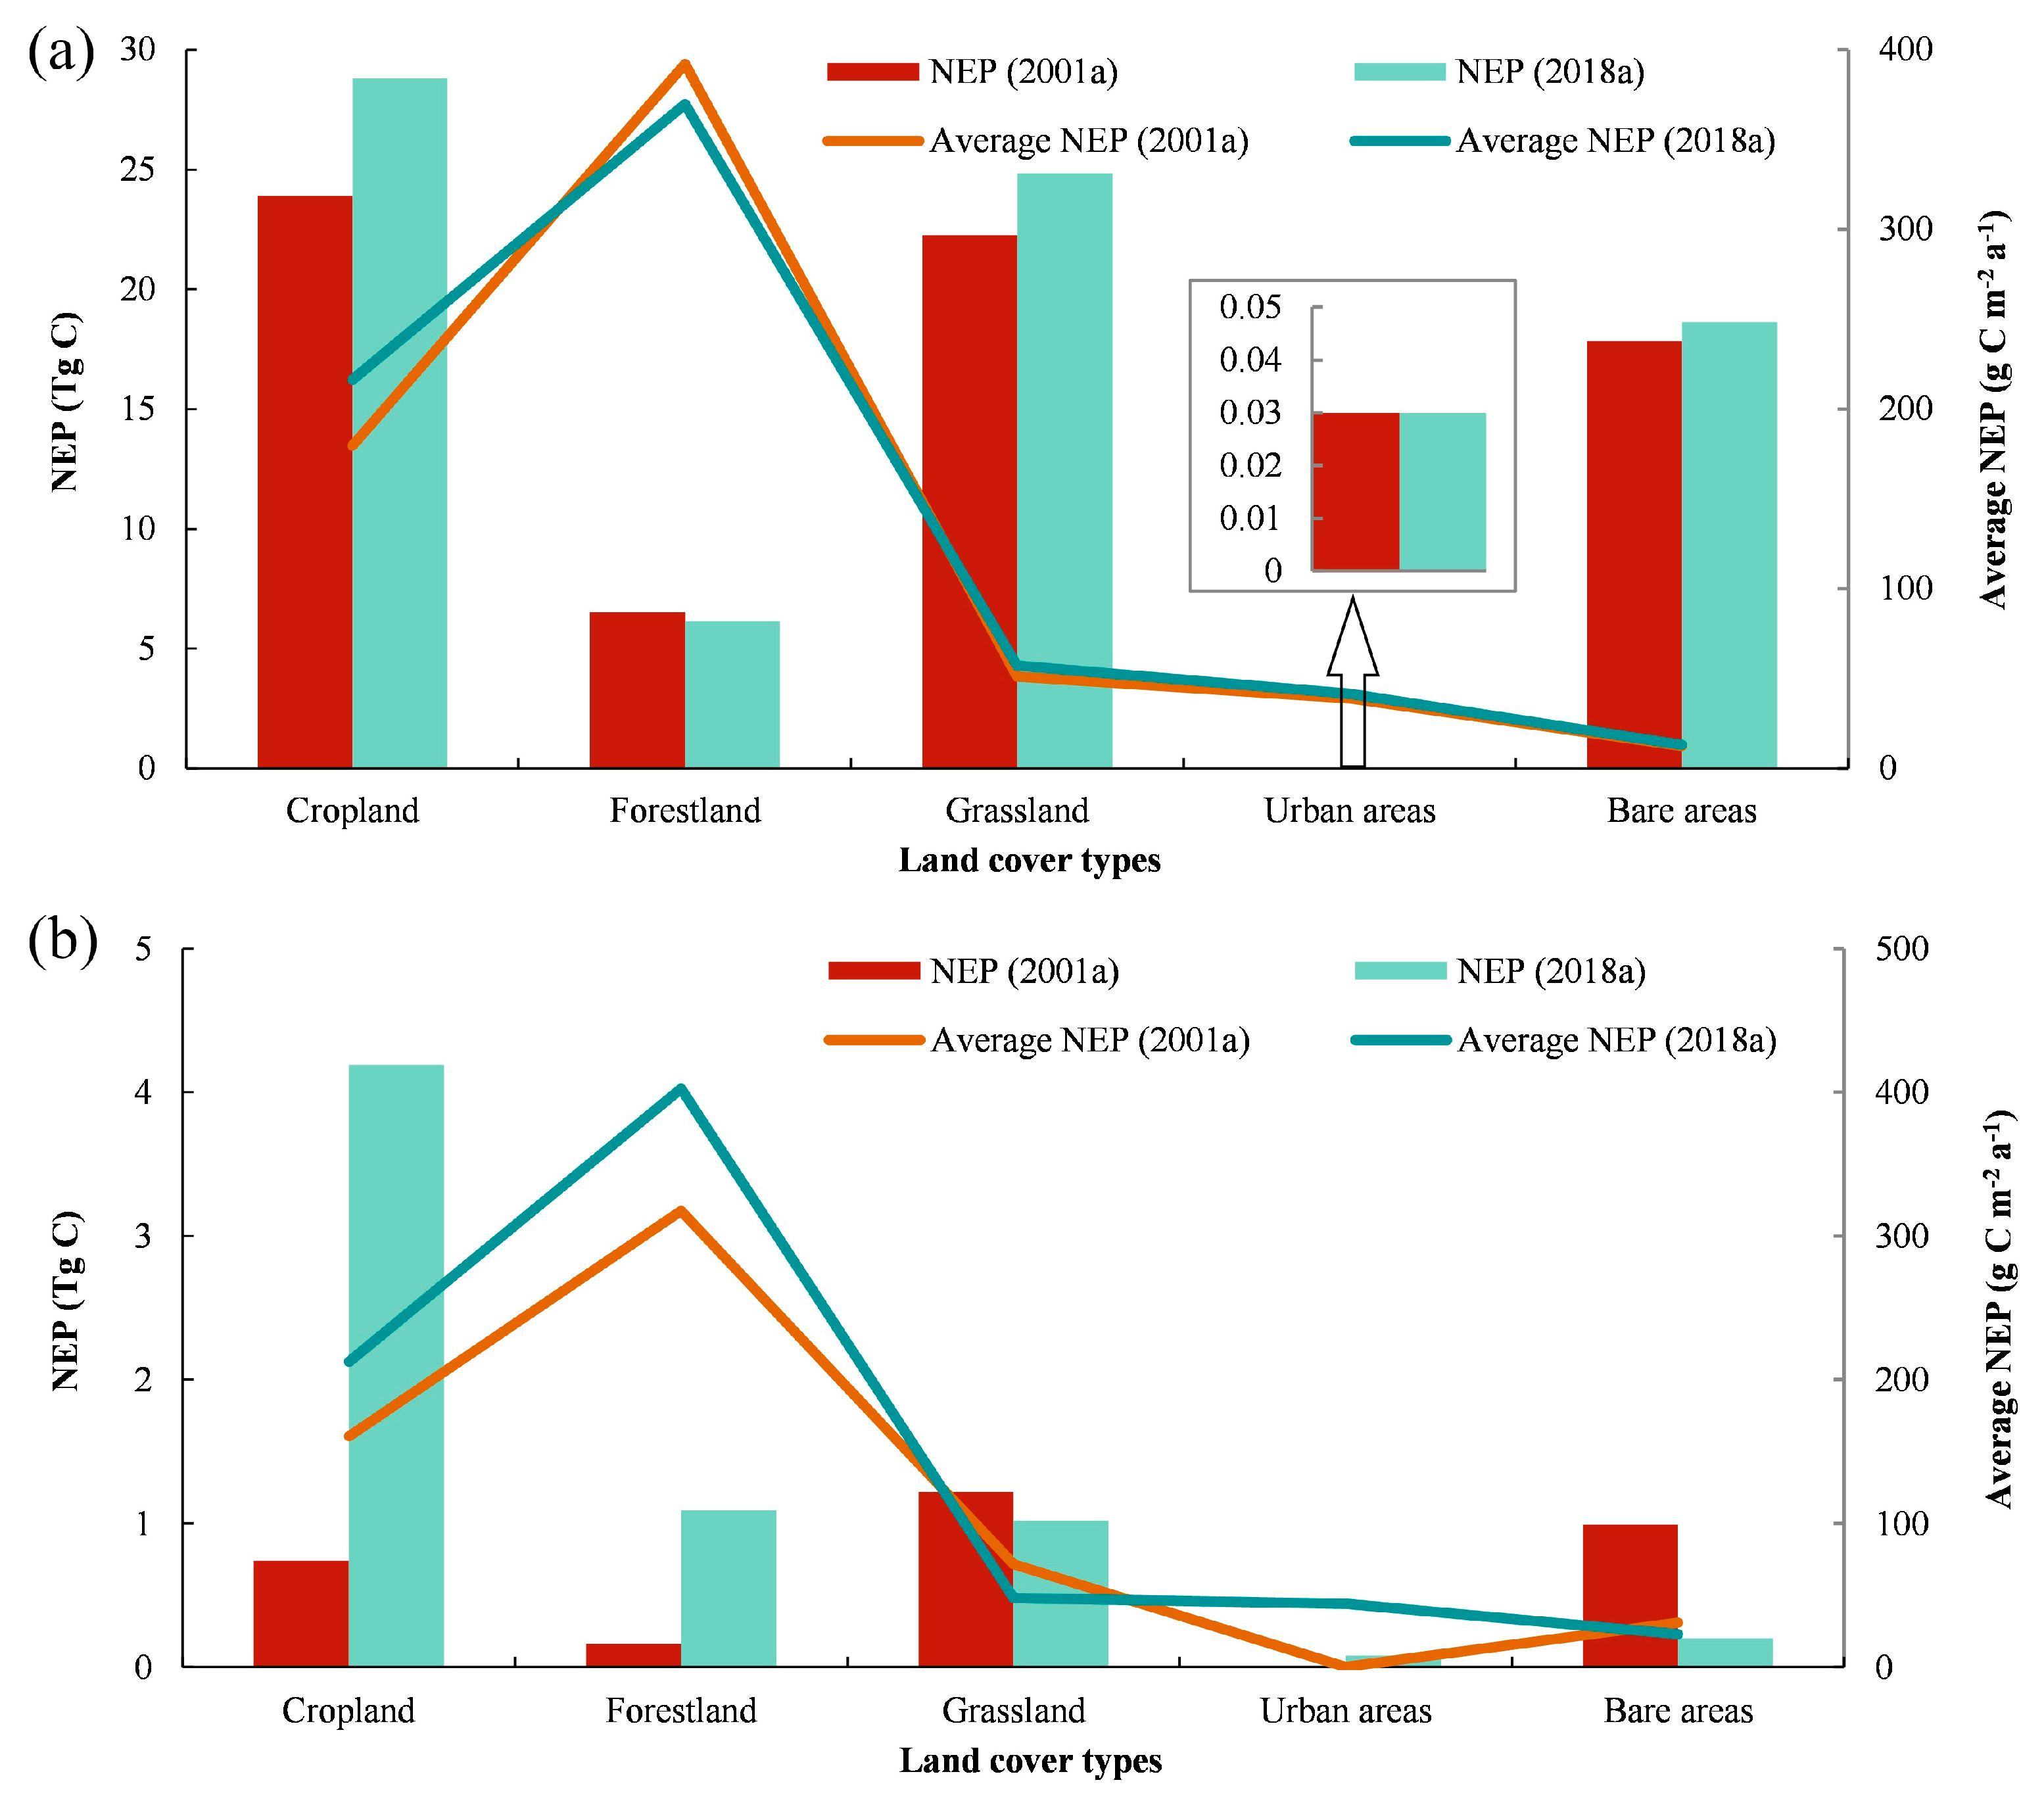
3.3.2. Temporal Variation in Vegetation Carbon Sources/Sinks

From 2001–2018, the total NEP in the ARNWC increased from 73.68 Tg C in 2001 to 85.06 Tg C in 2018, with an average rate of increase of approximately 0.67 Tg C/a, and the average NEP increased from 35.84 g C m−2 a−1 to 41.37 g C m−2 a−1 (Table 7). The total NEP of all land cover types also showed a net increase. Among them, the urban areas showed the most significant increase in total NEP, which more than tripled compared to 2001, although the total increased by only 0.08 Tg C. The contribution by cropland was the largest, with a net increase of 8.36 Tg C in recent years, accounting for approximately 73.46% of the total regional NEP increase, and the average rate of increase was approximately 0.49 Tg C/a. Following cropland were grassland, forestland, and bare areas, whose net increases in NEP were 2.36 Tg C, 0.55 Tg C, and 0.03 Tg C, respectively. Comparing the average NEP of each land cover type, we found that all land cover types except forestland had an increasing trend. This further indicated that the vegetation growth of each land cover type except forestland was improving.
In Figure 5, the annual carbon sink of cropland in the northern part of Tacheng Prefecture, the economic belt on the northern slope of the Tianshan Mountains, the Ili Region, the edge of the Tarim Basin, and the Qilian Mountains has been increasing over time. In contrast, the high carbon sink areas of forest located in the Altai Mountains and Tianshan Mountains, as well as the grassland in the Ili Valley, have decreased annually, indicating that the vegetation carbon sequestration capacity in these areas is decreasing. The regions that behave as carbon sources, such as the northern and southern slopes of the Tianshan Mountains, have continued to increase carbon emissions at a slow rate in recent years. The remaining sparsely vegetated areas, mainly within the hinterlands of the Tarim Basin, Junggar Basin, Tuha Basin, and Alxa Plateau, showed minor changes in NEP.
As indicated by land cover type conversions from 2001 to 2018, the results in Figure 6 show that in areas where the land cover type remains unchanged, the total NEP of cropland, grassland, urban areas, and bare areas has increased by 4.91 Tg C, 2.57 Tg C, 0.025 Tg C, and 0.82 Tg C, respectively, which indicates that their vegetation growth has improved. In contrast, the total NEP of forestland has decreased by 0.37 Tg C, which indicates that the vegetation has degraded in the unchanged forest areas. This may also account for the decline in the average carbon sink in forests throughout the region. In areas where land cover types have changed, the total NEP of cropland and forestland increased dramatically, reaching 3.45 Tg C and 0.93 Tg C, respectively, which is approximately 4.5 and 5.5 times more than in 2001, and the total NEP of urban areas also increased by approximately 0.08 Tg C due to urban expansion, whereas the total NEP of grassland and bare areas decreased by 0.2 Tg C and 3.17 Tg C, respectively.

3.4. Effects of Land Cover Change on Vegetation Carbon Source/Sink

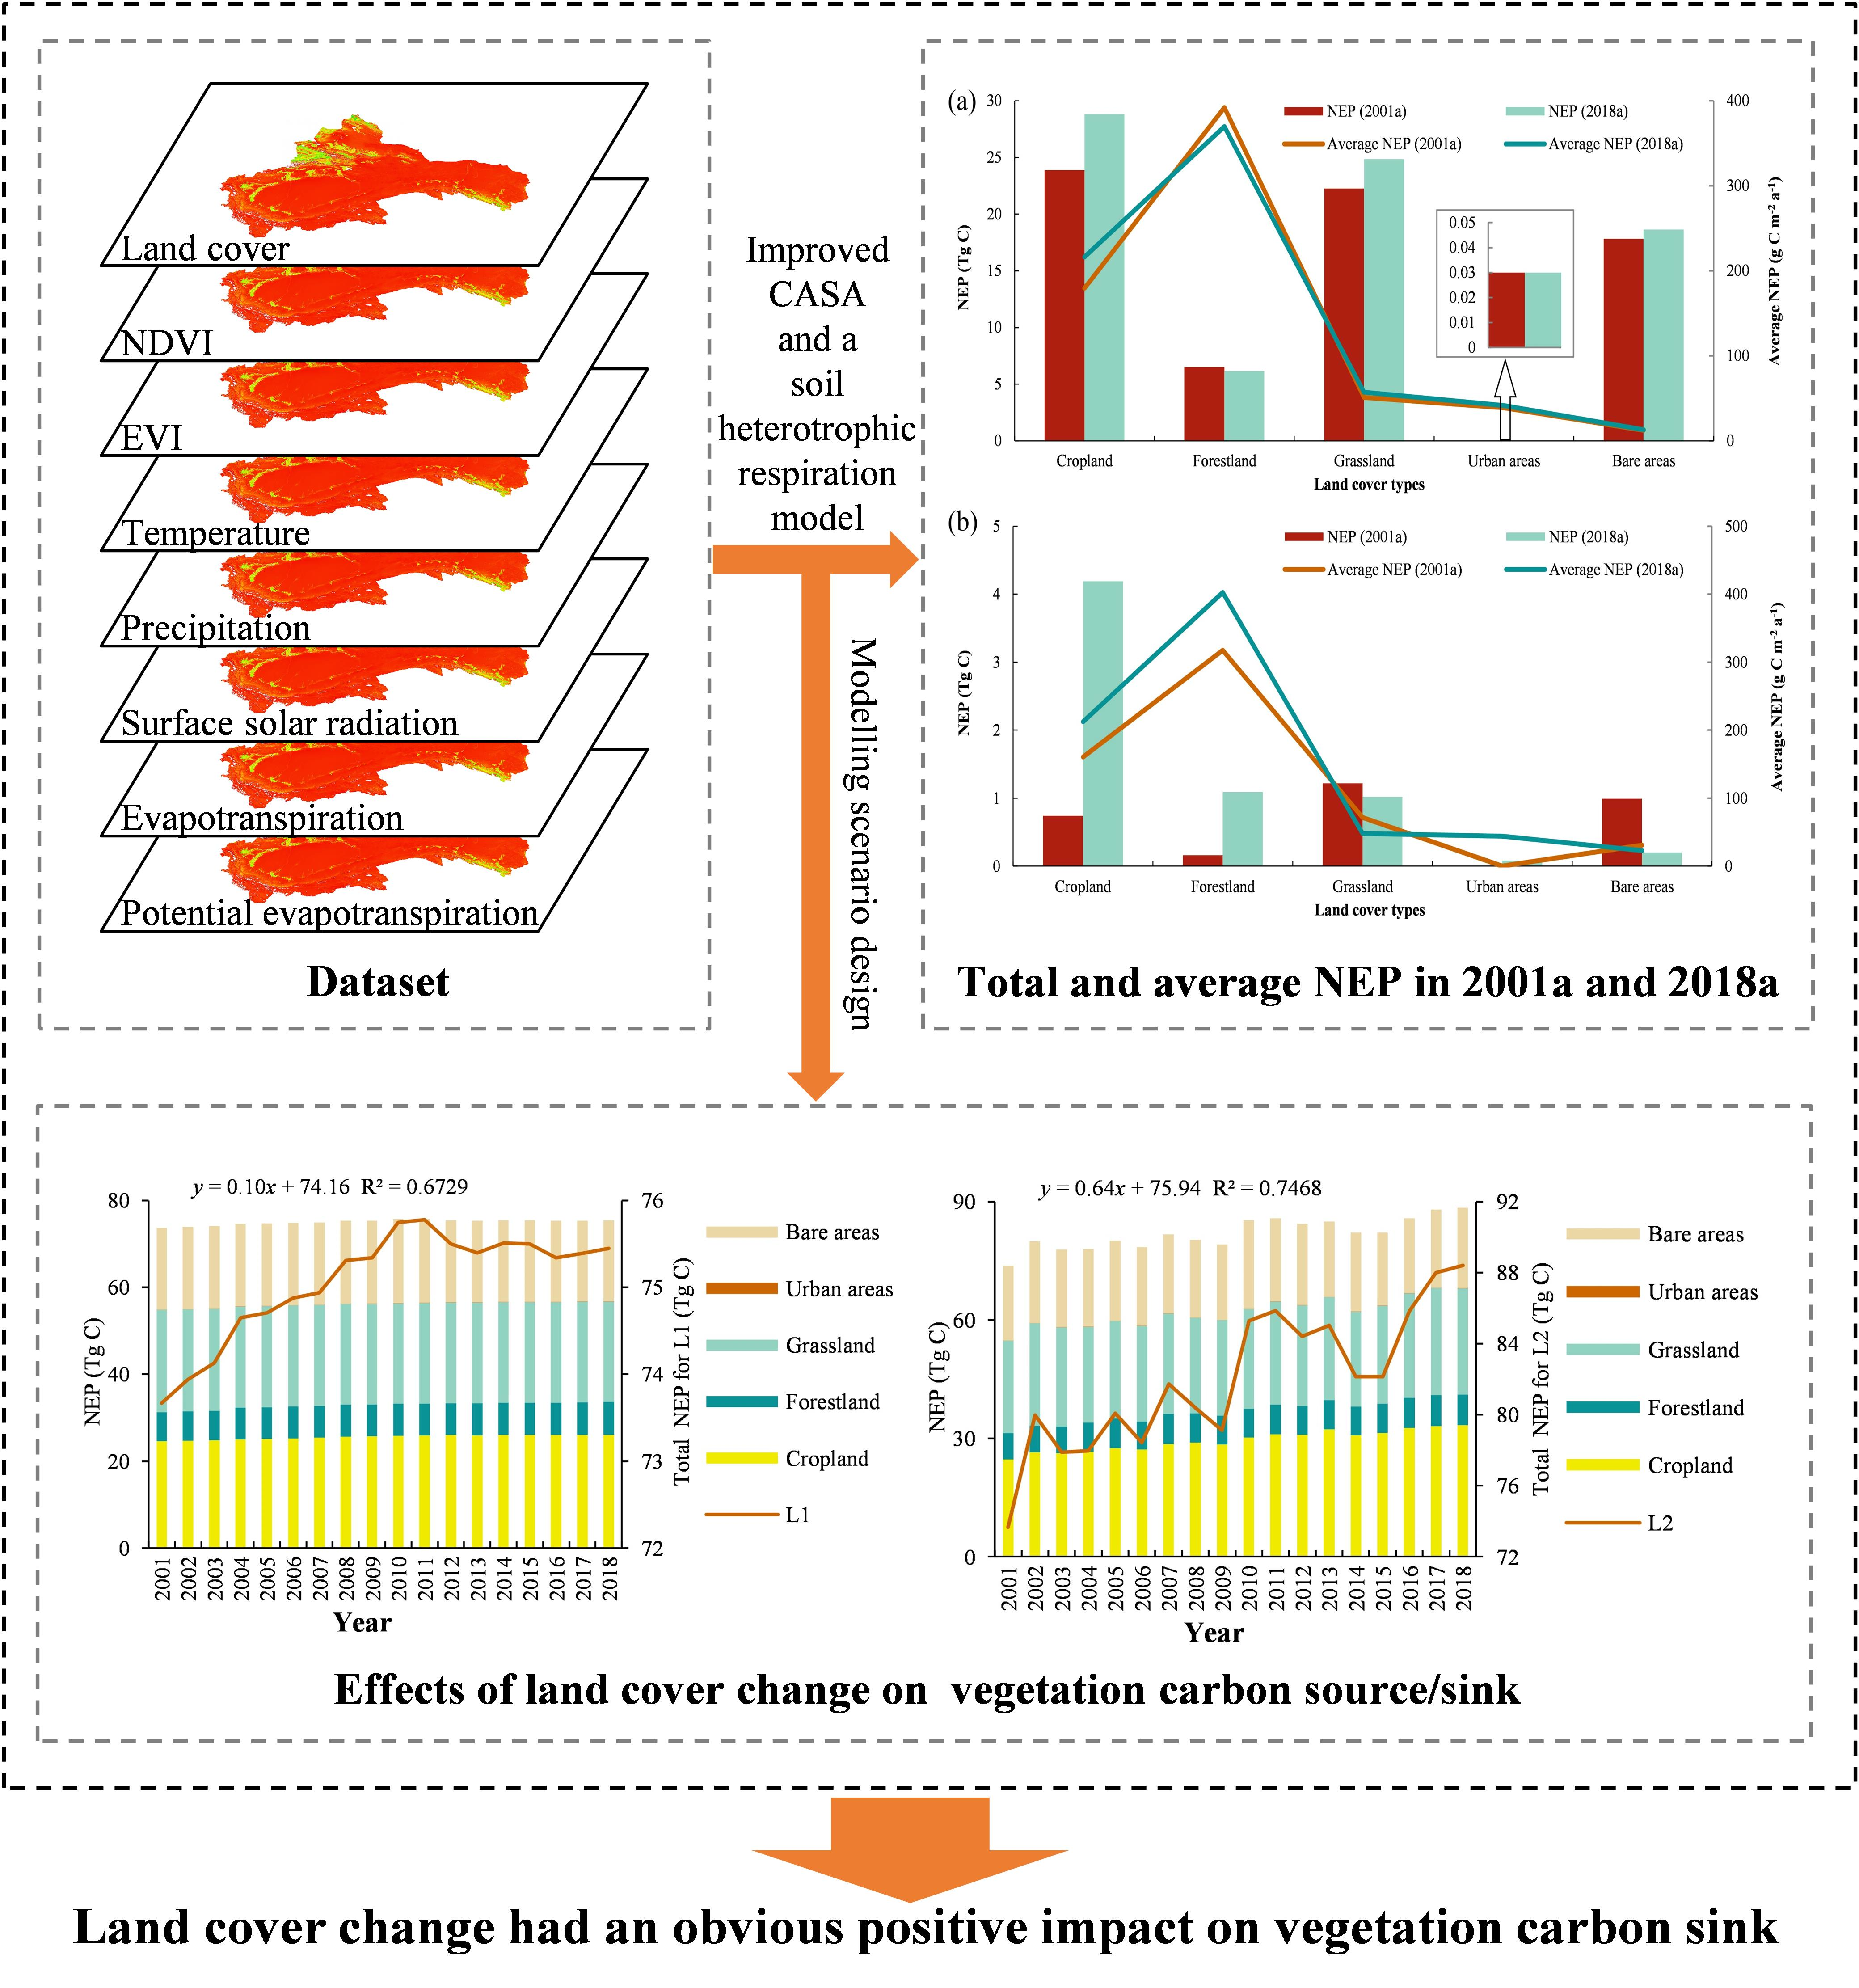
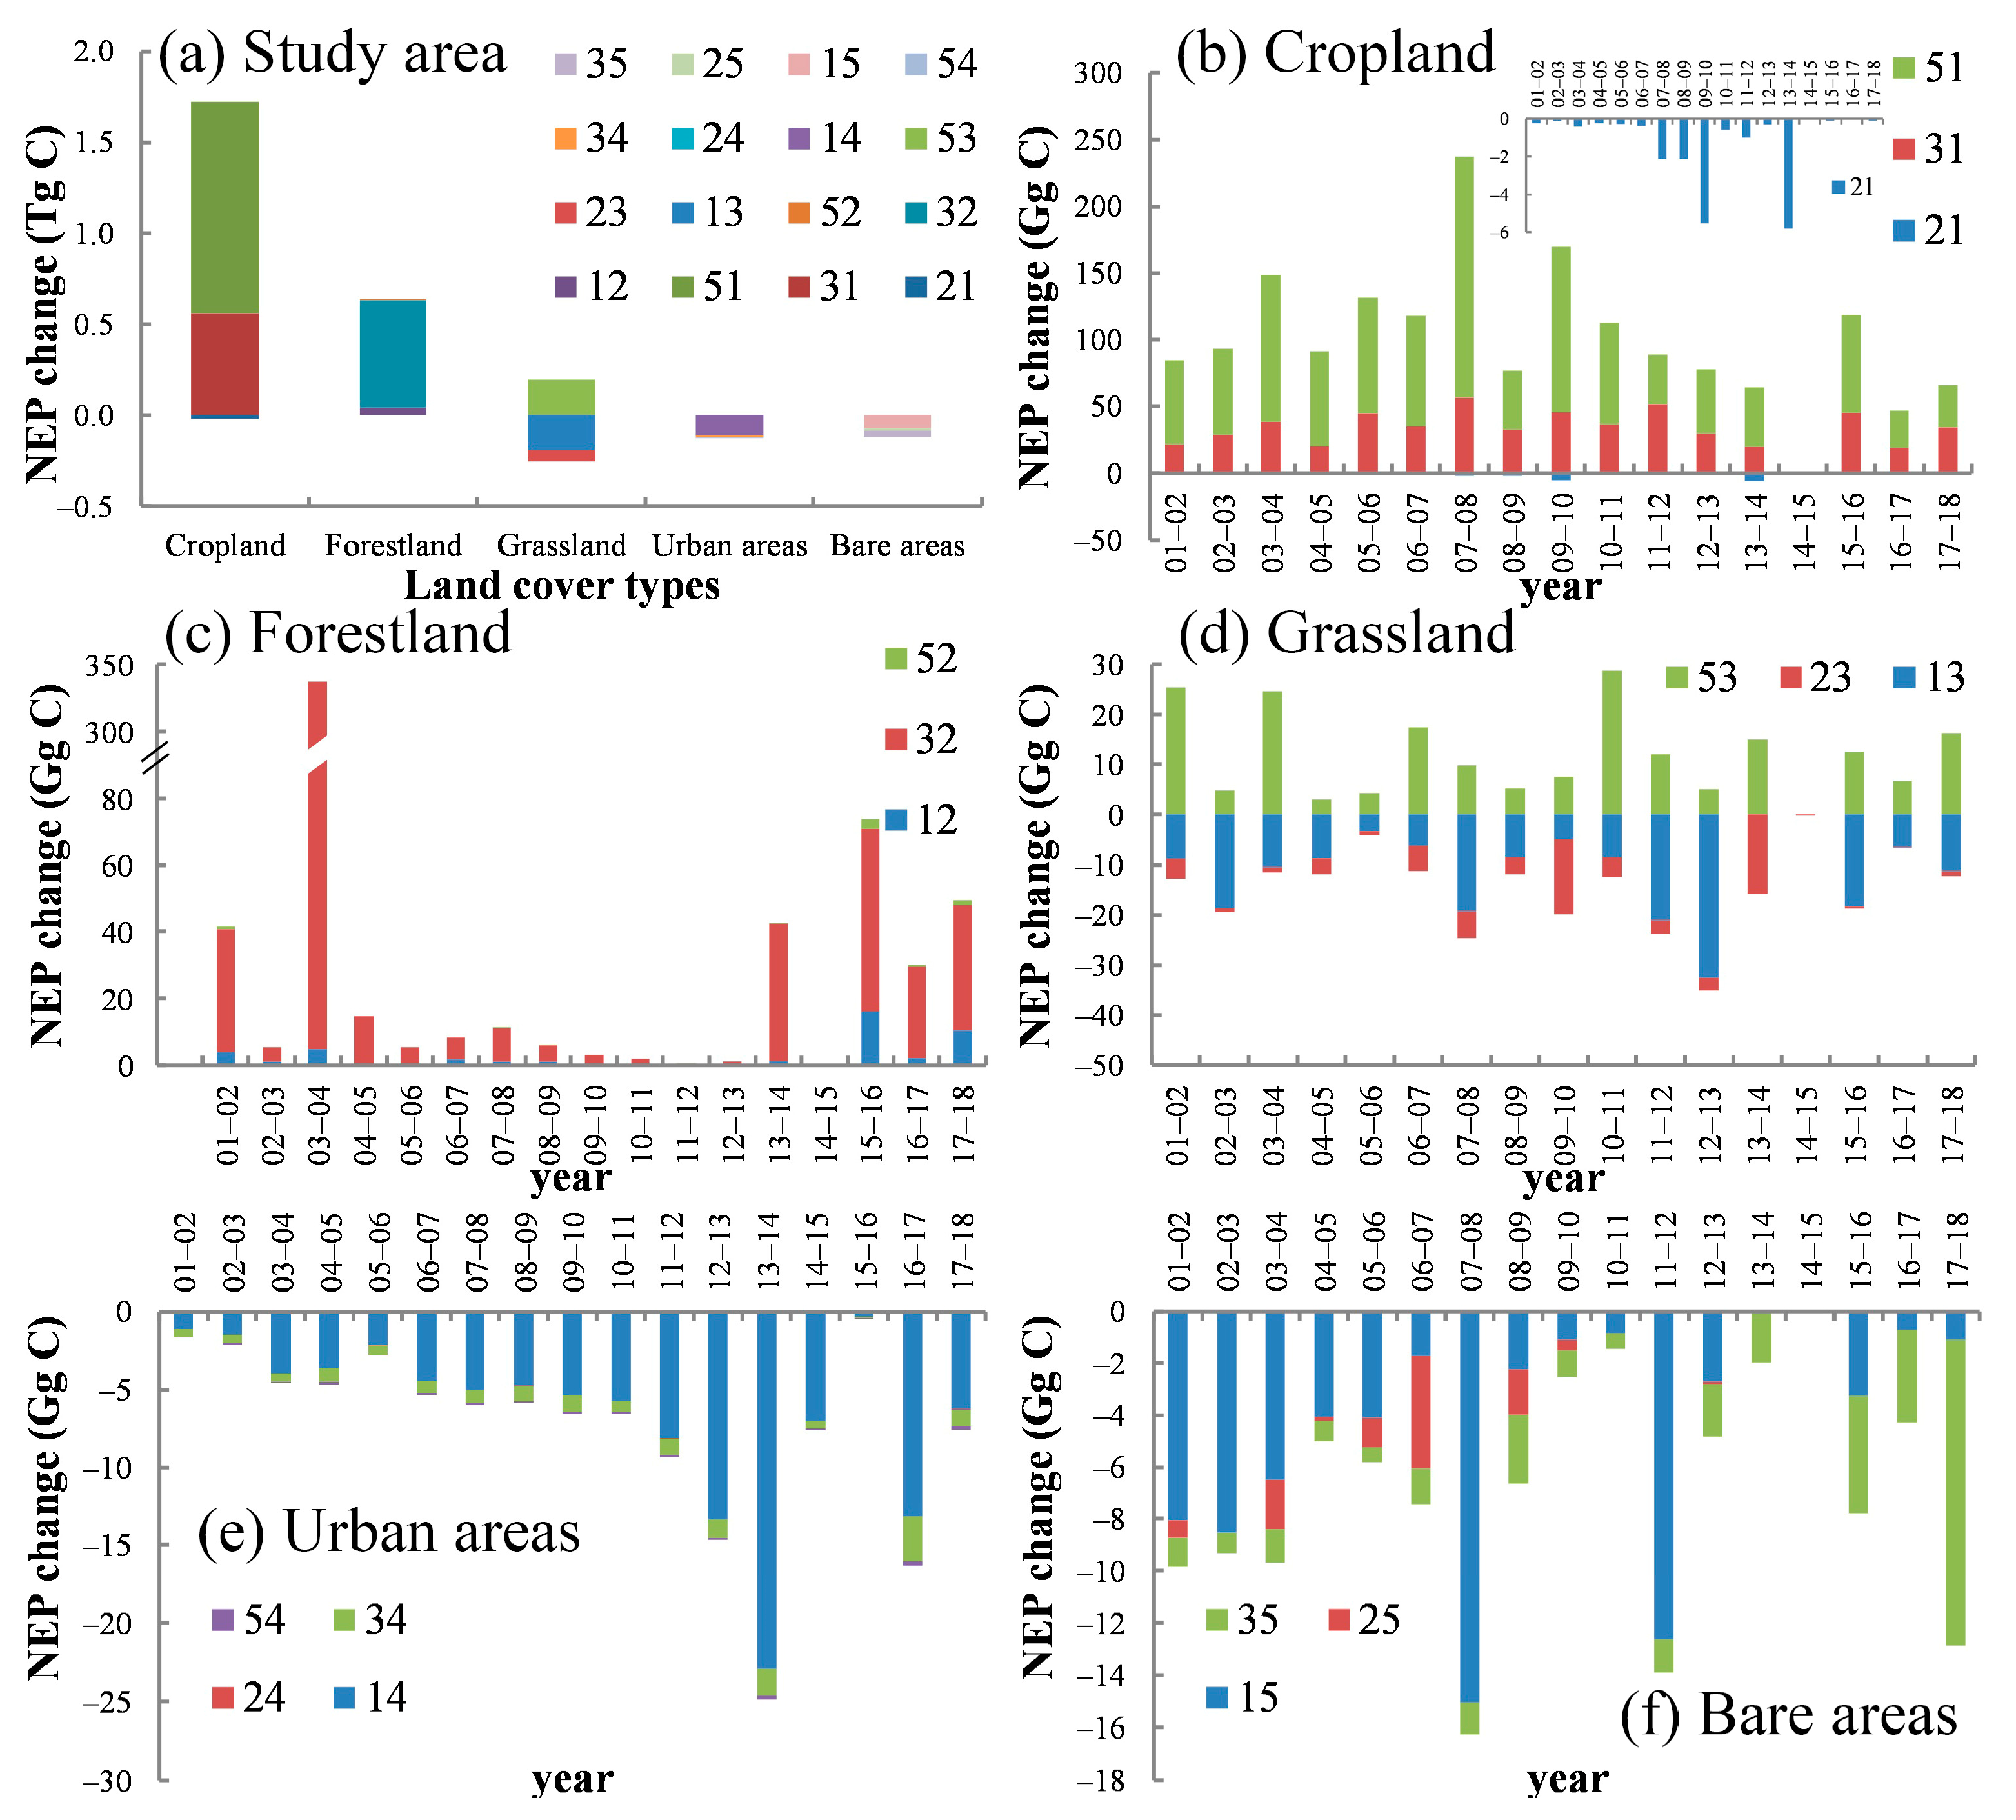
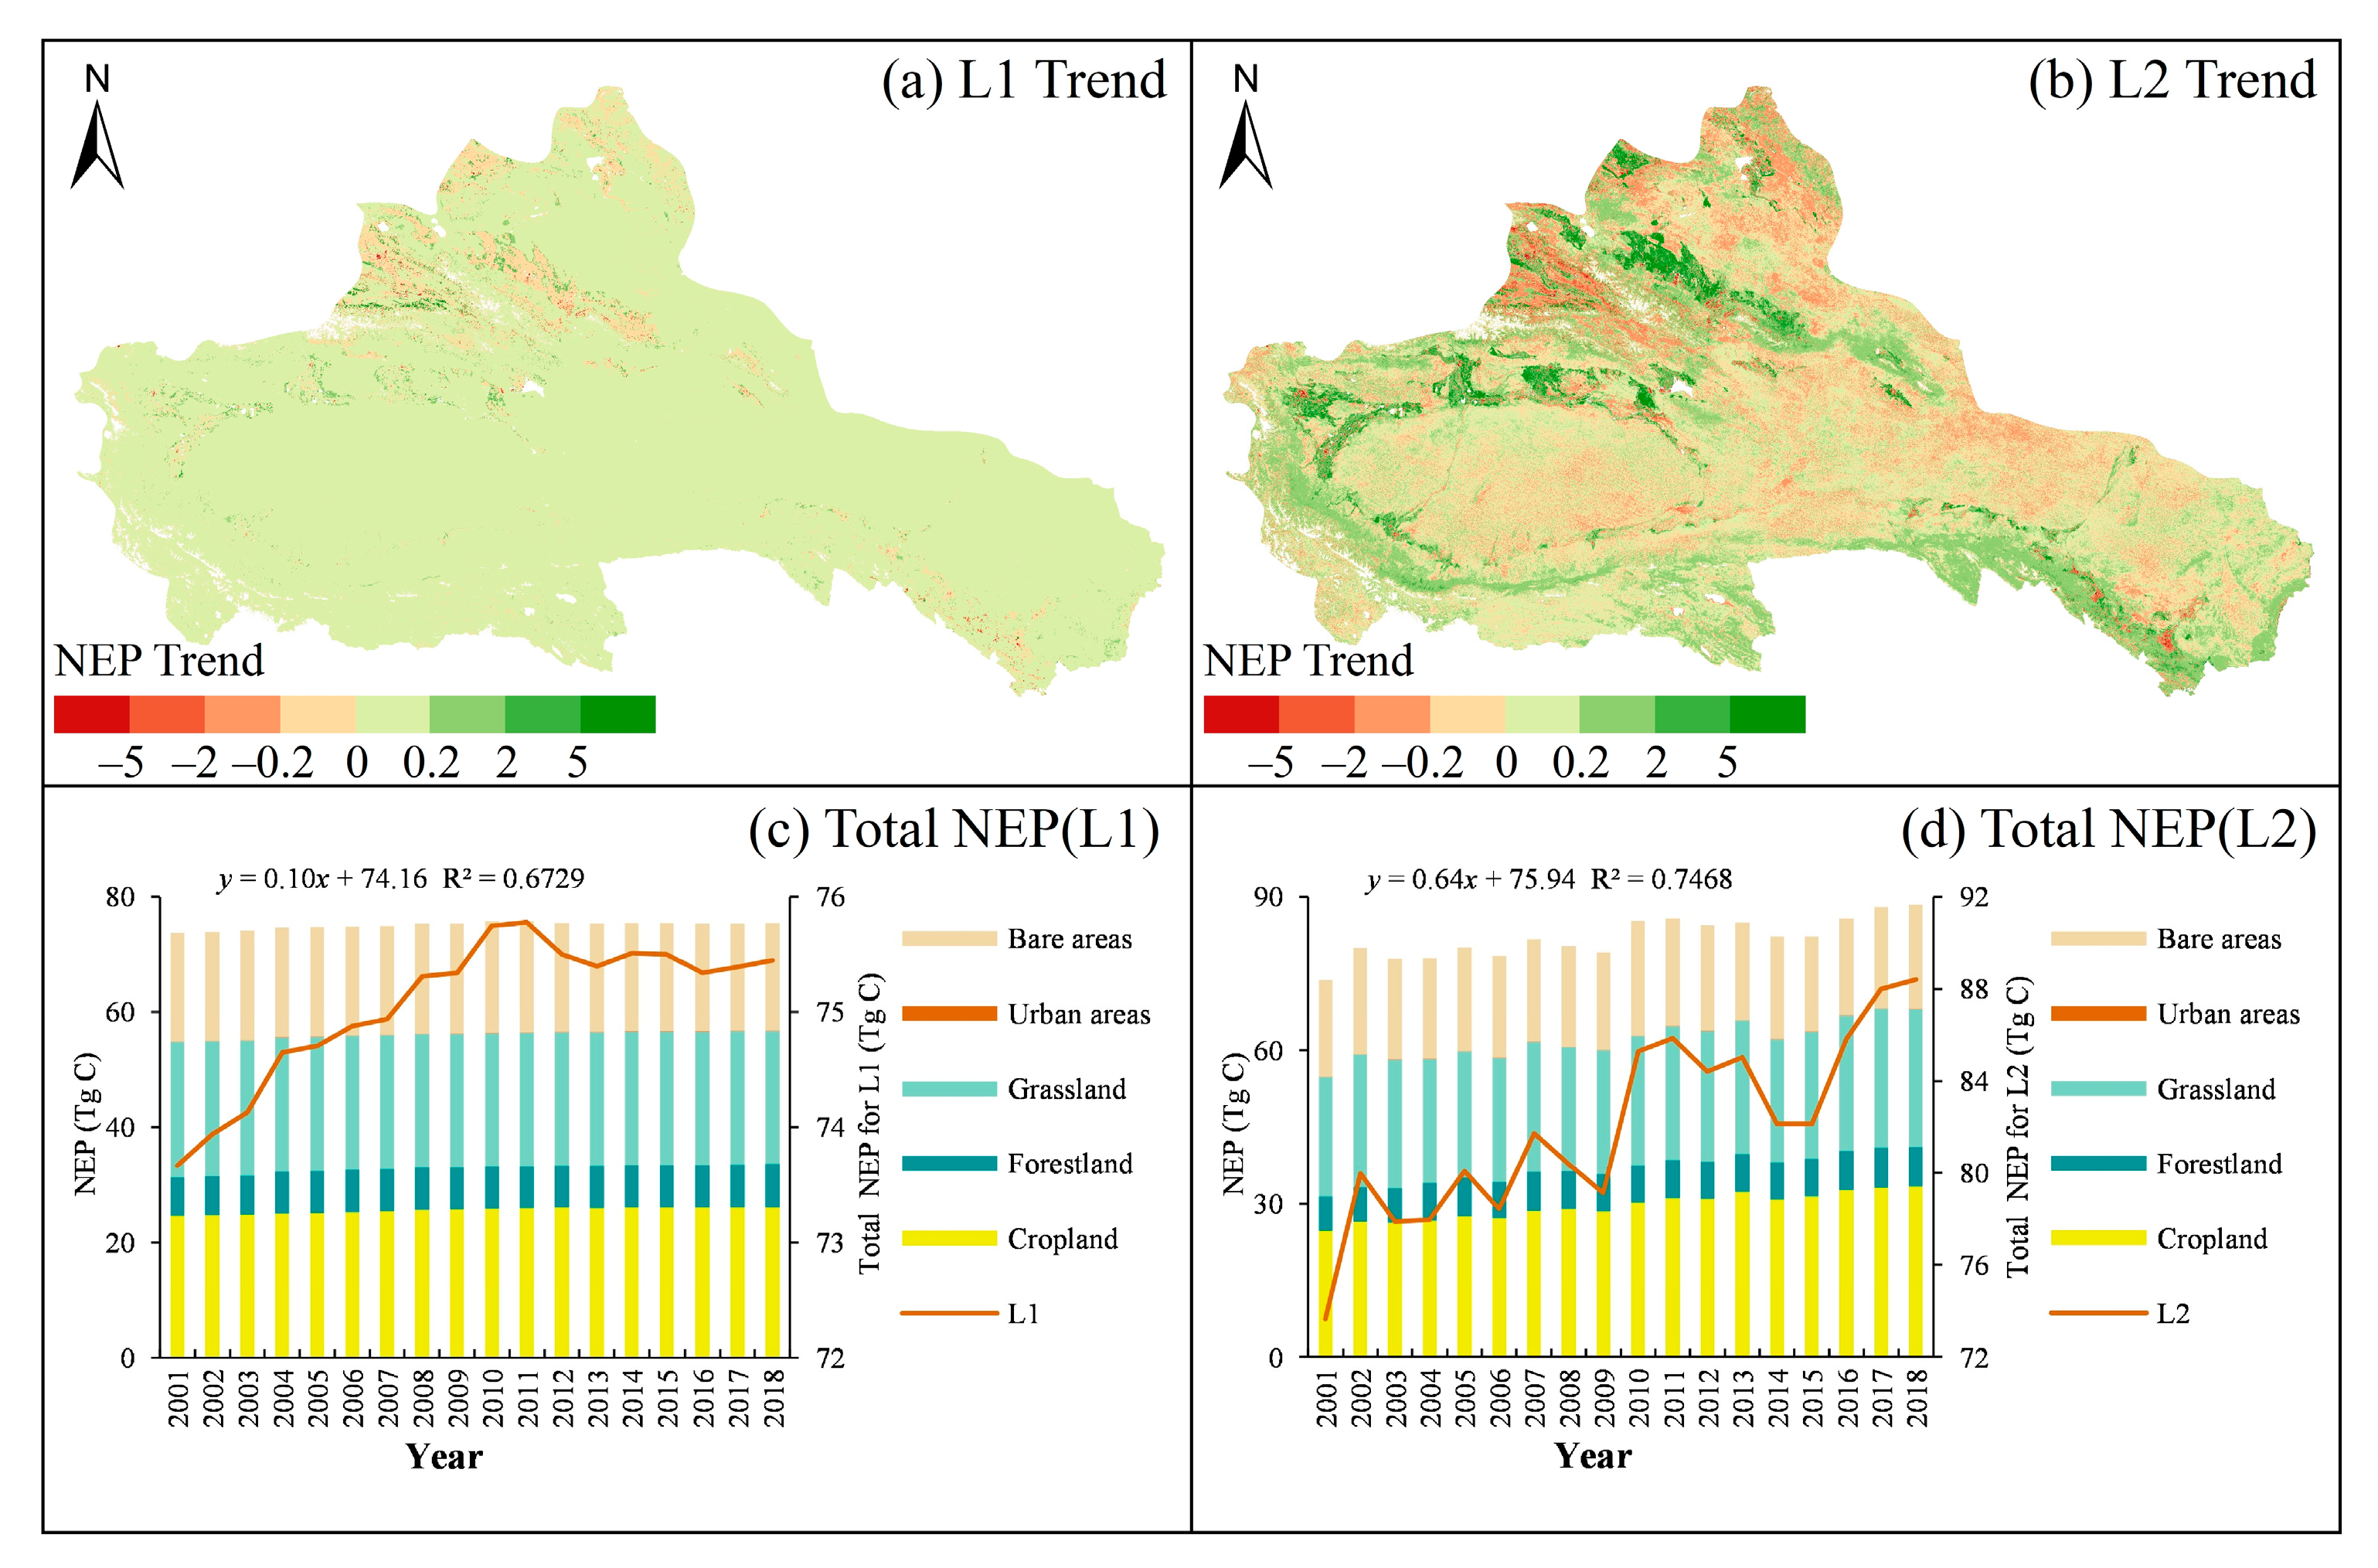
3.4.1. Changes in NEP in the Context of Expansion of Different Land Cover Types

On the basis of land cover conversion in each of the adjacent two years, we obtained the accumulation of NEP change in the expansion areas of different land cover types from 2001–2018. In Figure 7a, there are net increases of 1.71 Tg C and 0.64 Tg C for cropland and forestland expansion areas, respectively, and net decreases of 0.05 Tg C, 0.13 Tg C, and 0.12 Tg C for grassland, urban land, and bare land expansion areas, respectively, from 2001–2018. In particular, the areas converted from bare land and grassland to cropland had an increase in NEP of approximately 1.72 Tg C. Both together contributed to the NEP’s increase in areas of additional cropland. (Figure 7b). The increase in NEP in areas converted from grassland to forestland is the main contributor to the NEP increase in forestland expansion areas, with a contribution of approximately 92.18%, while it is also controlled by the NEP increase in areas of fallow forestry (Figure 7c). Total NEP in areas of new grassland showed a net decrease from 2001–2018, with a cumulative increase of 0.2 Tg C in areas of bare land converted to grassland but a cumulative decrease of approximately 0.25 Tg C in areas of cropland and forestland converted to grassland (Figure 7d). The reduction of NEP in areas where urban land occupies cropland is the main component of the reduction of NEP in areas of urban land expansion. It is noted that although the conversion of other land cover types to urban areas leads to a loss of regional vegetation and carbon stocks compared to the previous year, the total vegetation and carbon stocks in urban land expansion areas increased from 2001–2018 due to the significant expansion of urban areas (Figure 7e). The conversion of cropland, forestland, and grassland to bare land covers 756.5 km2, 43.75 km2, and 7914.75 km2, respectively, and resulted in a net reduction of 0.07 Tg C, 0.01 Tg C, and 0.04 Tg C in regional NEP, with cropland and grassland contributing a total of 91.67%. Combined with the regional distribution of land cover type conversion (Figure 3), this indicates areas of grassland in the high-altitude mountains of the southern part of the ARNWC and the Tianshan Mountains and cropland in the northern part of the ARNWC, including the Yili, Tacheng, and Altay regions, all of which are subject to land degradation, as well as a minor degradation of forests around Lake Bosten in southern Xinjiang (Figure 7f).

3.4.2. Results of Modeling Scenario Design

According to the results of scenario L1 (dynamic land cover type while other factors remained fixed), 94.04% of the ARNWC expressed an increase in NEP under the effects of land cover type conversion. mainly within the areas of cropland expansion along the economic belt on the northern slope of the Tianshan Mountains and the edge of the Tarim Basin, as well as regions where grassland converted to forestland in the southern part of the Ili region (Figure 8a). The effects of land cover type conversion promoted an increase in total NEP at a rate of 0.10 Tg C/a (Figure 8c), among which cropland, forestland, grassland, urban, and bare areas contributed 0.08 Tg C/a, 0.05 Tg C/a, −0.03 Tg C/a, 0.005 Tg C/a, and −0.01 Tg C/a, respectively. The net increase in total NEP under the effects of land cover type conversion was 1.77 Tg C until 2018, which explains approximately 15.55% of the change in original NEP (Table 8). Furthermore, the effects of land cover type conversion increased the total NEP by 1.40 Tg C, 0.92 Tg C, and 0.08 Tg C for cropland, forestland, and urban areas, respectively, and decreased the total NEP by 0.44 Tg C and 0.19 Tg C for grassland and bare areas, respectively.
In addition to the effects of land cover type conversion, it is equally important to consider the effects of vegetation growth enhancement. Therefore, we designed scenario L2 (dynamic land cover type, NDVI, EVI, other factors kept fixed). Compared with the results of scenario L1, the area showing an increasing trend in NEP was reduced, which accounted for approximately 60.02%, mainly distributed in the regions where cropland and grassland existed (Figure 8b). However, the net increase in total NEP reached 14.75 Tg C (Table 8), which exceeded the results of scenario LC1 (reaching 129.61% for its results). This indicated that land cover change has an obvious positive influence on the carbon sink of vegetation, especially the growth enhancement of fresh vegetation. The mean rate of increase was approximately 0.87 Tg C/a (Figure 8d), among which cropland, forestland, grassland, urban, and bare areas contributed 0.51 Tg C/a, 0.06 Tg C/a, 0.21 Tg C/a, 0.01 Tg C/a, and 0.08 Tg C/a, respectively. Meanwhile, the contribution to total NEP was the largest in cropland and grassland, reaching 8.66 Tg C and 3.49 Tg C, respectively, and the net increase in NEP in forestland, urban, and bare areas was 1.10 Tg C, 0.09 Tg C, and 1.41 Tg C, respectively.

4. Discussion

4.1. Overall Vegetation Carbon Source/Sink in the ARNWC

In our study, we found that 98.99% of vegetation in the ARNWC showed a carbon sink from 2001–2018, which is in line with earlier findings [16,53]. We observed that the overall vegetation in the ARNWC showed various degrees of carbon sinks. In addition, there are two noteworthy features.
First, the vegetation within bare areas, which mainly consist of desert ecosystems, has shown a weak carbon sink in recent years. A recent study demonstrated that although there is currently not enough evidence to prove that desert ecosystems can form stable vegetation carbon sinks, an increased aboveground biomass of desert vegetation is still observed in other parts of the globe, mainly due to increased precipitation during the growing season, which promotes vegetation growth. This also occurred in the ARNWC (Figure 9), and CO2 fertilization effects increased the carbon sequestration capacity of vegetation [54,55,56]. In addition, biocrust is widely distributed in arid deserts, and it can fix carbon dioxide, which is also an essential factor that influences the desert carbon cycle [57]. When the drifting sand in the desert is fixed by plants, it will gradually generate different stages of biocrust by the physical effects of dust fall and rainfall [58], and the newly generated biocrust can also be more convenient for herbaceous and woody plants to invade and grow [59], which may be another important reason why the desert is a carbon sink.
Second, the carbon source in ARNWC mainly occurs in high altitude mountains (Figure 10), including the Tianshan Mountains, Kunlun Mountains, and Qilian Mountains. Previous studies have also illustrated that as altitude increases, vegetation at middle and high altitudes is less disturbed by human activities. Furthermore, regions at these altitudes have an increase in rainfall and a decrease in evapotranspiration, which can encourage the area of vegetation carbon sinks to increase. However, at extremely high altitudes, temperatures that are too low inhibit vegetation growth, and vegetation will behave as a carbon source [60].

4.2. Vegetation Carbon Source/Sink in Different Land Cover Types and Their Response to Land Cover Change

For different land cover types, we found that the total and average carbon sinks for cropland in the ARNWC from 2001 to 2018 increased annually, which was caused by both the expansion of cropland area and anthropogenic management. In recent years, newly reclaimed land has mainly originated from the ARNWC due to the cultivated land requisition-compensation balance policy, which has contributed to the rapid expansion of the local cropland area [61,62]. In addition, since the expansion of cropland mainly occupies the surrounding desert grassland or bare areas, the soil moisture and nutrient conditions of the newly reclaimed areas have improved compared to the original land cover type. Furthermore, it has been proposed that agricultural activities such as the application of organic fertilizers, anthropogenic irrigation, and conservative tillage practices contributed to 3.2-, 2.4-, and 4.2-fold increases in the yields of wheat, maize, and cotton, respectively, in Xinjiang during 1978–2015 [63], thus indicating that the implementation of effective agricultural activities and artificial inputs in the ARNWC is favorable for increasing the productivity of cropland [64].
From 2001–2018, the total carbon sink in forestland increased by a net of 0.55 Tg C. However, the average NEP decreased from 389.86 g C m−2 a−1 to 374.25 g C m−2 a−1, which was caused by the loss of the carbon sink in the original forest areas. Our study found a decrease of 0.37 Tg C (5.67%) in the carbon pools and a decrease in the average NEP from 392.09 g C m−2 a−1 to 369.64 g C m−2 a−1 in the regions with unchanged forestland, mainly located in the Altai Mountains. This observation indicates that the ecology of the regional forest is degrading. Previous findings have noted that the proportion of young, middle-aged, and nearly mature forests in the Altai Mountains is lower, the age composition is imbalanced, and the stands have been rapidly decreasing in recent years due to age and mortality. In addition, anthropogenic activities such as indiscriminate deforestation and the exploitation of mineral resources have also led to the destruction of forests [65]. However, the forest expansion and regeneration of young and middle-aged forests caused by the implementation of national afforestation and reforestation projects and the Natural Forest Protection Project in the Ili Valley and Qilian Mountains will contribute to the increase in the carbon sink [66,67].
The total and average carbon sinks of grassland in the ARNWC have been increasing in the last 18 years. Although the effects of land cover type conversion led to a decrease of 0.44 Tg C, which offset a part of the increased carbon sink by enhanced vegetation growth, the combined effect of land cover change was still favorable to the accumulation of the carbon sink. It has been illustrated that the overall trend of grassland growth in the ARNWC has improved, and conservation measures such as fencing, prohibition, and rotational grazing have a positive impact on grassland growth [68,69]. This is similar to our observations that carbon sinks increase in areas with unaltered grassland. However, consistent with the negative effect of land cover type conversion, we found that the areas with changes in grassland had a decrease in carbon sink of 0.20 Tg C (16.39%), and the average NEP decreased from 71.37 g C m−2 a−1 to 47.98 g C m−2 a−1. The new grassland mainly originated from bare areas and was distributed in mountainous regions, for instance, the Tianshan Mountains, Kunlun Mountains, Qilian Mountains, and Helan Mountains. Since the 1980s, the warming climate in the ARNWC has led to partial snow melting [70]. These warmer conditions could promote the growth of alpine meadows and drive the bare alpine areas into higher elevations, with the former bare area boundaries being occupied by grassland [71]. However, the increase in new grassland carbon sinks still cannot compensate for the loss of grassland carbon sinks due to the expansion of cropland in the plains [72].
The total and average values of the vegetation carbon sink in urban areas increased, and this characteristic remained under the influence of land cover change. On the one hand, this was related to urban expansion. Our study found that the area of cities in 2018 was approximately four times greater than that in 2001 due to the influence of policies such as Western Development [73], which is in line with the results of prior studies [14]. On the other hand, although urbanization in its earlier stages occupied a large amount of the surrounding natural vegetation, fossil fuel combustion and consumption by industry also released large amounts of CO2 into the atmosphere. However, the vegetation growth status and carbon sink capacity will gradually improve with the intensification of subsequent human management strategies [74,75]. In addition, taking into account the natural environment in which the ARNWC is located, urbanization will sustainably improve the vegetation coverage to a certain extent [76].
The effects of land cover type conversion resulted in a decrease of 0.19 Tg C in the carbon sink of bare areas, corresponding to a decrease of 0.79 Tg C for the total vegetation carbon sink in the regions where bare areas changed. This mainly results from the reduction in bare areas. Our study found that only the bare land areas decreased from 2001–2018, and the decrease was substantial at 23,251 km2. However, the total carbon sink has increased in regions with unchanged bare areas, which eliminates the loss of carbon sink caused by the reduction of bare land area. The effect of land cover change indicates that the growth of vegetation in bare areas is improving, which is consistent with the findings observed in other regions of the globe [54].
In general, our study reveals that the vegetation in the ARNWC mainly operated as a carbon sink and that the total amount increased. Among them, although the total net increase in the vegetation carbon sink in bare areas is relatively small, accounting for only 0.16% of the total carbon sink increase in the ARNWC, it still shows the same trend of increasing carbon sink as observed by previous studies [77,78]. Under the influence of several national policies, land cover change has an obvious positive effect on the vegetation carbon sink. This further confirms that ecological restoration projects can be effective in achieving long-term improvements in terrestrial ecosystem carbon sink capacity [79]. However, it is still worth noting that although the carbon sink of cropland is increasing due to cropland expansion and anthropogenic management, in view of the constraints of natural conditions such as limited water resources and poor rainfall in arid regions, attention should still be paid to improving water use efficiency and avoiding the waste of water resources in the process of cropland reclamation [80]. Additionally, the windproof forest belt of cropland should be protected to prevent the occurrence of environmental problems such as land desertification [63]. For regions with degraded forests, such as the Altai Mountains, emphasis should be placed on restoring forest vegetation and strengthening the restoration and management of mine ecology, which are also relevant efforts that are expected to be implemented by the state-approved pilot project for ecological protection and restoration of mountains, rivers, forests, fields, lakes, and grasslands in the Irtysh River Basin that began in 2018 [81]. Our study also observed a gradual decrease in grassland carbon sink in the Ili region, which was also confirmed in previous studies associated with the soil moisture deficit and overgrazing in the Ili region [82]. Therefore, the enforcement of measures such as grazing prohibition and livestock relocation should be focused on in this region to slow the pace of grassland degradation [83].

4.3. Uncertainties

Carbon sinks in terrestrial ecosystems are usually influenced by land cover change and climate change. However, separating the effects of land cover change and climate change remains a challenge due to their complex interactions [84]. The vegetation carbon sink in the ARNWC is mainly affected by land cover change [14]. Therefore, our study explored this phenomenon by means of modeling scenarios. For example, to investigate the effects of land cover change, we only allowed land cover type, NDVI, and EVI to change during the model operation, while climate-related factors were kept at 2001 levels. However, it can be seen that the simulation results still represent the combined effect of land cover change and climate influences under stable climate conditions, even if the climate factors remain constant. In addition, to take the impact of natural vegetation growth into account, we allowed NDVI and EVI to vary in the stable category, but this was also potentially affected by climate simultaneously and introduced some uncertainty into the results. Nevertheless, our findings still provide knowledge regarding how land cover change affects the vegetation carbon sink in the ARNWC. Ultimately, we found that land cover change had an obvious positive impact on the vegetation carbon sink in ARNWC. In addition, we used a direct strategy to analyze the effects of land cover change, and the results are conservative in comparison with the indirect strategy (Supplementary Figure S1), which has a similar pattern to previous studies [9]. This further supports our results in another way because, even with some underestimation, our study still found that the effects of land cover change contributed to an increase in the vegetation carbon sink, regardless of whether it was considered in the overall study area or split by land cover types.
Regarding the model, although we have partially improved the CASA model, there may also be differences in the results due to varying sources of input data. For example, by comparing ESA CCI and MCD12Q1 land cover products, we found that there are some differences in the classification of pixel units. Particularly in the hinterland of the Tuha Basin and the southern margin of the Tarim Basin, a large number of pixel units are classified as permanent snow and ice in MCD12Q1, which is not reasonable. In contrast, the CCI product provides the first detailed long-term time series of land cover change, and it also meets the input requirements of both surface and climate models [85]. Therefore, we chose the ESA CCI product as the input land cover dataset for the model in this study. In addition, it has been proposed that the estimation results derived by inputting MODIS NDVI are higher than those of GIMMS NDVI [52], and NDVI suffers from saturation effects, which may underestimate the value of high coverage areas [86]. Thus, it can be seen that the results of the vegetation carbon sink will be subject to some uncertainty. However, the results of our study still contribute to revealing the relative magnitude and direction of the vegetation carbon sink. Furthermore, given the uncertainty of the model itself, we need to improve our understanding of the formation mechanism and influencing factors for terrestrial ecosystem productivity and deepen our research on the mechanisms of physiological and ecological processes in the model in future studies.
In addition, there is no doubt that model simulation results with high-spatial-resolution input data are more beneficial to our understanding of the response of terrestrial ecosystems to global climate change. However, fine representation of model results at large scales is often difficult to achieve due to the complexity of the model structure, the difficulty of applying high-resolution simulations regionally/globally, and long operation times. In contrast, using coarser resolution remote sensing products often fails to capture the effects of sub-grid heterogeneity and topographic relief, two factors that play an important role in surface energy balance and can significantly interfere with vegetation photosynthesis and thus cause bias in the results of vegetation carbon source/sink evaluation [87]. Based on this consideration, our study still has some limitations. First, the MODIS vegetation index data were generated ignoring the topographic effects [88], and second, the meteorological data used in the study, including the solar radiation at 0.1° (~10 km) and the evapotranspiration/potential evapotranspiration data at 1/24° (~4 km), were of coarse resolution, and even if they were resampled to 500 m using a bilinear interpolation method that applies to continuous data, their ability to capture changes in the surface energy balance due to sub-grid heterogeneity and topographic relief remains weaker than the higher spatial resolution products [89]. However, even with the uncertainties associated with using these data to force the model, we were able to assess the results for vegetation carbon source and sink at a spatial resolution of 500 m over an area of more than 2 million km2. Any attempt to build on this foundation with more detailed simulations would be difficult to achieve due to the sheer volume of data. At present, Tesfa et al. [89] have developed a method for downscaling grid-scale meteorological data to sub-grid scale based on topography in response to the coarse resolution of meteorological data. Moreover, Xie et al. [90] also demonstrated the feasibility of their proposal to run the model at coarse spatial resolution and then apply a linear or non-linear downscaling process to the coarse estimation results by considering surface heterogeneity to obtain high spatial resolution vegetation productivity at large scales. Therefore, our future work will be able to use these methods to conduct more refined simulations of vegetation carbon sinks and to assess the impact of land cover change, thus making our research more considered.

5. Conclusions

In this study, we described the spatial and temporal dynamics of vegetation carbon sources/sinks in the ARNWC from 2001 to 2018 by combining the CASA model and a RH model and assessed the effects of land cover change on them through a modeling scenario design. We found that vegetation in the study area mostly acted as a carbon sink from 2001 to 2018. Among them, it is noteworthy that the vegetation within bare areas, which mainly consist of desert ecosystems, has also shown a weak carbon sink in recent years. This is likely to be related to increased regional precipitation during the growing season, CO2 fertilization, and biocrust distribution. Furthermore, we found that land cover change had an obvious positive influence on vegetation carbon sinks. Among them, the effect of land cover type conversion (abrupt change) contributed to an increase in total NEP of approximately 1.77 Tg C, which reached 15.55% of the original value, and after simultaneously considering the effect of vegetation growth enhancement (gradual change), it contributed to an increase in total NEP of approximately 14.75 Tg C, which reached 129.61% of the original value. For different land cover types, cropland consistently contributed the most (approximately 73.46%) to the increment of NEP in the ARNWC, and the regeneration of young and middle-aged forests also led to a significant increase in forest carbon sinks, which is approximately 5.5 times more than in 2001. Thus, our study indicated that cropland expansion and anthropogenic management dominated the growth of vegetation carbon sequestration in the ARNWC from 2001–2018, that afforestation also benefits the carbon sink capacity of terrestrial ecosystems, and that attention should be paid to restoring and protecting native vegetation in forestland and grassland regions in the future. Our findings provide a reference for assessing the effects of land cover change on vegetation carbon sinks, provide scientific guidance for the rational use and planning of land resources, and regulate human activities under the premise of reducing carbon emissions.

Supplementary Materials

The following supporting information can be downloaded at: https://www.mdpi.com/article/10.3390/rs15092471/s1, Figure S1: Direct and indirect strategies for modelling scenario design. (a) Comparison of direct and indirect strategies; (b) Differences between the results of direct/indirect strategic thinking adopted in the scenario design and the results of the original scenario.

Author Contributions

Conceptualization, H.T. and G.J.; data curation, H.T.; formal analysis, H.T.; funding acquisition, G.J.; methodology, H.T., G.J. and T.Y.; software, B.C. and X.L.; validation, T.Y.; writing—original draft, H.T.; writing—review and editing, G.J., T.Y., L.Z. and K.L. All authors have read and agreed to the published version of the manuscript.

Funding

This research was funded by the Third Xinjiang Scientific Expedition Program (Grant No. 2021xjkk0701) and the Strategic Priority Research Program of Chinese Academy of Sciences (Grant No. XDA19030301).

Data Availability Statement

Data will be made available on request.

Acknowledgments

We would like to thank the editor and anonymous reviewers for their constructive comments and suggestions for improving the manuscript.

Conflicts of Interest

The authors declare that they have no known competing financial interests or personal relationships that could have appeared to influence the work reported in this paper.

References

  1. Friedlingstein, P.; Jones, M.W.; O’Sullivan, M.; Andrew, R.M.; Bakker, D.C.E.; Hauck, J.; Le Quere, C.; Peters, G.P.; Peters, W.; Pongratz, J.; et al. Global Carbon Budget 2021. Earth Syst. Sci. Data 2022, 14, 1917–2005. [Google Scholar] [CrossRef]
  2. Friedlingstein, P.; O’Sullivan, M.; Jones, M.W.; Andrew, R.M.; Hauck, J.; Olsen, A.; Peters, G.P.; Peters, W.; Pongratz, J.; Sitch, S.; et al. Global Carbon Budget 2020. Earth Syst. Sci. Data 2020, 12, 3269–3340. [Google Scholar] [CrossRef]
  3. Zhu, X.J.; Yu, G.R.; He, H.L.; Wang, Q.F.; Chen, Z.; Gao, Y.N.; Zhang, Y.P.; Zhang, J.H.; Yan, J.H.; Wang, H.M.; et al. Geographical statistical assessments of carbon fluxes in terrestrial ecosystems of China: Results from upscaling network observations. Glob. Planet. Chang. 2014, 118, 52–61. [Google Scholar] [CrossRef]
  4. Yao, Y.T.; Li, Z.J.; Wang, T.; Chen, A.P.; Wang, X.H.; Du, M.Y.; Jia, G.S.; Li, Y.N.; Li, H.Q.; Luo, W.J.; et al. A new estimation of China’s net ecosystem productivity based on eddy covariance measurements and a model tree ensemble approach. Agric. For. Meteorol. 2018, 253–254, 84–93. [Google Scholar] [CrossRef]
  5. Fang, J.Y.; Guo, Z.D.; Piao, S.L.; Chen, A.P. Terrestrial vegetation carbon sinks in China, 1981–2000. Sci. China Ser. D-Earth Sci. 2007, 50, 1341–1350. [Google Scholar] [CrossRef]
  6. Houghton, R.A.; Hackler, J.L.; Lawrence, K.T. The US carbon budget: Contributions from land-use change. Science 1999, 285, 574–578. [Google Scholar] [CrossRef]
  7. Lambin, E.F.; Turner, B.L.; Geist, H.J.; Agbola, S.B.; Angelsen, A.; Bruce, J.W.; Coomes, O.T.; Dirzo, R.; Fischer, G.; Folke, C.; et al. The causes of land-use and land-cover change: Moving beyond the myths. Glob. Environ. Chang. Hum. Policy Dimens. 2001, 11, 261–269. [Google Scholar] [CrossRef]
  8. Foley, J.A.; DeFries, R.; Asner, G.P.; Barford, C.; Bonan, G.; Carpenter, S.R.; Chapin, F.S.; Coe, M.T.; Daily, G.C.; Gibbs, H.K.; et al. Global consequences of land use. Science 2005, 309, 570–574. [Google Scholar] [CrossRef]
  9. Zhang, Y.L.; Song, C.H.; Zhang, K.R.; Cheng, X.L.; Band, L.E.; Zhang, Q.F. Effects of land use/land cover and climate changes on terrestrial net primary productivity in the Yangtze River Basin, China, from 2001 to 2010. J. Geophys. Res. Biogeosci. 2014, 119, 1092–1109. [Google Scholar] [CrossRef]
  10. Chen, Y.N.; Yang, Q.; Luo, Y.; Shen, Y.J.; Pan, X.L.; Li, L.H.; Li, Z.Q. Ponder on the issues of water resources in the arid region of northwest China. Arid Land Geogr. 2012, 35, 1–9. [Google Scholar] [CrossRef]
  11. Cai, D.W.; Ge, Q.S.; Wang, X.M.; Liu, B.L.; Goudie, A.S.; Hu, S. Contributions of ecological programs to vegetation restoration in arid and semiarid China. Environ. Res. Lett. 2020, 15, 114046. [Google Scholar] [CrossRef]
  12. Xie, S.D.; Mo, X.G.; Hu, S.; Liu, S.X. Contributions of climate change, elevated atmospheric CO2 and human activities to ET and GPP trends in the Three-North Region of China. Agric. For. Meteorol. 2020, 295, 108183. [Google Scholar] [CrossRef]
  13. Zhang, J.; Zhao, X.Z.; Zhou, R.; Tian, T.; Cui, J.Y.; Zhao, L.; Wang, G.R.; Xiong, Y.C. Labor force transfer, vegetation restoration and ecosystem service in the Qilian Mountains. J. Environ. Manag. 2021, 288, 112387. [Google Scholar] [CrossRef] [PubMed]
  14. Yang, H.F.; Mu, S.J.; Li, J.L. Effects of ecological restoration projects on land use and land cover change and its influences on territorial NPP in Xinjiang, China. CATENA 2014, 115, 85–95. [Google Scholar] [CrossRef]
  15. Bai, X.Y.; Fu, J.X.; Li, Y.; Li, Z. Attributing vegetation change in an arid and cold watershed with complex ecosystems in northwest China. Ecol. Indic. 2022, 138, 108835. [Google Scholar] [CrossRef]
  16. Gu, Q.; Wei, J.; Luo, S.C.; Ma, M.G.; Tang, X.G. Potential and environmental control of carbon sequestration in major ecosystems across arid and semi-arid regions in China. Sci. Total Environ. 2018, 645, 796–805. [Google Scholar] [CrossRef]
  17. Li, Z.; Chen, Y.N.; Li, W.H.; Deng, H.J.; Fang, G.H. Potential impacts of climate change on vegetation dynamics in Central Asia. J. Geophys. Res. Atmos. 2015, 120, 12345–12356. [Google Scholar] [CrossRef]
  18. Zhu, S.H.; Li, C.F.; Shao, H.; Ju, W.M.; Lv, N.N. The response of carbon stocks of drylands in Central Asia to changes of CO2 and climate during past 35 years. Sci. Total Environ. 2019, 687, 330–340. [Google Scholar] [CrossRef]
  19. Hubau, W.; Lewis, S.L.; Phillips, O.L.; Affum-Baffoe, K.; Beeckman, H.; Cuni-Sanchez, A.; Daniels, A.K.; Ewango, C.E.N.; Fauset, S.; Mukinzi, J.M.; et al. Asynchronous carbon sink saturation in African and Amazonian tropical forests. Nature 2020, 579, 80–87. [Google Scholar] [CrossRef]
  20. Pan, Y.D.; Birdsey, R.A.; Fang, J.Y.; Houghton, R.; Kauppi, P.E.; Kurz, W.A.; Phillips, O.L.; Shvidenko, A.; Lewis, S.L.; Canadell, J.G.; et al. A Large and Persistent Carbon Sink in the World’s Forests. Science 2011, 333, 988–993. [Google Scholar] [CrossRef]
  21. Tang, X.L.; Zhao, X.; Bai, Y.F.; Tang, Z.Y.; Wang, W.T.; Zhao, Y.C.; Wan, H.W.; Xie, Z.Q.; Shi, X.Z.; Wu, B.F.; et al. Carbon pools in China’s terrestrial ecosystems: New estimates based on an intensive field survey. Proc. Natl. Acad. Sci. USA 2018, 115, 4021–4026. [Google Scholar] [CrossRef] [PubMed]
  22. Xu, L.; Saatchi, S.S.; Yang, Y.; Yu, Y.F.; Pongratz, J.; Bloom, A.A.; Bowman, K.; Worden, J.; Liu, J.J.; Yin, Y.; et al. Changes in global terrestrial live biomass over the 21st century. Sci. Adv. 2021, 7, eabe9829. [Google Scholar] [CrossRef] [PubMed]
  23. Bodesheim, P.; Jung, M.; Gans, F.; Mahecha, M.D.; Reichstein, M. Upscaled diurnal cycles of land-atmosphere fluxes: A new global half-hourly data product. Earth Syst. Sci. Data 2018, 10, 1327–1365. [Google Scholar] [CrossRef]
  24. Ichii, K.; Ueyama, M.; Kondo, M.; Saigusa, N.; Kim, J.; Carmelita Alberto, M.; Ardoe, J.; Euskirchen, E.S.; Kang, M.; Hirano, T.; et al. New data-driven estimation of terrestrial CO2 fluxes in Asia using a standardized database of eddy covariance measurements, remote sensing data, and support vector regression. J. Geophys. Res. Biogeosci. 2017, 122, 767–795. [Google Scholar] [CrossRef]
  25. Jung, M.; Schwalm, C.; Migliavacca, M.; Walther, S.; Camps-Valls, G.; Koirala, S.; Anthoni, P.; Besnard, S.; Bodesheim, P.; Carvalhais, N.; et al. Scaling carbon fluxes from eddy covariance sites to globe: Synthesis and evaluation of the FLUXCOM approach. Biogeosciences 2020, 17, 1343–1365. [Google Scholar] [CrossRef]
  26. Ciais, P.; Tan, J.; Wang, X.; Roedenbeck, C.; Chevallier, F.; Piao, S.L.; Moriarty, R.; Broquet, G.; Le Quere, C.; Canadell, J.G.; et al. Five decades of northern land carbon uptake revealed by the interhemispheric CO2 gradient. Nature 2019, 568, 221–225. [Google Scholar] [CrossRef]
  27. Thompson, R.L.; Patra, P.K.; Chevallier, F.; Maksyutov, S.; Law, R.M.; Ziehn, T.; van der Laan-Luijkx, I.T.; Peters, W.; Ganshin, A.; Zhuravlev, R.; et al. Top-down assessment of the Asian carbon budget since the mid 1990s. Nat. Commun. 2016, 7, 10724. [Google Scholar] [CrossRef]
  28. Wang, J.; Feng, L.; Palmer, P.I.; Liu, Y.; Fang, S.X.; Bosch, H.; O’Dell, C.W.; Tang, X.P.; Yang, D.X.; Liu, L.X.; et al. Large Chinese land carbon sink estimated from atmospheric carbon dioxide data. Nature 2020, 586, 720–723. [Google Scholar] [CrossRef]
  29. Chang, J.F.; Ciais, P.; Wang, X.H.; Piao, S.L.; Asrar, G.; Betts, R.; Chevallier, F.; Dury, M.; Francois, L.; Frieler, K.; et al. Benchmarking carbon fluxes of the ISIMIP2a biome models. Environ. Res. Lett. 2017, 12, 5002. [Google Scholar] [CrossRef]
  30. Piao, S.L.; Huang, M.T.; Liu, Z.; Wang, X.H.; Ciais, P.; Canadell, J.G.; Wang, K.; Bastos, A.; Friedlingstein, P.; Houghton, R.A.; et al. Lower land-use emissions responsible for increased net land carbon sink during the slow warming period. Nat. Geosci. 2018, 11, 739–743. [Google Scholar] [CrossRef]
  31. Fang, J.Y.; Ke, J.H.; Tang, Z.Y.; Chen, A.P. Implications and estimations of four terrestrial productivity parameters. Chin. J. Plant Ecol. 2001, 25, 414–419. [Google Scholar]
  32. Zhao, J.F.; Ma, J.Y.; Zhu, Y.J. Evaluating impacts of climate change on net ecosystem productivity (NEP) of global different forest types based on an individual tree-based model FORCCHN and remote sensing. Glob. Planet. Chang. 2019, 182, 103010. [Google Scholar] [CrossRef]
  33. Ruimy, A.; Saugier, B.; Dedieu, G. Methodology for the estimation of terrestrial net primary production from remotely sensed data. J. Geophys. Res. Atmos. 1994, 99, 5263–5283. [Google Scholar] [CrossRef]
  34. Chen, S.; Zhang, Y.; Wu, Q.; Liu, S.; Song, C.; Xiao, J.; Band, L.E.; Vose, J.M. Vegetation structural change and CO2 fertilization more than offset gross primary production decline caused by reduced solar radiation in China. Agric. For. Meteorol. 2021, 296, 108207. [Google Scholar] [CrossRef]
  35. Dunne, J.P.; John, J.G.; Shevliakova, E.; Stouffer, R.J.; Krasting, J.P.; Malyshev, S.L.; Milly, P.C.D.; Sentman, L.T.; Adcroft, A.J.; Cooke, W.; et al. GFDL’s ESM2 Global Coupled Climate-Carbon Earth System Models. Part II: Carbon System Formulation and Baseline Simulation Characteristics. J. Clim. 2013, 26, 2247–2267. [Google Scholar] [CrossRef]
  36. Liu, C.Y.; Dong, X.F.; Liu, Y.Y. Changes of NPP and their relationship to climate factors based on the transformation of different scales in Gansu, China. CATENA 2015, 125, 190–199. [Google Scholar] [CrossRef]
  37. Huang, H.; Calabrese, S.; Rodriguez-Iturbe, I. Variability of ecosystem carbon source from microbial respiration is controlled by rainfall dynamics. Proc. Natl. Acad. Sci. USA 2021, 118, e2115283118. [Google Scholar] [CrossRef]
  38. Pei, Z.-Y.; Ouyang, H.; Zhou, C.-P.; Xu, X.-L. Carbon Balance in an Alpine Steppe in the Qinghai-Tibet Plateau. J. Integr. Plant Biol. 2009, 51, 521–526. [Google Scholar] [CrossRef]
  39. Yao, J.Q.; Yang, Q.; Liu, Z.H.; Li, C.Z. Spatio-temporal change of precipitation in arid region of the Northwest China. Acta Ecol. Sin. 2015, 35, 5846–5855. [Google Scholar]
  40. Wang, H.J.; Li, Z.; Niu, Y.; Li, X.C.; Cao, L.; Feng, R.; He, Q.N.; Pan, Y.P. Evolution and Climate Drivers of NDVI of Natural Vegetation during the Growing Season in the Arid Region of Northwest China. Forests 2022, 13, 1082. [Google Scholar] [CrossRef]
  41. Peng, S.Z.; Ding, Y.X.; Liu, W.Z.; Li, Z. 1 km monthly temperature and precipitation dataset for China from 1901 to 2017. Earth Syst. Sci. Data 2019, 11, 1931–1946. [Google Scholar] [CrossRef]
  42. Tang, W.J.; Yang, K.; Qin, J.; Li, X.; Niu, X.L. A 16-year dataset (2000–2015) of high-resolution (3 h, 10 km) global surface solar radiation. Earth Syst. Sci. Data 2019, 11, 1905–1915. [Google Scholar] [CrossRef]
  43. Abatzoglou, J.T.; Dobrowski, S.Z.; Parks, S.A.; Hegewisch, K.C. Data Descriptor: TerraClimate, a high-resolution global dataset of monthly climate and climatic water balance from 1958–2015. Sci. Data 2018, 5, 170191. [Google Scholar] [CrossRef] [PubMed]
  44. Yang, Y.H.; Fang, J.Y.; Ma, W.H.; Guo, D.L.; Mohammat, A. Large-scale pattern of biomass partitioning across China’s grasslands. Glob. Ecol. Biogeogr. 2010, 19, 268–277. [Google Scholar] [CrossRef]
  45. Mohammat, A.; Yang, Y.H.; Guo, Z.D.; Fang, J.Y. Carbon contents and its vertical distribution in alpine grasslands in Bayinbulak, middle stretch of the Tianshan Mountains of Xinjiang. Chin. J. Plant Ecol. 2006, 30, 545–552. [Google Scholar]
  46. Potter, C.S.; Randerson, J.T.; Field, C.B.; Matson, P.A.; Vitousek, P.M.; Mooney, H.A.; Klooster, S.A. Terrestrial ecosystem production—A process model-based on global satellite and surface data. Glob. Biogeochem. Cycles 1993, 7, 811–841. [Google Scholar] [CrossRef]
  47. Zhu, W.Q.; Pan, Y.Z.; Zhang, J.S. Estimation of net primary productivity of Chinese terrestrial vegetation based on remote sensing. Chin. J. Plant Ecol. 2007, 31, 413–424. [Google Scholar]
  48. Goward, S.N.; Huemmrich, K.F. Vegetation canopy par absorptance and the normalized difference vegetation index—An assessment using the sail model. Remote Sens. Environ. 1992, 39, 119–140. [Google Scholar] [CrossRef]
  49. Yan, S.C.; Wu, Y.; Fan, J.L.; Zhang, F.C.; Guo, J.J.; Zheng, J.; Wu, L.F.; Lu, J.S. Quantifying nutrient stoichiometry and radiation use efficiency of two maize cultivars under various water and fertilizer management practices in northwest China. Agric. Water Manag. 2022, 271, 107772. [Google Scholar] [CrossRef]
  50. Zhu, W.Q.; Pan, Y.Z.; He, H.; Yu, D.Y.; Hu, H.B. Simulation of maximum light use efficiency for some typical vegetation types in China. Chin. Sci. Bull. 2006, 51, 457–463. [Google Scholar] [CrossRef]
  51. Feng, Y.M.; Yao, A.D.; Jiang, L.N. Improving the CASA model and applying it to estimate the net primary productivity of arid region ecology system. J. Arid Land Resour. Environ. 2014, 28, 39–43. [Google Scholar] [CrossRef]
  52. Jiao, W.; Chen, Y.; Li, Z. Remote sensing estimation and the reasons for temporal-spatial differences of vegetation net primary productivity in arid region of Northwest China. Chin. J. Ecol. 2017, 36, 181–189. [Google Scholar]
  53. Pan, J.H.; Wen, Y. Estimation and spatial-temporal characteristics of carbon sink in the arid region of northwest China. Acta Ecol. Sin. 2015, 35, 7718–7728. [Google Scholar]
  54. Brandt, M.; Hiernaux, P.; Rasmussen, K.; Tucker, C.J.; Wigneron, J.-P.; Diouf, A.A.; Herrmann, S.M.; Zhang, W.M.; Kergoat, L.; Mbow, C.; et al. Changes in rainfall distribution promote woody foliage production in the Sahel. Commun. Biol. 2019, 2, 133. [Google Scholar] [CrossRef]
  55. Donohue, R.J.; Roderick, M.L.; McVicar, T.R.; Farquhar, G.D. Impact of CO2 fertilization on maximum foliage cover across the globe’s warm, arid environments. Geophys. Res. Lett. 2013, 40, 3031–3035. [Google Scholar] [CrossRef]
  56. Yang, Y.H.; Shi, Y.; Sun, W.J.; Chang, J.F.; Zhu, J.X.; Chen, L.Y.; Wang, X.; Guo, Y.P.; Zhang, H.T.; Yu, L.F.; et al. Terrestrial carbon sinks in China and around the world and their contribution to carbon neutrality. Sci. China Life Sci. 2022, 65, 861–895. [Google Scholar] [CrossRef]
  57. Su, Y.G.; Wu, L.; Zhang, Y.M. Characteristics of carbon flux in two biologically crusted soils in the Gurbantunggut Desert, Northwestern China. CATENA 2012, 96, 41–48. [Google Scholar] [CrossRef]
  58. Li, X.R.; Kong, D.S.; Tan, H.J.; Wang, X.P. Changes in soil and vegetation following stabilisation of dunes in the southeastern fringe of the Tengger Desert, China. Plant Soil 2007, 300, 221–231. [Google Scholar] [CrossRef]
  59. Zhang, Y.M.; Nie, H.L. Effects of biological soil crusts on seedling growth and element uptake in five desert plants in Junggar Basin, western China. Chin. J. Plant Ecol. 2011, 35, 380–388. [Google Scholar] [CrossRef]
  60. Li, Z.; Chen, Y.N.; Zhang, Q.F.; Li, Y. Spatial patterns of vegetation carbon sinks and sources under water constraint in Central Asia. J. Hydrol. 2020, 590, 125355. [Google Scholar] [CrossRef]
  61. Huang, H.C.; Wen, L.Y.; Kong, X.B.; Chen, W.G.; Sun, X.B. The Impact of Spatial Pattern Evolution of Cultivated Land on Cultivated Land Suitability in China and Its Policy Implication. China Land Sci. 2021, 35, 61–70. [Google Scholar]
  62. Liu, Y.S.; Fang, F.; Li, Y.H. Key issues of land use in China and implications for policy making. Land Use Policy 2014, 40, 6–12. [Google Scholar] [CrossRef]
  63. Xu, E.Q.; Zhang, H.Q.; Xu, Y.M. Exploring land reclamation history: Soil organic carbon sequestration due to dramatic oasis agriculture expansion in arid region of Northwest China. Ecol. Indic. 2020, 108, 105746. [Google Scholar] [CrossRef]
  64. Xu, Z.H.; Fan, W.G.; Wei, H.J.; Zhang, P.; Ren, J.H.; Gao, Z.C.; Ulgiati, S.; Kong, W.D.; Dong, X.B. Evaluation and simulation of the impact of land use change on ecosystem services based on a carbon flow model: A case study of the Manas River Basin of Xinjiang, China. Sci. Total Environ. 2019, 652, 117–133. [Google Scholar] [CrossRef]
  65. Liu, F.; Zeng, Y.N. Analysis of the spatio-temporal variation of vegetation carbon source/sink in Qinghai Plateau from 2000–2015. Acta Ecol. Sin. 2021, 41, 5792–5803. [Google Scholar]
  66. Fang, J.Y.; Guo, Z.D.; Hu, H.F.; Kato, T.; Muraoka, H.; Son, Y. Forest biomass carbon sinks in East Asia, with special reference to the relative contributions of forest expansion and forest growth. Glob. Chang. Biol. 2014, 20, 2019–2030. [Google Scholar] [CrossRef]
  67. Guo, Z.D.; Hu, H.F.; Li, P.; Li, N.Y.; Fang, J.Y. Spatio-temporal changes in biomass carbon sinks in China’s forests from 1977 to 2008. Sci. China-Life Sci. 2013, 56, 661–671. [Google Scholar] [CrossRef]
  68. Cai, Z.Z.; Huai, Y.J.; Bai, T.; Dong, L. Recent Changes of Grassland Cover in Xinjiang Based on NDVI Analysis. J. Basic Sci. Eng. 2020, 28, 1369–1381. [Google Scholar] [CrossRef]
  69. Li, Y.G.; Liu, W.; Feng, Q.; Zhu, M.; Yang, L.S.; Zhang, J.T. Effects of land use and land cover change on soil organic carbon storage in the Hexi regions, Northwest China. J. Environ. Manag. 2022, 312, 114911. [Google Scholar] [CrossRef]
  70. Shi, Y.F.; Shen, Y.P.; Kang, E.; Li, D.L.; Ding, Y.J.; Zhang, G.W.; Hu, R.J. Recent and future climate change in northwest china. Clim. Chang. 2007, 80, 379–393. [Google Scholar] [CrossRef]
  71. Zhang, F.G.; Zeng, B.; Yang, T.B. Spatiotemporal distribution changes in alpine desert belt in Qilian Mountains under climate changes in past 30 years. Chin. J. Plant Ecol. 2019, 43, 305–319. [Google Scholar] [CrossRef]
  72. Zhai, Y.X.; Zhang, F.Y.; Ma, L.N. Changes of Production-Living-Ecology Land Transformation and Eco-environmental Effects in Xinjiang in Last 40 Years. Chin. J. Soil Sci. 2022, 53, 514–523. [Google Scholar] [CrossRef]
  73. Wu, R.; Li, Z.G.; Wang, S.J. The varying driving forces of urban land expansion in China: Insights from a spatial-temporal analysis. Sci. Total Environ. 2021, 766, 142591. [Google Scholar] [CrossRef] [PubMed]
  74. Ding, T.; Sun, Y.G.; Huang, C.; Mu, C.L.; Fan, Y.Q.; Lin, J.; Qin, Y.N. Pathways of clean energy heating electrification programs for reducing carbon emissions in Northwest China. Renew. Sustain. Energy Rev. 2022, 166, 112679. [Google Scholar] [CrossRef]
  75. Zhang, X.X.; Brandt, M.; Tong, X.W.; Ciais, P.; Yue, Y.M.; Xiao, X.M.; Zhang, W.M.; Wang, K.L.; Fensholt, R. A large but transient carbon sink from urbanization and rural depopulation in China. Nat. Sustain. 2022, 5, 321–328. [Google Scholar] [CrossRef]
  76. Du, J.Q.; Fu, Q.; Fang, S.F.; Wu, J.H.; He, P.; Quan, Z.J. Effects of rapid urbanization on vegetation cover in the metropolises of China over the last four decades. Ecol. Indic. 2019, 107, 105458. [Google Scholar] [CrossRef]
  77. Ding, L.P.; Zhou, Q.M.; Wei, J.C. Estimation of Endocarpon pusillum Hedwig carbon budget in the Tengger Desert based on its photosynthetic rate. Sci. China-Life Sci. 2013, 56, 848–855. [Google Scholar] [CrossRef]
  78. Poulter, B.; Frank, D.; Ciais, P.; Myneni, R.B.; Andela, N.; Bi, J.; Broquet, G.; Canadell, J.G.; Chevallier, F.; Liu, Y.Y.; et al. Contribution of semi-arid ecosystems to interannual variability of the global carbon cycle. Nature 2014, 509, 600–603. [Google Scholar] [CrossRef]
  79. Ye, X.; Chuai, X.W. Carbon sinks/sources? Spatiotemporal evolution in China and its response to built-up land expansion. J. Environ. Manag. 2022, 321, 115863. [Google Scholar] [CrossRef]
  80. Fu, J.Y.; Wang, W.G.; Zaitchik, B.; Nie, W.S.; Fei, E.X.; Miller, S.M.; Harman, C.J. Critical Role of Irrigation Efficiency for Cropland Expansion in Western China Arid Agroecosystems. Earths Future 2022, 10, e2022EF002955. [Google Scholar] [CrossRef]
  81. Liu, H.C.; Fan, J.; Liu, B.Y.; Wang, L.; Qiao, Q. Practical Exploration of Ecological Restoration and Management of the Mountains-Rivers-Forests-Farmlands-Lakes-Grasslands System in the Irtysh River Basin in Altay, Xinjiang. J. Resour. Ecol. 2021, 12, 766–776. [Google Scholar]
  82. Yu, T.; Jiapaer, G.; Long, G.; Li, X.; Jing, J.Y.; Liu, Y.; De Maeyer, P.; Van de Voorde, T. Interannual and seasonal relationships between photosynthesis and summer soil moisture in the Ili River basin, Xinjiang, 2000–2018. Sci. Total Environ. 2022, 856 Pt 2, 159191. [Google Scholar] [CrossRef] [PubMed]
  83. Yan, J.J.; Liu, H.J.; Cui, D.; Chen, C. Spatiotemporal dynamics of grassland degradation in Yili Valley of Xinjiang over the last 15 years. Pratacultural Sci. 2018, 35, 508–520. [Google Scholar]
  84. Houghton, R.A. Keeping management effects separate from environmental effects in terrestrial carbon accounting. Glob. Chang. Biol. 2013, 19, 2609–2612. [Google Scholar] [CrossRef]
  85. Li, W.; MacBean, N.; Ciais, P.; Defourny, P.; Lamarche, C.; Bontemps, S.; Houghton, R.A.; Peng, S.S. Gross and net land cover changes in the main plant functional types derived from the annual ESA CCI land cover maps (1992–2015). Earth Syst. Sci. Data 2018, 10, 219–234. [Google Scholar] [CrossRef]
  86. Yan, J.J.; Zhang, G.P.; Ling, H.B.; Han, F.F. Comparison of time-integrated NDVI and annual maximum NDVI for assessing grassland dynamics. Ecol. Indic. 2022, 136, 108611. [Google Scholar] [CrossRef]
  87. Hao, D.; Bisht, G.; Huang, M.; Ma, P.-L.; Tesfa, T.; Lee, W.-L.; Gu, Y.; Leung, L.R. Impacts of Sub-Grid Topographic Representations on Surface Energy Balance and Boundary Conditions in the E3SM Land Model: A Case Study in Sierra Nevada. J. Adv. Model. Earth Syst. 2022, 14, e2021MS002862. [Google Scholar] [CrossRef]
  88. Bair, E.H.; Stillinger, T.; Dozier, J. Snow Property Inversion From Remote Sensing (SPIReS): A Generalized Multispectral Unmixing Approach With Examples From MODIS and Landsat 8 OLI. IEEE Trans. Geosci. Remote Sens. 2021, 59, 7270–7284. [Google Scholar] [CrossRef]
  89. Tesfa, T.K.; Leung, L.R.; Ghan, S.J. Exploring Topography-Based Methods for Downscaling Subgrid Precipitation for Use in Earth System Models. J. Geophys. Res. Atmos. 2020, 125, e2019JD031456. [Google Scholar] [CrossRef]
  90. Xie, X.; Li, A.; Tian, J.; Wu, C.; Jin, H. A fine spatial resolution estimation scheme for large-scale gross primary productivity (GPP) in mountain ecosystems by integrating an eco-hydrological model with the combination of linear and non-linear downscaling processes. J. Hydrol. 2023, 616, 128833. [Google Scholar] [CrossRef]
Figure 1. Map of the ARNWC.
Remotesensing 15 02471 g001
Figure 2. Validation of NPP estimation results. In which ** indicates that the p-value is less than 0.01.
Remotesensing 15 02471 g002
Figure 3. Land cover change in the ARNWC from 2001 to 2018. (a) Areas where no land cover changed; (b) areas where land cover change has occurred. The codes for the different land cover type conversions represented in the legend can be found in Table 6.
Remotesensing 15 02471 g003
Figure 4. Average NEP of vegetation in the ARNWC from 2001–2018. Subfigures (ad,f) are displayed by raster, with the color of the raster representing its value. subfigure (e) shows the urban areas, due to their relative small proportion compared to the study area, and therefore uses dots to represent the corresponding raster, with the color of the dots indicating the value of the corresponding raster.
Remotesensing 15 02471 g004
Figure 5. NEP slope of vegetation in the ARNWC from 2001–2018. Subfigures (ad,f) are displayed by raster, with the color of the raster representing its value. subfigure (e) shows the urban areas, due to their relative small proportion compared to the study area, and therefore uses dots to represent the corresponding raster, with the color of the dots indicating the value of the corresponding raster.
Remotesensing 15 02471 g005
Figure 6. Total and average NEP in the ARNWC in 2001 and 2018. (a) Areas with unchanged land cover types; (b) areas of land cover type change.
Remotesensing 15 02471 g006
Figure 7. Changes in NEP in the context of expansion of different land cover types. The codes for the different land cover type conversions represented in the legend can be found in Table 6.
Remotesensing 15 02471 g007
Figure 8. Linear trends of the results from two modeling scenarios for land cover change affecting vegetation carbon sources/sinks in the ARNWC from 2001–2018. (a) L1 trend (dynamic land cover type, other factors remain fixed); (b) L2 trend (dynamic land cover type, NDVI, EVI, other factors remain fixed); (c) annual total NEP for L1; (d) annual total NEP for L2.
Remotesensing 15 02471 g008
Figure 9. Annual variation in average precipitation during the growing season (May–October) in ARNWC.
Remotesensing 15 02471 g009
Figure 10. Distribution of vegetation carbon sources/sinks along the elevation gradient in ARNWC. (a) the number of grids for carbon sinks or sources contained within different elevation ranges (b) the red dotted line is the dividing line where NEP is zero; the line representing the annual average NEP value above the red line denotes a carbon sink, and those below the red line denote a carbon source.
Remotesensing 15 02471 g010
Table 1. The dataset in this study.
GroupParameterData SourcePeriodSpatial
Resolution
Temporal
Resolution
VegetationLand coverEuropean Space Agency1992–2020300 mYearly
NDVIMODIS MOD13Q12000–2022250 m16-day
EVIMODIS MOD13Q12000–2022250 m16-day
ClimateTemperature [41]National Earth System Science Data Center1901–21001 kmMonthly
Precipitation [41]National Earth System Science Data Center1901–21001 kmMonthly
Surface solar radiation [42]National Tibetan Plateau Data Center1983–20180.1° (~10 km)Monthly
Evapotranspiration [43]Terra Climate1958–20211/24° (~4 km)Monthly
Potential evapotranspiration [43]Terra Climate1958–20211/24° (~4 km)Monthly
BoundaryStudy area boundaryNational Cryosphere Desert Data Center
Table 2. εmax selected for different land cover types in the ARNWC (unit: g C/MJ).
CroplandForestlandGrasslandUrban AreasBare Areas
εmax0.6040.7740.3800.2020.301
In this table, εmax is the maximum light use efficiency under ideal conditions (g C/MJ).
Table 3. Modeling scenarios design for this study.
GroupScenarioLand Cover TypeNDVI/EVIRadTemWSIPre
land cover changeL1
L2
land cover change and Climate ChangeLC1
LC2
LC3
In this table, solid triangles (▲) indicate that the input variable changed continuously from 2001 to 2018, and hollow triangles (△) indicate that the input variable was fixed at the 2001 level. Rad indicates radiation, Tem indicates temperature, WSI indicates the ratio of ET to PET, and Pre indicates precipitation.
Table 4. Area of each land cover type in the ARNWC during 2001–2018 (unit: km2).
YearCroplandForestlandGrasslandUrban AreasBare Areas
2001137,764.517,148.25451,596.5730.251,448,575
Percentage6.70%0.83%21.97%0.04%70.46%
2018152,862.2519,332.25455,680.752615.251,425,324
Percentage7.44%0.94%22.17%0.13%69.33%
change15,097.7521844084.251885−23,251
Percentage10.96%12.74%0.90%258.13%−1.61%
Table 5. The land use transfer matrix for the ARNWC during 2001–2018 (unit: km2).
FromTo
CroplandForestlandGrasslandUrban AreasBare Areas
Cropland133,151.75339.502433.001083.75756.50
96.65%0.25%1.77%0.79%0.55%
Forestland150.0016,635.00318.501.0043.75
0.87%97.01%1.86%0.01%0.26%
Grassland6332.502328.50434,464.00556.757914.75
1.40%0.52%96.21%0.12%1.75%
Urban areas0.000.000.00730.250.00
0.00%0.00%0.00%100.00%0.00%
Bare areas13,228.0029.2518,465.25243.501,416,609.00
0.91%0.00%1.27%0.02%97.79%
Table 6. Codes for interannual land cover type conversions.
Cropland to Forestland (12)Cropland to Grassland (13)Cropland to Urban Areas (14)Cropland to Bare Areas (15)
Forestland to Cropland (21)Forestland to Grassland (23)Forestland to Urban areas (24)Forestland to Bare areas (25)
Grassland to Cropland (31)Grassland to Forestland (32)Grassland to Urban areas (34)Grassland to Bare areas (35)
Bare areas to Cropland (51)Bare areas to Forestland (52)Bare areas to Grassland (53)Bare areas to Urban areas (54)
Table 7. Total and average NEP in 2001 and 2018 in the ARNWC.
TypeCroplandForestlandGrasslandUrban AreasBare AreasTotal
Total NEP (Tg C)
200124.646.6923.500.0318.8273.68
201833.007.2425.860.1118.8585.06
Change8.360.552.360.080.0311.38
Percentage33.93%8.22%10.04%266.67%0.16%15.45%
Average NEP (g C m−2 a−1)
2001178.87389.8652.0338.9412.9935.84
2018215.85374.2556.7543.1513.2341.37
Change36.98−15.614.724.210.245.53
Percentage20.67%−4.00%9.07%10.81%1.85%15.43%
Table 8. Total NEP for 2001 and 2018 under different scenario designs.
TypeCroplandForestlandGrasslandUrban AreasBare AreasTotal
Total NEP for LC1 (Tg C)
200124.646.6923.500.0318.8273.68
201833.007.2425.860.1118.8585.06
Change8.360.552.360.080.0311.38
Total NEP for L1 (Tg C)
201826.047.6123.060.1118.6375.45
Change1.400.92−0.440.08−0.191.77
Percentage for LC116.75%167.27%−18.64%100.00%−633.33%15.55%
Total NEP for L2 (Tg C)
201833.307.7926.990.1220.2388.43
Change8.661.103.490.091.4114.75
Percentage for LC1103.59%200.00%147.88%112.50%4700.00%129.61%
Disclaimer/Publisher’s Note: The statements, opinions and data contained in all publications are solely those of the individual author(s) and contributor(s) and not of MDPI and/or the editor(s). MDPI and/or the editor(s) disclaim responsibility for any injury to people or property resulting from any ideas, methods, instructions or products referred to in the content.

