Article

Coupled Coordination Analysis between Urbanization and Eco-Environment in Ecologically Fragile Areas: A Case Study of Northwestern Sichuan, Southwest China

1
Chengdu Institute of Biology, Chinese Academy of Sciences, Chengdu 610041, China
2
University of Chinese Academy of Sciences, Beijing 100049, China
*
Author to whom correspondence should be addressed.
Remote Sens. 2023, 15(6), 1661; https://doi.org/10.3390/rs15061661
Submission received: 18 January 2023 / Revised: 14 March 2023 / Accepted: 16 March 2023 / Published: 19 March 2023
(This article belongs to the Special Issue Remote Sensing of Interaction between Human and Natural Ecosystem)

Abstract

:
In China, rapid urbanization in recent decades has led to increasingly serious ecological and environmental problems, threatening sustainable development. Thus, a clear understanding of the relationship between urbanization and eco-environment is the basis for achieving regional sustainable development. However, despite the current global explosion of research interests on this topic, few studies have focused on ecologically fragile areas. To fill this gap, taking Aba Autonomous Prefecture in the eastern Qinghai-Tibet Plateau as a case study, we explored the relationship between urbanization and eco-environment from 2001 to 2018 using a coupled coordination degree model. The results show that the urbanization level and eco-environmental quality in Aba Prefecture achieved stable and continuous improvements from 0.202 to 0.428 and 0.372 to 0.422, respectively. Moreover, the coupling degree between them ranged from 0.524 to 0.652, indicating that the study area had transformed from uncoordinated development in the initial stage to transformation development in the final stage. Additionally, over the 18 years, the coordinated state of urbanization and eco-environment improved, with the coordinated level increasing from reluctant to moderate coordination after 2011. Lastly, we confirmed that urbanization in Aba Prefecture had an overall positive effect on the local eco-environment, although it gradually decreased as urbanization progressed. These findings have important implications for political decision-makers to achieve high-quality development in ecologically fragile areas.

1. Introduction

Urbanization is the process of economic and social development resulting from spatial expansion of built-up areas and rural to urban population transformation [1]. It has been a defining global phenomenon and is an important driver of social modernization and economic growth [2,3,4]. Urbanization is considered to be an inevitable trend in human social development [5], and its sustainability is significant in the implementation of the 2030 agenda and Sustainable Development Goals (SDGs). Gradual urbanization has been occurring globally, and is expected to increase from 56% in 2020 to 70% in 2050 [6]. Simultaneously, urbanized areas have also undergone a series of ecological and environmental problems, including land degradation [7], urban heat island effects [8], depletion of natural resources [9,10], soil erosion [11], and damage to ecosystem services [12,13]. These problems have posed a major challenge to achieving sustainable development goals [14]. Therefore, understanding the relationship between urbanization and eco-environment is fundamental for enhancing regional sustainability [15], and related research has become a global strategic issue and a hot spot in earth system and sustainability science [16].
In light of the complex relationship between urbanization and eco-environment [16,17], researchers have typically used the Environmental Kuznets Curve (EKC) or the Urbanization-environmental Kuznets Curve (UEKC) to address the U-shaped relationship between urbanization development and eco-environmental status [18,19], which implies that environmental quality initially deteriorates with urbanization, but subsequently improves with increasing development. Currently, scholars have recognized that complex interactions between urbanization and eco-environment exist, and both the EKC and UEKC approaches are not applicable to all regions, although they are appropriate for developed urban agglomerations [20]. Moreover, another shortcoming of these approaches is that they ignore interactions between urbanization process and the eco-environment [21]. To overcome these limitations, the Coupling Coordination Degree (CCD) model was proposed to explore relationships between urbanization and eco-environment [9,22,23]. Compared to EKC/UEKC, the CCD model appears more suitable to describe interactions of two or more subsystems [23,24,25].
Despite a growing number of studies focusing on the interaction between urbanization and eco-environment across various scales and regions, there are still some limitations in previous research. First, most studies focus on urban developed areas, while less attention is paid to ecologically fragile areas [26,27], particularly not being able to reveal the universal mechanism of this interaction. Second, even for the few relevant studies conducted in ecologically fragile regions, there are deficiencies, especially in the construction of eco-environmental indicator systems. For instance, these studies usually employed the parameters reflecting vegetation characteristics, such as vegetation cover [28], land use type [29] or ecosystem service [30]. Nevertheless, the indicators reflecting the human pressure, such as the number of livestock, which are especially crucial in pastoral regions, are basically not covered. Besides, in terms of analysis, more studies have focused on the coupling relationship between urbanization and eco-environment [27,29], but not considered their quantified impacts on each other.
As the worlds ‘third pole’, the Qinghai–Tibetan Plateau (QTP) is one of the most unique regions on the planet [31]. As the Yellow, Mekong, and Yangtze rivers are sourced from here, it is deemed to be Asia’s “water tower”. Moreover, QTP is also an important ecological shield area in China for its abundant natural resources and crucial ecosystems [32]. Since an extensive Western Development Strategy was launched by the Chinese government in 2000, urbanization in the QTP has accelerated rapidly [33,34]. For example, urbanization rate in Qinghai Province reached 60.08% in 2020, and in the Tibet Autonomous Region it was 35.73%, increasing 41.56 and 24.23 percentage points since 1978, respectively. Urbanization has become a significant mechanism for QTP’s economic and social development, by promoting economic growth, reducing numbers of people in poverty, and improving social living standards [35]. However, it has also caused many localized ecological and environmental problems due to intense human activities, ecosystem degradation, and ecological space reduction [36]. For instance, city expansion and infrastructure construction have replaced a large area of forest and grassland on the QTP [12]. Meanwhile, to support increased consumption caused by rapid urbanization, herding and harvesting intensity has been enhanced, resulting in grassland degradation, deforestation, and desertification [37]. Moreover, rapid urbanization has contributed to an increase in anthropogenic pollution, influencing eco-environment quality [38].
Conversely on the QTP, carrying capacity is also a limiting factor for urbanization development, and eco-environment constraints on urbanization are also expected to be more prominent [31]. For instance, social and economic activities are constrained by eco-environment, especially water and calorific condition [37]. Additionally, frequent natural disasters and geomorphic features significantly affect infrastructure construction, which has inevitably restricted urbanization development [39]. Predictably, the future QTP urbanization process will continue unabated, and one key question is how it will interact with the eco-environment in different geographical areas. Nevertheless, to the best of our knowledge, few studies have addressed the interactions between urbanization and eco-environment on the QTP, and their coupled relationships are poorly understood. Meanwhile, in ecologically fragile and predominantly grazed regions such as the QTP, the application of new technologies may mitigate environmental destruction during early urbanization stages [40], and may accelerate environmental restoration during later stages [41]. Moreover, ecological degradation and environmental destruction tend to be limited to towns and surrounding areas, because urbanization tends to concentrate pastoral settlement [42]. Thus, on the regional scale, eco-environmental quality may be optimized with urbanization development. Therefore, we hypothesized that on the QTP, urbanization will be more beneficial to the eco-environment than in other regions.
To fill the research gap and test our hypothesis, we gathered information on the coupled mechanism of urbanization and eco-environment in the eastern QTP in southwest China. Specifically, three scientific objectives were addressed, including to: (1) reveal urbanization spatiotemporal characteristics and eco-environmental status from 2001 to 2018, (2) evaluate dynamic trends present in the coupling degree between urbanization and eco-environment at the county scale, and (3) explore the evolution trends of coupling coordinate types and interaction mechanisms between the urbanization and eco-environmental subsystems over the past 18 years. Our findings will not only improve our current understanding of the coordination of urbanization development and eco-environmental protection, but also help to design better policies to mitigate potential eco-environmental risks due to accelerated urbanization development, thereby contributing to optimal adaptive and management strategies for sustainable development in ecologically fragile regions.

2. Materials and Methods
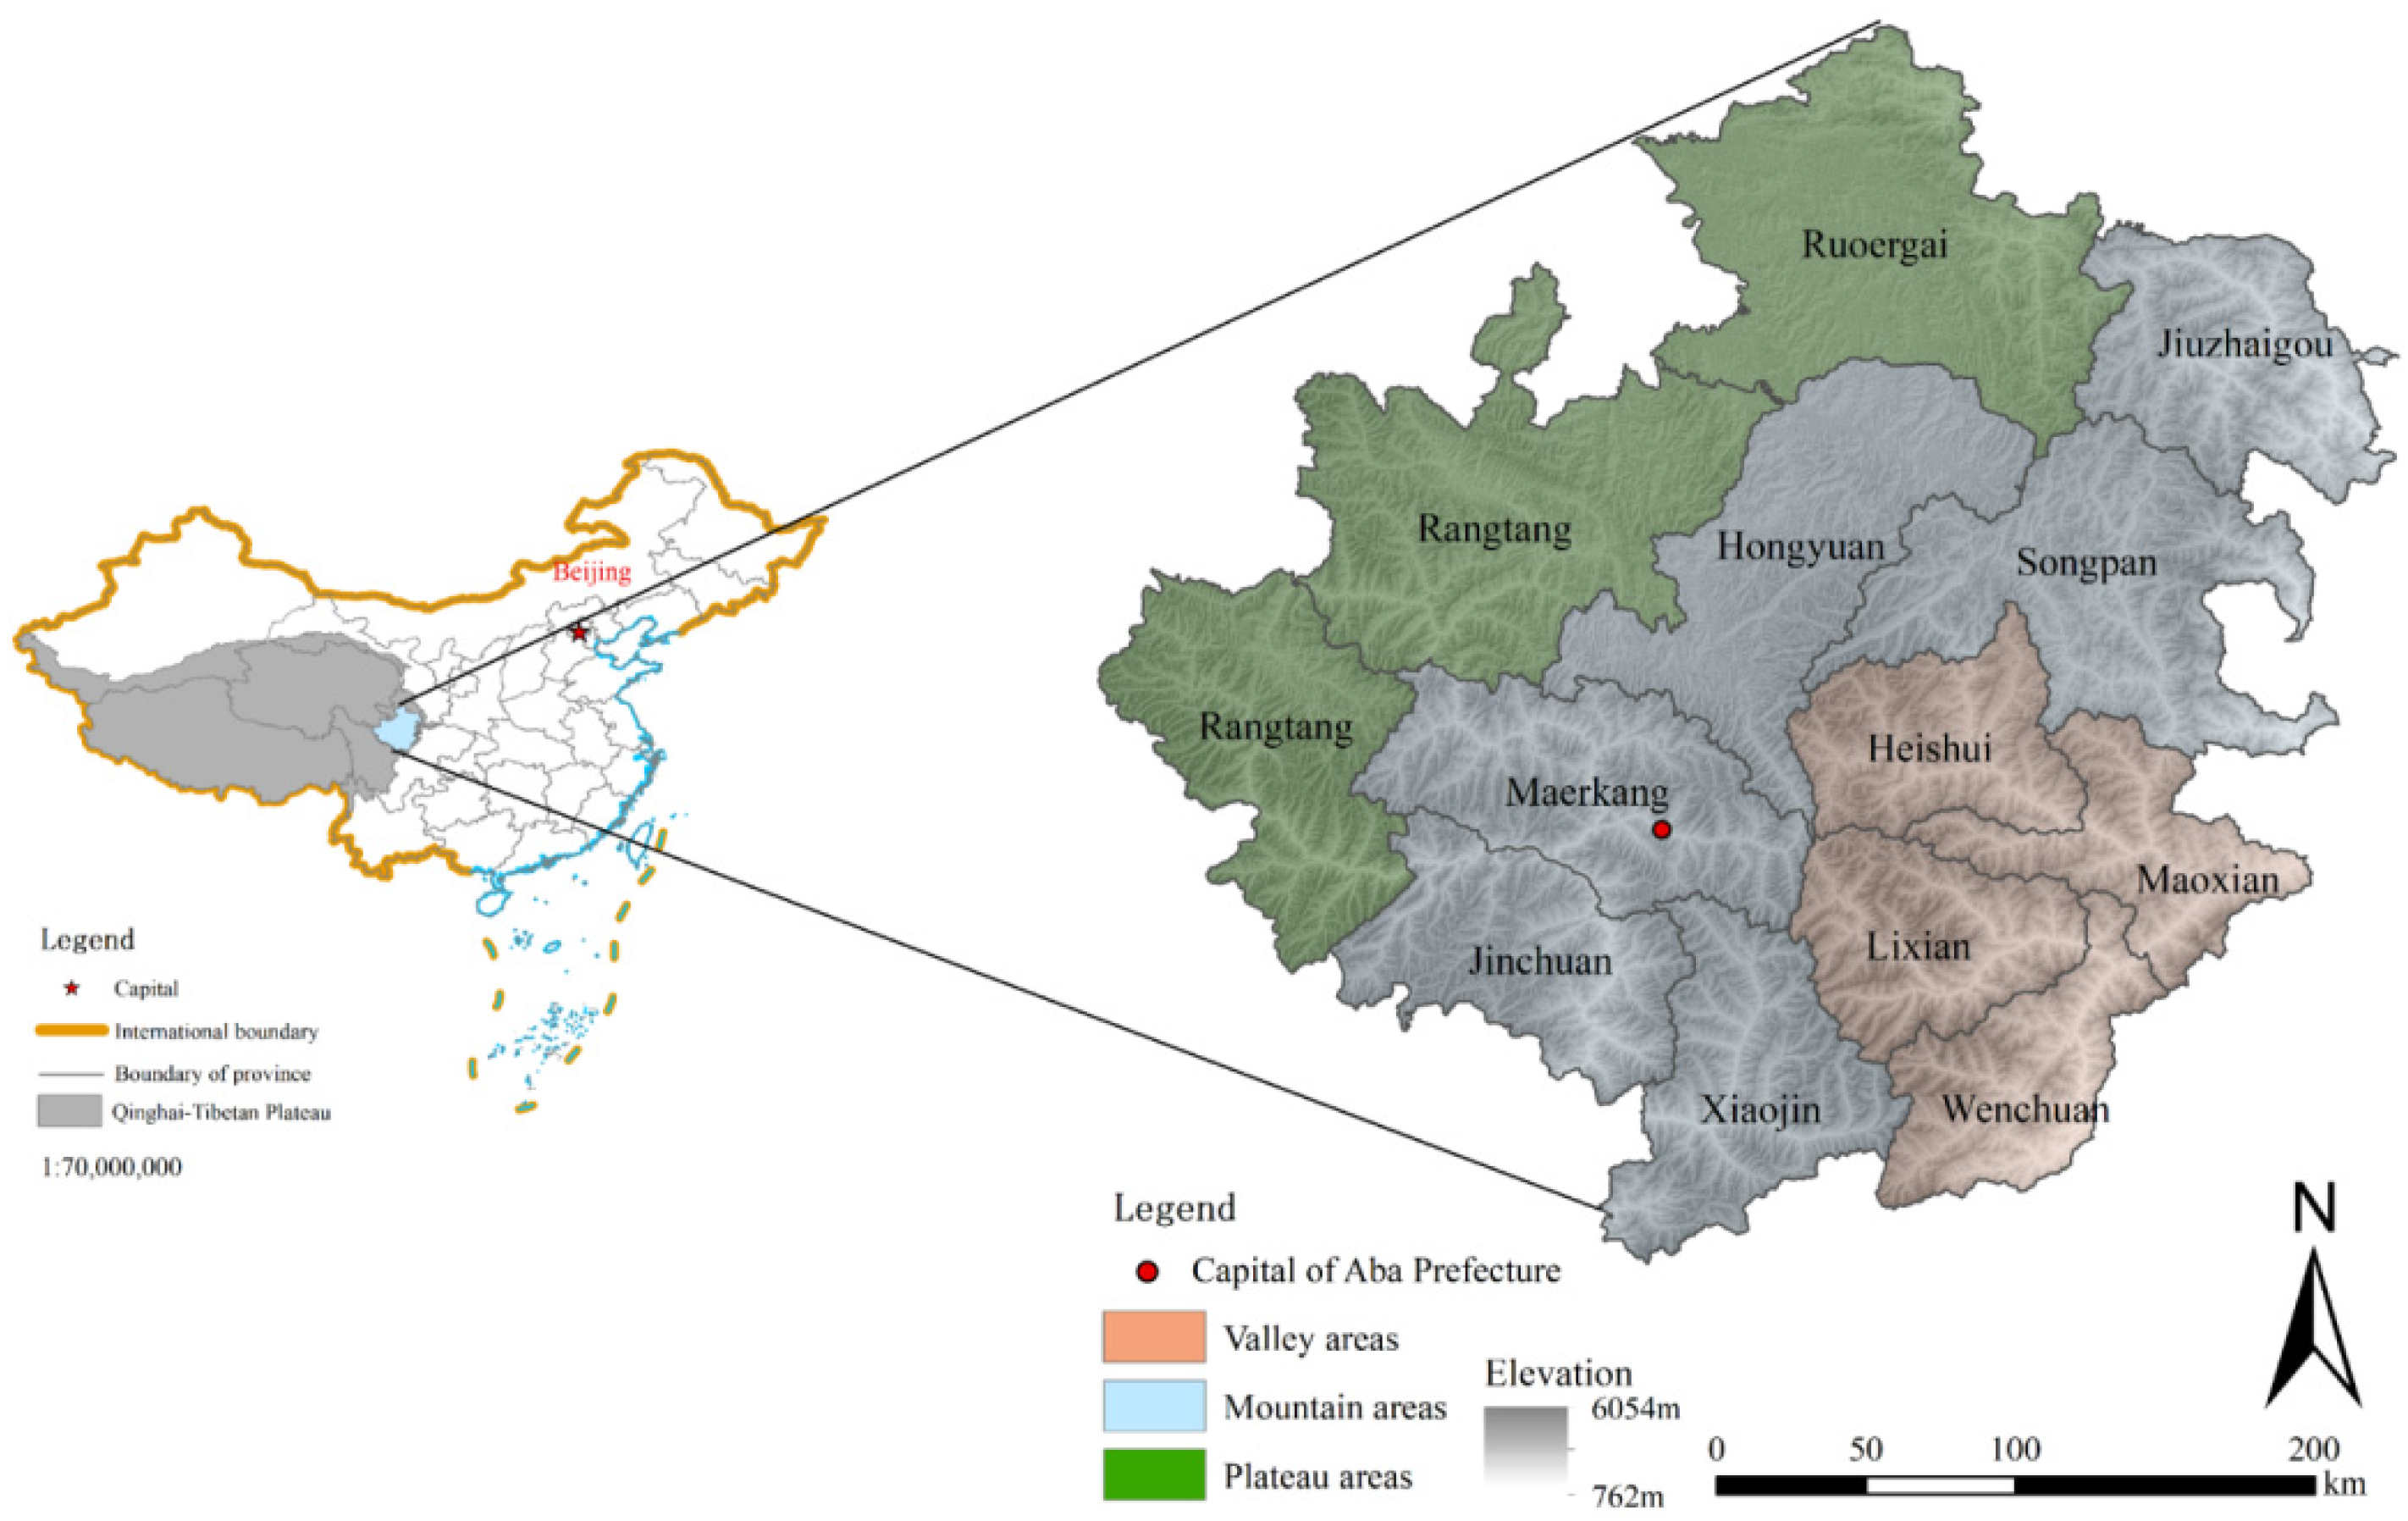
2.1. Study Areas

We selected the Aba Tibetan and Qiang Autonomous Prefectures (hereafter called Aba Prefecture) in the northwestern Sichuan province as our study areas. It falls between 30°35′~34°19′N and 100°30′~104°27′E, and is in the QTP transition zone and second step of China. As the Yangtze and Yellow Rivers originate in this area, Aba Prefecture is also a critical protection zone and ecological barrier for China [43,44].
Aba Prefecture covers 84,242 square kilometers, including 13 counties (Figure 1). It features complex geological structures, such as typical valley, mountain, and plateau landscapes. The Aba Prefecture climate reflects the vertical topography with a mean annual temperature of 8.5 °C, and mean annual precipitation of 663.5 mm. Grassland and forest are the dominant vegetation types, accounting for 53.83 and 24.2% of the total area, respectively. According to the Aba Statistical Yearbook [45], the study area can be divided into three sub-regions mainly based on complex structure and diverse landforms: valleys (including Wenchuan, Maoxian, Lixian, Heishui counties), mountains (including Songpan, Jiuzhaigou, Jinchuan, Xiaojin, Hongyuan, Maerkang counties) and plateaus (including Rangtang, Aba, Ruoergai counties).
Aba Prefecture has the second-most Tibetan and foremost Qiang residential areas in China. In 2018, it had a total population of 944,000, and a GDP of 32.5 billion CYN. From 1990 to 2018, the mean urbanization rate increased from 18.39 to 40.04%, but the urbanization level for each subregion was uneven. Specifically, in 2018, the urbanization rate for valley counties was generally >40%, for mountain counties around 30~40%, and for plateau counties < 30%.

2.2. Data Resources

Socioeconomic data were collected from the Aba Statistical Yearbook (2001–2019) and Sichuan Statistical Yearbook (2001–2019). Land use and land cover change (LUCC) data were obtained from Yang and Huang [46]. MODIS/Terra Net Primary Production data at 500 m resolution was accessed from the Google Earth Engine cloud platform (https://earthengine.google.com (accessed on 2 February 2022)). Night Time Light (NTL) data and Fractional Vegetation Coverage (FVC) data at 500 m resolution were downloaded from the National Earth System Science Data Center, National Science & Technology Infrastructure of China (http://www.geodata.cn (accessed on 10 February 2022)).

2.3. Evaluation Indicator System

2.3.1. Urbanization Evaluation

Drawing lessons from existing research and following systematic, complete, effective, and operability principles [15,23,28], we established a comprehensive urbanization evaluation system from four aspects: demographic, economic, social, and spatial (Table 1).

2.3.2. Eco-Environment Quality Evaluation

Based on evaluation system selection principles, we consulted relevant research results [15,49,50,51], considered the Aba Prefecture actual situation and data availability, and built a comprehensive evaluation system for eco-environmental quality, including three eco-environmental aspects: level, pressure, and structure (Table 2).

2.4. Methods

2.4.1. Data Standardization

Because indicator dimension and magnitude are different, the original data required standardization. Furthermore, as indicators can be positive or negative, the original data were transformed into nondimensional values using the following equations:
For positive indicators:
I i j = X i j m i n X i max X i m i n X i
For negative indicators:
I i j = max X i X i j max X i m i n X i
where i is the year, j is the indicator, Xij is the original value of the indicator j in i year, Iij is the normalized value, and m a x X i and m i n X j represent the maximum and minimum values of the indicator j in all of the years studied. In Equations (1) and (2), i = 1, 2, …, m, and j = 1, 2, …, n. All the indicator values are within the scope of 0~1 after treatment.

2.4.2. Entropy Weight

Because the evaluation systems for both urbanization level and eco-environmental quality involve many indicators, indicator weights needed to be determined. Therefore, we chose the entropy weight method to assign indicator weights, which overcomes information overlap between multiple indicator variables, thus objectively reflecting internal changes between indicators [55]. Specific steps are as follows:
(1)
calculating specific gravity:
S i j = X i j i = 1 n X i j
where Xij is the j-th indicator in i year, Sij is the ratio of Xij to the corresponding indicator, and i = 1, 2, …, m, j = 1, 2, …, n.
(2)
calculating indicator entropy:
e j = k i = 1 n S i j ln S i j ,   k = 1 ln n
where ej represents the information entropy of the j-th indicator.
(3)
calculating indicator information utility value:
g j = 1 e j
where gj represents the entropy redundancy, which measures the difference between the entropy and its maximum possible value.
(4)
calculating indicator weight:
W j = g j j = 1 p g j
where Wj is the weight of the j-th indicator.
(5)
calculating the comprehensive index:
Z q i = j = 1 n X i j W j
where Z q i is the comprehensive urbanization index (CUI) or comprehensive eco-environment index (CEI) of q region in i year.
Respective indicator weights in the urbanization and eco-environmental evaluation systems are displayed in Table 1 and Table 2, respectively.

2.4.3. CCD Model

To measure the interaction relationship between urbanization and eco-environment, coupling coordination degree (CCD) was calculated by the following formulas:
C = U × E U + E / 2 2
T = α U + β E
D = C × T
where C is the coupling degree between urbanization and eco-environment, and U and E represent the comprehensive urbanization index (CUI) and comprehensive eco-environment index (CEI), respectively. T is the coordinated development index, α and β represent the contributions of eco-environment and urbanization subsystems, and α + β = 1. In this study, the urbanization and eco-environment subsystems are assumed to be equally important, thus the weights are taken as α = β = 0.5.
The D value lies between 0 and 1, and the higher it is, the more coordinated the relationship between urbanization and eco-environment [28,56]. Consulting previous research [22], D was classified into three categories, four subcategories and twelve types based on the comparative relationship between urbanization and eco-environment (Table 3). Specifically, 0 < D ≤ 0.4 means uncoordinated and seriously unbalanced development, 0.4 < D ≤ 0.6 indicates reluctant uncoordinated development, 0.6 < D ≤ 0.7 means transformation development with moderate coordination, and 0.7 < D ≤ 1 indicates highly coordinated development.

2.4.4. GTWR Model

The geographically and temporally weighted regression (GTWR) model has demonstrated a powerful ability to handle both spatial and temporal information [57]. Compared with traditional statistical models, the GTWR model can effectively reflect the evolutionary relationship of variables in time and space [58]. Based on the GTWR model, we explored relationships and spatiotemporal differences between urbanization and the eco-environment. The GTWR model is expressed as follows:
y i j = a 0 l o n i , l a t i , t j + i k a i l o n i , l a t i , t j x i j + φ i j
where y i j is the CEI of area i in period j , a 0 l o n i , l a t i , t i is the intercept item of region i in period j , x i j is the CUI of area i in year j , a i l o n i , l a t i , t i indicates the regression estimation coefficient of CUI in area i and year j ,   φ i j is the random factor of area i in year j . The function is also suitable for cases when the dependent variable is CUI.
Combined with the spatio-temporal weight matrix, the estimated value of each regression coefficient can be obtained by using the locally weighted least squares method:
a ^ ( l o n i , l a t i , t j ) = X T W l o n i , l a t i , t j X 1 X T W l o n i , l a t i , t j Y
where W l o n i , l a t i , t j denotes the space weight matrix; X and Y represent the independent and dependent matrices respectively; X T is the transposed matrix of X . In general, the Gaussian kernel equation is used to determine the spatial weight matrix.
W l o n i , l a t i , t j = e x p d s t 2 h s t 2
d s t 2 = α [ l o n i l o n i + 1 2 + l a t i l a t i + 1 2 ] + β ( t j t j + 1 ) 2
where d s t represents the spatial and temporal distance; h s t represents the spatiotemporal bandwidth parameter, which determined by the Akaike information criterion (AIC) function; h s t = α h s = β h t , h s and h t are the spatial and temporal bandwidth parameters, respectively.

3. Results

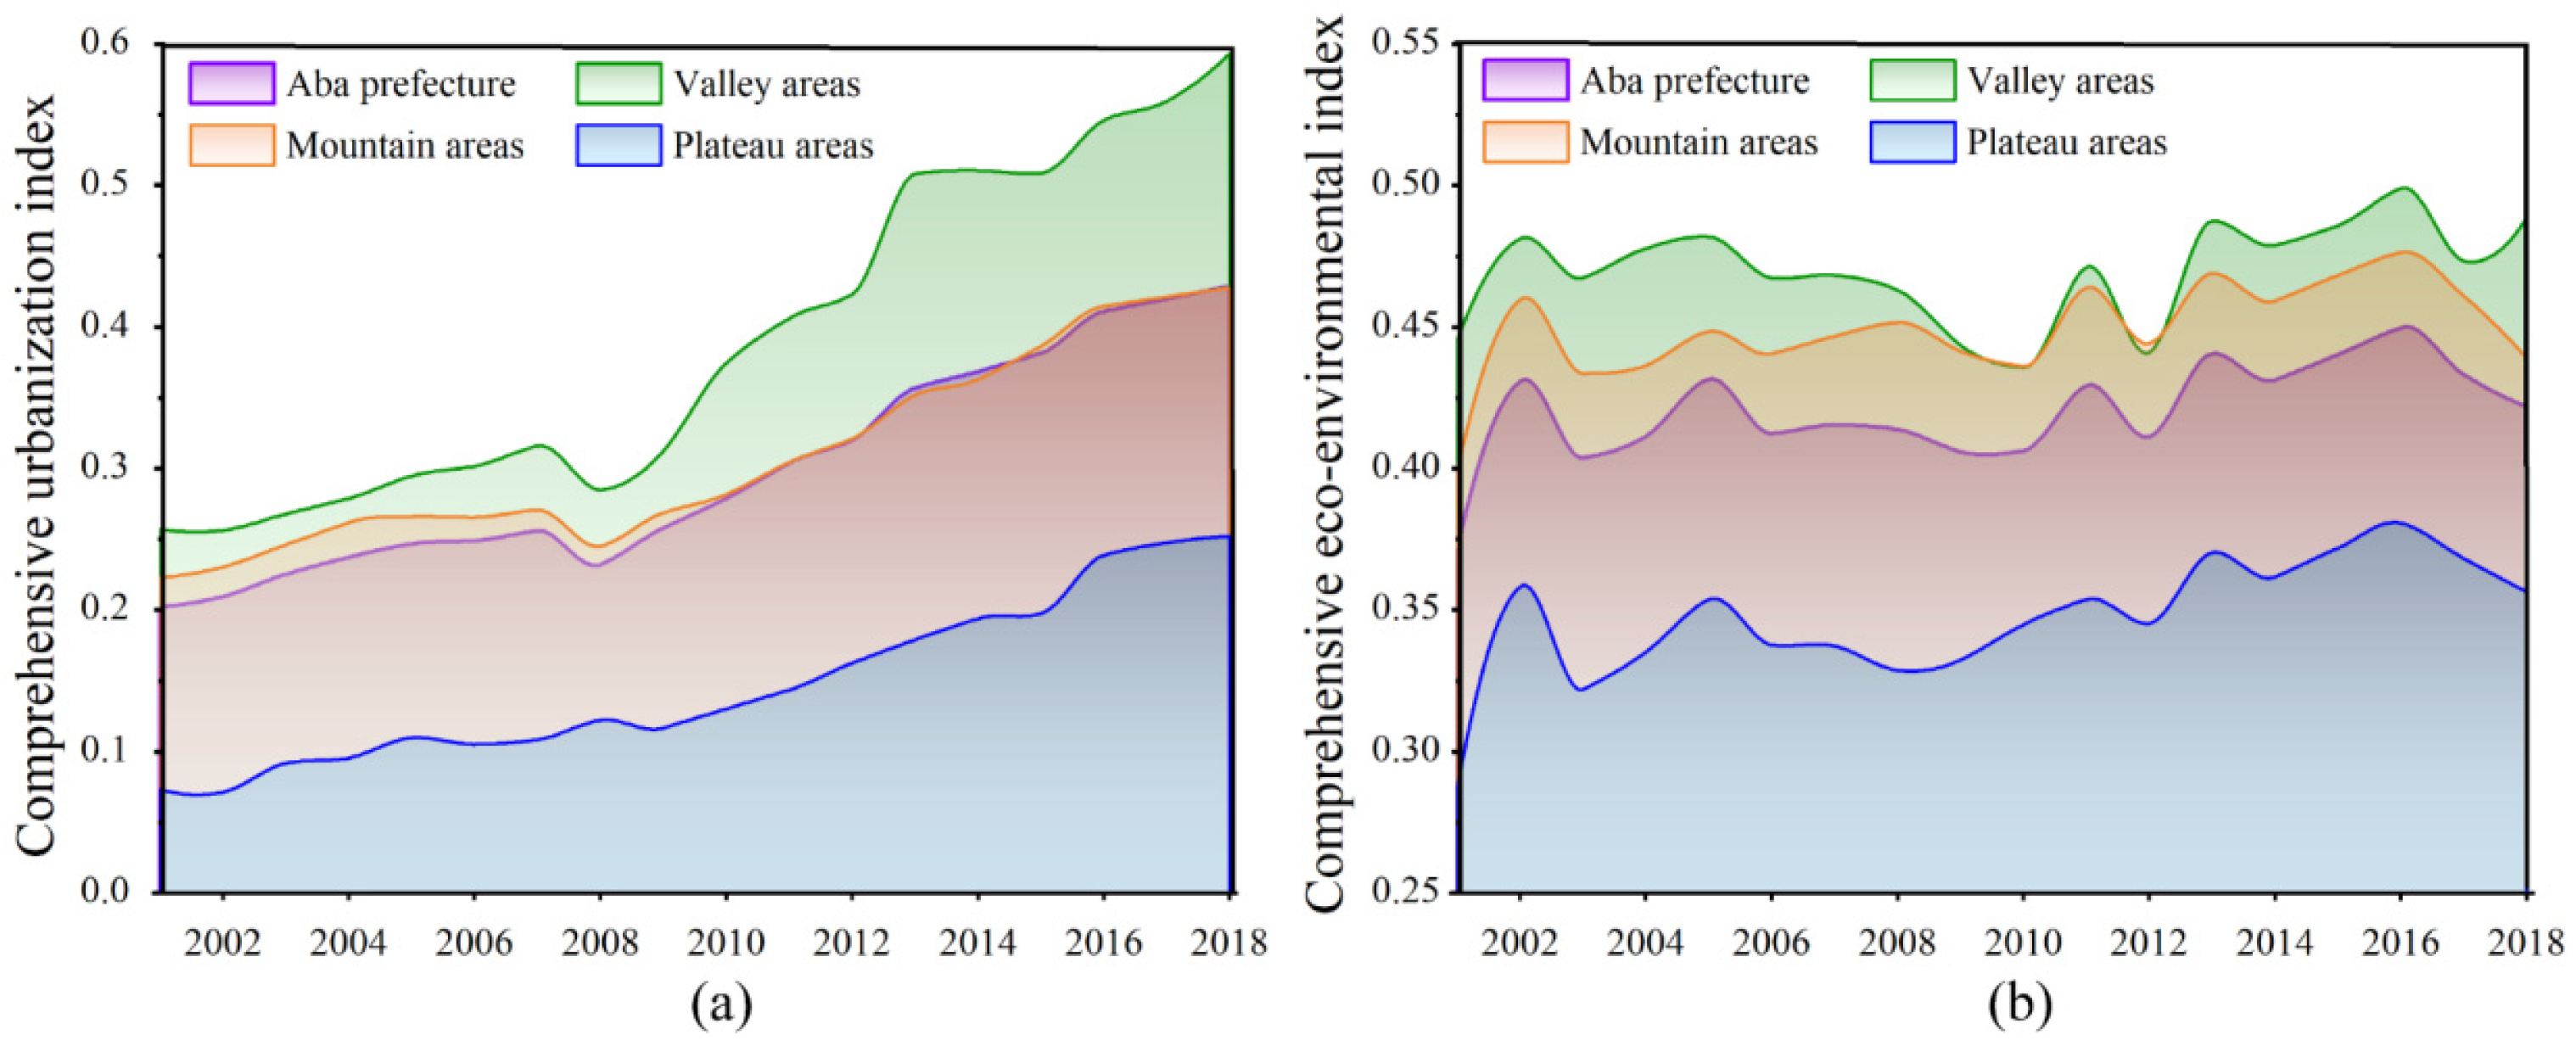
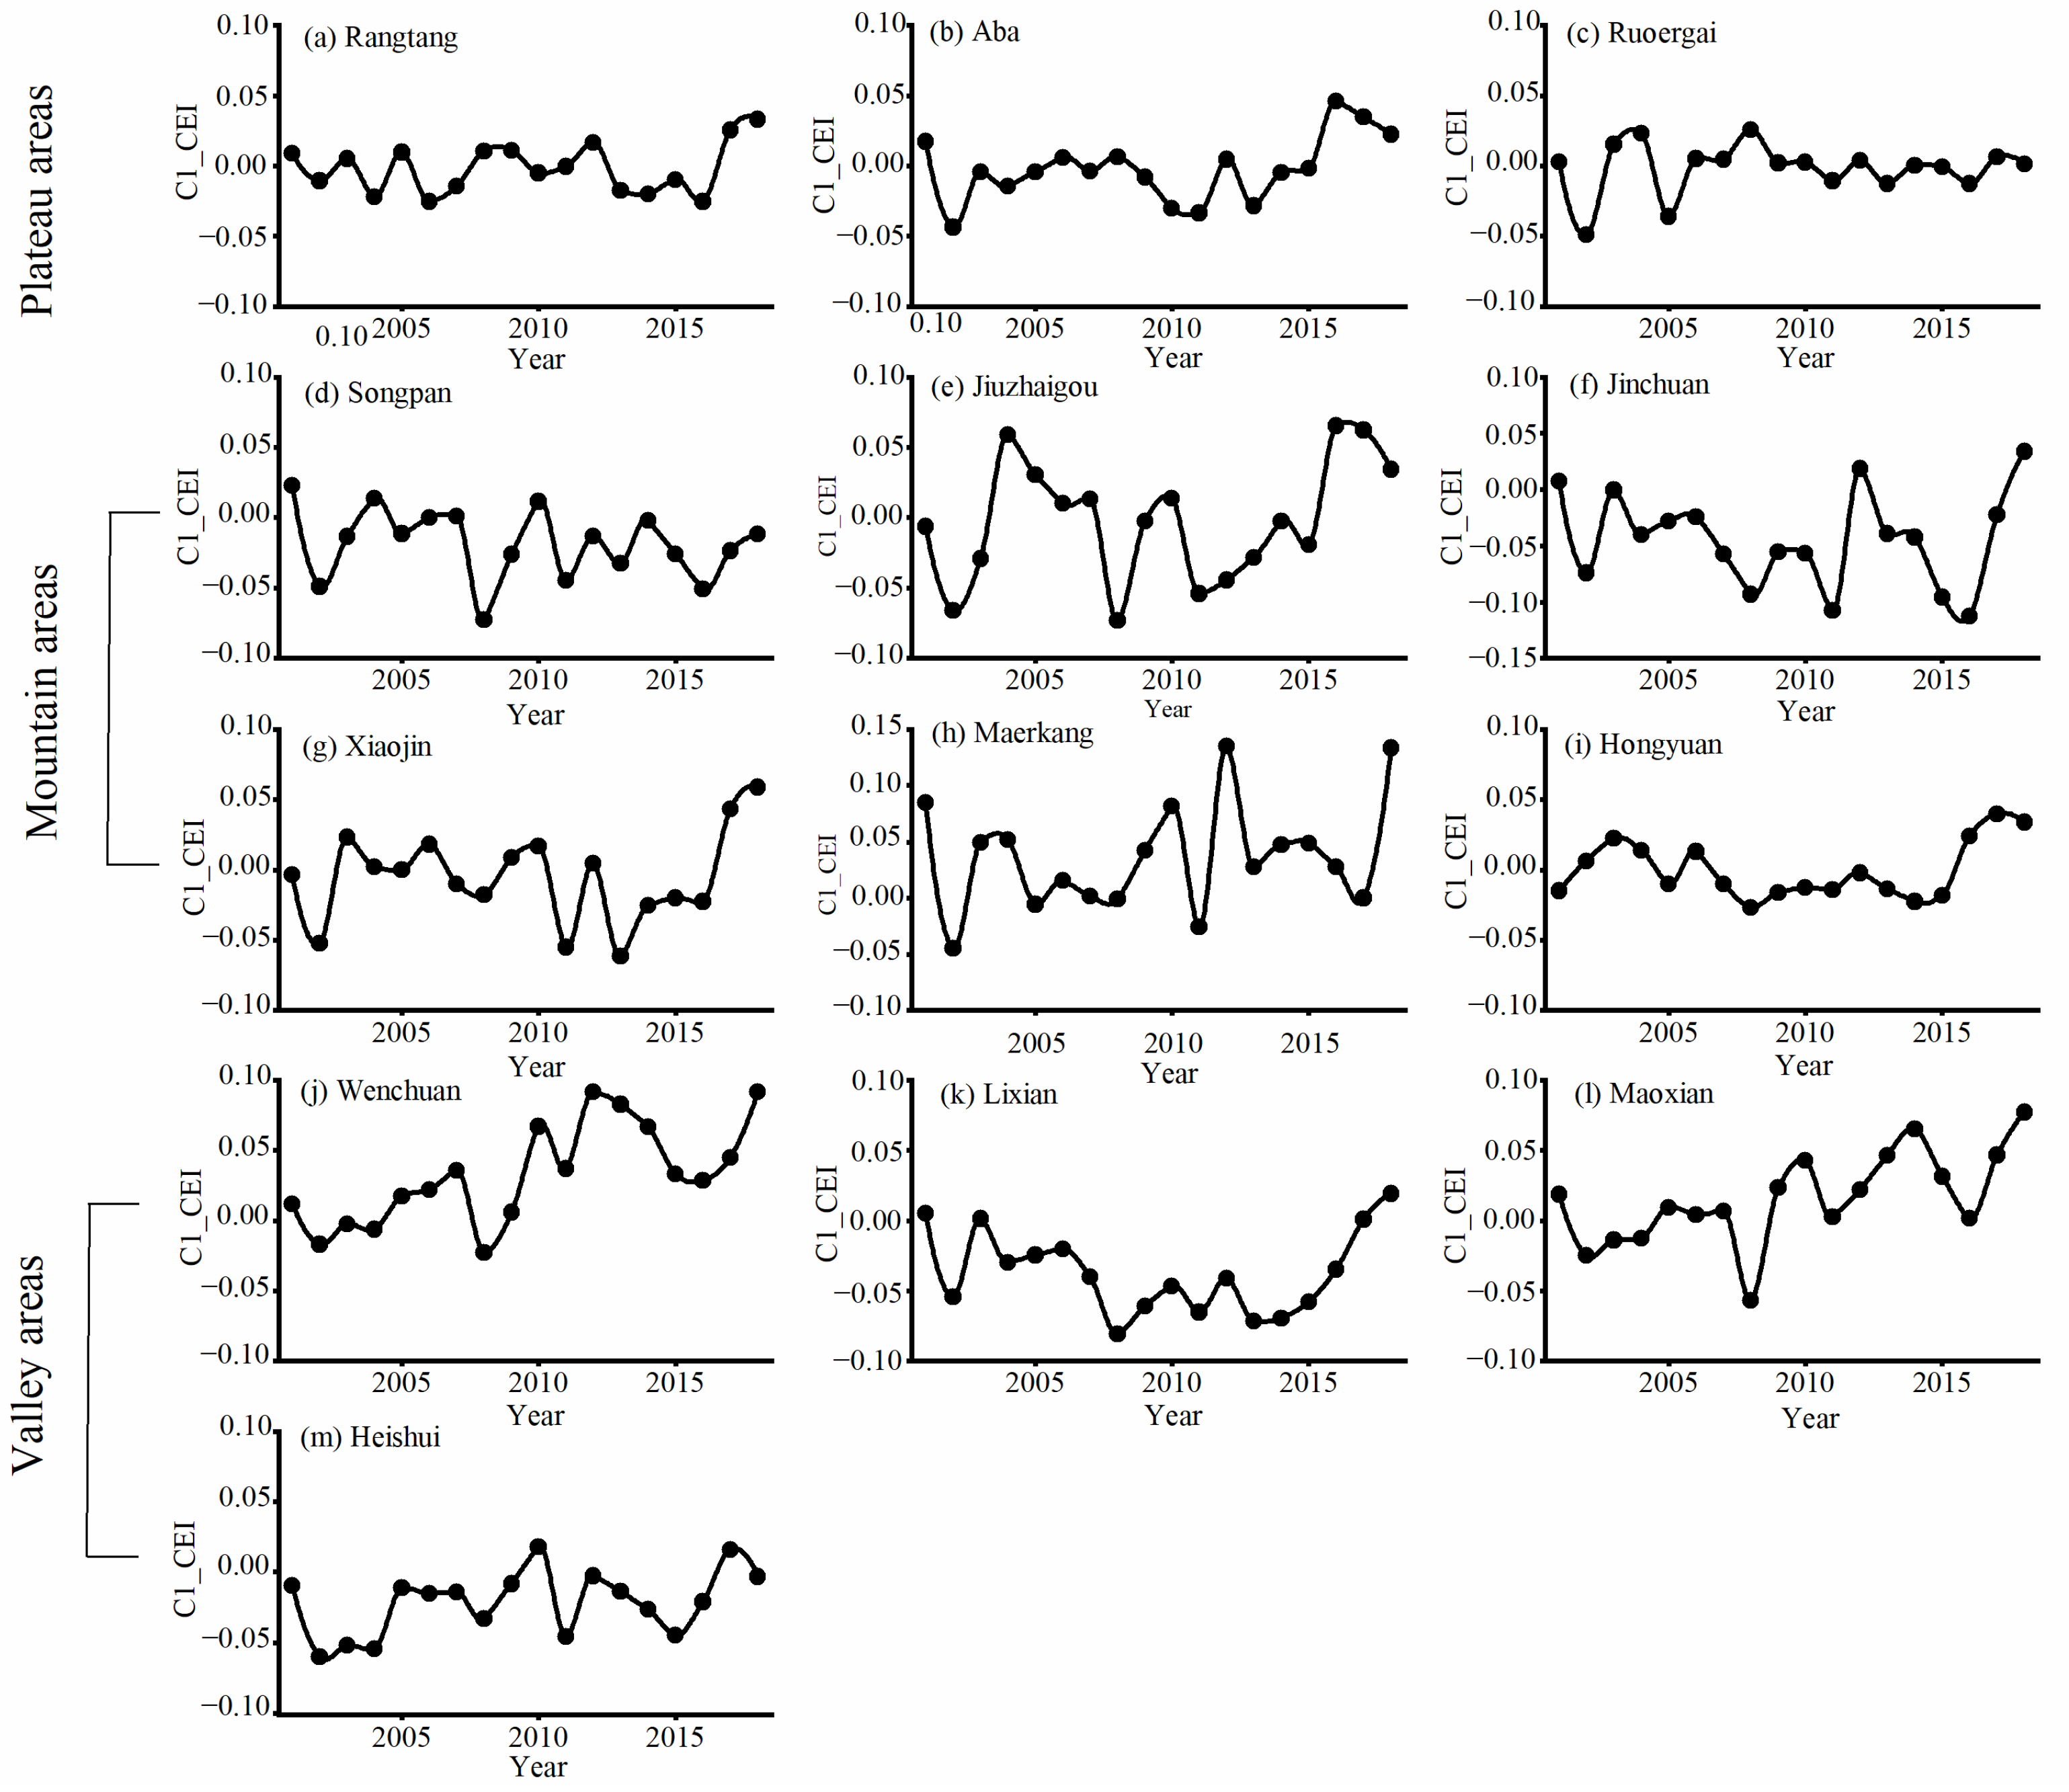
3.1. Spatio-Temporal Evolution of Urbanization and Eco-Environment

The CUI index for the entire study area improved steadily, from 0.2021 in 2001 to 0.4283 in 2018 with a growth rate of 0.126/10a, indicating that Aba prefecture urbanization level continued to increase (Figure 2a). Specifically, urbanization progressed fastest in valleys, where CUI increased from 0.2572 in the initial period to 0.5931 in the final stage with a growth rate of 0.187/10a, twice that of plateau counties. This was followed by mountain and plateau areas where CUI increased from 0.2227 to 0.4278 with a growth rate of 0.114/10a, and 0.0732 to 0.2520 with a growth rate of 0.099/10a, respectively. Meanwhile, the gap between sub-regions widened after 2008, indicating that the overall urbanization level presents an unbalanced trend.
As discussed above, regions with relatively higher rapid urbanization rates were mainly distributed in valleys, such as Wenchuan and Maoxian counties. Moreover, as an administrative center of Aba prefecture, Maerkang county is located in mountain areas and also had relatively rapid urbanization. These rapid county urbanization rates reflect their advantageous geographical locations, which have attracted a large amount of investment and increased resources. Furthermore, the CUI curve for the whole study area and for the three sub-regions maintained an increasing trend from 2001 to 2007, but declined significantly in 2008 before rapidly rising, which indicates that the 2008 Wenchuan earthquake had a major negative impact on regional urbanization development.
The overall fluctuation of eco-environmental status across sub-regions was relatively low, and the CEI change rate index varied from 0.3719 in 2001 to 0.4217 in 2018 with a growth rate of 0.028/10a, which was obviously lower than the CUI (Figure 2b). This indicates that the Aba prefecture eco-environment overall status was optimized to a certain extent over the study period. Specifically, as can be seen from Figure 2, ecological environment quality of valley areas was the highest, with an average CEI of 0.4698, followed by mountain areas (0.4485), and plateaus slightly behind (0.3469).
Additionally, both the CUI and CEI index decreased from valley areas to mountain areas then to plateau areas; CUI had relatively large, and CEI relatively small spatial variation (Figure 2).
Based on the principles of the simplest equation and optimal fitting, urbanization development level and eco-environmental quality were further fitted (Figure 3). Surprisingly, only valleys showed a U-shaped curve characterized as “slow down and quick up” (Figure 3b). Nevertheless, it is not in line with the normal “quick down and slow up” character for the coupled curve of urbanization and eco-environment [16,59]. This result indicates that eco-environmental quality decreases slowly with increasing urbanization rate initially, and begins to improve steadily after urbanization rate reaches 0.3692. However, plateaus and mountains, as well as the whole Aba Prefecture all show monotonically increasing fitted curves. Among them, the increasing trend on plateaus was the most significant (Figure 3a,c,d). Generally, the EKC hypothesis was not confirmed in Aba Prefecture. Although climatic conditions, natural resources, local development policies, and industry type are similar, urbanization rate for each sub-region was different. Therefore, we conclude that at the primary stage of the urbanization process in Aba Prefecture, eco-environmental quality was actually optimized with urbanization development, yielding a relatively higher CEI index.

3.2. Urbanization and Eco-Environment Coupling Coordination Analysis

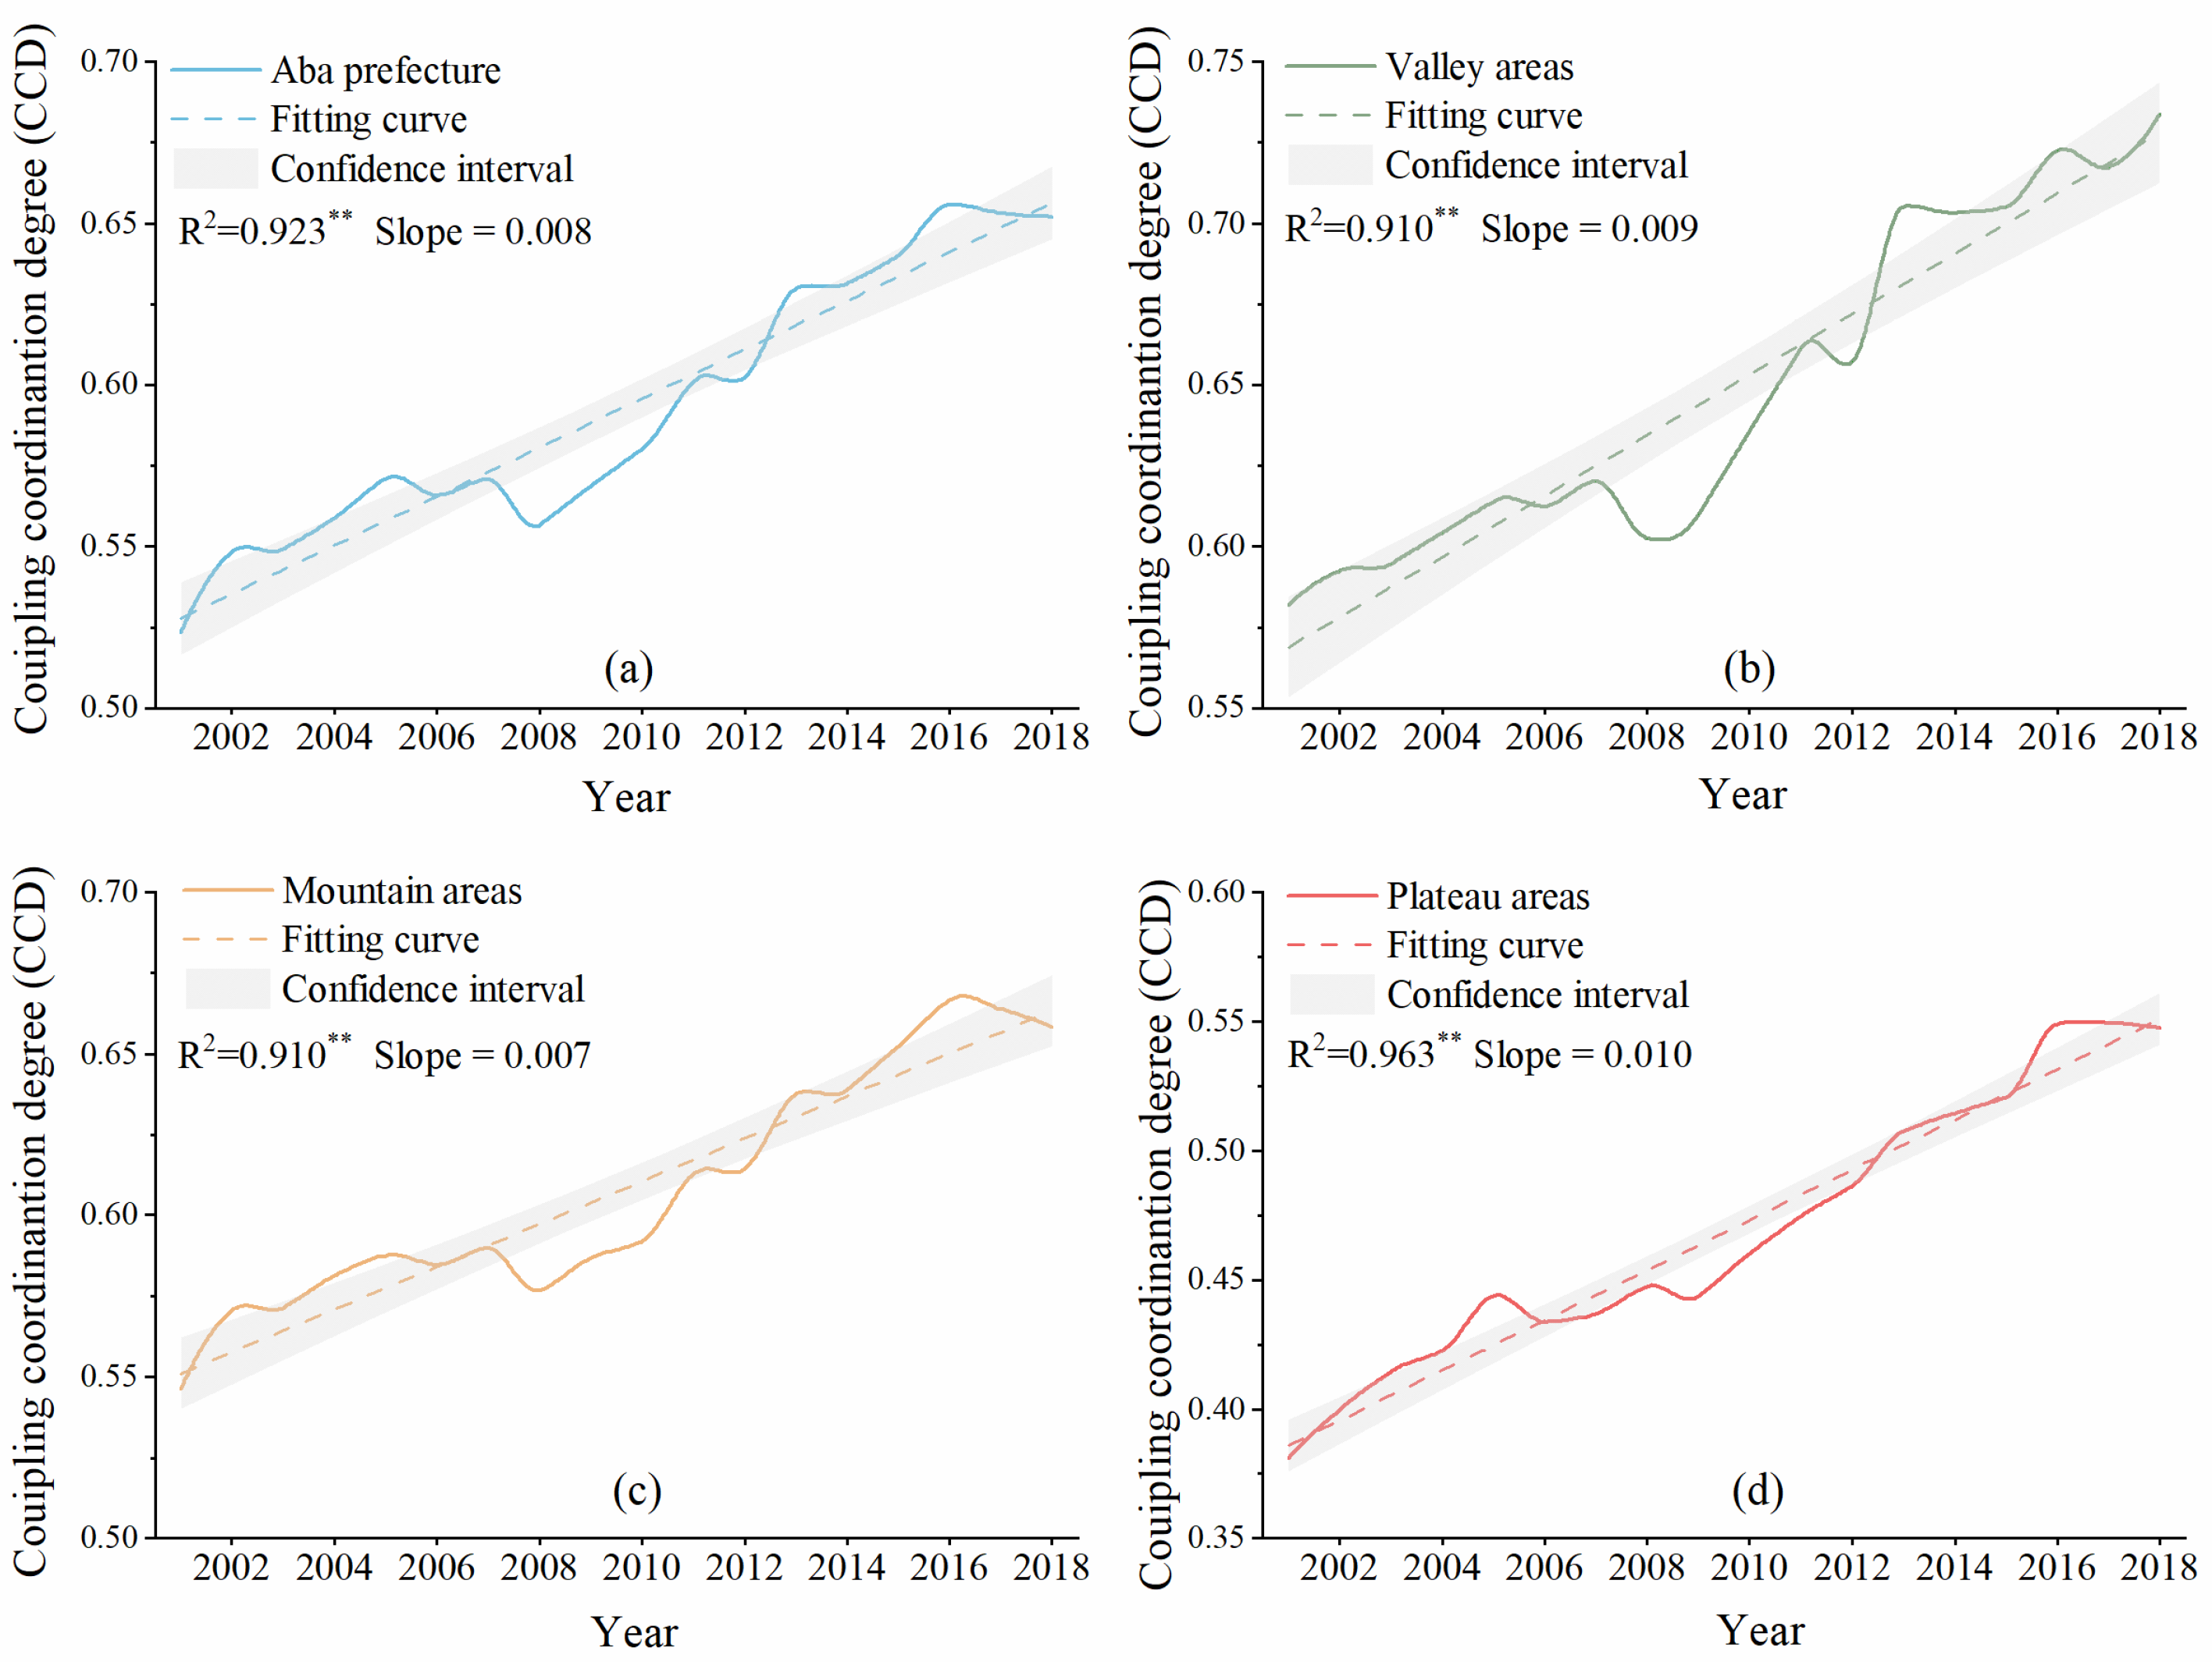
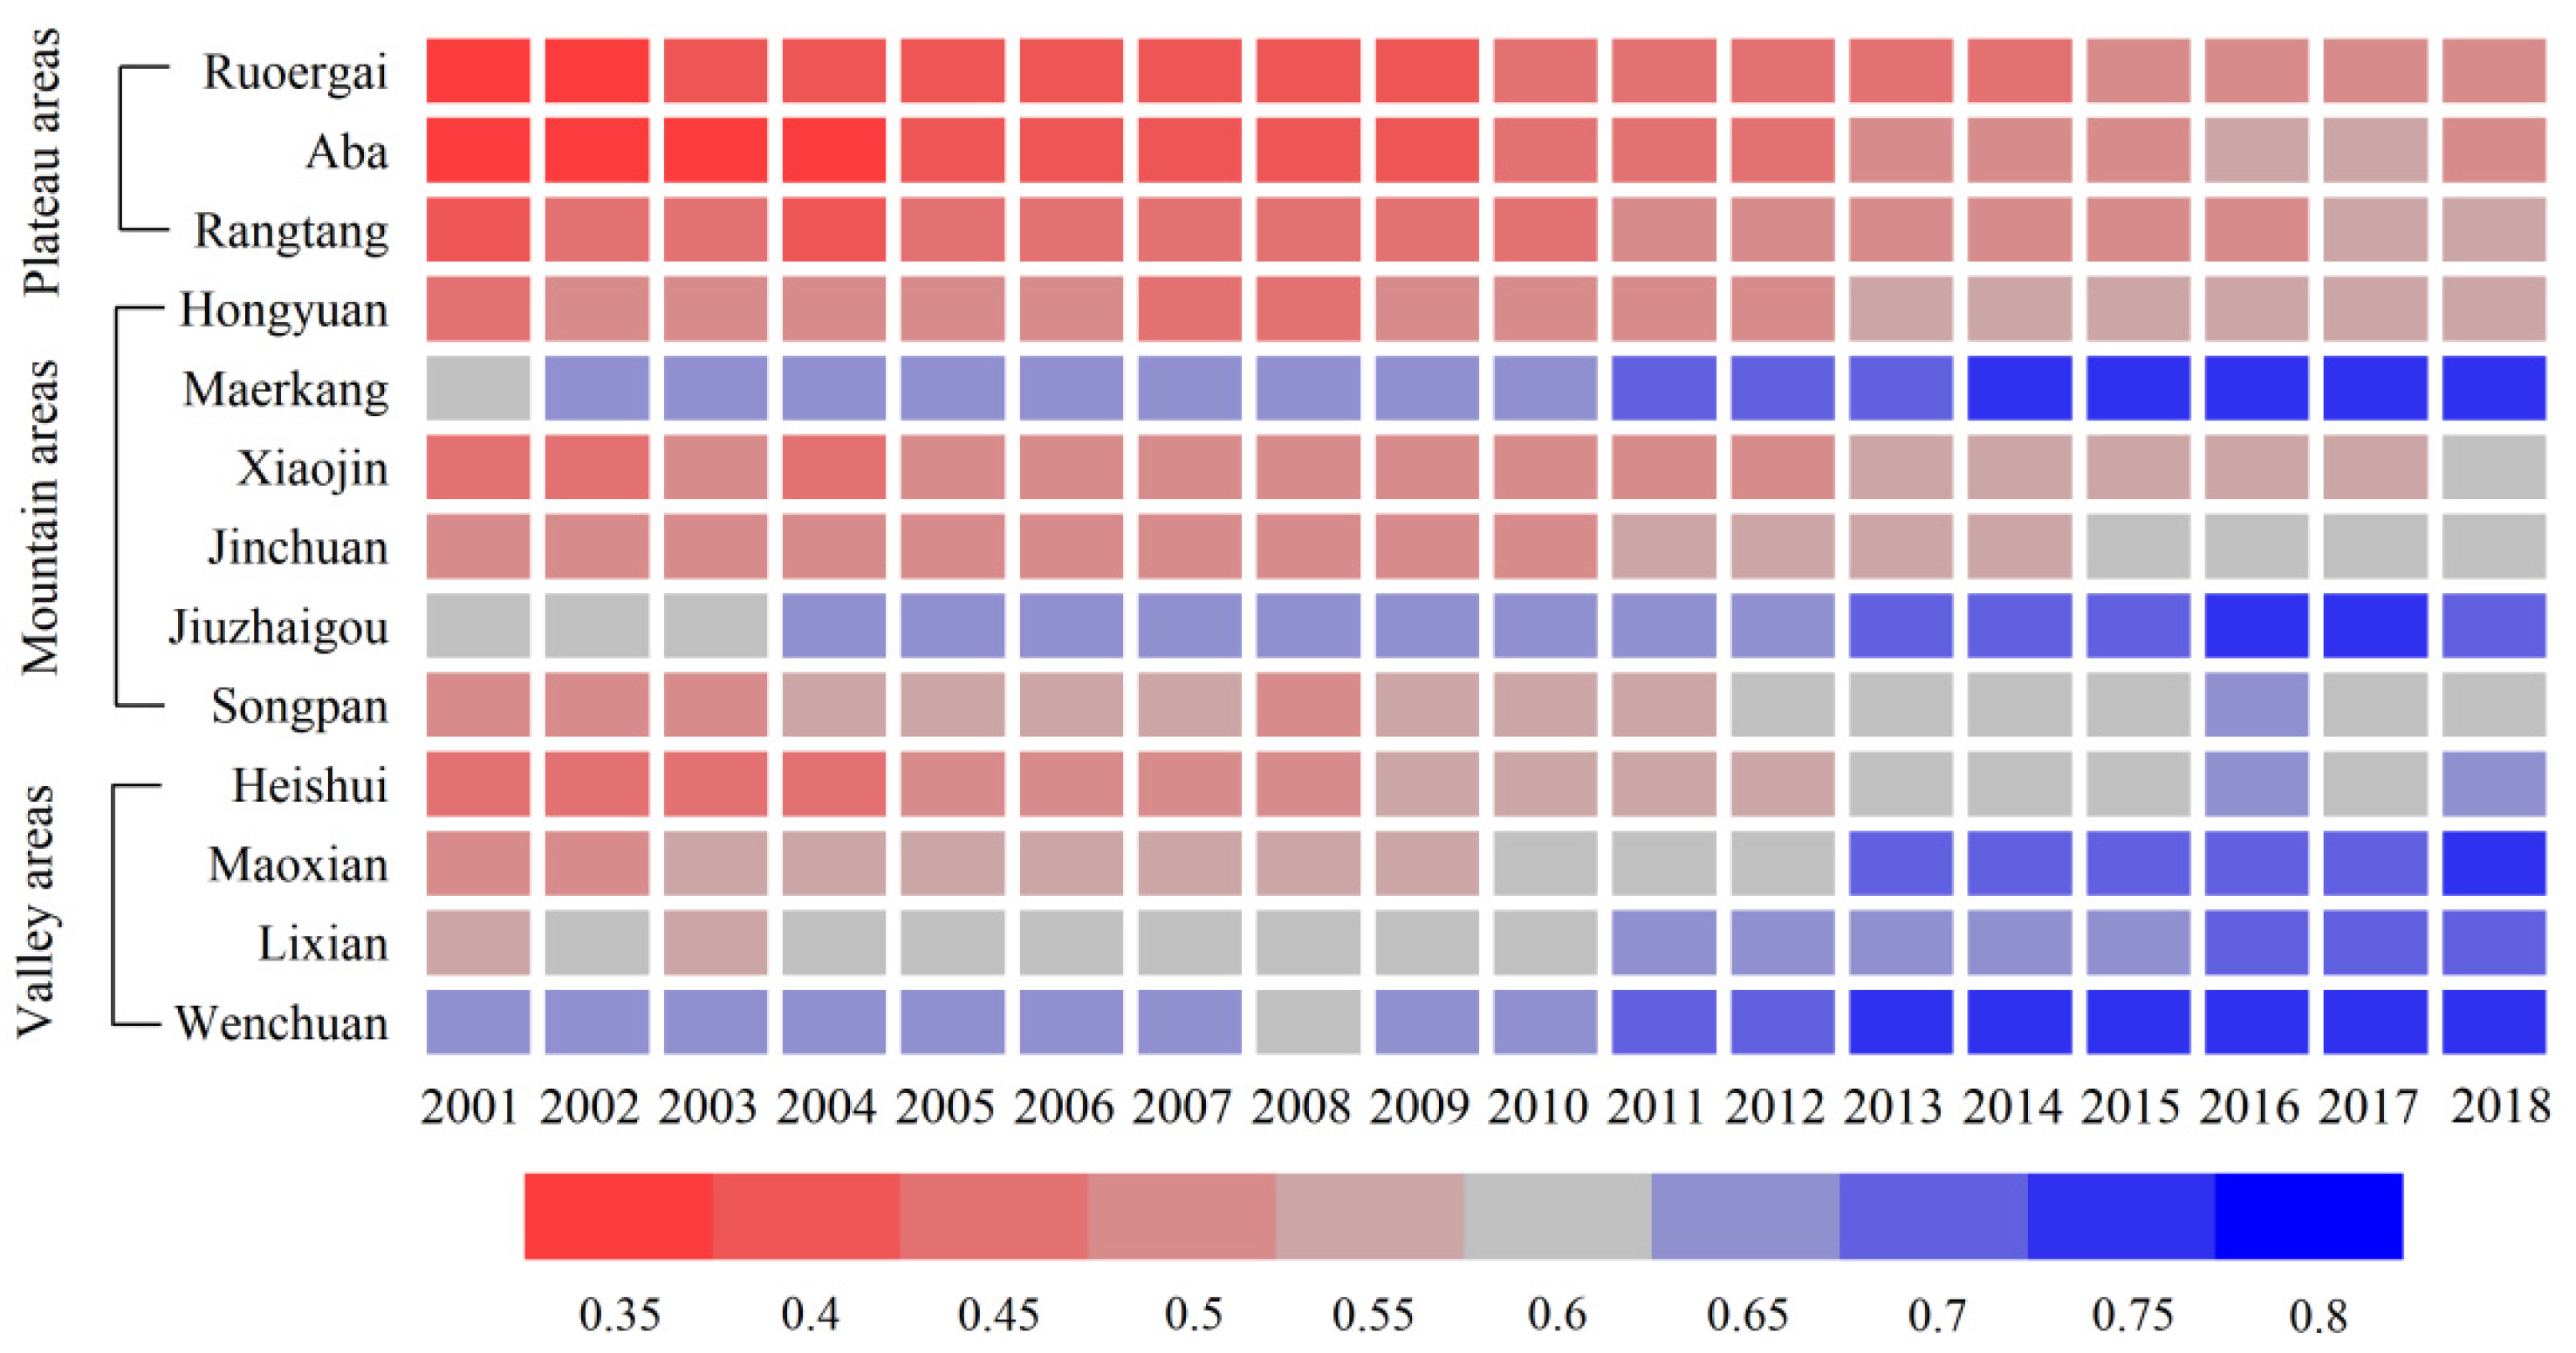
3.2.1. Coupling Coordination Degree

Average CCD during the course of this study continued to increase from 0.5236 in 2001 to 0.6519 in 2018, thereby producing an overall monotonically increasing curve with a coupling correlation coefficient of R2 = 0.923 (p < 0.01) (Figure 4a).
For each sub-region, valley areas ranked first with a mean CCD of 0.6485 and a maximum value of 0.7337 in 2018 (Figure 4b). Mountain areas followed with a mean CCD of 0.6072 and a maximum of 0.6666 in 2016 (Figure 4c), while plateau areas had the lowest mean CCD of 0.4684 and a maximum of 0.5494 in 2018 (Figure 4d), indicating a relatively low level of coupling coordination development compared with valley and mountain regions. This indicates that the plateau region needs additional attention in the future to respond to its lowest coupling coordination degree.
Heatmaps provide not only CCD spatio-temporal changes for each county in Aba Prefecture but also their visibility information (Figure 5). Generally, the color change clearly shows that coupling coordination degree for each county increased gradually from 2001 to 2018, with most CCD scores > 0.5 since 2010. Notably, counties with CCD scores > 0.7 such as Wenchuan (2011–2018), Maoxian (2013–2018), and Maerkang (2014–2018), were mainly concentrated in valleys. Basically, the remaining counties rarely experienced such high CCD scores, especially those in plateau areas.
Besides, plateau CCD changed the most, with a rate of increase of 0.098/10a, followed by valleys and mountain areas with an increase rate of 0.089/10a and 0.066/10a, respectively. Counties with an increase rate < 0.075/10a included Rangtang, Hongyuan, and Jinchuan, with the latter experiencing the lowest growth rate (0.060/10a).

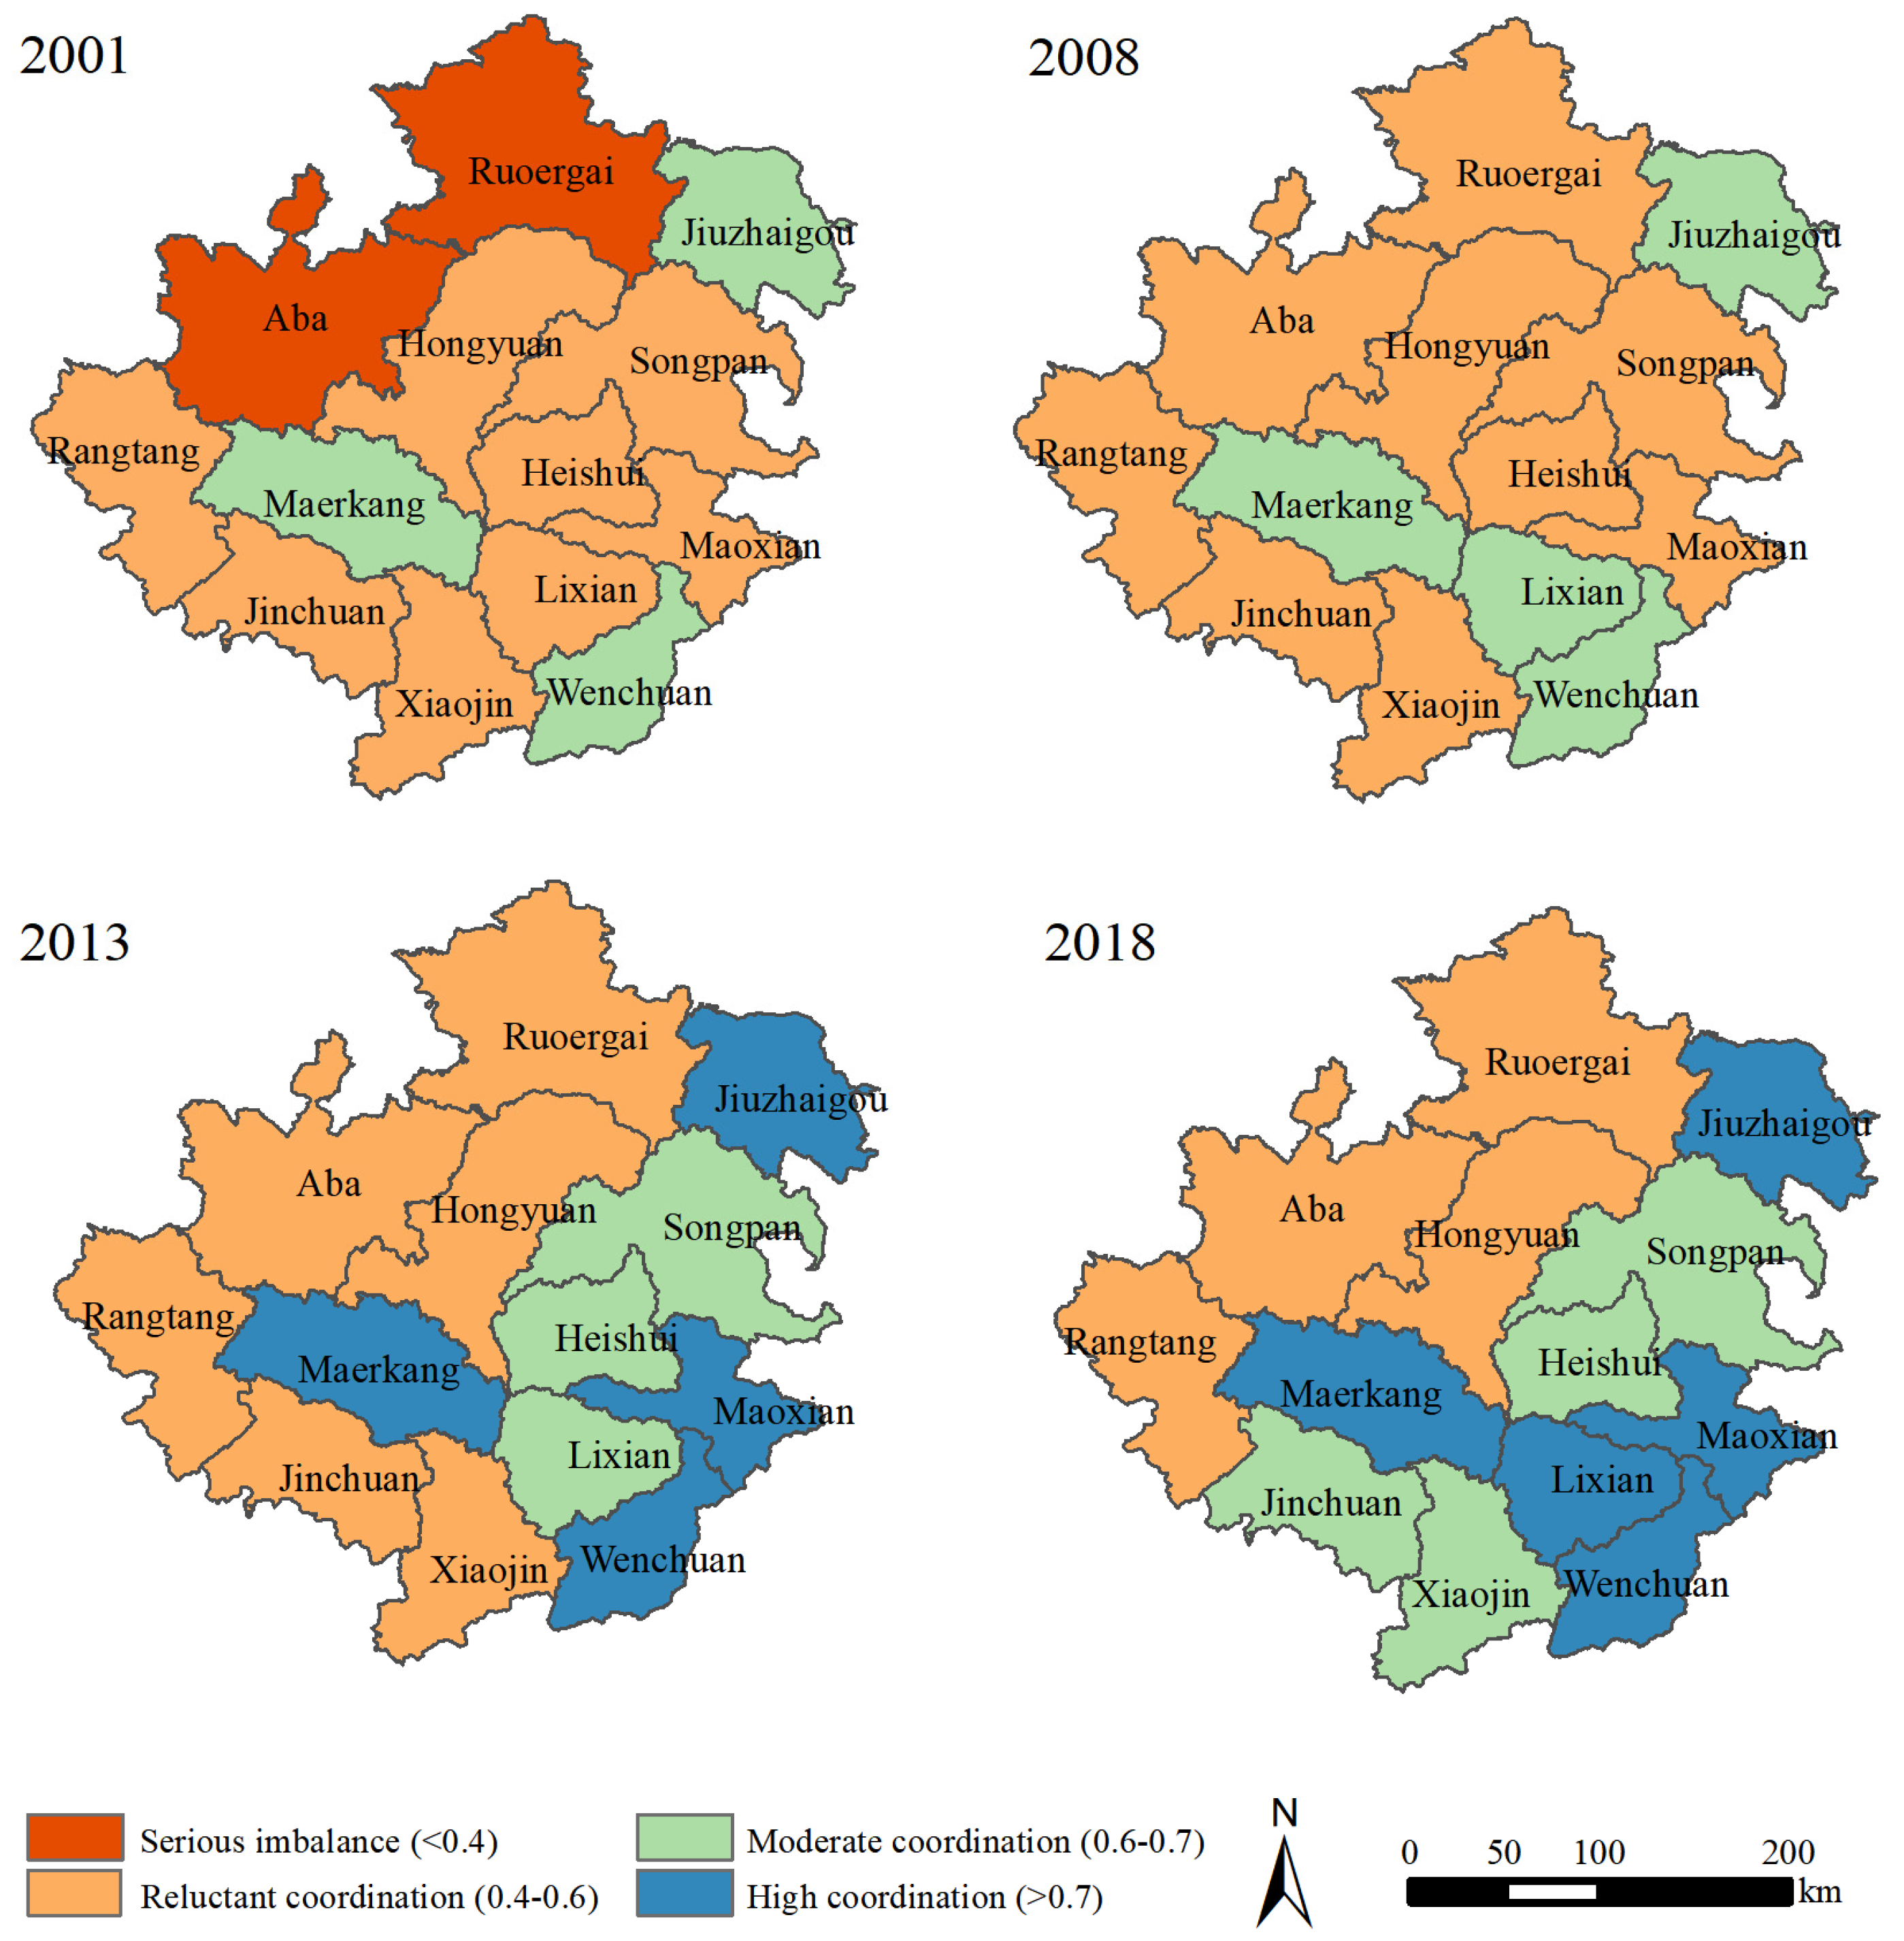
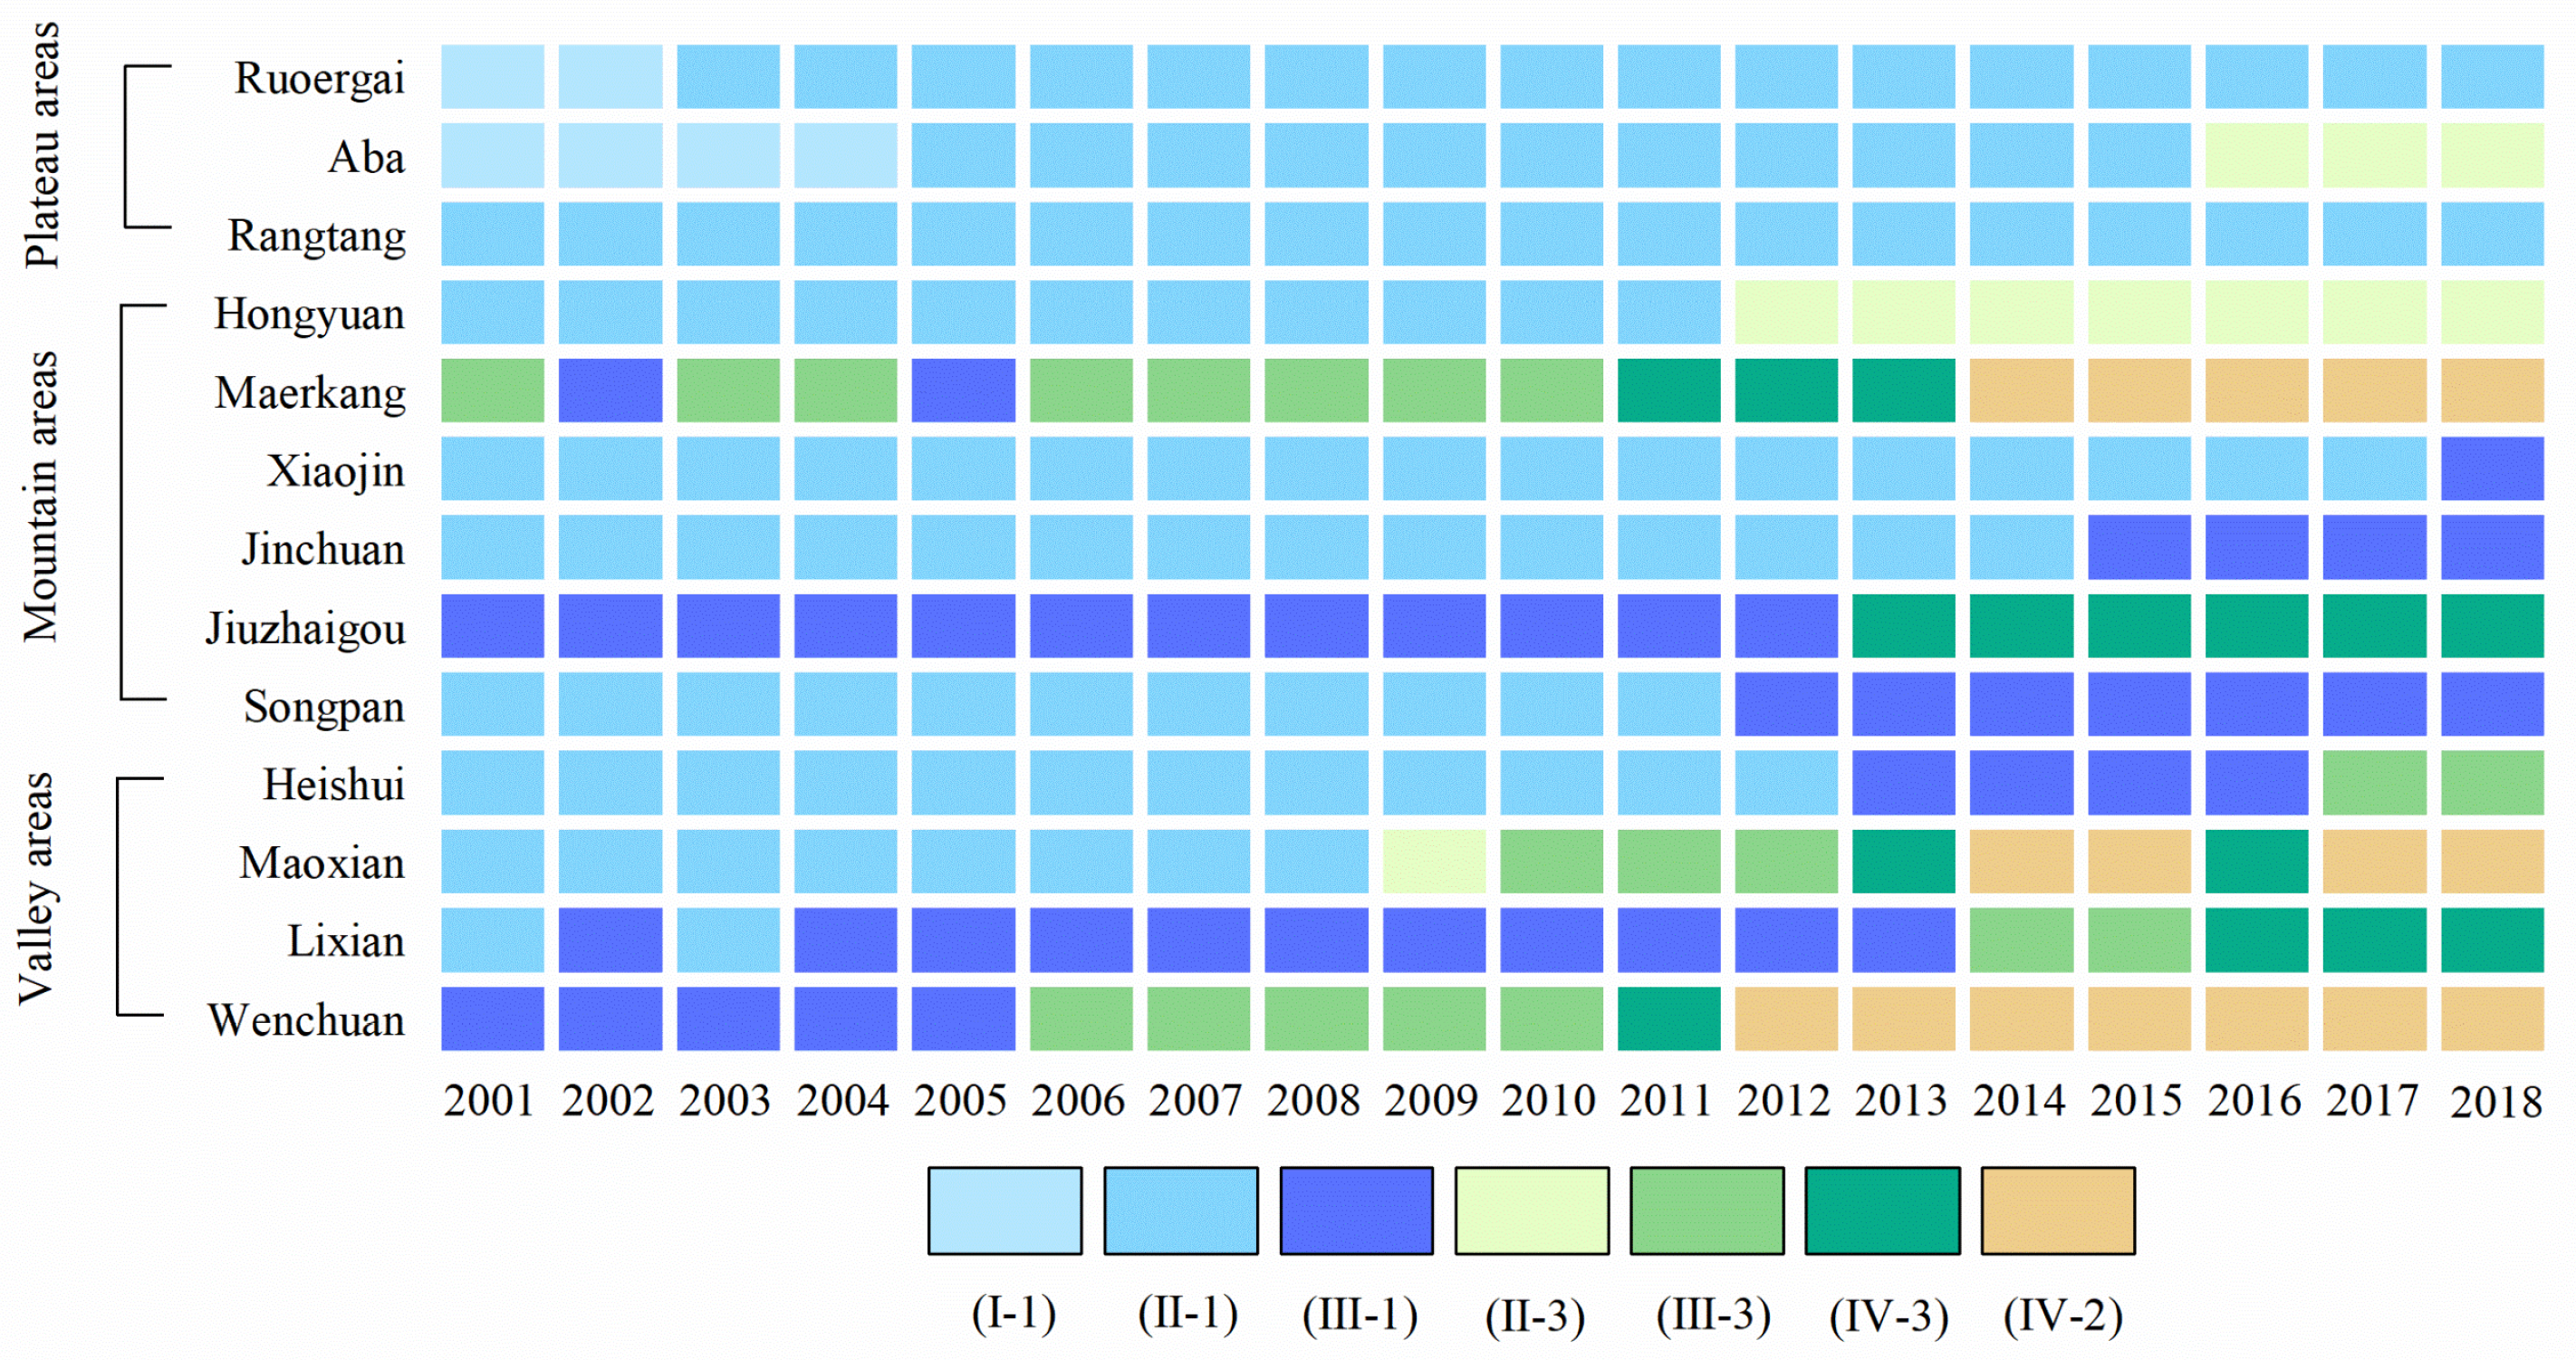
3.2.2. Coupling Coordination Type

Considering the specific time period of urbanization development in the Aba prefecture, we chose four time nodes (i.e., 2001, 2008, 2013, and 2018) for analyses (Figure 6). For example, the urbanization process was accelerated after China’s western development strategy was launched in 2000, the Wenchuan Ms 8.0 earthquake in 2008, and the post-earthquake reconstruction which was basically completed in 2013. From these important time points, we can understand the coupling coordinated relationship between urbanization and eco-environment in the study area (Figure 6).
Furthermore, based on CCD value, the thirteen counties in Aba Prefecture were classified into four categories (Figure 6) and seven sub-categories (Figure 7) according to the standards in Table 3. It can be seen from Figure 6 that most counties with low initial coupling levels increased in the final stage. Specifically in 2001, there were two counties (Ruoergai and Aba) seriously unbalanced, three counties (Wenchuan, Maerkang and Jiuzhaigou) moderately coordinated, and the remaining eight counties reluctantly coordinated. In 2018, there were no seriously unbalanced counties, and the coordination of five counties (Wenchuan, Maerkang, Jiuzhaigou, Maoxian and Lixian) had exceeded 0.7, thereby reaching a high level of coordination (Figure 6).
Moreover, the subclass of the coupling coordination types for each county reflected the contradiction between urbanization and eco-environmental status (Figure 7). It shows that during the 2001~2018 study period, most Aba Prefecture counties were sluggish urbanization types in the initial period, and transformed to coordinated development, or even eco-environment lag type in the final stage (Figure 7). For example, Lixian county in the valley areas was in a sluggish urbanization state (II-1) in 2001, and moved toward to coordinated development (III-3 and IV-3) after 2014. Jiuzhaigou county in the mountainous areas had moved from sluggish urbanization (II-1 and III-1) in 2001~2012, to coordinated development (IV-3) after 2013. Wenchuan, Maoxian, and Maerkang counties had moved to ecological environment lag (IV-2) after 2012, 2014, and 2014, respectively. However, Ruoergai and Rangtang counties in the plateau areas have remained in a state of sluggish urbanization (I-1 and II-1) due to local low-level urbanization, indicating that urbanization status in plateau regions was low and required further improvement.
Overall, the coupling levels of Aba Prefecture have maintained an upward trend, and most counties have gradually moved from an initial low, to a relatively high level of coordination development in the final stage. However, in 2018, three counties (Wenchuan, Maoxian, and Maerkang) in the basically coordinated patterns exhibited a lagged state in the eco-environment, indicating that ecological deficits have begun to restrict the coordinated development of the urbanization and eco-environment.

3.3. Interaction between Urbanization and Eco-Environment

To directly measure the interaction mechanism between urbanization development and eco-environment quality, only the CUI and CEI indexes were analyzed with the GTWR model which was run in conjunction with the mutual variables. The specific model calculation results and remaining parameters are shown in Table 4. It can be seen that the explanation degree of GTWR has reached 90%, with R2 in the model > 0.9, indicating that it described well the interaction between urbanization and eco-environment.

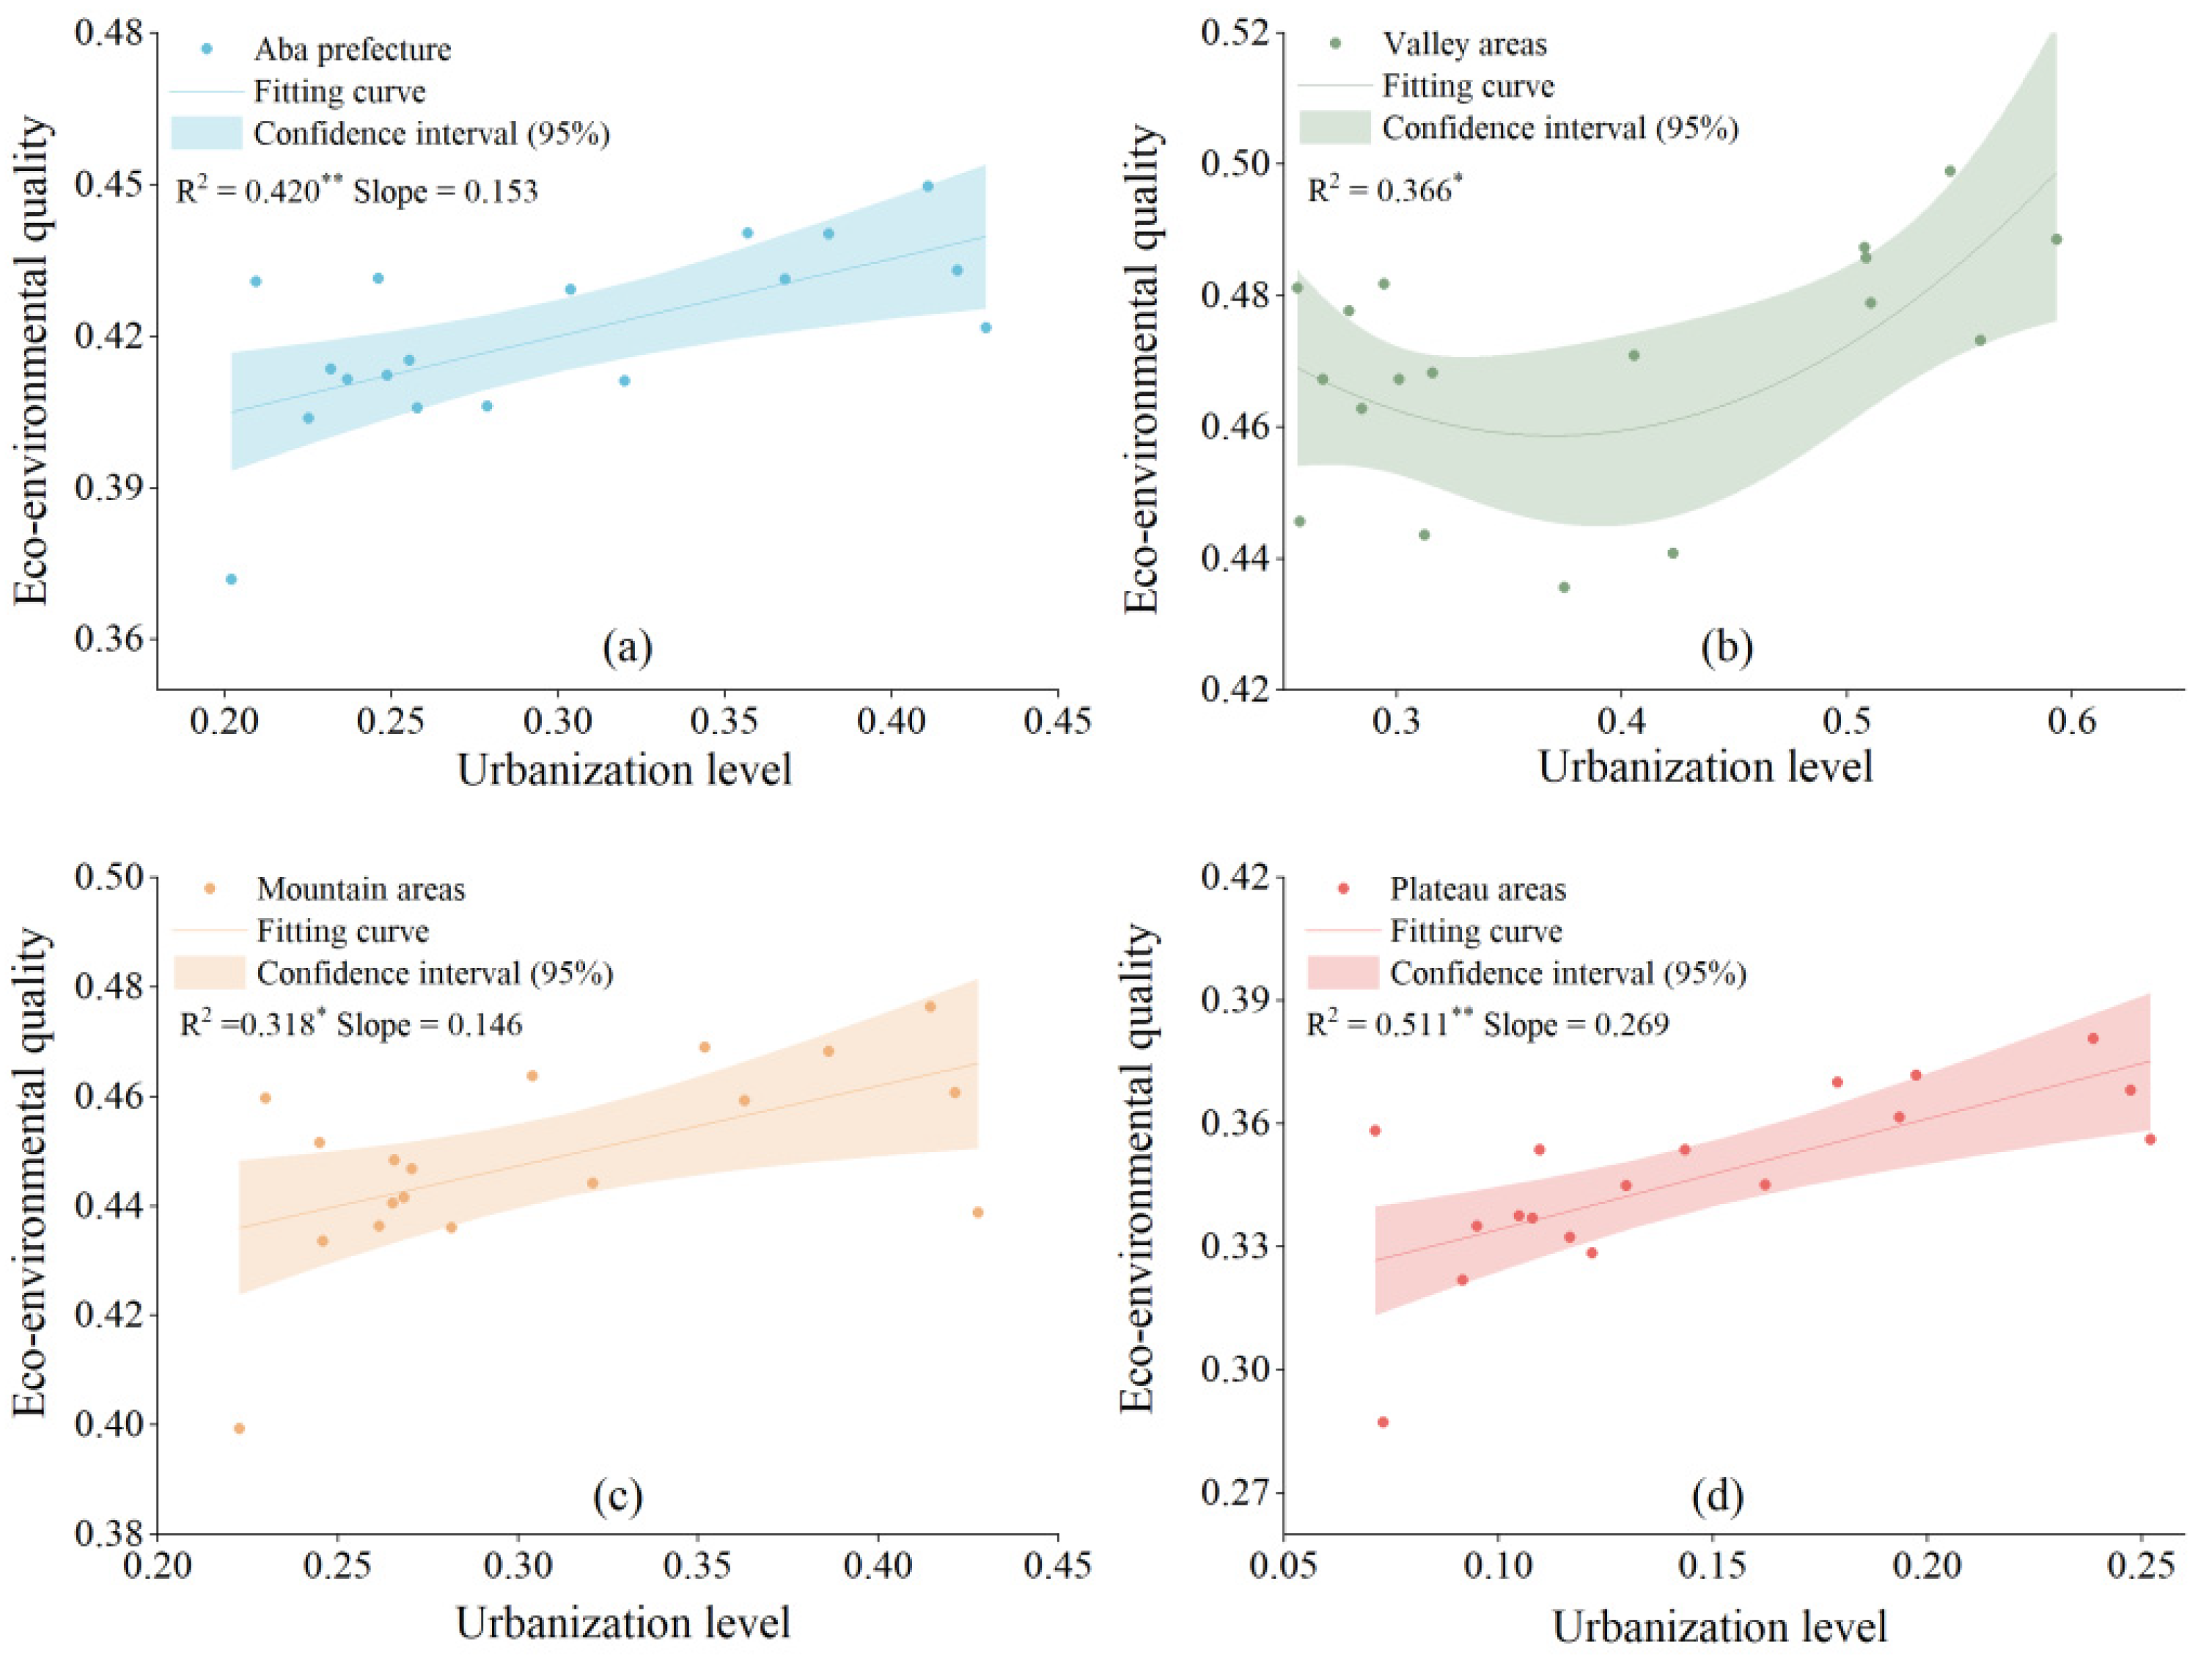
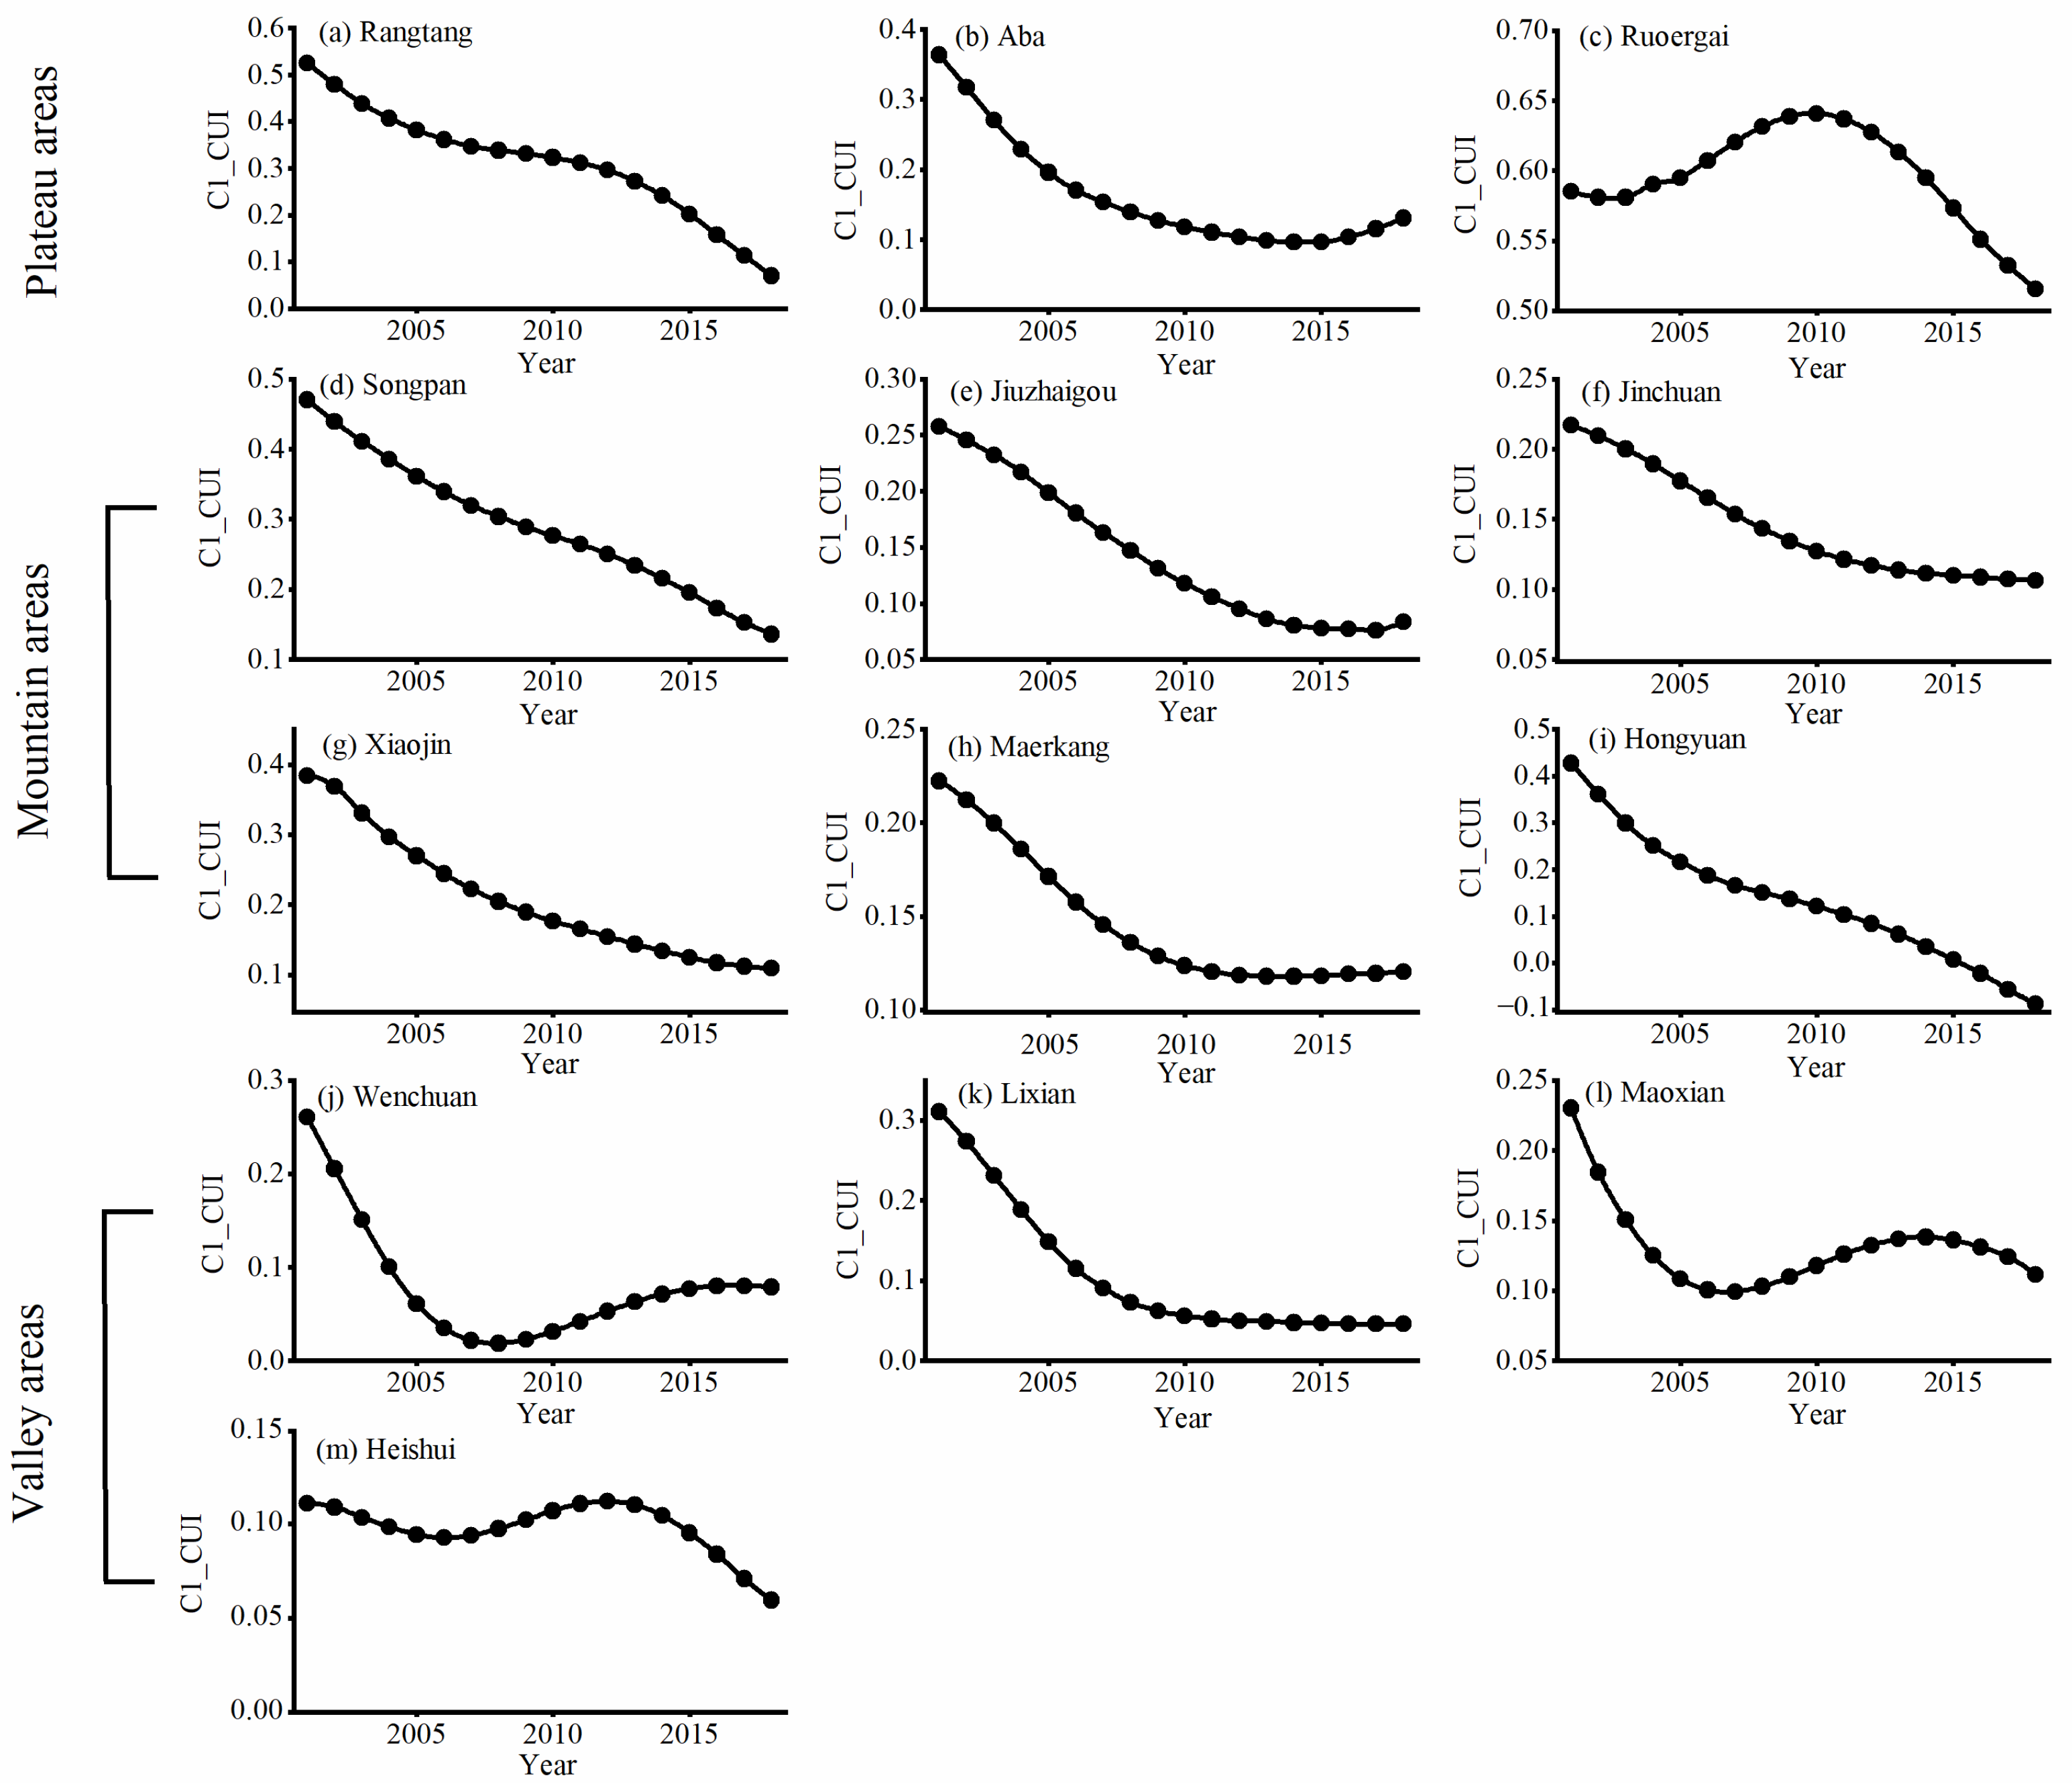
3.3.1. Impact of Urbanization on Eco-Environment

Figure 8 shows the impact of urbanization on eco-environment at the temporal scale from 2001 to 2018. With reference to Figure 2, both the urbanization index and the eco-environment index show increasing trends, which indicates a positive feedback effect on optimizing the eco-environment. Generally, for the whole study area, there was a positive feedback of urbanization development on optimizing eco-environmental quality, with a mean influence coefficient of 0.1964 (Figure 8). Moreover, the impact on plateaus was greatest, followed by mountains, and for valleys it was relatively low. Specifically, the positive impact of urbanization development on eco-environmental status for valleys, mountains, and plateaus were 0.1042, 0.1779, and 0.3564, respectively. Overall, the impact of urbanization development on eco-environmental quality in most Aba Prefecture counties was basically the same, indicating that urbanization is conducive to optimizing the eco-environment, especially in the initial urbanization period. However, with urbanization development, its positive effect on the eco-environment was gradually weakened (Figure 8). For example, although the overall positive impact of urbanization on eco-environmental quality in Hongyuan county lasted longer, it inevitably transformed from positive to negative after 2015. This shows that urbanization is not always conducive to optimizing the eco-environment in this county.

3.3.2. Impact of Eco-Environment on Urbanization

Figure 9 showed the impact of eco-environment on urbanization at the temporal scale. For the whole study area generally, the influence coefficient of eco-environmental quality on urbanization development was basically the same, fluctuating around the zero axis with a mean of −0.0037 (Figure 9). This implies that the negative effect of eco-environment on urbanization development in Aba Prefecture was insignificant, as it was in the early stage of urbanization and has not reached the eco-environmental carrying capacity threshold.
In terms of spatio-temporal distribution, the negative impact of eco-environmental quality on urbanization development is higher in valleys and mountains than in plateau areas. Specifically, the impact of eco-environmental status on urbanization development for valleys, mountains and plateau areas were −0.0025, −0.0054, and −0.0018, respectively. This implies that the eco-environment of Aba Prefecture is not conducive to urbanization. In fact, with reference to Figure 2, CUI only began to overtake CEI in 2018, indicating that urbanization had developed slowly.

4. Discussion

We explored the coupling relationship and the interaction between urbanization development and eco-environmental status in ecologically fragile areas on the eastern Tibetan Plateau, southwestern China. Our contribution provides a new perspective for investigating coupled relationships between urbanization and the eco-environment in ecologically fragile areas, since previous studies have usually focused on developed regions [15,49]. It can enrich current understanding of sustainability science, enhance the comprehensive geographic research paradigm, and help to better assess the urbanization and eco-environment relationship within the context of ecological civilization and sustainable development. Moreover, it also helps to enhance the effectiveness as well as sustainability of regional policy formulation in ecologically fragile regions during urbanization.

4.1. Differences between Ecologically Fragile and Developed Regions

In our study, there was an overall monotonically positive effect of urbanization on the local eco-environment, which contrasts with most studies in which eco-environmental quality initially deteriorates and then improves, especially in developed urban agglomerations. For example, Martínez-Zarzoso and Maruotti [18] obtained some evidence from urbanizing countries confirming that environmental impacts follow a EKC curve. Moreover, Fang et al. [16] found that although the coupling curves between urbanization and the eco-environment are heterogeneous, the UEKC hypothesis is tenable for most developed urban agglomerations in China. Nevertheless, our results concur with most studies, indicating that urbanization could promote coupled coordination with the eco-environment to a certain extent, and that areas with higher urbanization levels are more likely to develop in harmony with the eco-environment [22,24].
There are several potential explanations for the positive effect of high-level urbanization on the eco-environment on the QTP. First, it is more likely that urbanization is mainly accompanied by population migration of pastoralists to cities and towns [33]. As a result, livestock numbers drop, grassland grazing intensity is subsequently mitigated, and ecological degradation and environmental destruction largely limited to towns and surrounding areas. Thus, for the whole prefecture, eco-environmental quality may be actually optimized with urbanization, because eco-environmental pressure is alleviated to some extent [60]. Second, urbanization can be a source of higher productivity, because population agglomeration may reduce traditional livestock husbandry, as more pastoralists shift to secondary and tertiary industries [61]. For example, in 2018, tertiary industry GDP in Aba Prefecture was 11.7 billion yuan, which was almost eight times that in 2001 [62]. Moreover, the eco-environment may also benefit from an increase in environmental-friendly service sectors, such as ecotourism [63,64].
Except for the difference in natural conditions, urbanization effects on the eco-environment between developed, and ecologically fragile regions may be mainly related to the different urbanization stages. In fact, Aba Prefecture was in the primary urbanization stage with a rate of 40.04% in 2018, which is much lower than the national average value of 59.58%. Unexpectedly, we found that the results of the few relevant studies in ecologically fragile areas are also inconsistent. Among them, the findings of Tian et al. [30] on the Tibetan Plateau, and Feng et al. [22] in the Pan-Third pole region are overall consistent with our study, which shows that there exists positive feedback effect of urbanization development on the eco-environment. However, Hu et al. [27] found that high-level urbanization has a negative effect on the eco-environment in the Three Gorges Reservoir Area. Furthermore, Pan et al. [65] showed that rapid urbanization has led to a decline in regional ecosystem services. Nevertheless, the study by Ariken et al. [28] for the provinces along the Silk Road Economic Belt in China showed that urbanization has both positive and negative effects on the eco-environment in different regions. This suggests that even in ecologically fragile areas, the coupling relationship between urbanization and the eco-environment are heterogeneous, as a result of differences among different regions and various eco-environmental indicators.
Our GTWR analysis showed that eco-environmental status had a negligible effect on the urbanization process (Figure 9), whereas an urbanization effect on the eco-environment appeared as the initial positive influence diminished (Figure 8), presumably due to increasing consumption of resources and energy [66].
So far, urbanization in Aba Prefecture has been conducive to reducing the overall pressure of anthropogenic activities and improving the eco-environment, and facilitating the benign interactive process between it and the eco-environment. However, it is predictable that although this positive effect may occur in the initial stages of urbanization, the local eco-environment will deteriorate if further urbanization is not reasonably planned.

4.2. Research Limitations and Future Research Directions

Inevitably, our study has certain limitations. First, due to the lack of data for statistical analysis, it was not possible to extend the analysis period before 2001. Furthermore, the actual eco-environment indicators (e.g., air and water pollution) were also not analyzed. Moreover, we regarded the number of livestock as one of the pressure indicators to measure local ecological environment quality, however, Hou et al. [61] showed that with urbanization, some pastoralists purchase feed for their livestock, thus actually relieving their pressure on the grassland. Unfortunately, due to a lack of feed trade data, our impact of livestock on the ecological environment may be overestimated.
Second, the present index system of eco-environment quality was constructed without accounting for human-related pollution, perhaps making our evaluations different from their actual eco-environment status.
Third, limitations also relate to methodological issues in this study. For example, it was assumed that each dimension of local urbanization development has an equal impact weight. This may not be consistent with the actual condition. Moreover, the CCD and GTWR models may not capture the complexity of the interaction between urbanization and eco-environment.
Fourth, to reduce the redundant information and potential collinearity with the traditional index system, we did not consider other factors that may impact the eco-environment, such as climate change, human activities, and land use changes. This may lead to an exaggeration for the impacts of urbanization on eco-environment, and made it impossible to quantitatively analyze the influencing factors.
These limitations also indicate directions for future research. Firstly, to address data limitations, multi-sourced data with better temporal granularity should be further explored. If data are available, a long-time scale should be explored to enhance scientific integrity and further verify the research findings. Secondly, the index system for urbanization development and eco-environment quality should be constructed with more valid and reliable indicators, and adjusted according to regional conditions to provide more systematic and in-depth assessment. Lastly, in terms of methodological issues, more scientifically rigorous and accurate methods should be studied, especially for adopting different weights for the particular urbanization development and eco-environmental quality dimensions.

5. Conclusions

5.1. Main Findings

In contrast to previous research largely focused on developed regions, we selected Aba Prefecture located on the eastern Qinghai-Tibet Plateau of southwestern China as a case study, and conducted coupling coordination analysis and interaction identification between urbanization development and eco-environmental quality. This study could broaden existing research fields and promote greater understanding on the interaction between urbanization process and eco-environmental status in ecologically fragile areas in China, and even globally. Key points from the conclusions are as follows:
(1)
The Aba Prefecture was in an accelerated urbanization stage, with valleys developing more rapidly than mountain and plateau areas. Moreover, overall eco-environmental quality growth was enhanced with urbanization. Overall, urbanization played a decreasingly positive role and was conducive to lowering anthropogenic activities and improving eco-environmental quality in Aba Prefecture during the 2001~2018 period.
(2)
Regions with higher urbanization levels are also overall inconsistent with higher eco-environmental quality in Aba Prefecture. Spatially, heterogeneous effects of urbanization development on eco-environmental quality were clearly evident in various geographical areas. Specifically, valleys had the highest eco-environmental quality as well as urbanization level, followed by mountains and plateaus.
(3)
For the entire Aba Prefecture, as well as the vast majority of its counties, there was an increasing trend in the coupling coordination degree (CCD) between urbanization development and eco-environmental quality, indicating that coordinated development was overall optimized. Spatially, CCD gradually decreased in the order valleys > mountains > plateaus, and eco-environment quality displayed the same pattern. Specifically, urbanization development in the plateau region was relatively limited and could not keep up with the pace of the eco-environment, resulting in a relative lag in the coordination degree.
(4)
In terms of coupling types, although the entire Aba Prefecture as well as the vast majority of its counties had transformed from uncoordinated development in the initial stage to transformation development in the final period, local development cannot be deemed sustainable. The main constraint for this insufficient development is the reason for low urbanization development level, especially in plateau areas. Overall, urbanization level had a decisive influence on CCD due to the relatively huge gap between urbanization and the eco-environment. Specifically, the higher the urbanization level, the better the coordination.

5.2. Policy Implications

Our results can provide appropriate guidance strategies for a healthy urbanization development approach in Aba Prefecture and even other ecologically fragile areas with an undeveloped economy. Firstly, the results revealed that there is a profound relationship in the interaction between urbanization and eco-environment, indicating restrictions on urbanization should not be regarded as the only means to prevent ecological degradation. Consequently, local authorities should pay more attention to promoting a higher urbanization level, and integrate eco-environmental efficiency improvement into sustainable regional development. In combating the problems existing in current urbanization, the focus should be on providing diverse scientific and reasonable urbanization development modes.
Secondly, local government needs to comprehensively consider urbanization development level and eco-environmental status of each region with spatial heterogeneity, to make overall planning and reasonable arrangements in advance. Specifically, as mountain and plateau areas in Aba Prefecture appear to be over reliant on grassland resources and therefore high environmental pressures, and lagging behind in urbanization, more attention should be vigorously paid to facilitate urbanization here. For example, it is necessary to improve basic public services in these regions, such as transportation and education, to attract more population and investment. Conversely, local governments in valley areas need to pay more attention to ecological protection and stop rapid urbanization at the expense of the eco-environment. To do so, local authorities should seek a development pattern that has less impact on the eco-environment, for instance, eco-environment monitoring systems and protection policies should be adopted.
Lastly, we showed that a low level of resource-related industries (i.e., animal husbandry) has a very limited ability to drive the urbanization process, resulting in inefficient use of natural resources. Therefore, local authorities in Aba Prefecture should strive to continuously optimize and upgrade industrial structures to reduce resource consumption and improve ecological efficiency. Meanwhile, greater efforts need be put into government policy support, specifically, subsidies and tax incentives should be given to green industries, such as tourism and services.

Author Contributions

Software, formal analysis, investigation, resources, data curation, visualization, writing—original draft, Y.L. and X.L.; Conceptualization, methodology, validation, writing—review and editing, supervision, project administration, funding acquisition, T.L. All authors have read and agreed to the published version of the manuscript.

Funding

This research was supported by the Second Tibetan Plateau Scientific Expedition and Research Program (STEP) (Grant No. 2019QZKK0402) and the National Natural Science Foundation of China (Grant No. 42071238).

Data Availability Statement

Not applicable.

Conflicts of Interest

The authors declare no conflict of interest.

References

  1. Ren, G.Y. Urbanization as a major driver of urban climate change. Adv. Clim. Chang. Res. 2015, 6, 1–6. [Google Scholar] [CrossRef]
  2. Bai, X.M.; Shi, P.J.; Liu, Y.S. Realizing China’s Urban dream. Nature 2014, 509, 158–160. [Google Scholar] [CrossRef] [PubMed] [Green Version]
  3. Cai, Z.Y.; Liu, Q.; Cao, S.X. Real estate supports rapid development of China’s urbanization. Land Use Policy 2020, 95, 104582. [Google Scholar] [CrossRef]
  4. Krey, V.; Neill, B.; van Ruijven, B.; Chaturvedi, V.; Daioglou, V.; Eom, J.; Jiang, L.; Nagai, Y.; Pachauri, S.; Ren, X.; et al. Urban and Rural Energy Use and Carbon Dioxide Emissions in Asia. Energy Econ. 2012, 34, S272–S283. [Google Scholar] [CrossRef]
  5. Zhou, N.; Zhao, S. Urbanization process and induced environmental geological hazards in China. Nat. Hazards 2013, 67, 797–810. [Google Scholar] [CrossRef]
  6. United Nations. World Urbanization Prospects: The 2021 Revision; United Nations, Department of Economic and Social Affairs, Population Division: New York, NY, USA, 2021. [Google Scholar]
  7. Abu Hammad, A.; Tumeizi, A. Land degradation: Socioeconomic and environmental causes and consequences in the eastern Mediterranean. Land Degrad. Dev. 2012, 23, 216–226. [Google Scholar] [CrossRef]
  8. Cao, C.; Lee, X.H.; Liu, S.D.; Schultz, N.; Xiao, W.; Zhang, M.; Zhao, L. Urban heat islands in China enhanced by haze pollution. Nat. Commun. 2016, 7, 12509. [Google Scholar] [CrossRef]
  9. Ahmed, K.; Ahmed, S. A predictive analysis of CO2 emissions, environmental policy stringency, and economic growth in China. Environ. Sci. Pollut. Res. 2018, 25, 16091–16100. [Google Scholar] [CrossRef]
  10. Gu, Z.N.; Zhang, Z.; Yang, J.H.; Wang, L.L. Quantifying the Influences of Driving Factors on Vegetation EVI Changes Using Structural Equation Model: A Case Study in Anhui Province, China. Remote Sens. 2022, 14, 4203. [Google Scholar] [CrossRef]
  11. Jeong, A.; Dorn, R.I. Soil erosion from urbanization processes in the Sonoran Desert, Arizona, USA. Land Degrad. Dev. 2019, 30, 226–238. [Google Scholar] [CrossRef]
  12. Qiu, J. Environment: Riding on the roof of the world. Nature 2007, 449, 398–402. [Google Scholar] [CrossRef] [PubMed]
  13. Song, Y.M.; Chen, B.; Ho, H.C.; Kwan, M.-P.; Liu, D.; Wang, F.; Wang, J.H.; Cai, J.X.; Li, X.J.; Xu, Y.; et al. Observed inequality in urban greenspace exposure in China. Environ. Int. 2021, 156, 106778. [Google Scholar] [CrossRef]
  14. Cobbinah, P.; Erdiaw-kwasie, M.; Amoateng, P. Africa’s urbanisation: Implications for sustainable development. Cities 2015, 47, 62–72. [Google Scholar] [CrossRef]
  15. Fang, C.L.; Cui, X.G.; Li, G.D.; Bao, C.; Wang, Z.B.; Ma, H.T.; Sun, S.A.; Liu, H.M.; Luo, K.; Ren, Y.F. Modeling regional sustainable development scenarios using the Urbanization and Eco-environment Coupler: Case study of Beijing Tianjin-Hebei urban agglomeration, China. Sci. Total Environ. 2019, 689, 820–830. [Google Scholar] [CrossRef] [PubMed]
  16. Fang, C.L.; Liu, H.M. The coupling curve between urbanization and the eco-environment: China’s urban agglomeration as a case study. Ecol. Indic. 2021, 130, 108107. [Google Scholar] [CrossRef]
  17. Song, Y.M.; Chen, B.; Kwan, M.-P. How does urban expansion impact people’s exposure to green environments? A comparative study of 290 Chinese cities. J. Clean. Prod. 2020, 246, 119018. [Google Scholar] [CrossRef]
  18. Martinez-Zarzoso, I.; Maruotti, A. The impact of urbanization on CO2 emissions: Evidence from developing countries. Ecol. Econ. 2011, 70, 1344–1353. [Google Scholar] [CrossRef] [Green Version]
  19. Zhao, Y.B.; Wang, S.J.; Zhou, C.S. Understanding the relation between urbanization and the eco-environment in China’s Yangtze River Delta using an improved EKC model and coupling analysis. Sci. Total Environ. 2016, 571, 862–875. [Google Scholar] [CrossRef]
  20. Ozturk, I.; Al-Mulali, U. Investigating the validity of the environmental Kuznets curve hypothesis in Cambodia. Ecol. Indic. 2015, 57, 324–330. [Google Scholar] [CrossRef]
  21. Muller-Furstenberger, G.; Wagner, M. Exploring the environmental Kuznets hypothesis: Theoretical and econometric problems. Ecol. Econ. 2007, 62, 648–660. [Google Scholar] [CrossRef] [Green Version]
  22. Feng, Y.X.; He, S.W.; Li, G.D. Interaction between urbanization and the eco-environment in the Pan-Third Pole region. Sci. Total Environ. 2021, 789, 148011. [Google Scholar] [CrossRef] [PubMed]
  23. He, J.Q.; Wang, S.J.; Liu, Y.Y.; Ma, H.T.; Liu, Q.Q. Examining the relationship between urbanization and the eco-environment using a coupling analysis: Case study of Shanghai, China. Ecol. Indic. 2017, 77, 185–193. [Google Scholar] [CrossRef]
  24. Liu, N.N.; Liu, C.Z.; Xia, Y.F.; Da, B.W. Examining the coordination between urbanization and eco-environment using coupling and spatial analyses: A case study in China. Ecol. Indic. 2018, 93, 1163–1175. [Google Scholar] [CrossRef]
  25. Srinivasan, V.; Seto, K.C.; Emerson, R.; Gorelick, S.M. The impact of urbanization on water vulnerability: A coupled human-environment system approach for Chennai, India. Glob. Environ. Chang.-Hum. Policy Dimens. 2013, 23, 229–239. [Google Scholar] [CrossRef]
  26. Chen, Q.W.; Lu, S.X.; Xiong, K.N.; Zhao, R. Coupling analysis on ecological environment fragility and poverty in South China Karst. Environ. Res. 2021, 201, 111650. [Google Scholar] [CrossRef]
  27. Hu, J.J.; Huang, Y.; Du, J. The Impact of Urban Development Intensity on Ecological Carrying Capacity: A Case Study of Ecologically Fragile Areas. Int. J. Environ. Res. Public Health 2021, 18, 7094. [Google Scholar] [CrossRef]
  28. Ariken, M.; Zhang, F.; Chan, N.W.; Kung, H.T. Coupling coordination analysis and spatio-temporal heterogeneity between urbanization and eco-environment along the Silk Road Economic Belt in China. Ecol. Indic. 2021, 121, 107014. [Google Scholar] [CrossRef]
  29. Liu, K.; Qiao, Y.R.; Shi, T.; Zhou, Q. Study on coupling coordination and spatiotemporal heterogeneity between economic development and ecological environment of cities along the Yellow River Basin. Environ. Sci. Pollut. Res. 2021, 28, 6898–6912. [Google Scholar] [CrossRef]
  30. Tian, Y.Y.; Jiang, G.H.; Zhou, D.Y.; Li, G.Y. Heterogeneity and regional differences in ecosystem services responses driven by the “Three Modernizations”. Land Degrad. Dev. 2021, 32, 3743–3761. [Google Scholar] [CrossRef]
  31. Madsen, D.B. Conceptualizing the Tibetan Plateau: Environmental constraints on the peopling of the “Third Pole”. Archaeol. Res. Asia 2016, 5, 24–32. [Google Scholar] [CrossRef]
  32. Sun, H.L.; Zheng, D.; Yao, T.D.; Zhang, Y.L. Protection and Construction of the National Ecological Security Shelter Zone on Tibetan Plateau. Acta Geogr. Sin. 2012, 67, 3–12. [Google Scholar]
  33. Fu, S.J.; Zhang, X.X.; Kuang, W.H.; Guo, C.Q. Characteristics of Changes in Urban Land Use and Efficiency Evaluation in the Qinghai-Tibet Plateau from 1990 to 2020. Land 2022, 11, 757. [Google Scholar] [CrossRef]
  34. Pan, X.H.; Wang, Y.H.; Liu, Z.F.; He, C.Y.; Liu, H.M.; Chen, Z.R. Understanding Urban Expansion on the Tibetan Plateau over the Past Half Century Based on Remote Sensing: The Case of Xining City, China. Remote Sens. 2021, 13, 46. [Google Scholar] [CrossRef]
  35. Chen, M.X.; Liu, W.D.; Lu, D.D.; Chen, H.; Ye, C. Progress of China’s new-type urbanization construction since 2014: A preliminary assessment. Cities 2018, 78, 180–193. [Google Scholar] [CrossRef]
  36. Rana, I.; Bhatti, S. Lahore, Pakistan—Urbanization challenges and opportunities. Cities 2017, 72, 348–355. [Google Scholar] [CrossRef]
  37. Du, M.Y.; Kawashima, S.; Yonemura, S.; Zhang, X.Z.; Chen, S.B. Mutual influence between human activities and climate change in the Tibetan Plateau during recent years. Glob. Planet. Chang. 2004, 41, 241–249. [Google Scholar] [CrossRef]
  38. Wu, Y.; Wang, S.R.; Ni, Z.K.; Li, H.; May, L.; Pu, J. Emerging water pollution in the world’s least disturbed lakes on Qinghai-Tibetan Plateau. Environ. Pollut. 2021, 272, 118502. [Google Scholar] [CrossRef] [PubMed]
  39. Chen, L.; Wang, Q. Spatio-temporal evolution and influencing factors of land use in Tibetan region: 1995–2025. Earth Sci. Inform. 2021, 14, 1821–1832. [Google Scholar] [CrossRef]
  40. Hao, Y.; Gao, S.; Guo, Y.X.; Gai, Z.Q.; Wu, H.T. Measuring the nexus between economic development and environmental quality based on environmental Kuznets curve: A comparative study between China and Germany for the period of 2000–2017. Environ. Dev. Sustain. 2021, 23, 16848–16873. [Google Scholar] [CrossRef]
  41. Prashant, P.; Billore, S.; Sharma, J.; Singh, N.; Ram, H. Treatment of wastewater and restoration of aquatic systems through an eco-technology based constructed treatment wetlands—A successful experience in Central India. Water Sci. Technol. J. Int. Assoc. Water Pollut. Res. 2013, 68, 1566–1573. [Google Scholar] [CrossRef]
  42. Du, P.; Chen, J.; Chen, C.; Liu, Y.; Liu, J.; Wang, H.; Zhang, X. Environmental risk evaluation to minimize impacts within the area affected by the Wenchuan earthquake. Sci. Total Environ. 2012, 419, 16–24. [Google Scholar] [CrossRef]
  43. Yang, X.T.; Qiu, X.P.; Xu, Y.; Zhu, F.b.; Liu, Y.W. Spatial heterogeneity and dynamic features of the ecosystem services influence on human wellbeing in the West Sichuan Mountain Areas. Acta Ecol. Sin. 2021, 41, 7555–7567. [Google Scholar]
  44. Zhu, G.R.; Wang, M.; Li, Q.J.; Liu, J.; Yanni, Z.; Gao, J.W.; Xu, H.L. Land development suitability analysis for transport planning evaluation and optimization in mountainous ecological region. J. Mt. Sci. 2022, 19, 862–873. [Google Scholar] [CrossRef]
  45. Statistical Bureau of Aba prefecture. Statistical Bureau of Aba prefecture—2019; Xinhua Publishing House: Beijing, China, 2019. [Google Scholar]
  46. Yang, J.; Huang, X. The 30 m annual land cover dataset and its dynamics in China from 1990 to 2019. Earth Syst. Sci. Data 2021, 13, 3907–3925. [Google Scholar] [CrossRef]
  47. Xu, D.; Yang, F.; Yu, L.; Zhou, Y.Y.; Li, H.X.; Ma, J.J.; Huang, J.C.; Wei, J.; Xu, Y.; Zhang, C.; et al. Quantization of the coupling mechanism between eco-environmental quality and urbanization from multisource remote sensing data. J. Clean. Prod. 2021, 321, 128948. [Google Scholar] [CrossRef]
  48. Fu, S.Z.; Zhuo, H.M.; Song, H.; Wang, J.C.; Ren, L.J. Examination of a coupling coordination relationship between urbanization and the eco-environment: A case study in Qingdao, China. Environ. Sci. Pollut. Res. 2020, 27, 23981–23993. [Google Scholar] [CrossRef] [PubMed]
  49. Shao, Z.F.; Ding, L.; Li, D.R.; Altan, O.; Huq, M.E.; Li, C.M. Exploring the Relationship between Urbanization and Ecological Environment Using Remote Sensing Images and Statistical Data: A Case Study in the Yangtze River Delta, China. Sustainability 2020, 12, 5620. [Google Scholar] [CrossRef]
  50. Bai, Y.P.; Deng, X.Z.; Jiang, S.J.; Zhang, Q.; Wang, Z. Exploring the relationship between urbanization and urban eco-efficiency: Evidence from prefecture-level cities in China. J. Clean. Prod. 2018, 195, 1487–1496. [Google Scholar] [CrossRef]
  51. Cai, J.; Li, X.P.; Liu, L.J.; Chen, Y.Z.; Wang, X.W.; Lu, S.H. Coupling and coordinated development of new urbanization and agro-ecological environment in China. Sci. Total Environ. 2021, 776, 145837. [Google Scholar] [CrossRef] [PubMed]
  52. Chen, J.D.; Li, Z.W.; Dong, Y.Z.; Song, M.; Shahbaz, M.; Xie, Q.J. Coupling coordination between carbon emissions and the eco-environment in China. J. Clean. Prod. 2020, 276, 123848. [Google Scholar] [CrossRef]
  53. Sun, T.S.; Hu, X.H. Grassland Adaptive Management in Arid Region Based on Livelihood Capitals of Peasants and Herdsmen A Case Study of Fuyun County in the North of Junggar Basin, China. J. Nat. Resour. 2018, 33, 761–774. [Google Scholar]
  54. Feng, Y.X.; Li, G.D. Interaction between urbanization and eco-environment in the Tibetan Plateau. J. Geogr. Sci. 2021, 31, 298–324. [Google Scholar] [CrossRef]
  55. Zou, Z.H.; Yun, Y.; Sun, J.N. Entropy method for determination of weight of evaluating indicators in fuzzy synthetic evaluation for water quality assessment. J. Environ. Sci. 2006, 18, 1020–1023. [Google Scholar] [CrossRef]
  56. Fan, W.P.; Wang, H.K.; Liu, Y.; Liu, H.P. Spatio-temporal variation of the coupling relationship between urbanization and air quality: A case study of Shandong Province. J. Clean. Prod. 2020, 272, 122812. [Google Scholar] [CrossRef]
  57. Huang, B.; Wu, B.; Barry, M. Geographically and temporally weighted regression for modeling spatio-temporal variation in house prices. Int. J. Geogr. Inf. Sci. 2010, 24, 383–401. [Google Scholar] [CrossRef]
  58. Tasyurek, M.; Celik, M. FastGTWR: A fast geographically and temporally weighted regression approach. J. Fac. Eng. Archit. Gazi Univ. 2021, 36, 715–726. [Google Scholar]
  59. Yu, Y.; Duan, C.; Li, S.; Peng, C.; Yang, J.; Yan, K.; Bi, X.; Zou, P. Relationship between environmental pollution and economic development in late-developing regions shows an inverted V. Sci. Total Environ. 2022, 838, 156295. [Google Scholar] [CrossRef] [PubMed]
  60. Du, F.C. Ecological resettlement of Tibetan herders in the Sanjiangyuan: A case study in Madoi County of Qinghai. Nomadic Peoples 2012, 16, 116–133. [Google Scholar] [CrossRef] [Green Version]
  61. Hou, L.L.; Chen, Q.H.; Huang, J.K.; He, Y.; Rose, N.; Rozelle, S. Grassland ecological compensation policy in China improves grassland quality and increases herders’ income. Nat. Commun. 2021, 12, 4683. [Google Scholar] [CrossRef]
  62. Statistical Bureau of Sichuan. Sichuan Statistical Yearbook—2021; China Statistics Press: Beijing, China, 2021.
  63. Jänicke, M. “Green growth”: From a growing eco-industry to economic sustainability. Energy Policy 2012, 48, 13–21. [Google Scholar] [CrossRef]
  64. Shahbaz, M.; Lorente, D.; Sinha, A. Foreign Direct Investment–CO2 Emissions Nexus in Middle East and North African countries: Importance of Biomass Energy Consumption. J. Clean. Prod. 2019, 217, 603–614. [Google Scholar] [CrossRef] [Green Version]
  65. Pan, X.; Shi, P.J.; Wu, N. Spatial-Temporal Interaction Relationship between Ecosystem Services and Urbanization of Urban Agglomerations in the Transitional Zone of Three Natural Regions. Sustainability 2020, 12, 10211. [Google Scholar] [CrossRef]
  66. Campana, P.; Knox, J.; Grundstein, A.; Dowd, J. The 2007–2009 Drought in Athens, Georgia, United States: A Climatological Analysis and an Assessment of Future Water Availability. J. Am. Water Resour. Assoc. 2012, 48, 379–390. [Google Scholar] [CrossRef]
Figure 1. Location of Aba Prefecture.
Remotesensing 15 01661 g001
Figure 2. Temporal evolution of (a) comprehensive urbanization index (CUI) and (b) comprehensive eco-environment index (CEI) in Aba Prefecture and each sub-region during 2001~2018 period.
Remotesensing 15 01661 g002
Figure 3. Fitted curves between urbanization level and eco-environmental quality in Aba Prefecture (a) and each sub-region (bd) during 2001~2018 period. * indicates 95% credible interval; ** indicates 99% credible interval.
Remotesensing 15 01661 g003
Figure 4. Temporal evolution of coupling coordination degree between urbanization and eco-environment in Aba Prefecture (a) and each sub-region (bd) during the 2001–2018 period. ** indicates 99% credible interval.
Remotesensing 15 01661 g004
Figure 5. Temporal evolution of coupling coordination degree for each county in Aba Prefecture from 2001 to 2018.
Remotesensing 15 01661 g005
Figure 6. Spatial evolution of coupling coordination stage for each county in Aba Prefecture during 2001–2018.
Remotesensing 15 01661 g006
Figure 7. Temporal evolution of coupling coordination types for each county between urbanization and eco-environment in Aba Prefecture from 2001 to 2018. I-1, II-1, and III-1 represent sluggish urbanization with serious imbalance, reluctant coordination, and moderate coordination, respectively. II-3, III-3, and IV-3 represent coordinated development with reluctant coordination, moderate coordination, and high coordination, respectively. IV-2 represents eco-environment lag with high coordination.
Remotesensing 15 01661 g007
Figure 8. Urbanization impact on eco-environment for each Aba Prefecture county during the 2001–2018 period.
Remotesensing 15 01661 g008
Figure 9. Impact of eco-environment on urbanization for each Aba Prefecture county during the 2001–2018 period.
Remotesensing 15 01661 g009
Table 1. Urbanization evaluation system.
Primary IndicatorsEntropy WeightSecondary IndicatorsUnitWeightReferences
Demographic urbanization0.198Percentage of non-agriculture population%0.104[23]
Percentage of primary industry employment *%0.095
Economic urbanization0.277GDP per capitaYuan0.179[28]
Proportion of secondary and tertiary industry GDP%0.099
Spatial urbanization0.289Area of urban districtskm20.105[19]
Nighttime light intensity/0.184[47]
Social urbanization0.235Number of health technicians per 10,000 peoplePerson/10 thousand0.134[24]
Number of general education teachers per 10,000 peoplePerson/10 thousand0.101[48]
Note: * represents a negative indicator. Indicator weight was calculated using the entropy weight method.
Table 2. Eco-environment quality evaluation system.
Primary Indicators Entropy Weight Secondary IndicatorsUnitWeightReferences
eco-environmental level0.274Fraction of vegetation coverage%0.119[49]
Net primary productivitykg·C/m20.156[52]
eco-environmental pressure0.359Coverage of arable land *%0.182[15]
Number of livestock *Sheep unit/km20.177[53]
eco-environmental structure0.367Coverage of forest%0.183[28]
Coverage of grassland%0.183[54]
Note: * represents a negative indicator. Indicator weight was calculated using the entropy weight method.
Table 3. Coupling coordination degree classification.
Composite CategoryCoordination LevelSubcategorySystematic Exponential ComparisonType
Coordinated development0.7 < D ≤ 1High coordinationE-U > 0.1Sluggish urbanization (IV-1)
U-E > 0.1Ecological environment lag (IV-2)
|E-U| < 0.1Coordinated development (IV-3)
Transformation development0.6 < D ≤ 0.7Moderate coordinationE-U > 0.1Sluggish urbanization (III-1)
U-E > 0.1Ecological environment lag (III-2)
|E-U| < 0.1Coordinated development (III-3)
Uncoordinated development0.4 < D ≤ 0.6Reluctant coordinationE-U > 0.1Sluggish urbanization (II-1)
U-E > 0.1Ecological environment lag (II-2)
|E-U| < 0.1Coordinated development (II-3)
0 < D ≤ 0.4Serious imbalanceE-U > 0.1Sluggish urbanization (I-1)
U-E > 0.1Ecological environment lag (I-2)
|E-U| < 0.1Coordinated development (I-3)
Table 4. GTWR model results of taking CUI and CEI as the dependent variable.
Dependent VariableVariableEstimated Value
CUIR20.9403
Spatio-temporal Distance Ratio0.3649
Final Bandwidth0.1150
Residual Squares0.0691
Sigma0.0172
AICc−1161.68
CEIR20.9417
Spatio-temporal Distance Ratio0.5418
Final Bandwidth0.1150
Residual Squares0.3461
Sigma0.0385
AICc−752.69
Disclaimer/Publisher’s Note: The statements, opinions and data contained in all publications are solely those of the individual author(s) and contributor(s) and not of MDPI and/or the editor(s). MDPI and/or the editor(s) disclaim responsibility for any injury to people or property resulting from any ideas, methods, instructions or products referred to in the content.

