
New Lunar Crater Production Function Based on High-Resolution Images


Abstract
:1. Introduction
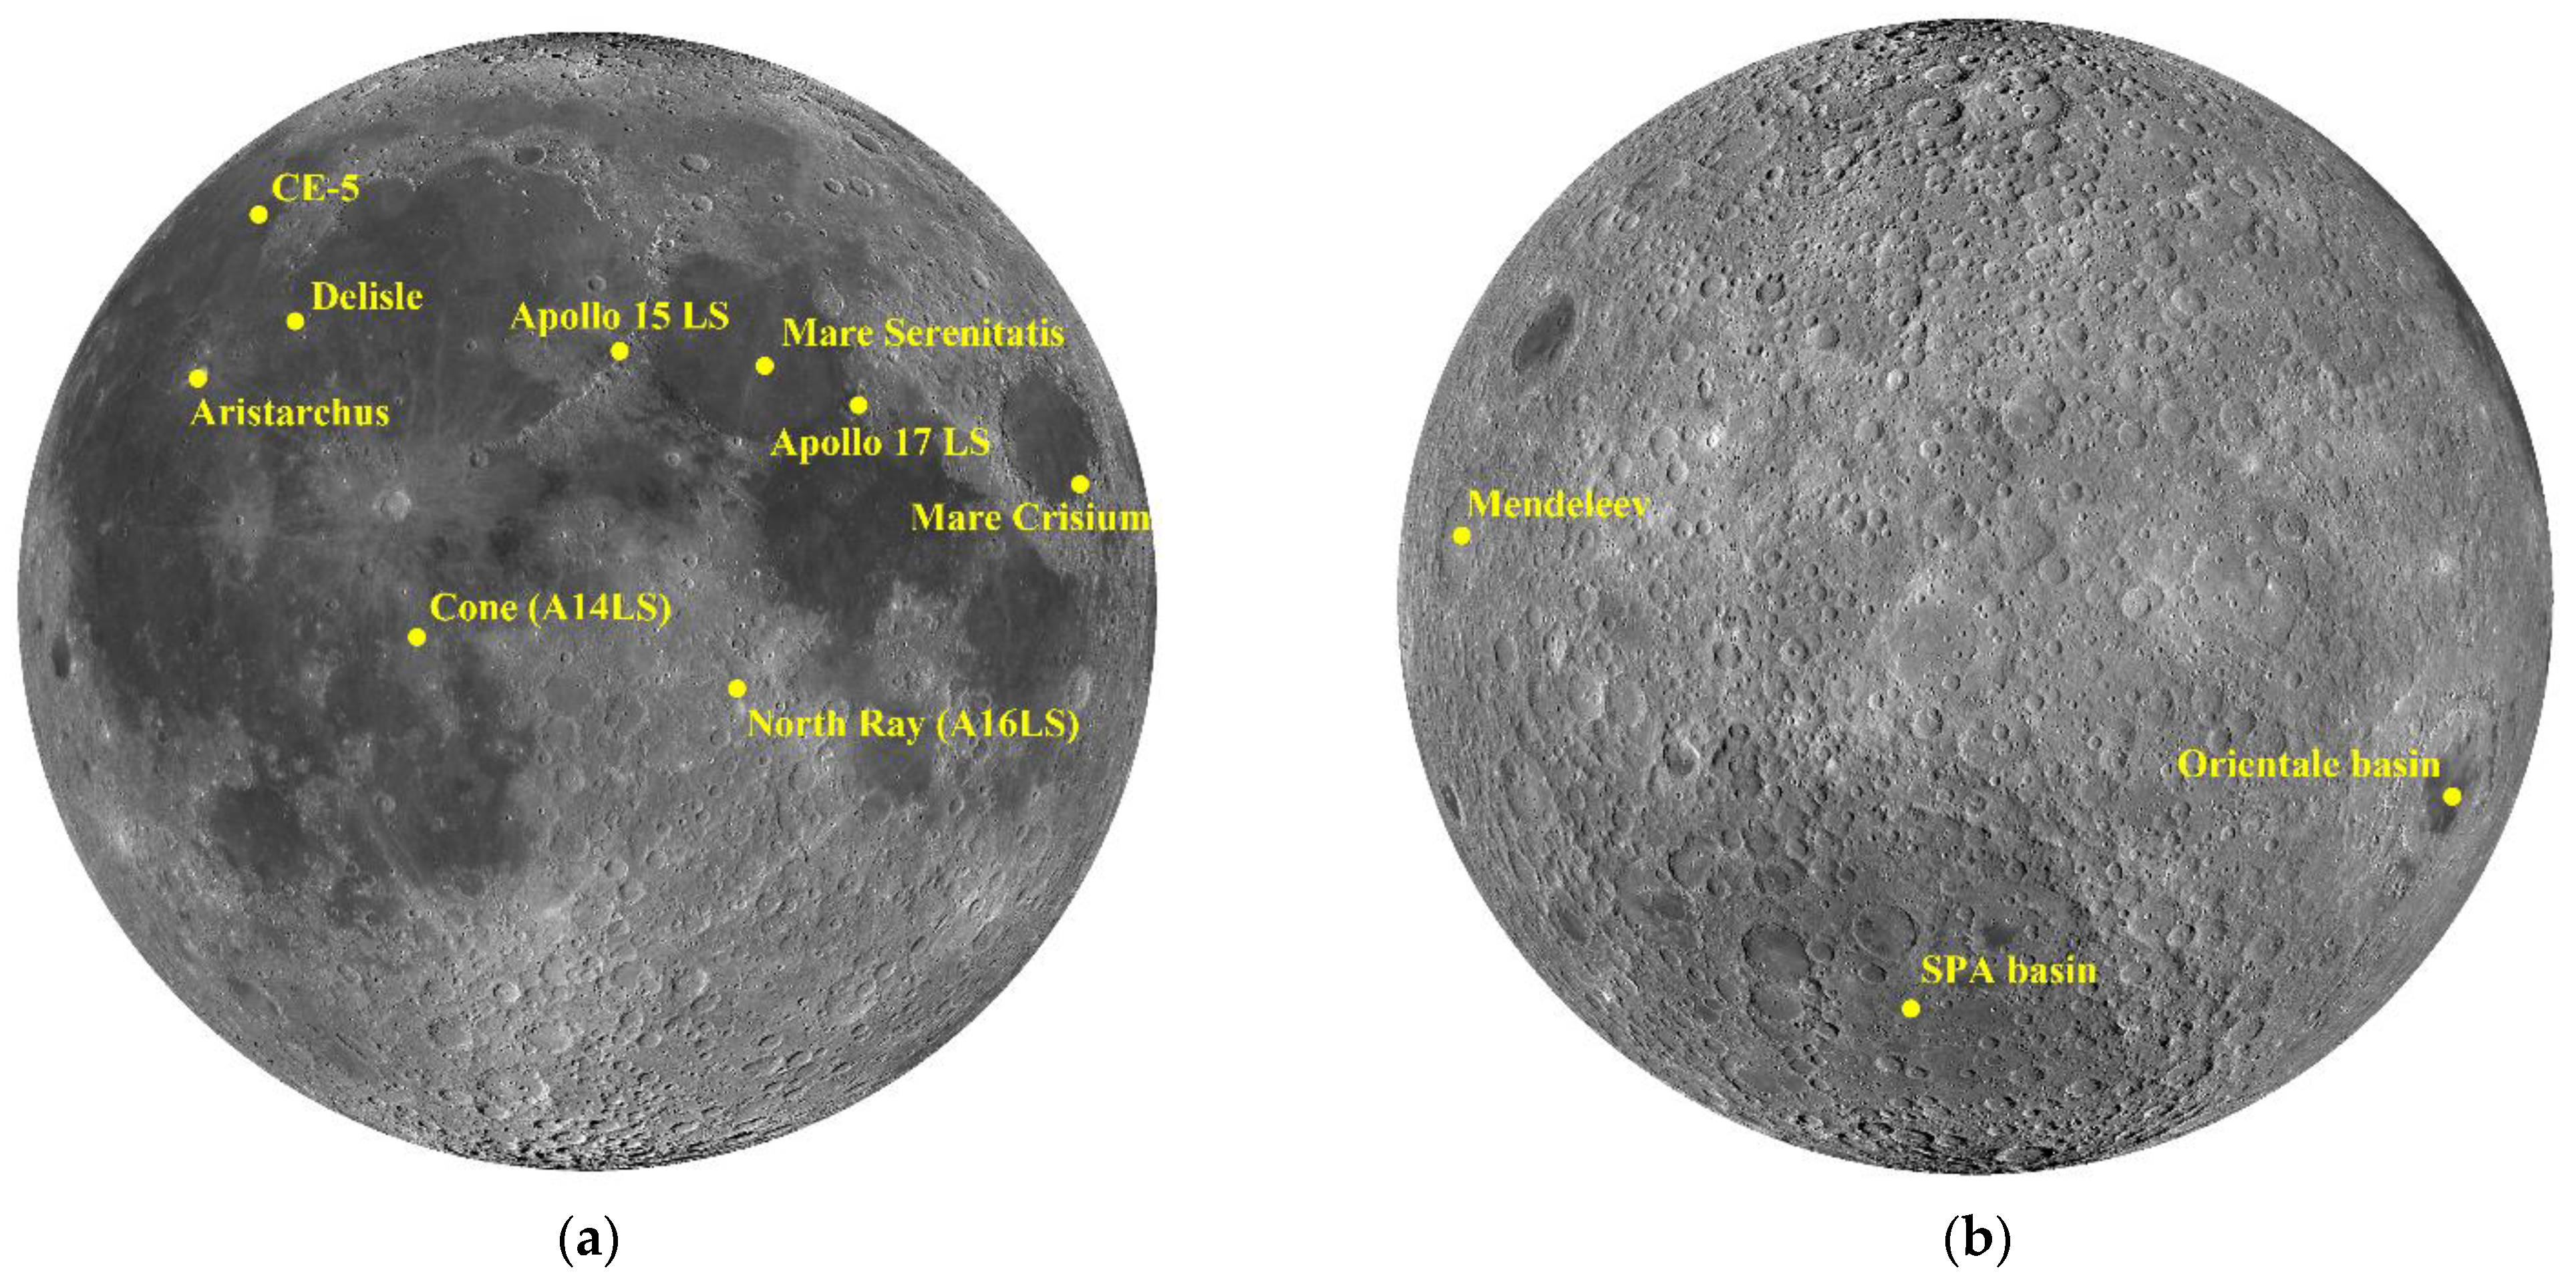
2. Data Sets
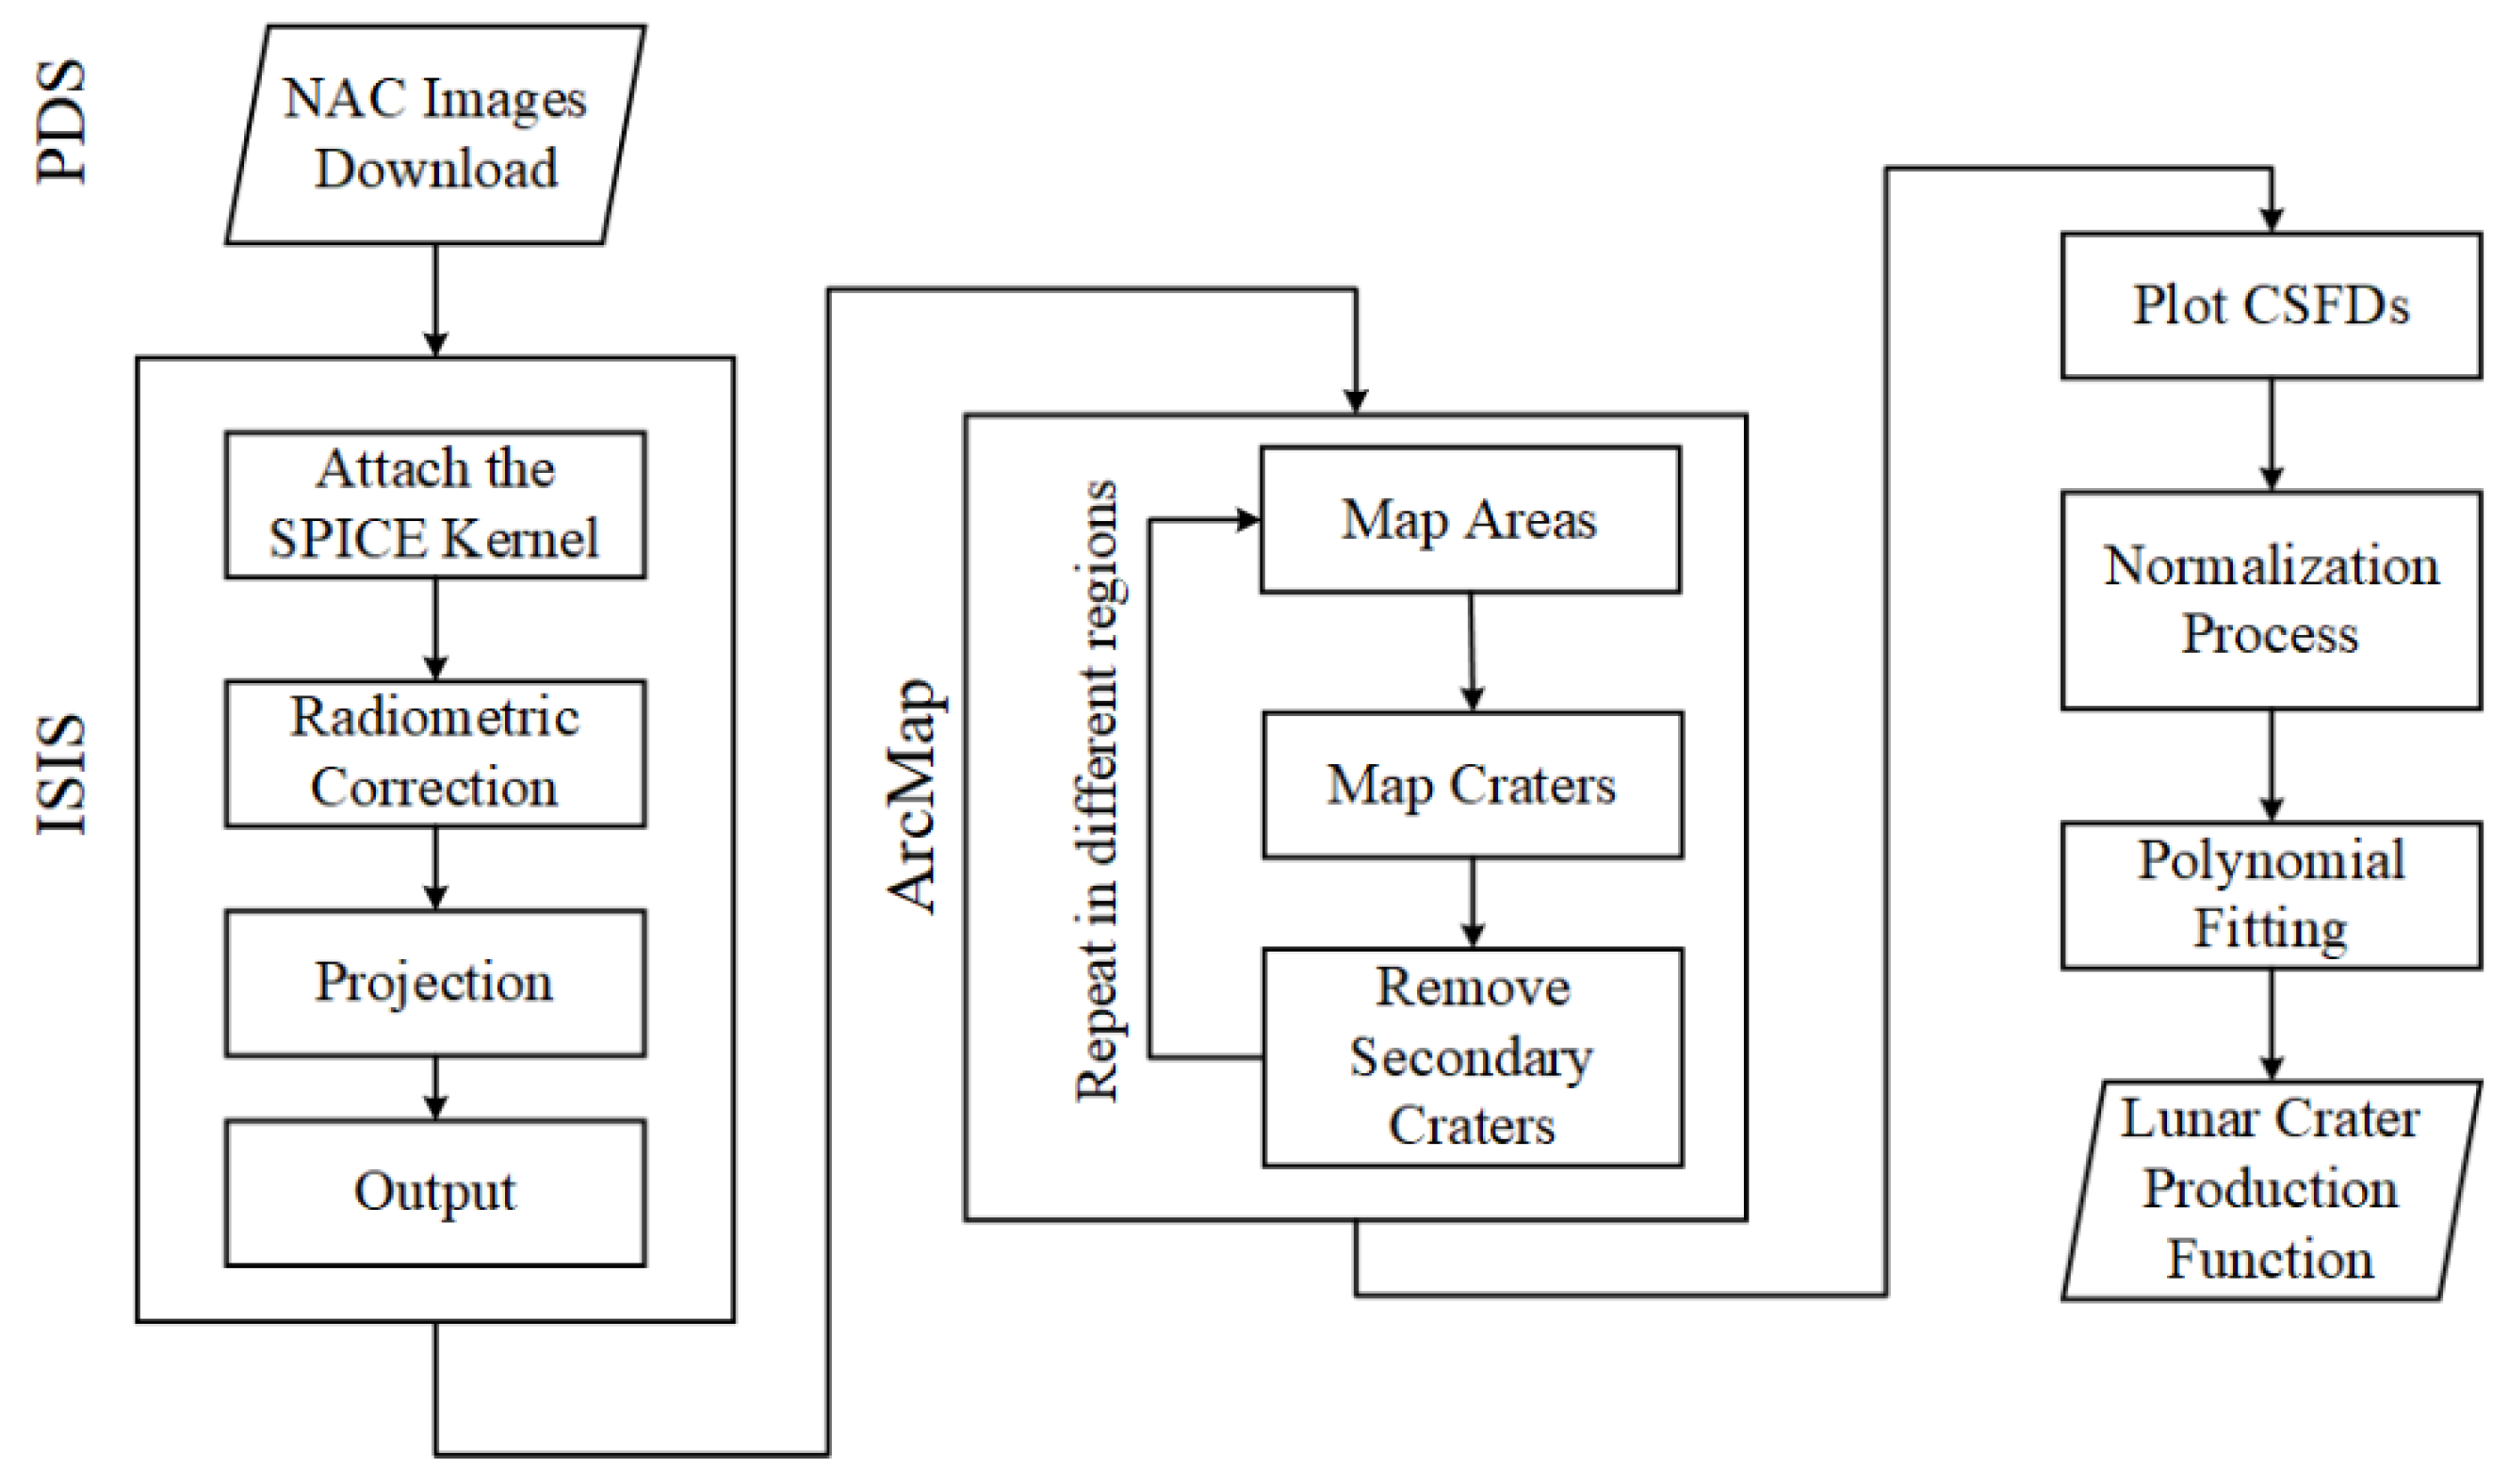
3. Method
3.1. NAC Images Processing
3.2. Counting Area Mapping
3.3. Mapping Craters
- (1)
- The interior of the impact crater is of high contrast in optical imagery for most cases due to shadowing effects.
- (2)
- The impact crater rim is generally circular or elliptical in shape.
- (3)
- The crater is usually expressed as an elevated rim surrounding a depressed cavity. Some shallow or degraded craters may not have elevated rims, but they can still be identified based on the shadowing effect.
3.4. PF Normalization and Fitting
4. Results
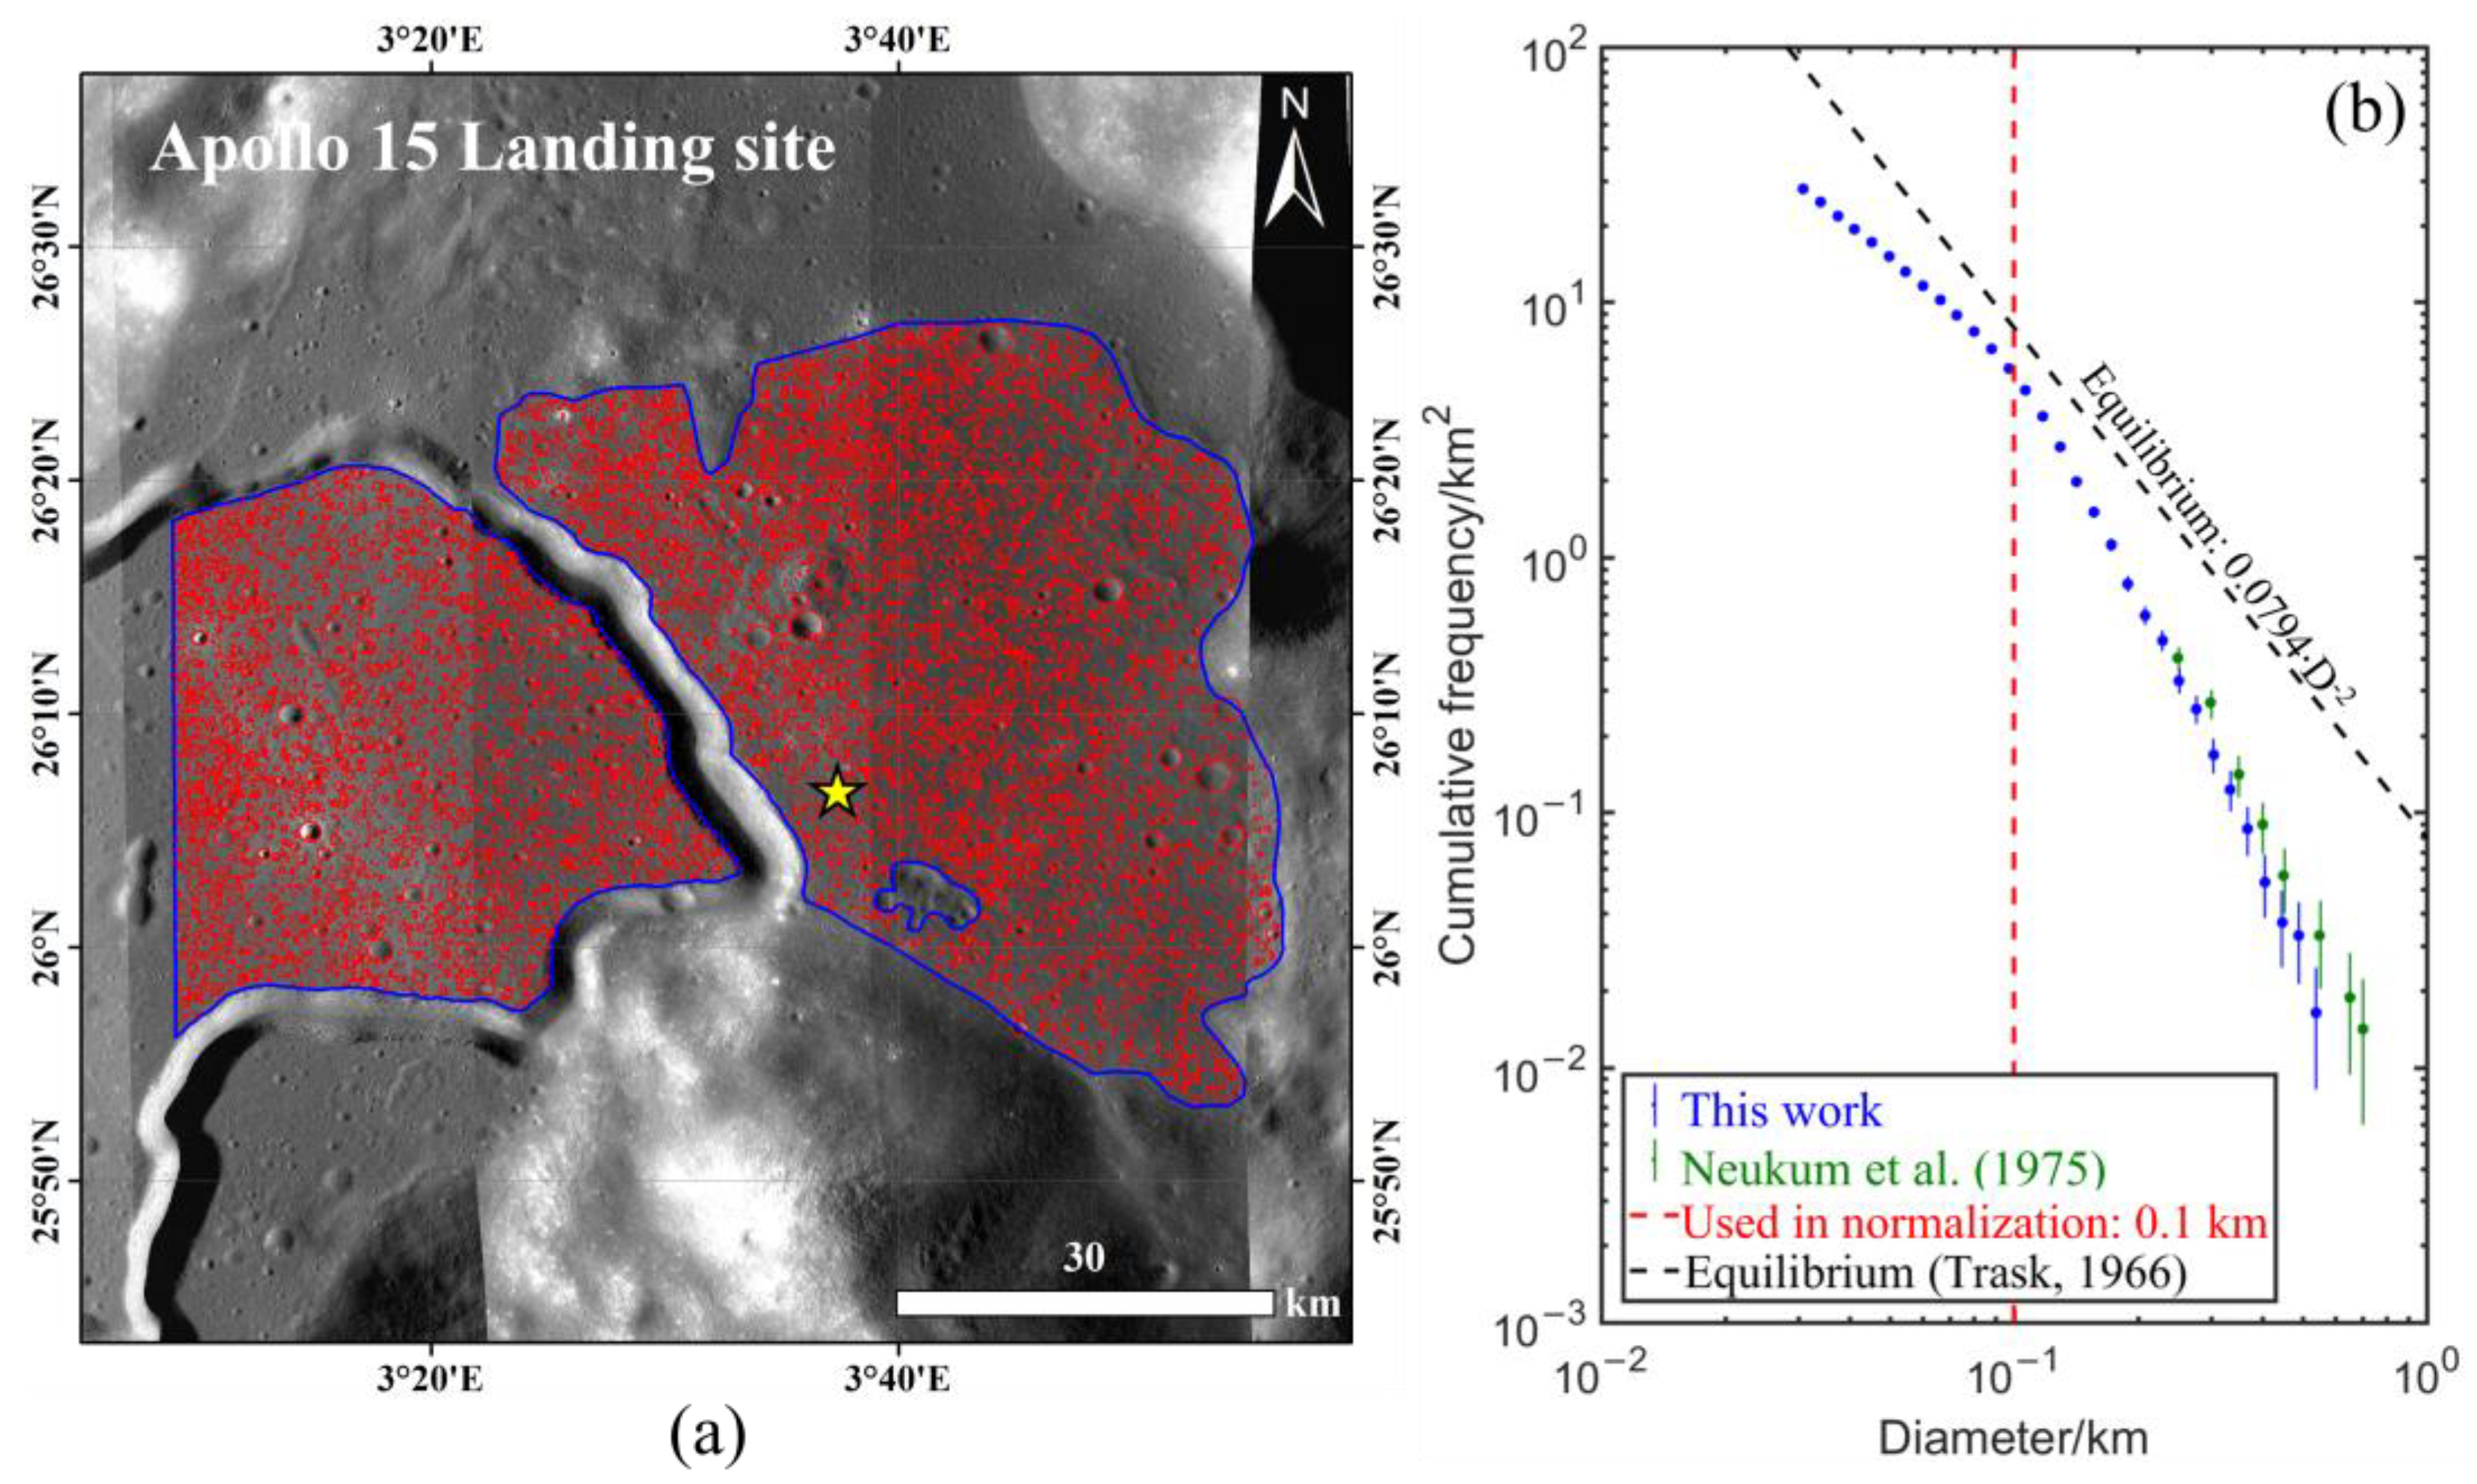
4.1. Apollo 15 Landing Site (A15LS)
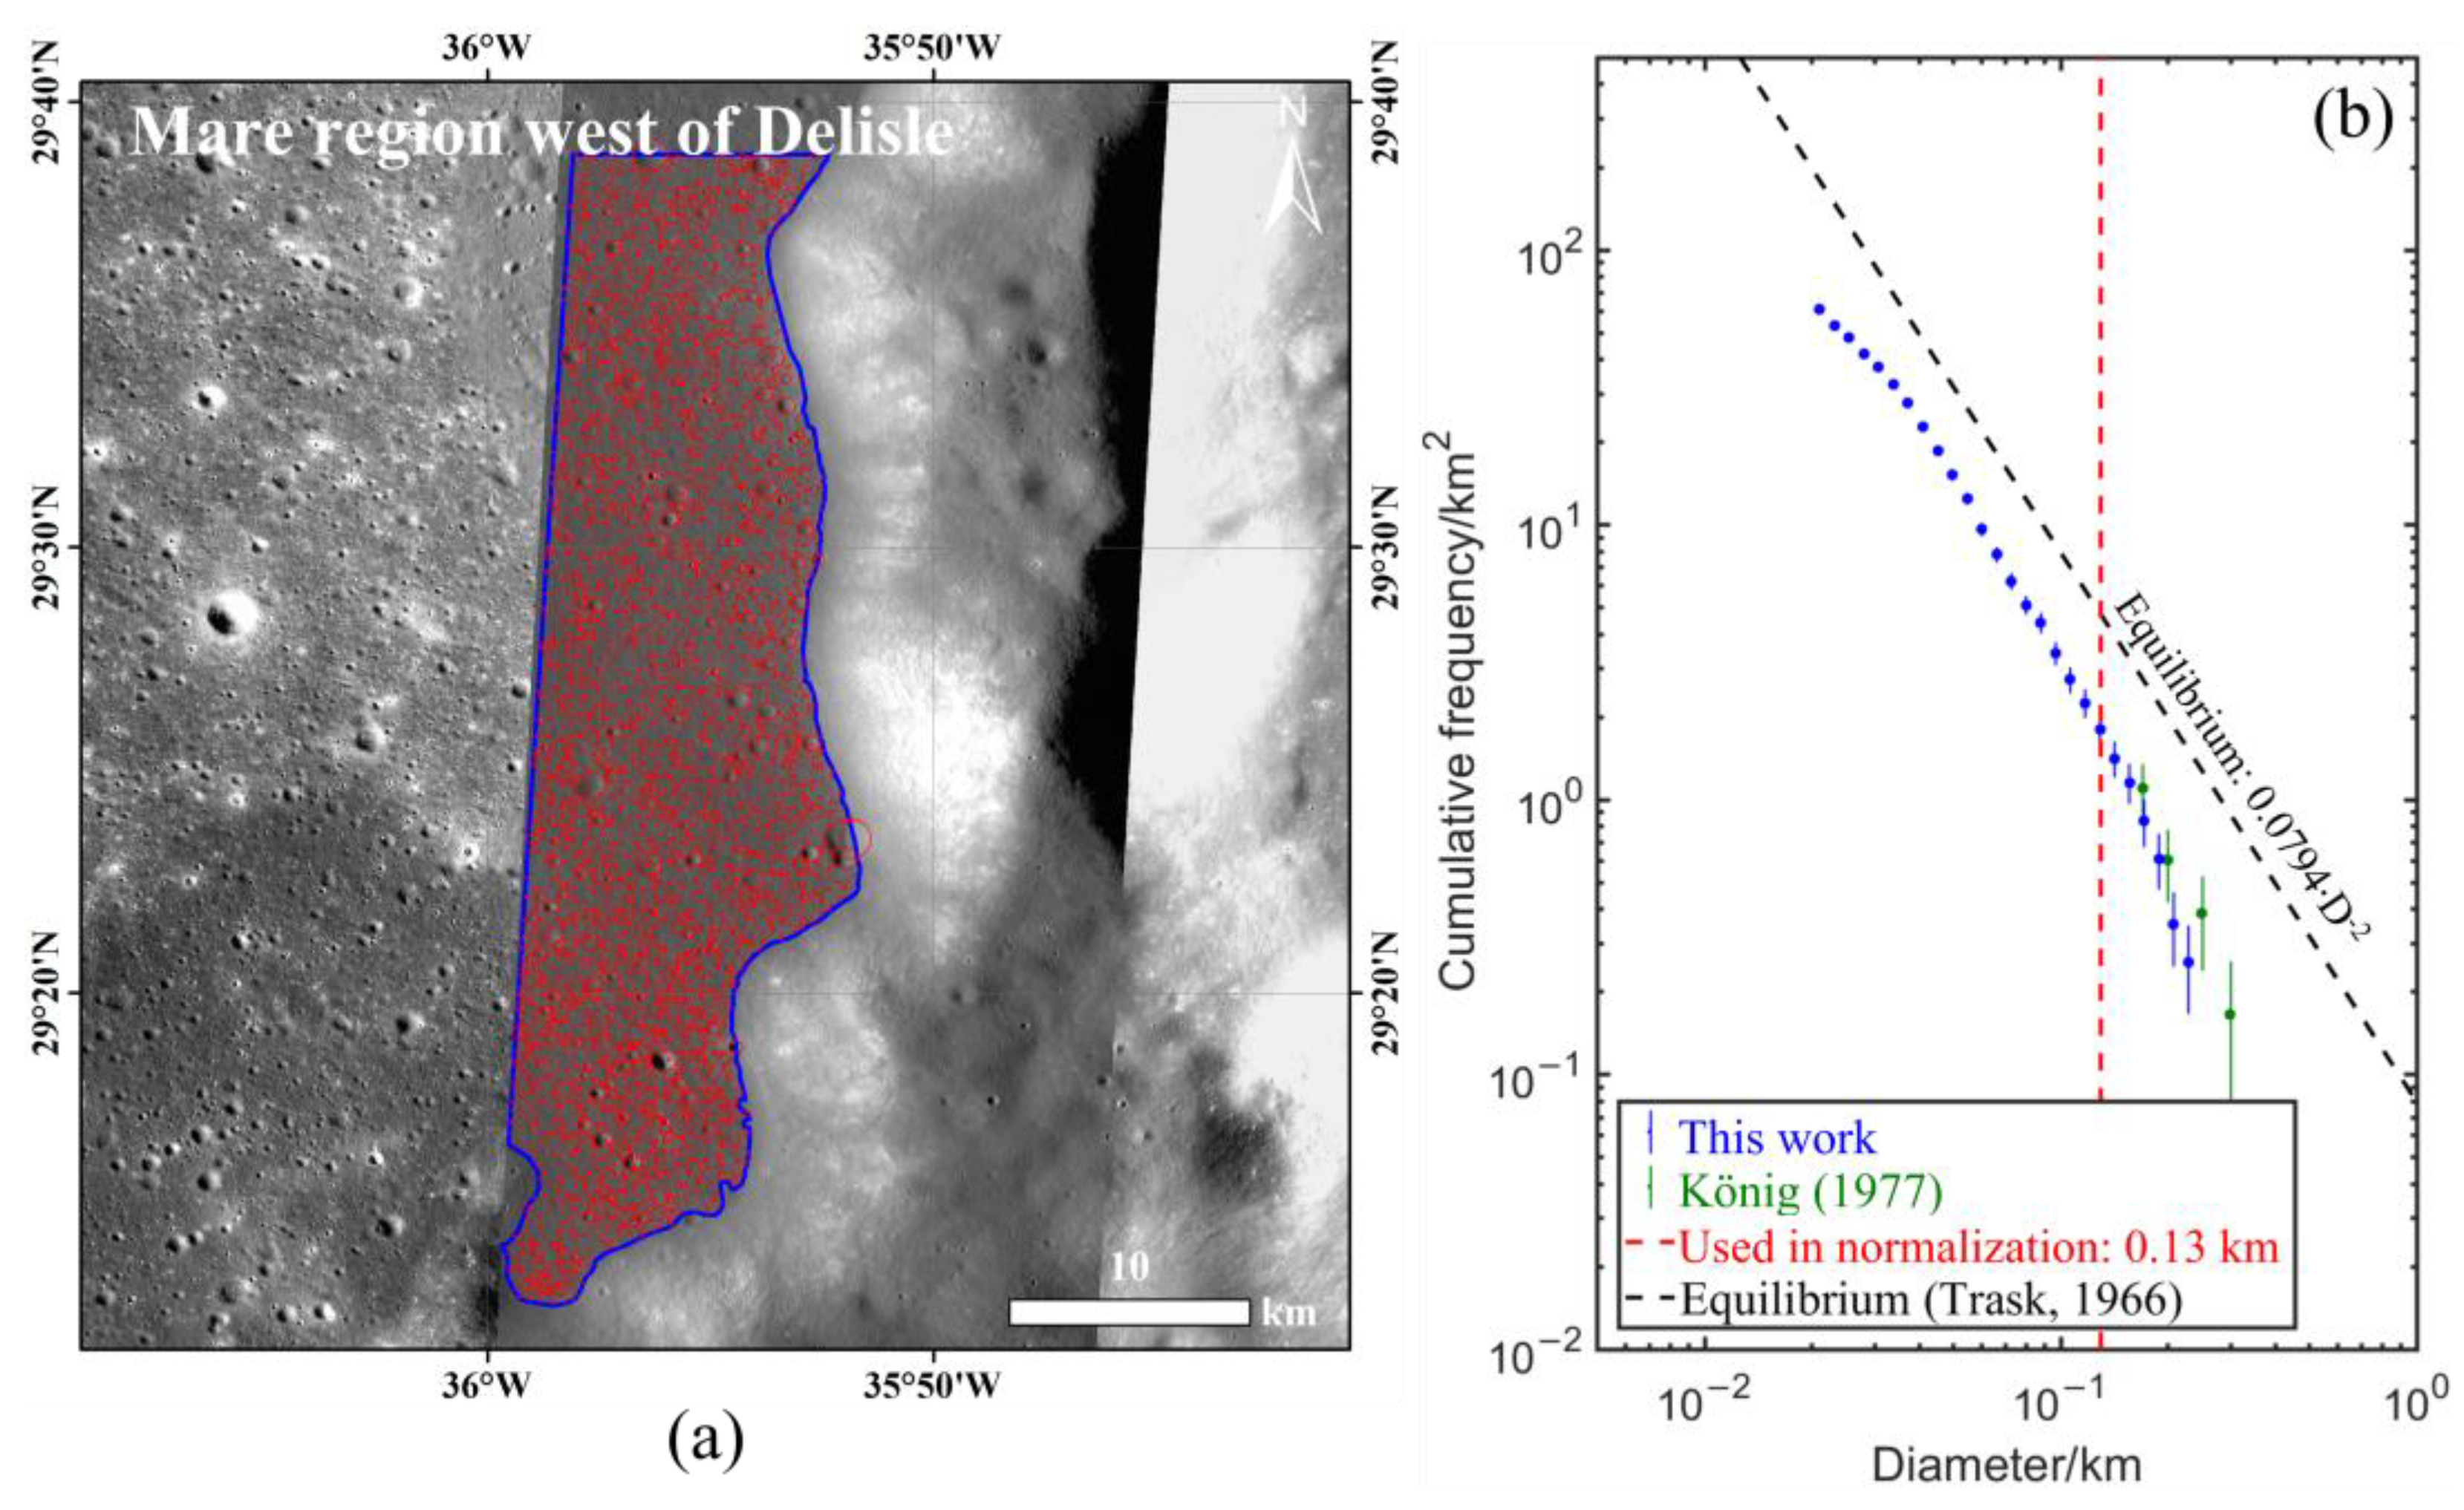
4.2. Mare Region West of Delisle
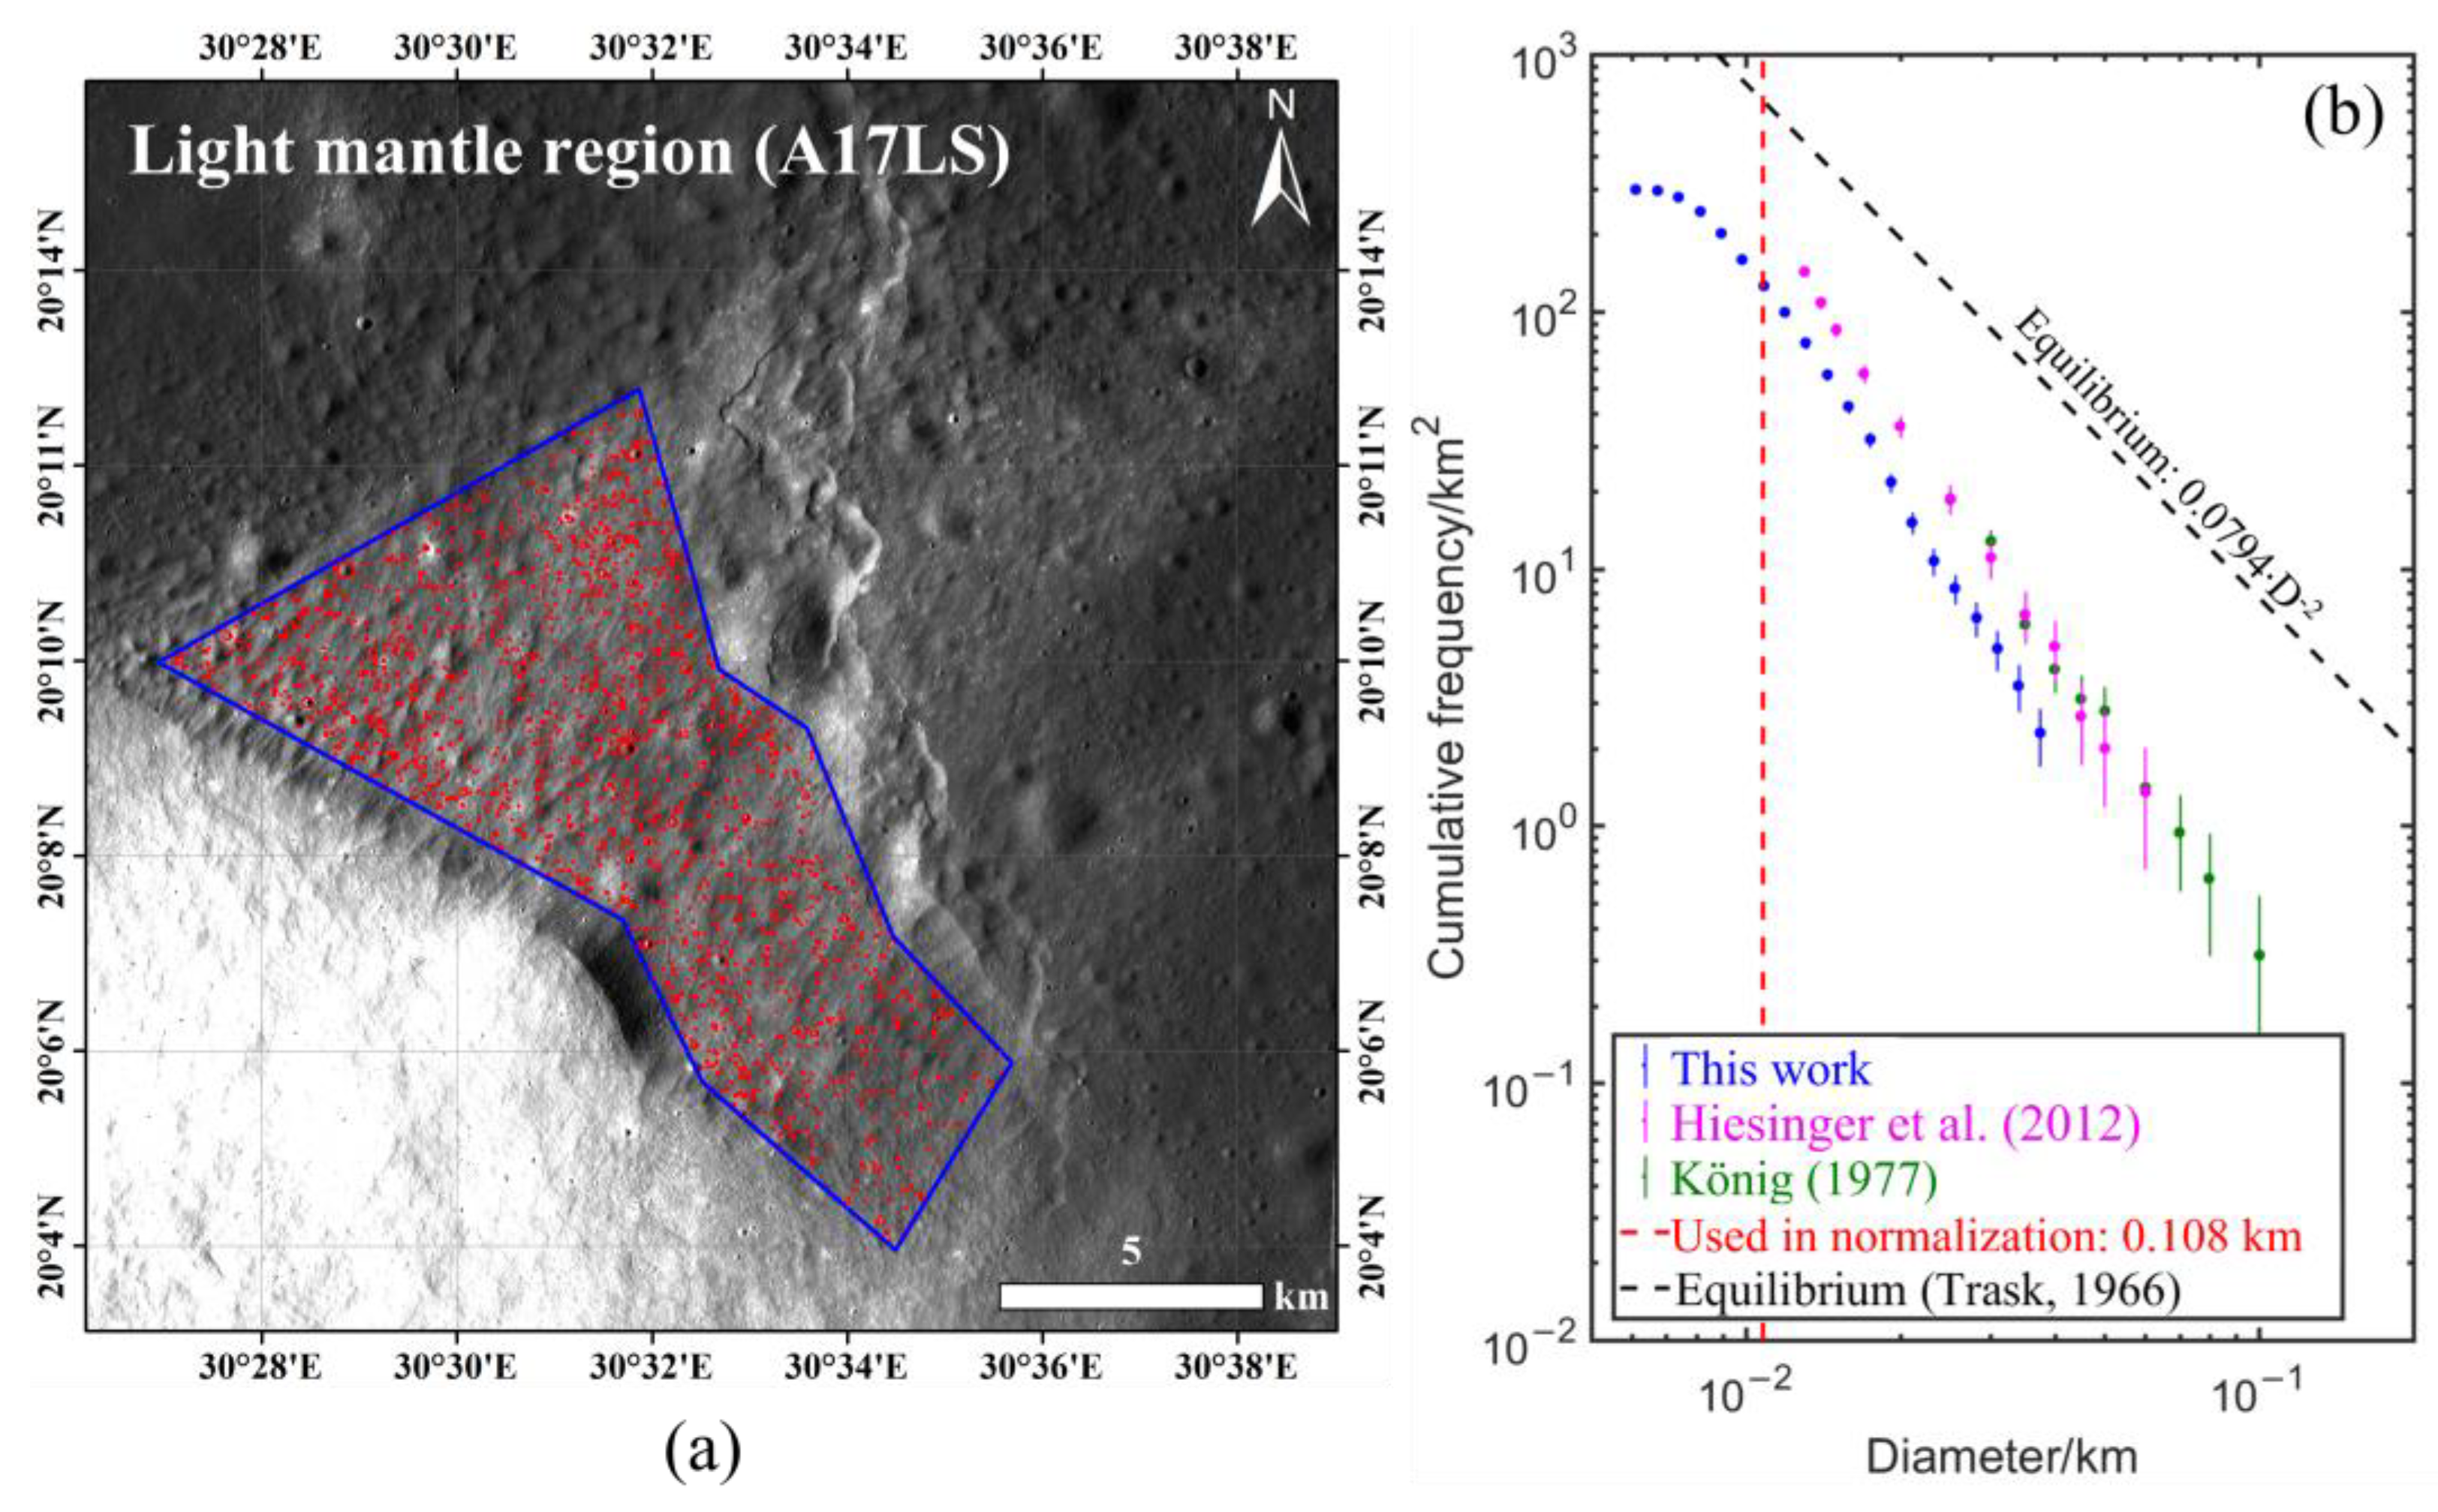
4.3. Light Mantle Region of Apollo 17 Landing Site (A17LS)
4.4. North Ray Crater (Apollo 16LS)
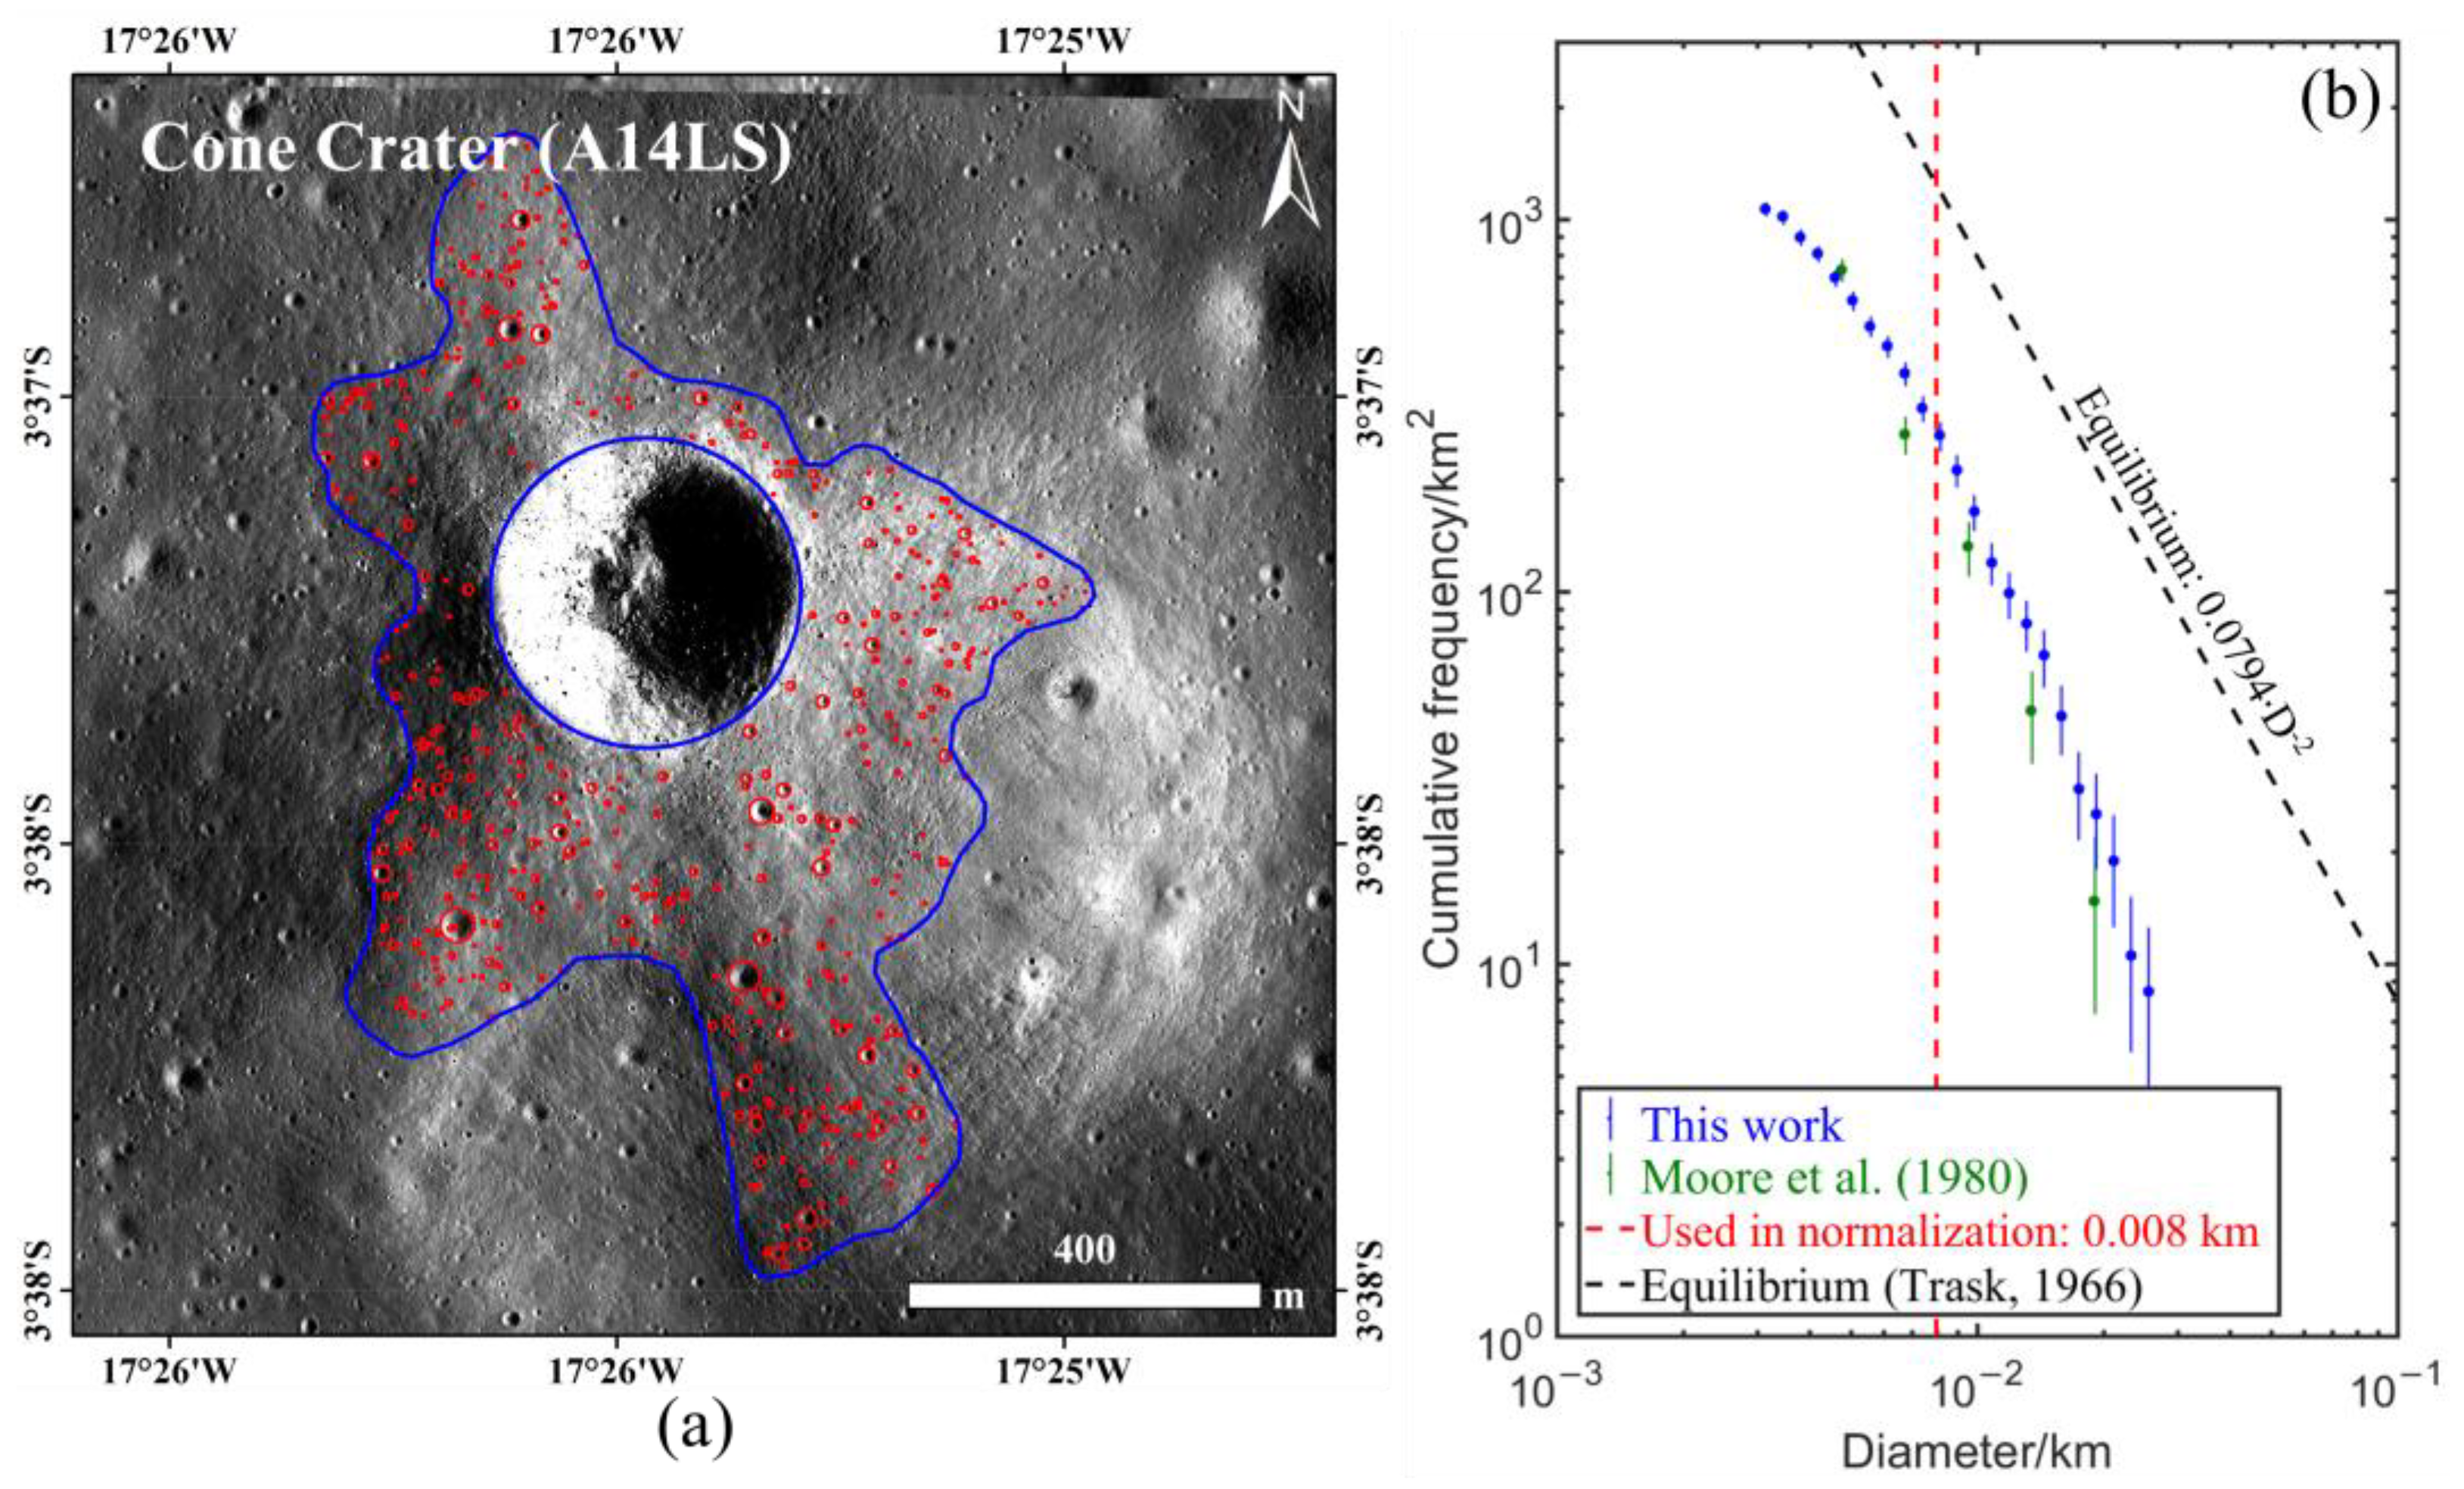
4.5. Cone Crater (Apollo 14LS)
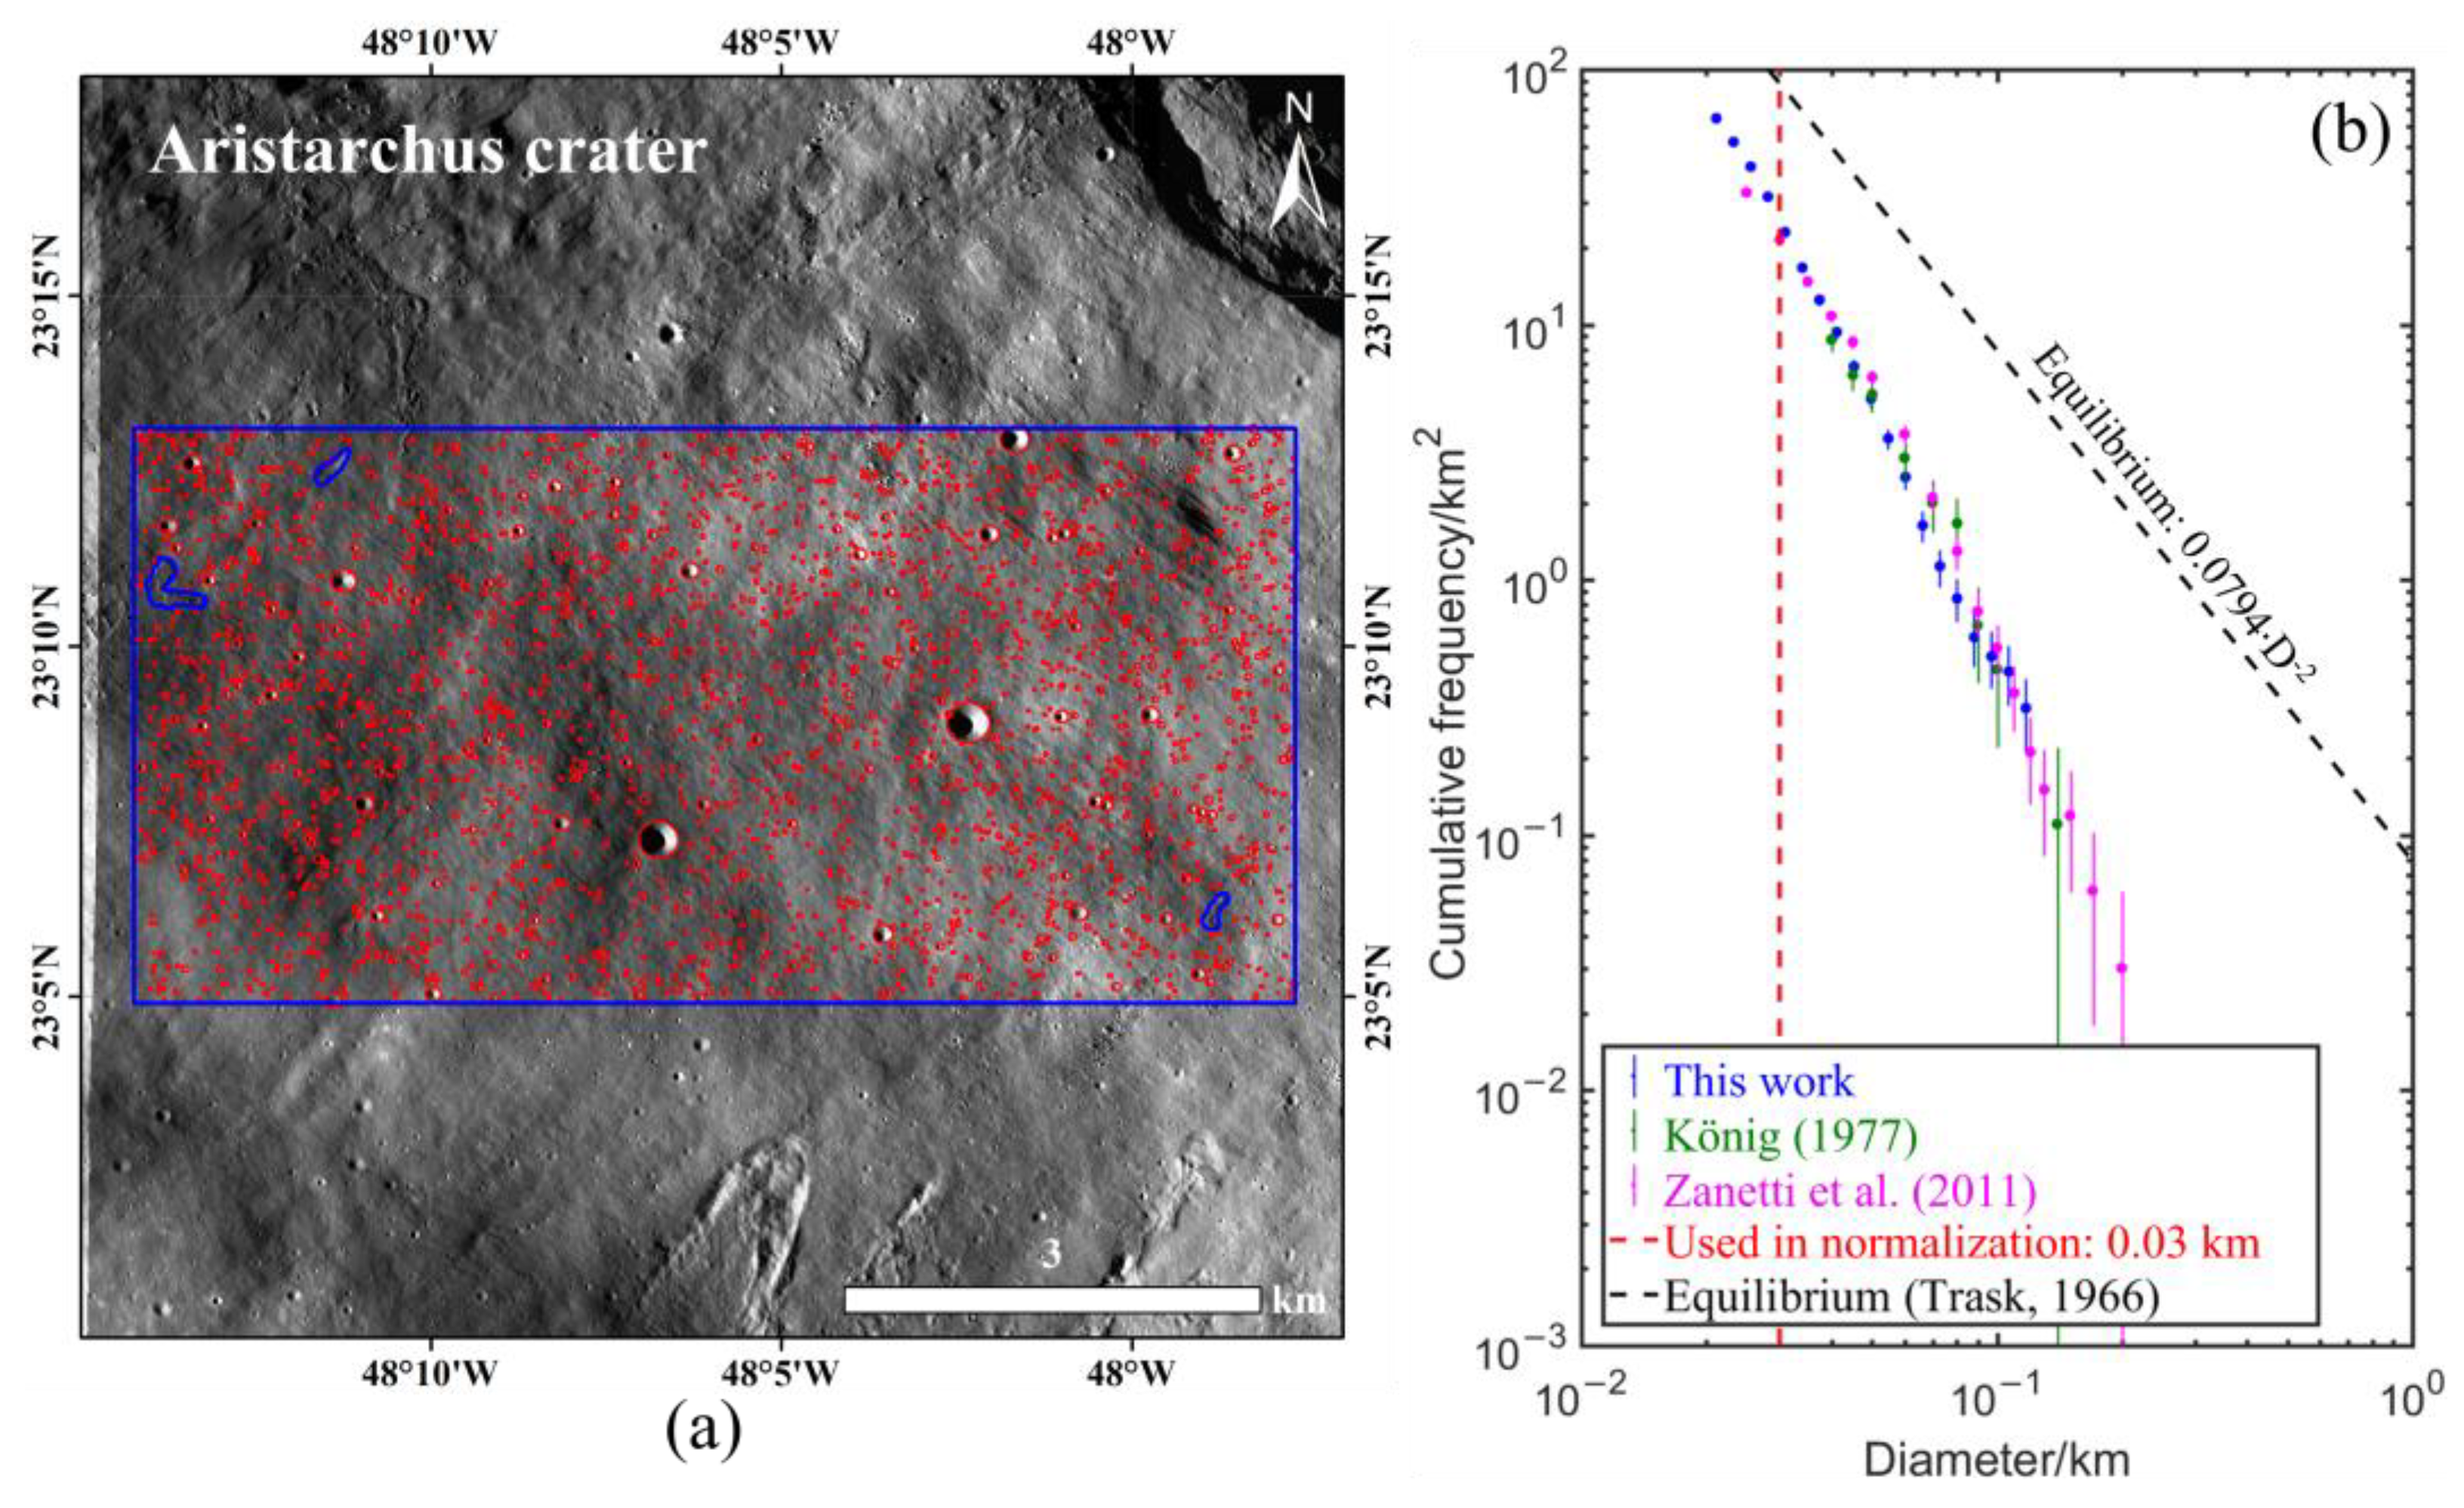
4.6. Aristarchus Crater
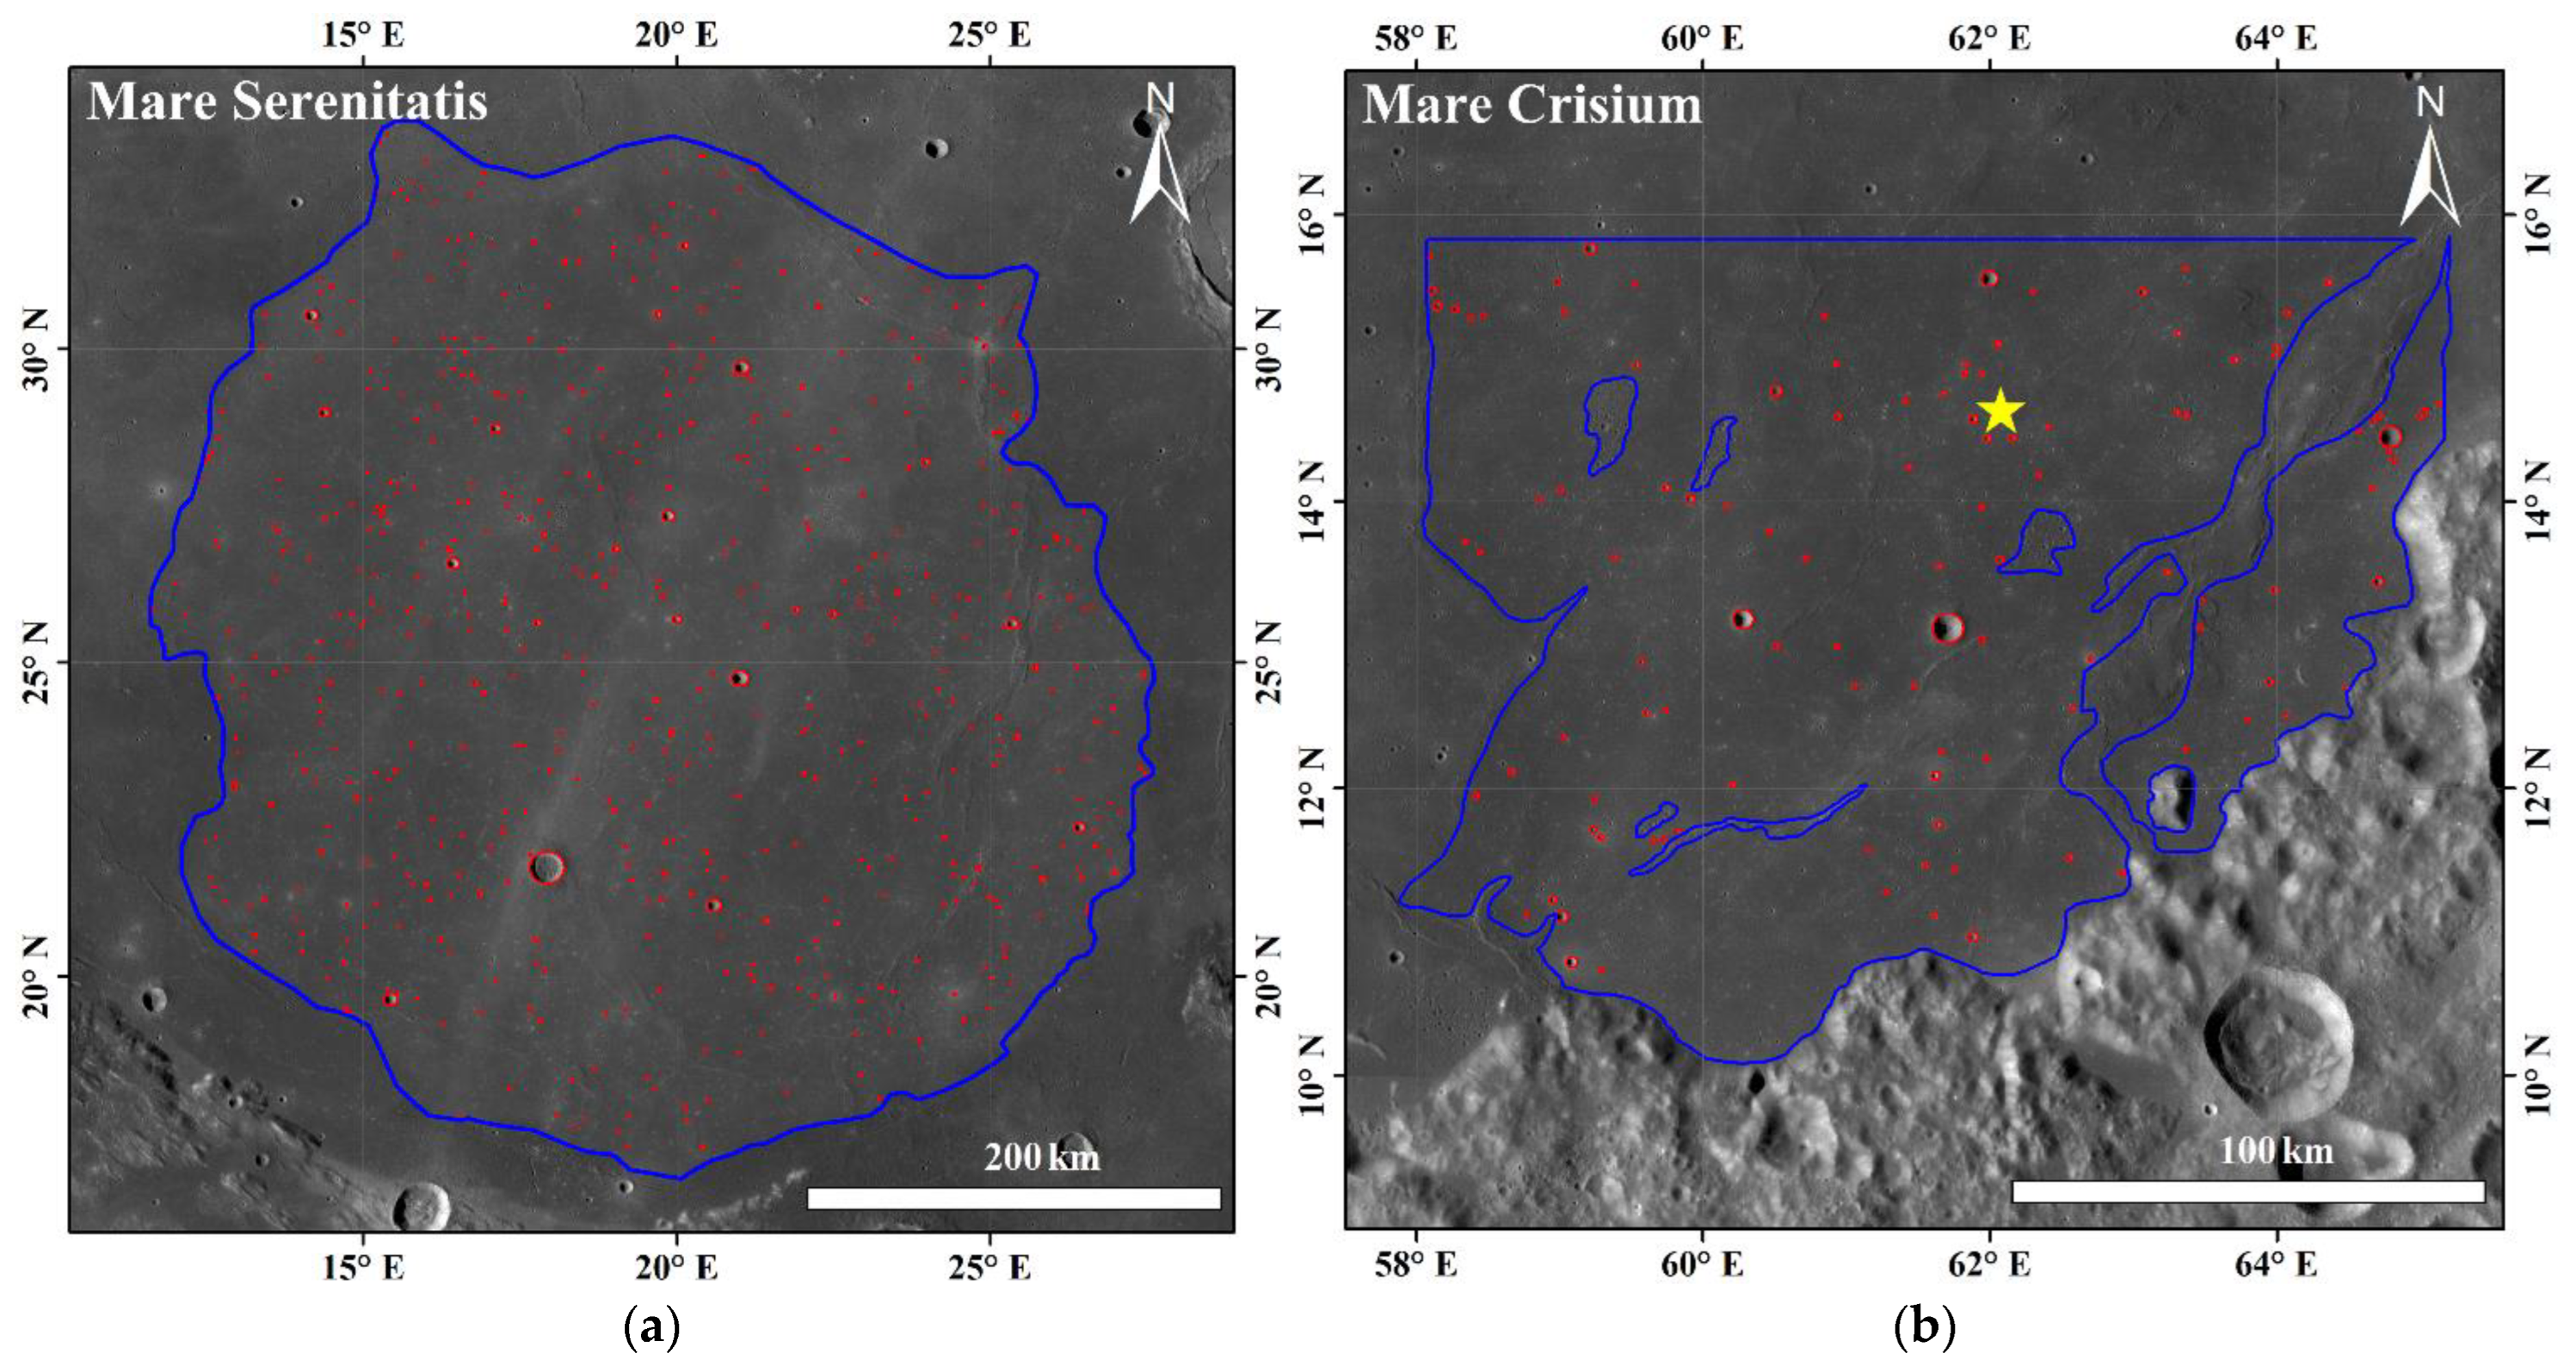
4.7. Other Regions


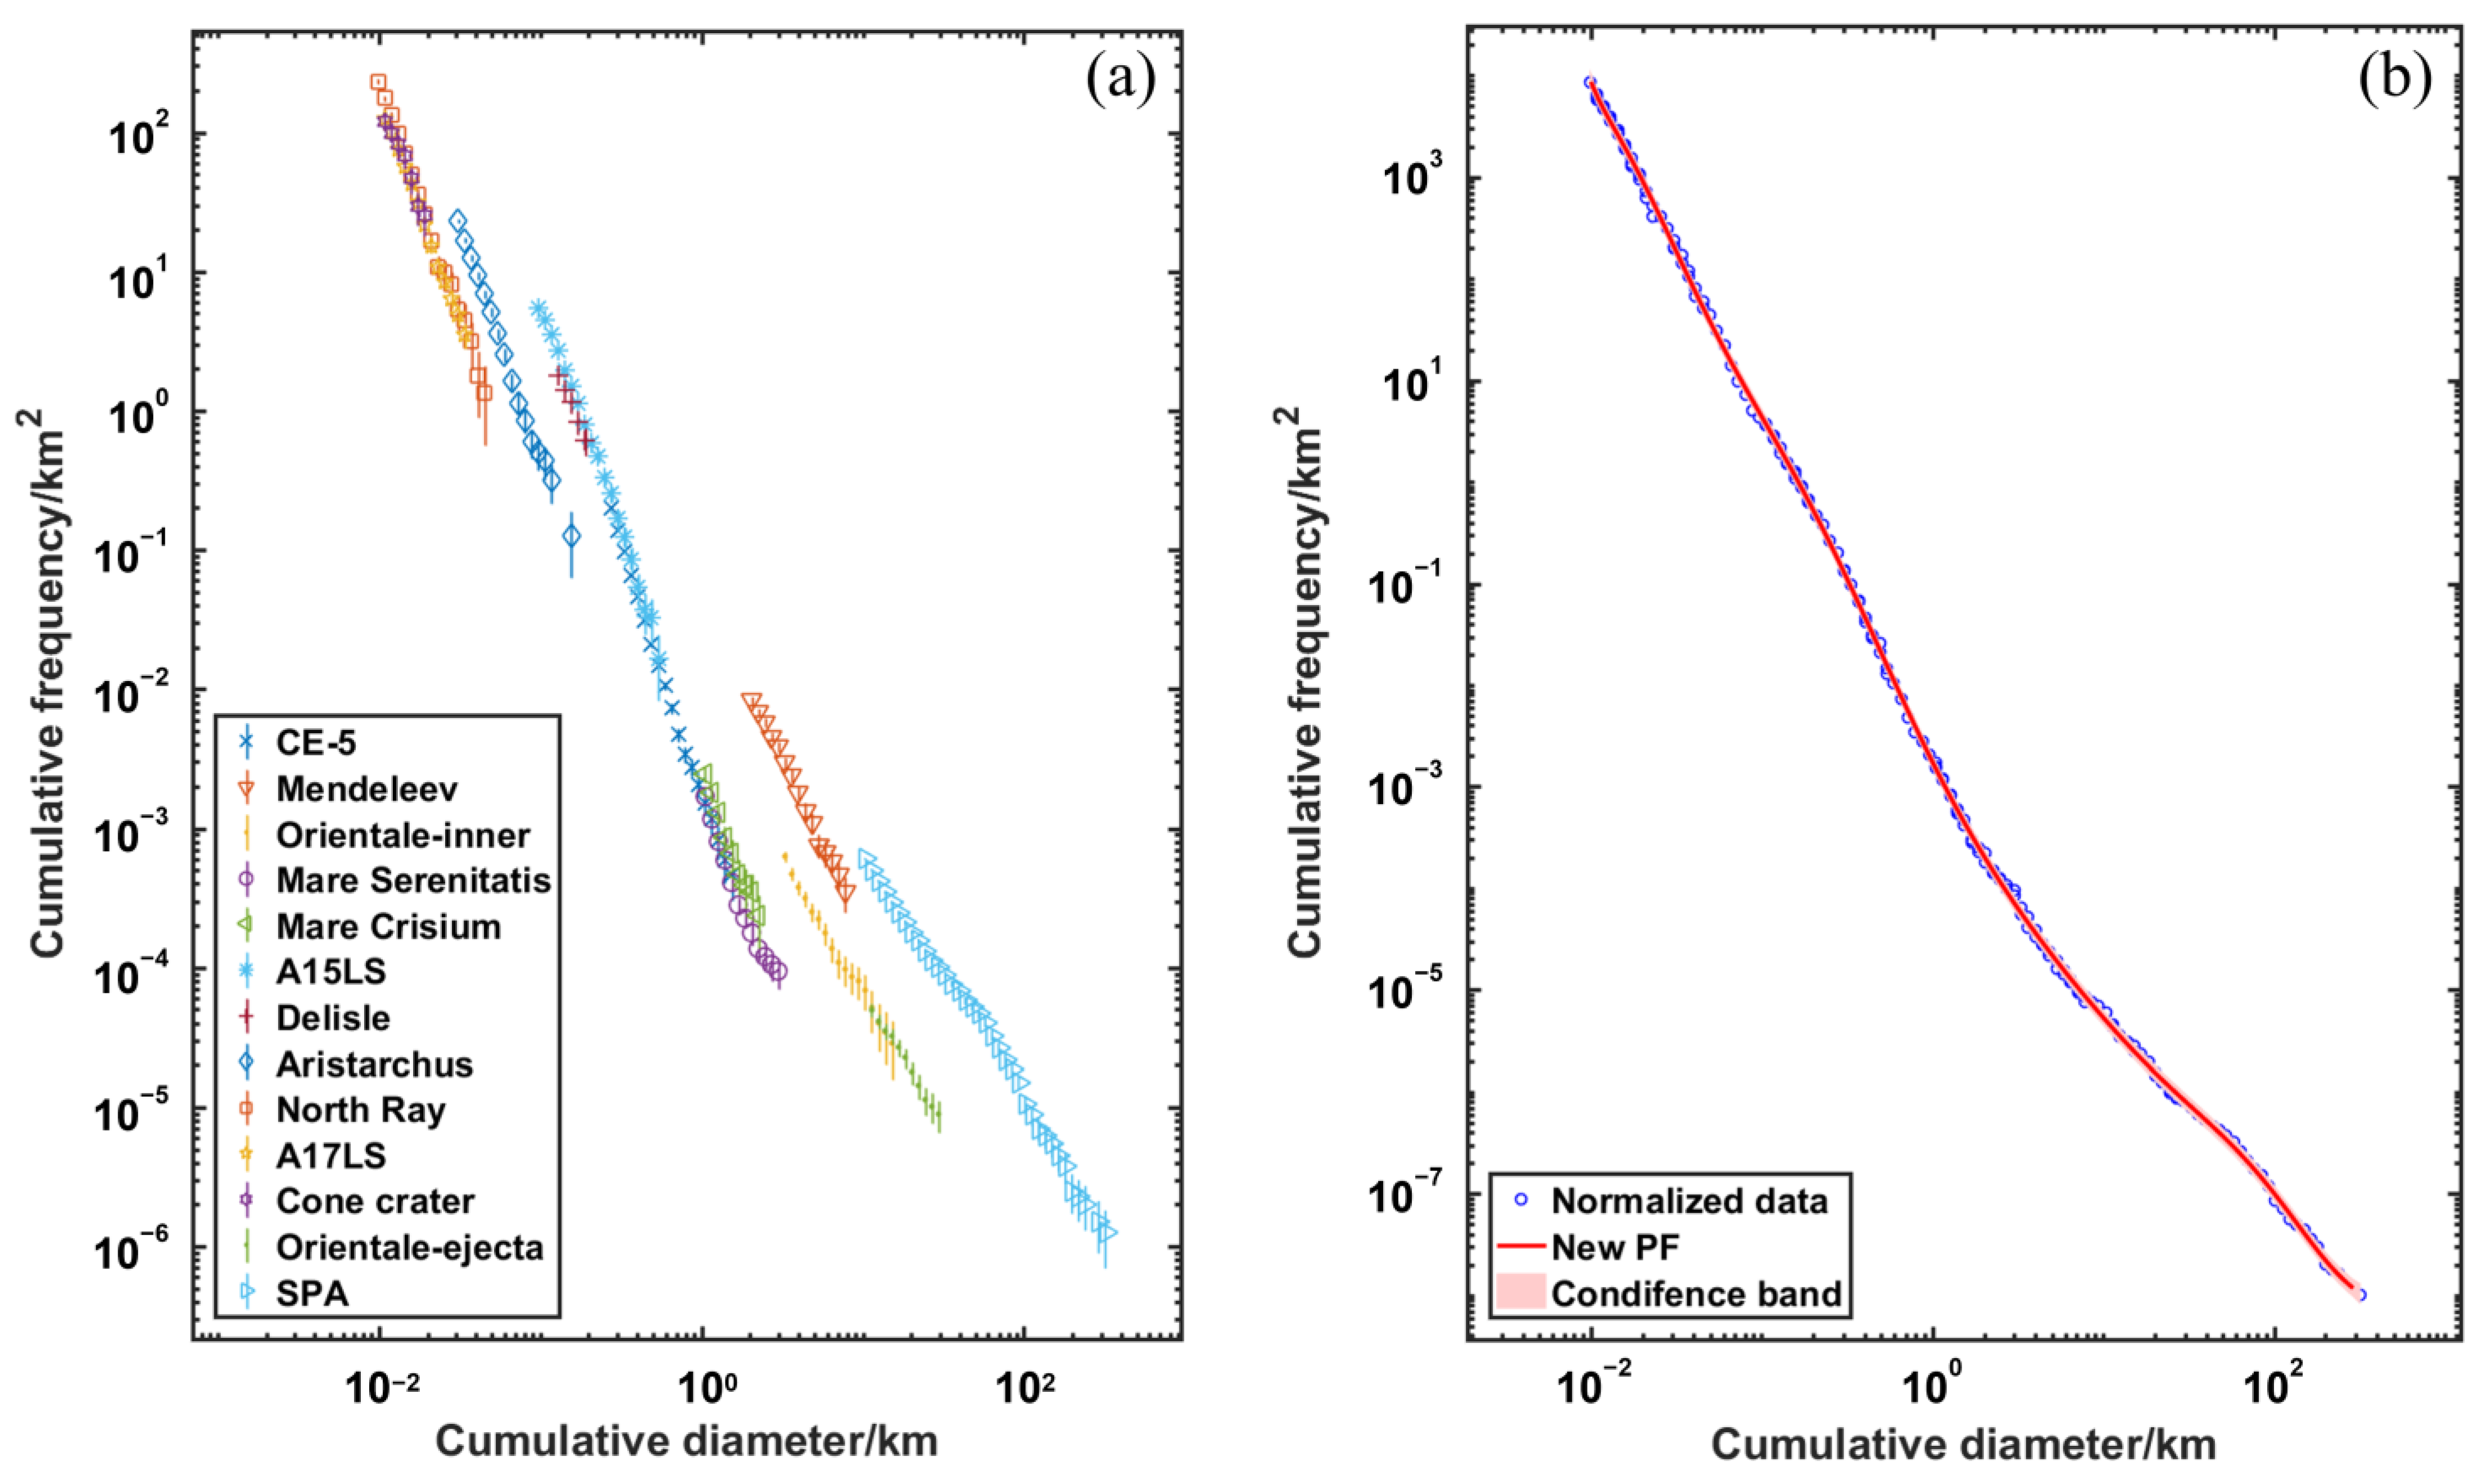
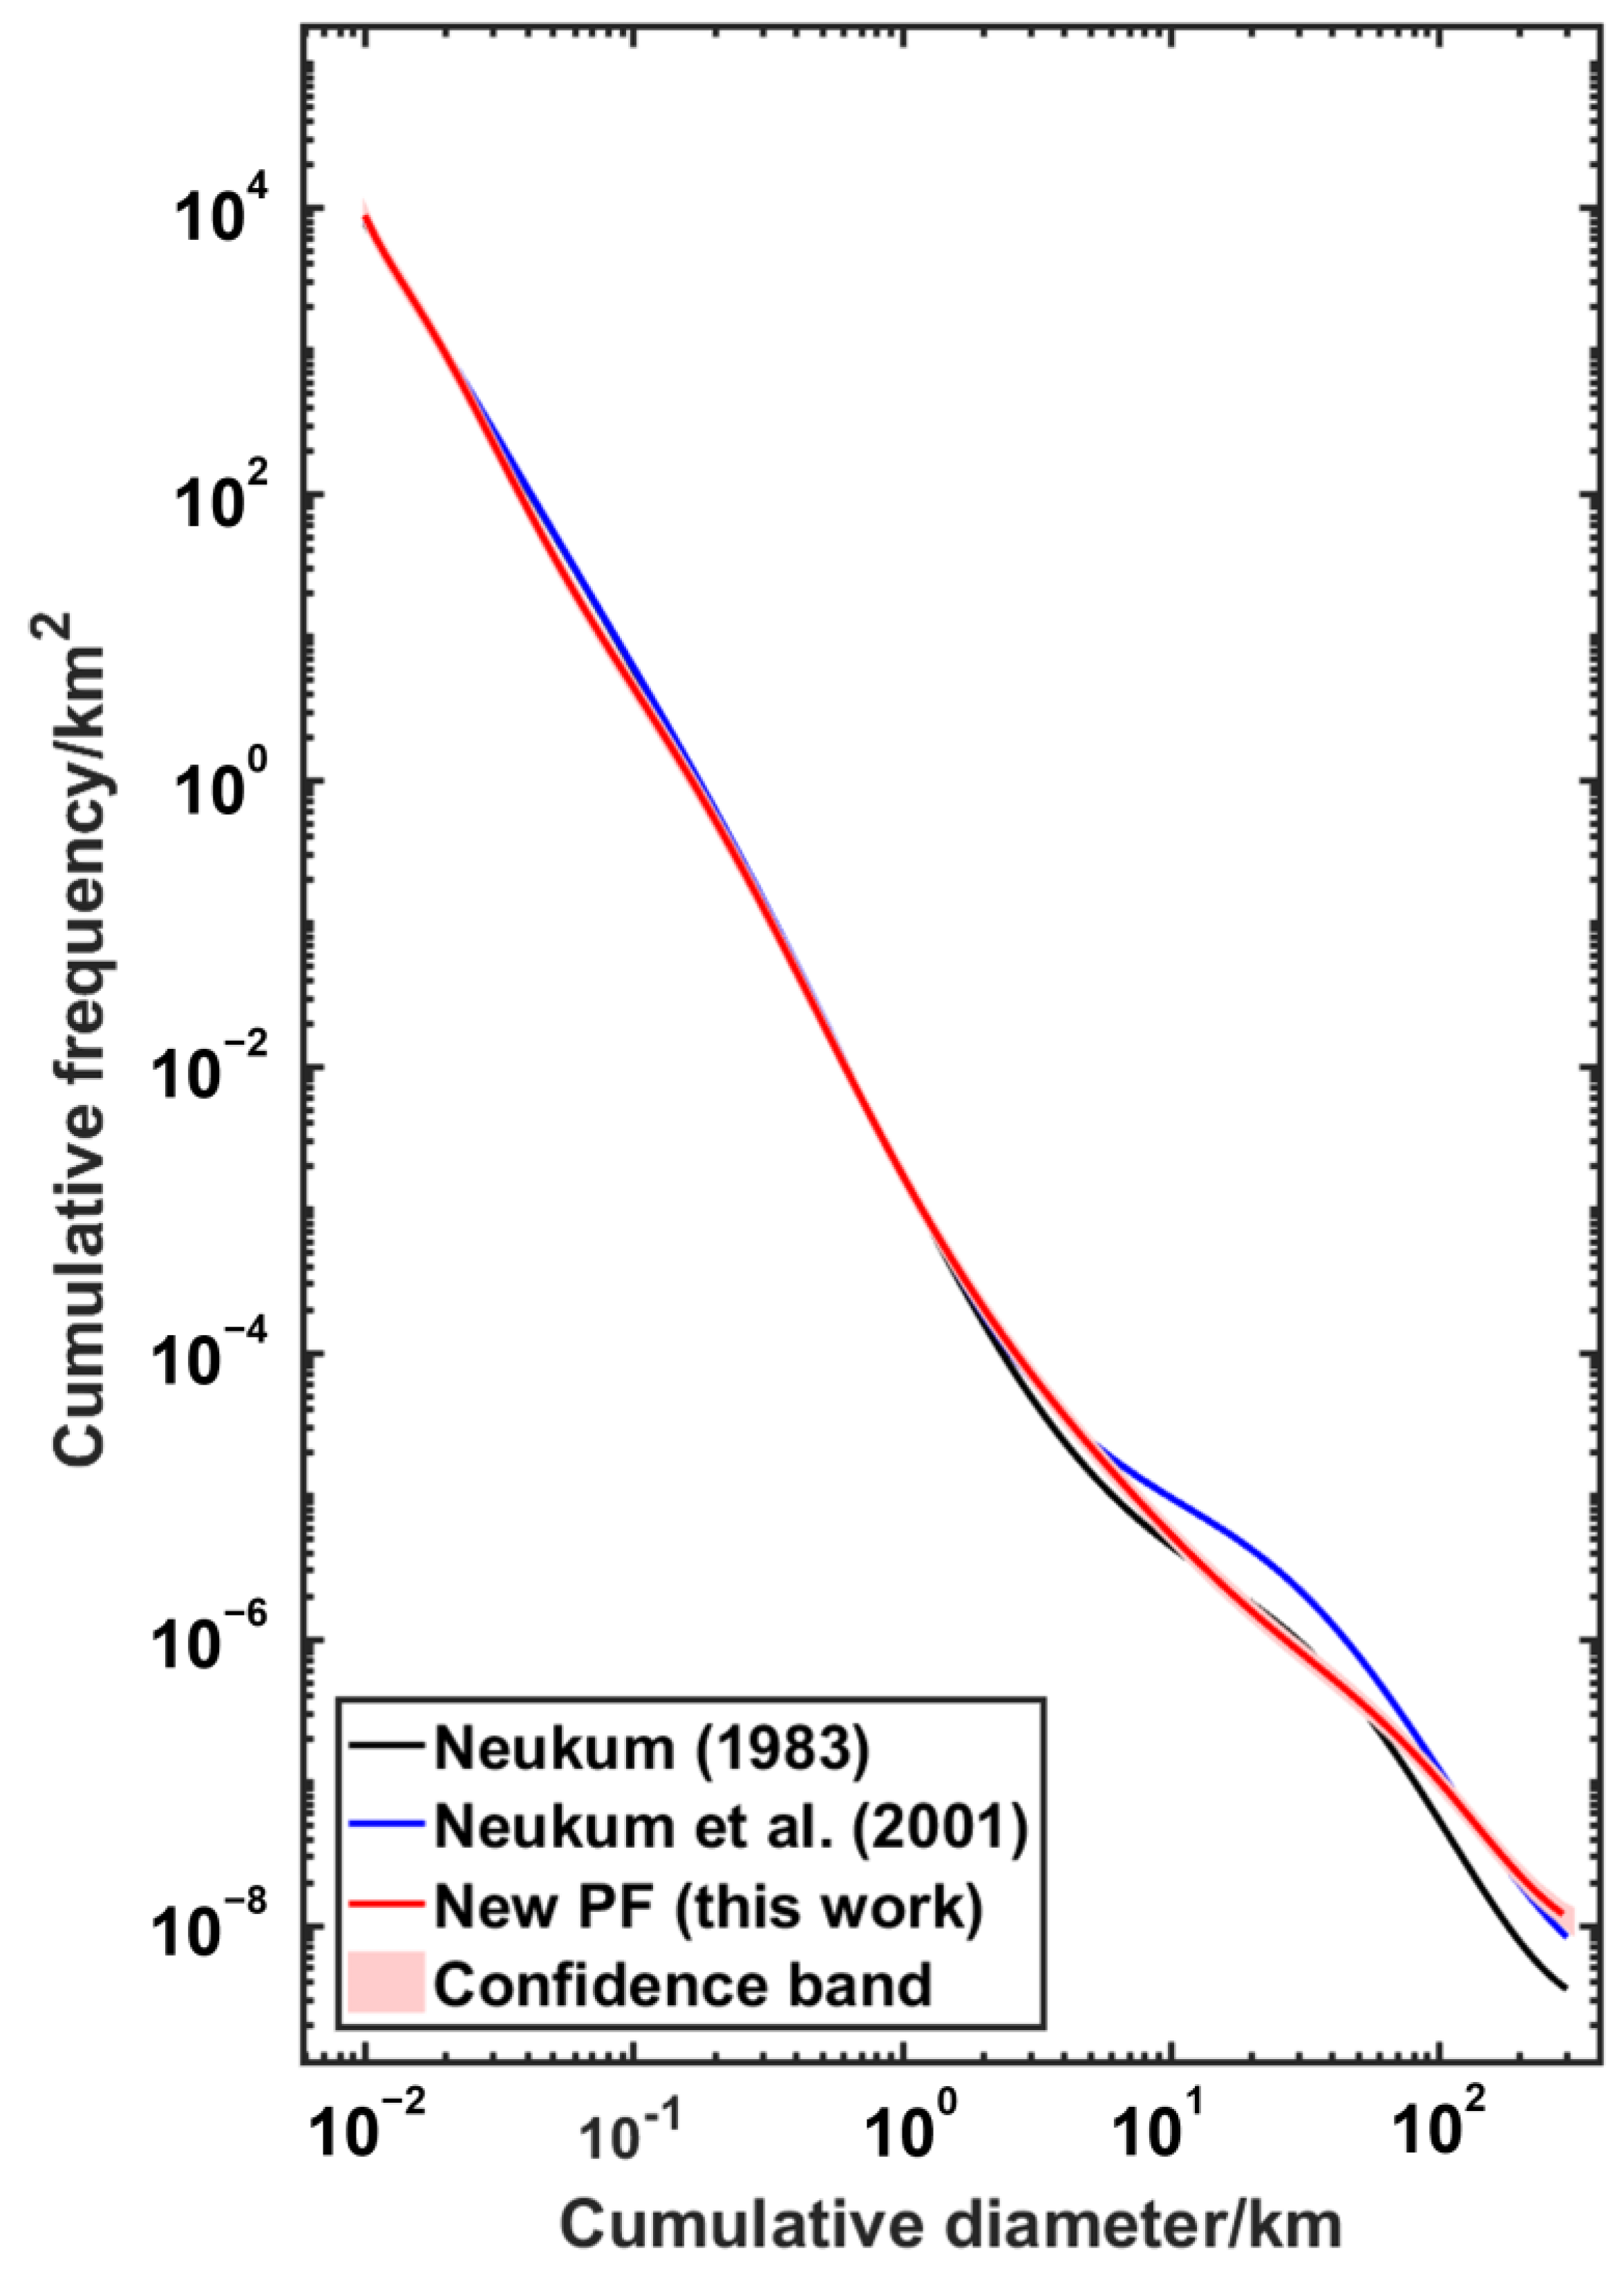
4.8. New PF Fitting
5. Discussion
5.1. Explanations for Disputed Areas
5.1.1. Aristarchus Crater
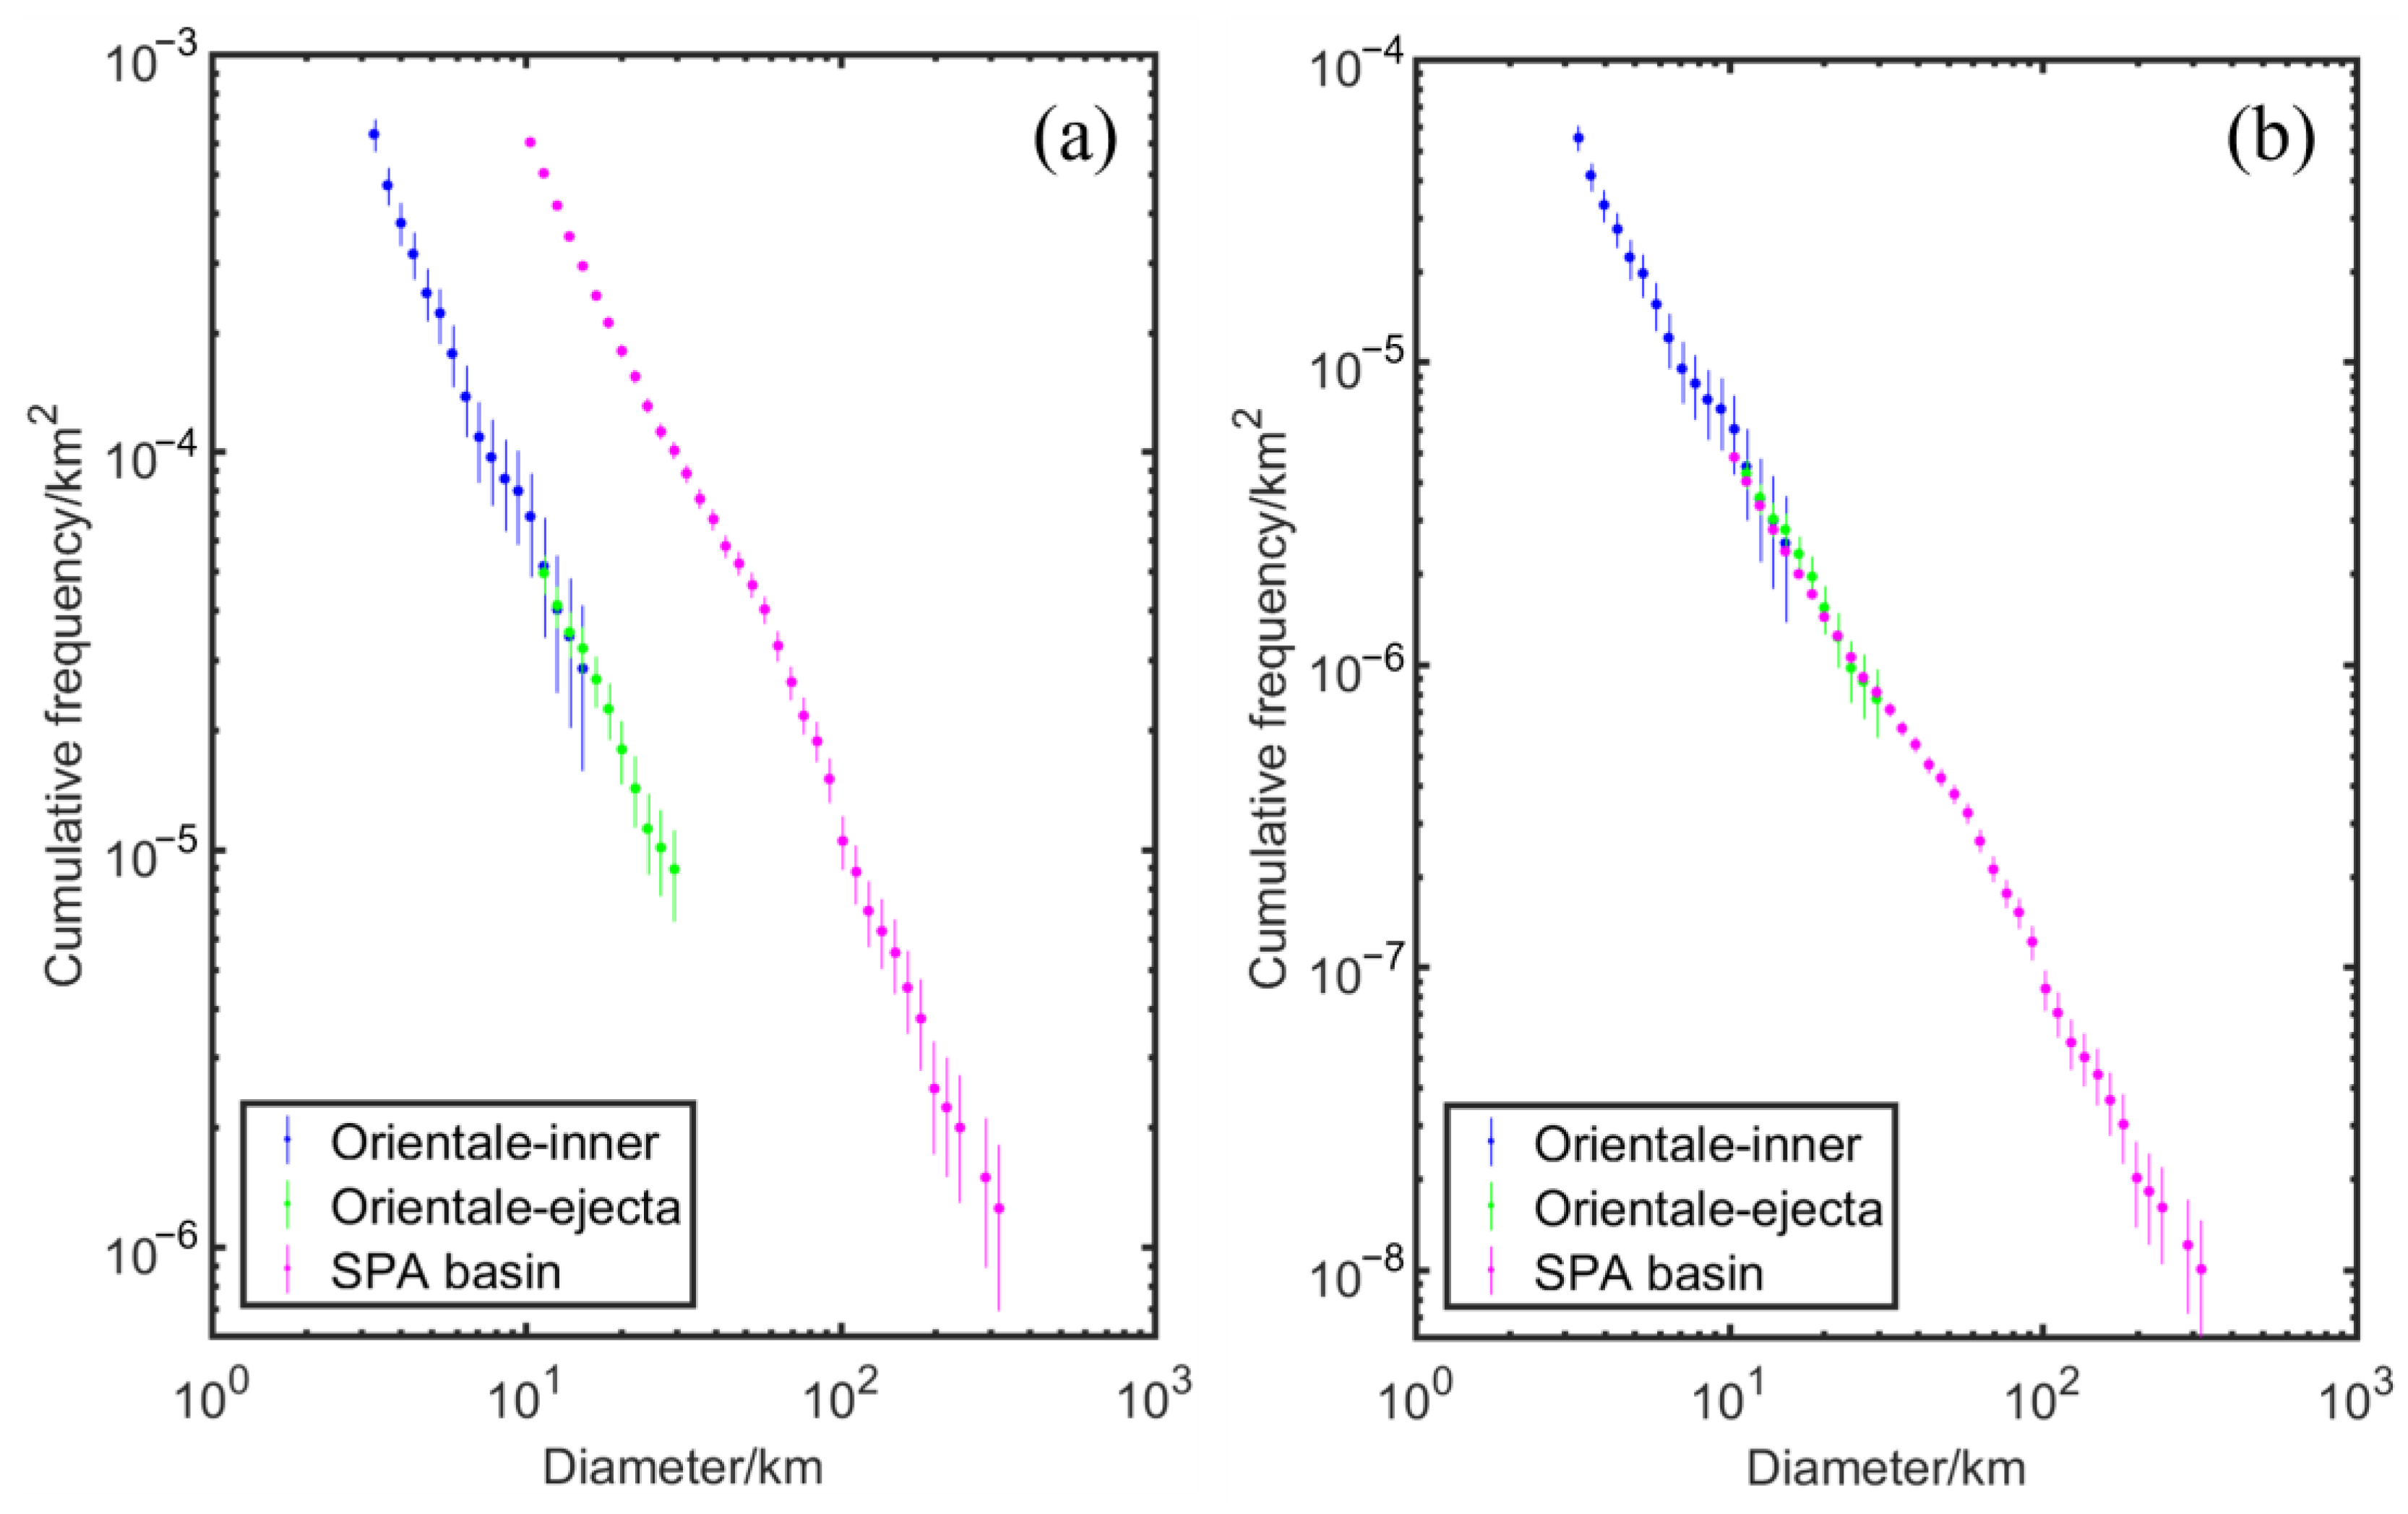
5.1.2. Ejecta of the Orientale Basin
5.1.3. South Pole Aitken (SPA) Basin

5.2. Compared with NPF
5.2.1. Differences in Measurements
5.2.2. Uncertainty Involved in Model Fitting
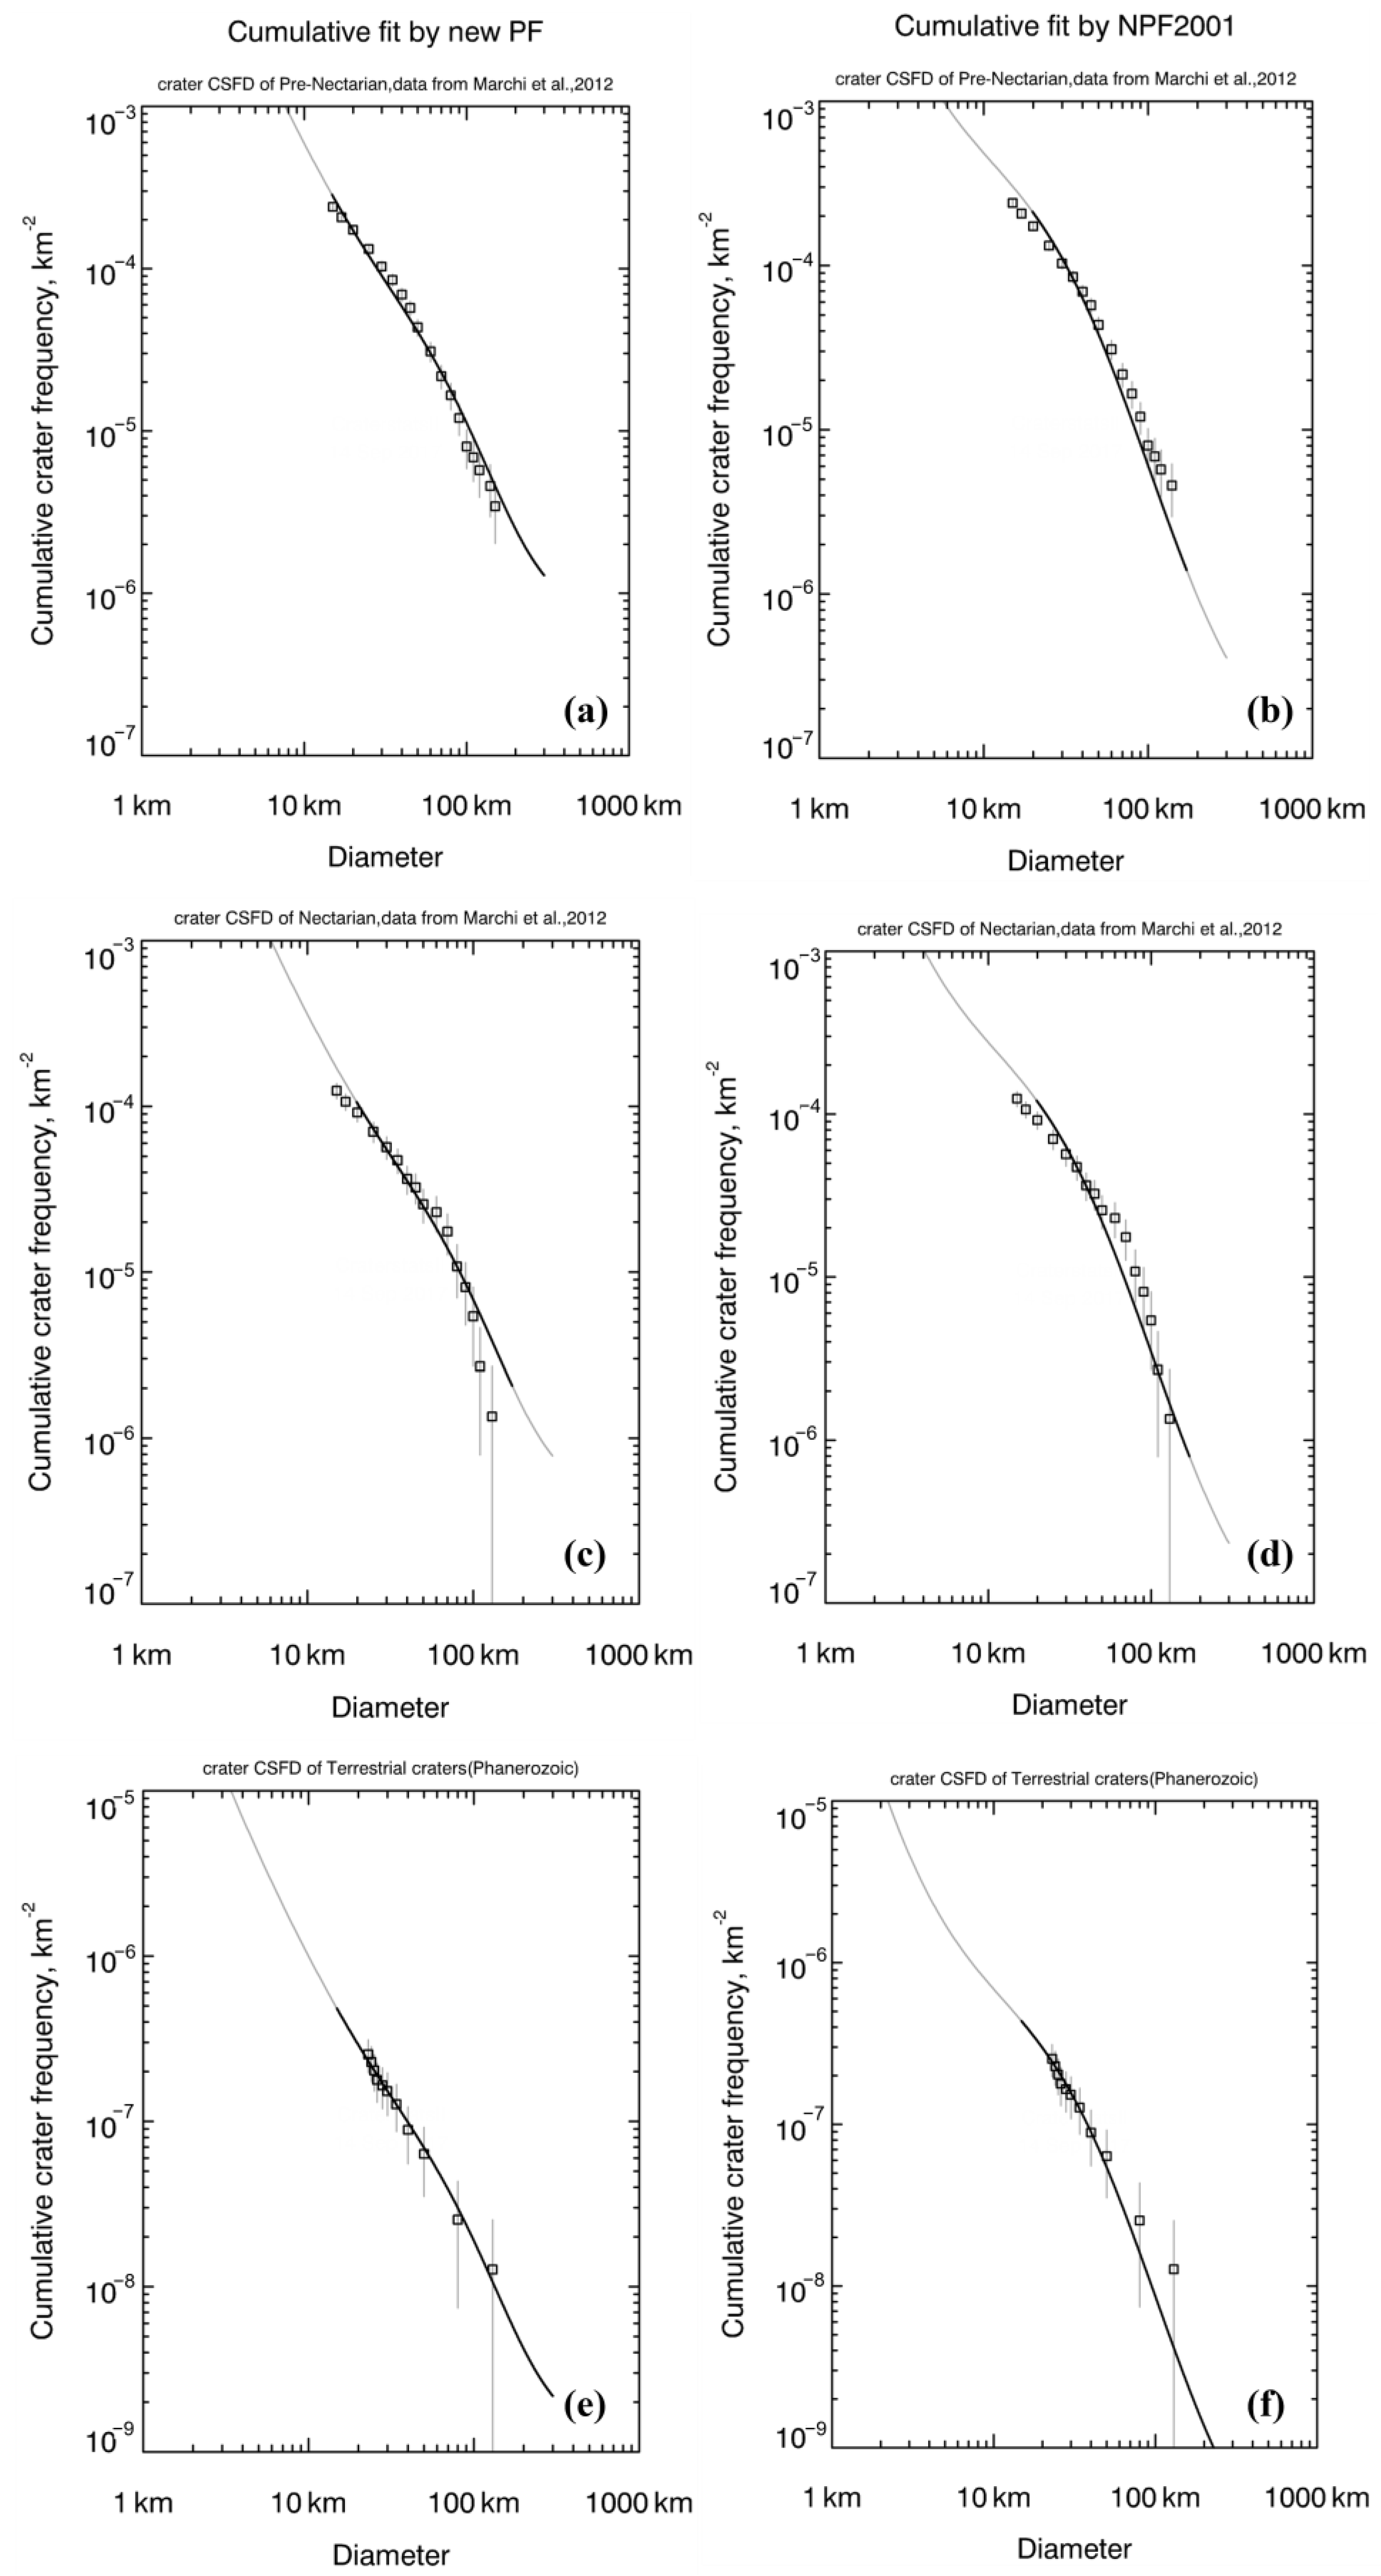
5.2.3. Cumulative Fit of Measured Crater CSFD
5.3. Influence of Topography Degradation and Terrain Properties
6. Conclusions
Author Contributions
Funding
Institutional Review Board Statement
Informed Consent Statement
Data Availability Statement
Acknowledgments
Conflicts of Interest
References
- Neukum, G. Meteoriten Bombardement und Datierung Planetarer Oberflächen; University of Munich: Munich, Germany, 1983. [Google Scholar]
- Stöffler, D.; Ryder, G. Stratigraphy and isotope ages of lunar geologic units: Chronological standard for the inner solar system. Space Sci. Rev. 2001, 96, 9–54. [Google Scholar] [CrossRef]
- Stöffler, D.; Ryder, G. Cratering history and lunar chronology. Rev. Mineral. Geochem. 2006, 60, 519–596. [Google Scholar] [CrossRef]
- Hiesinger, H.; Jaumann, R.; Neukum, G.; Head III, J.W. Ages of mare basalts on the lunar nearside. J. Geophys. Res. Planets 2000, 105, 29239–29275. [Google Scholar] [CrossRef]
- Michael, G.; Neukum, G. Planetary surface dating from crater size–frequency distribution measurements: Partial resurfacing events and statistical age uncertainty. Earth Planet. Sci. Lett. 2010, 294, 223–229. [Google Scholar] [CrossRef]
- Stuart, J.S.; Binzel, R.P. Bias-corrected population, size distribution, and impact hazard for the near-Earth objects. Icarus 2004, 170, 295–311. [Google Scholar] [CrossRef]
- Hartmann, W.K. On the distribution of lunar crater diameters. Commun. Lunar Planet. Lab. 1964, 2, 197–204. [Google Scholar]
- Young, J. A statistical investigation of diameter and distribution of lunar craters. J. Br. Astron. Assoc. 1940, 50, 309–326. [Google Scholar]
- Brown, H. The density and mass distribution of meteoritic bodies in the neighborhood of the earth’s orbit. J. Geophys. Res. 1960, 65, 1679–1683. [Google Scholar] [CrossRef]
- Cross, C. The size distribution of lunar craters. Mon. Not. R. Astron. Soc. 1966, 134, 245–252. [Google Scholar] [CrossRef]
- Hawkins, G.S. Asteroidal fragments. Astron. J. 1960, 65, 318. [Google Scholar] [CrossRef]
- Hartmann, W.K. Terrestrial, lunar, and interplanetary rock fragmentation. Icarus 1969, 10, 201–213. [Google Scholar] [CrossRef]
- Chapman, C.; Haefner, R. A critique of methods for analysis of the diameter-frequency relation for craters with special application to the Moon. J. Geophys. Res. 1967, 72, 549–557. [Google Scholar] [CrossRef]
- Neukum, G.; Schneider, E.; Mehl, A.; Storzer, D.; Wagner, G.A.; Fechtig, H.; Bloch, M.R. Lunar craters and exposure ages derived from crater statistics and solar flare tracks. In Proceedings of the Lunar and Planetary Science Conference Proceedings, New York, NY, USA, 10–13 January 1972. [Google Scholar]
- König, B. Investigations of Primary and Secondary Impact Structures on the Moon and Laboratory Experiments to Study the Ejecta of Secondary Particles. Ph.D. Thesis, University of Heidelberg, Heidelberg, Germany, 1977. [Google Scholar]
- Neukum, G.; Ivanov, B. Crater size distributions and impact probabilities on Earth from lunar, terrestrial-planet, and asteroid cratering data. Hazards Due Comets Asteroids 1994, 359, 359–416. [Google Scholar]
- Neukum, G.; König, B.; Arkani-Hamed, J. A study of lunar impact crater size-distributions. Moon 1975, 12, 201–229. [Google Scholar] [CrossRef]
- Greeley, R.; Gault, D.E. Precision size-frequency distributions of craters for 12 selected areas of the lunar surface. Moon 1970, 2, 10–77. [Google Scholar] [CrossRef]
- Kereszturi, A.; Steinmann, V. Characteristics of small young lunar impact craters focusing on current production and degradation on the Moon. Planet. Space Sci. 2017, 148, 12–27. [Google Scholar] [CrossRef]
- Antonenko, I.; Robbins, S.; Gay, P.L.; Lehan, C.; Moore, J. Effects of Incidence Angle on Crater Detection and the Lunar Ioschron System: Preliminary Results from the CosmoQuest MoonMappers Citizen Science Project. In Proceedings of the 44th Annual Lunar and Planetary Science Conference, The Woodlands, TX, USA, 18–22 March 2013. [Google Scholar]
- Robinson, M.S.; Brylow, S.; Tschimmel, M.; Humm, D.; Lawrence, S.J.; Thomas, P.C.; Denevi, B.W.; Bowman-Cisneros, E.; Zerr, J.; Ravine, M.A. Lunar reconnaissance orbiter camera (LROC) instrument overview. Space Sci. Rev. 2010, 150, 81–124. [Google Scholar] [CrossRef]
- NASA. Planetary Data System Geosciences Node Orbital Data Explorer (ODE). Available online: https://ode.rsl.wustl.edu/moon/ (accessed on 2 May 2023).
- Wagner, R.; Speyerer, E.; Robinson, M.S.; LROC Team. New mosaicked data products from the LROC team. In Proceedings of the 46th Annual Lunar and Planetary Science Conference, The Woodlands, TX, USA, 16–20 March 2015. [Google Scholar]
- Robbins, S.J. A new global database of lunar impact craters > 1–2 km: 1. Crater locations and sizes, comparisons with published databases, and global analysis. J. Geophys. Res. Planets 2019, 124, 871–892. [Google Scholar] [CrossRef]
- Jia, M.; Yue, Z.; Di, K.; Liu, B.; Liu, J.; Michael, G. A catalogue of impact craters larger than 200 m and surface age analysis in the Chang’e-5 landing area. Earth Planet. Sci. Lett. 2020, 541, 116272. [Google Scholar] [CrossRef]
- Sides, S.; Becker, T.; Becker, K.J.; Edmundson, K.L.; Backer, J.W.; Wilson, T.J.; Weller, L.A.; Humphrey, I.R.; Berry, K.L.; Shepherd, M.R. The USGS Integrated Software for Imagers and Spectrometers (ISIS 3) instrument support, new capabilities, and releases. In Proceedings of the 48th Annual Lunar and Planetary Science Conference, The Woodlands, TX, USA, 20–24 March 2017. [Google Scholar]
- Group, C.A.T.W. Standard techniques for presentation and analysis of crater size-frequency data. Icarus 1979, 37, 467–474. [Google Scholar]
- Henriksen, M.; Manheim, M.; Burns, K.N.; Seymour, P.; Speyerer, E.J.; Deran, A.; Boyd, A.K.; Howington-Kraus, E.; Rosiek, M.; Archinal, B. Extracting accurate and precise topography from LROC narrow angle camera stereo observations. Icarus 2017, 283, 122–137. [Google Scholar] [CrossRef]
- Gault, D.E. Saturation and equilibrium conditions for impact cratering on the lunar surface: Criteria and implications. Radio Sci. 1970, 5, 273–291. [Google Scholar] [CrossRef]
- Gou, S.; Yue, Z.; Di, K.; Cai, Z.; Liu, Z.; Niu, S. Absolute model age of lunar Finsen crater and geologic implications. Icarus 2021, 354, 114046. [Google Scholar] [CrossRef]
- McEwen, A.S.; Bierhaus, E.B. The importance of secondary cratering to age constraints on planetary surfaces. Earth Planet. Sci. Lett. 2006, 34, 535–567. [Google Scholar] [CrossRef]
- Hargitai, H.; Kereszturi, Á. Encyclopedia of Planetary Landforms; Springer: Berlin/Heidelberg, Germany, 2015. [Google Scholar]
- Di, K.; Li, W.; Yue, Z.; Sun, Y.; Liu, Y. A machine learning approach to crater detection from topographic data. Adv. Space Res. 2014, 54, 2419–2429. [Google Scholar] [CrossRef]
- Salamunićcar, G.; Lončarić, S.; Pina, P.; Bandeira, L.; Saraiva, J. MA130301GT catalogue of Martian impact craters and advanced evaluation of crater detection algorithms using diverse topography and image datasets. Planet. Space Sci. 2011, 59, 111–131. [Google Scholar] [CrossRef]
- Wang, J.; Cheng, W.; Zhou, C. A Chang’E-1 global catalog of lunar impact craters. Planet. Space Sci. 2015, 112, 42–45. [Google Scholar] [CrossRef]
- Kneissl, T.; van Gasselt, S.; Neukum, G. Map-projection-independent crater size-frequency determination in GIS environments—New software tool for ArcGIS. Planet. Space Sci. 2011, 59, 1243–1254. [Google Scholar] [CrossRef]
- Shi, K.; Yue, Z.; Di, K.; Liu, J.; Dong, Z. The gardening process of lunar regolith by small impact craters: A case study in Chang’E-4 landing area. Icarus 2022, 377, 114908. [Google Scholar] [CrossRef]
- Allen, J.P. Apollo 15: Scientific Journey to Hadley-Apennine: The stunning beauty of the most recent lunar landing site is surpassed by the rich scientific harvest which it yielded. Am. Sci. 1972, 60, 162–174. [Google Scholar]
- Robbins, S.J. New crater calibrations for the lunar crater-age chronology. Earth Planet. Sci. Lett. 2014, 403, 188–198. [Google Scholar] [CrossRef]
- Robbins, S.J.; Riggs, J.D.; Weaver, B.P.; Bierhaus, E.B.; Chapman, C.R.; Kirchoff, M.R.; Singer, K.N.; Gaddis, L.R. Revised recommended methods for analyzing crater size-frequency distributions. Meteorit. Planet. Sci. 2018, 53, 891–931. [Google Scholar] [CrossRef]
- Trask, N.J. Size and spatial distribution of craters estimated from the Ranger photographs. Icarus 1966, 6, 270–276. [Google Scholar] [CrossRef]
- Arvidson, R.; Crozaz, G.; Drozd, R.J.; Hohenberg, C.M.; Morgan, C.J. Cosmic ray exposure ages of features and events at the Apollo landing sites. Moon 1975, 13, 259–276. [Google Scholar] [CrossRef]
- Jolliff, B.L.; Wang, K.; Korotev, R.; Simon, S.; Papike, J.J.; Shearer, C.K. Apollo Next Generation Sample Analysis: What to expect among Rock Fragments in Apollo 17 Core Samples 73001 and 73002. In AGU Fall Meeting Abstracts; American Geophysical Union: Washington, DC, USA, 2020. [Google Scholar]
- Hiesinger, H.v.; Van Der Bogert, C.H.; Pasckert, J.H.; Funcke, L.; Giacomini, L.; Ostrach, L.R.; Robinson, M.S. How old are young lunar craters? J. Geophys. Res. Planets 2012, 117, E00H10. [Google Scholar] [CrossRef]
- Orloff, R.W.; Harland, D.M. The Definitive Sourcebook; Springer: Greer, SC, USA, 2006. [Google Scholar]
- Marti, K.; Lightner, B.; Osborn, T.W. Krypton and xenon in some lunar samples and the age of North Ray Crater. In Proceedings of the Lunar Science Conference, Houston, TX, USA, 1 January 1973. [Google Scholar]
- Moore, H.; Boyce, J.; Hahn, D. Small impact craters in the lunar regolith—Their morphologies, relative ages, and rates of formation. Moon Planets 1980, 23, 231–252. [Google Scholar] [CrossRef]
- Head, J.W.; Hawke, B. Geology of the Apollo 14 region/Fra Mauro/-Stratigraphic history and sample provenance. In Proceedings of the Lunar Science Conference, Houston, TX, USA, 17–21 March 1975. [Google Scholar]
- Plescia, J. Insight into Impact Crater Crustal Structure using Gravity Data. In AGU Fall Meeting Abstracts; American Geophysical Union: Washington, DC, USA, 2011. [Google Scholar]
- Mustard, J.F.; Pieters, C.M.; Isaacson, P.J.; Head, J.W.; Besse, S.; Clark, R.N.; Klima, R.L.; Petro, N.E.; Staid, M.I.; Sunshine, J.M. Compositional diversity and geologic insights of the Aristarchus crater from Moon Mineralogy Mapper data. J. Geophys. Res. Planets 2011, 116, E00G12. [Google Scholar] [CrossRef]
- Zanetti, M.; Hiesinger, H.; van der Bogert, C.H.; Reiss, D.; Jolliff, B.L. Aristarchus crater: Mapping of impact melt and absolute age determination. In Proceedings of the 42nd Annual Lunar and Planetary Science Conference, The Woodlands, TX, USA, 7–10 March 2011. [Google Scholar]
- Fortezzo, C.; Spudis, P.; Harrel, S.L. Release of the digital unified global geologic map of the Moon at 1: 5,000,000-Scale. In Proceedings of the 51st Annual Lunar and Planetary Science Conference, The Woodlands, TX, USA, 16–20 March 2020. [Google Scholar]
- Yue, Z.; Yang, M.; Jia, M.; Michael, G.; Di, K.; Gou, S.; Liu, J. Refined model age for Orientale Basin derived from zonal crater dating of its ejecta. Icarus 2020, 346, 113804. [Google Scholar] [CrossRef]
- Yue, Z.; Di, K.; Wan, W.; Liu, Z.; Gou, S.; Liu, B.; Peng, M.; Wang, Y.; Jia, M.; Liu, J. Updated lunar cratering chronology model with the radiometric age of Chang’e-5 samples. Nat. Astron. 2022, 6, 541–545. [Google Scholar] [CrossRef]
- Jolliff, B.L.; Gillis, J.J.; Haskin, L.A.; Korotev, R.L.; Wieczorek, M.A. Major lunar crustal terranes: Surface expressions and crust-mantle origins. J. Geophys. Res. Planets 2000, 105, 4197–4216. [Google Scholar] [CrossRef]
- Garrick-Bethell, I.; Zuber, M.T. Elliptical structure of the lunar South Pole-Aitken basin. Icarus 2009, 204, 399–408. [Google Scholar] [CrossRef]
- Neukum, G.; Ivanov, B.A.; Hartmann, W.K. Cratering records in the inner solar system in relation to the lunar reference system. In Proceedings of the Chronology and Evolution of Mars: Proceedings of an ISSI Workshop, Bern, Switzerland, 10–14 April 2000. [Google Scholar]
- McGetchin, T.R.; Settle, M.; Head, J.W. Radial thickness variation in impact crater ejecta: Implications for lunar basin deposits. Earth Planet. Sci. Lett. 1973, 20, 226–236. [Google Scholar] [CrossRef]
- Ohtake, M.; Uemoto, K.; Yokota, Y.; Morota, T.; Yamamoto, S.; Nakamura, R.; Haruyama, J.; Iwata, T.; Matsunaga, T.; Ishihara, Y. Geologic structure generated by large-impact basin formation observed at the South Pole-Aitken basin on the Moon. Geophys. Res. Lett. 2014, 41, 2738–2745. [Google Scholar] [CrossRef]
- Marchi, S.; Mottola, S.; Cremonese, G.; Massironi, M.; Martellato, E. A new chronology for the Moon and Mercury. Astron. J. 2009, 137, 4936. [Google Scholar] [CrossRef]
- Ivanov, B.; Neukum, G.; Wagner, R. Impact craters, NEA, and Main Belt asteroids: Size-frequency distribution. In Proceedings of the Lunar and Planetary Science Conference, Johnson Space Center, Houston, TX, USA, 4 March 1999. [Google Scholar]
- Head III, J.W.; Fassett, C.I.; Kadish, S.J.; Smith, D.E.; Zuber, M.T.; Neumann, G.A.; Mazarico, E. Global distribution of large lunar craters: Implications for resurfacing and impactor populations. Science 2010, 329, 1504–1507. [Google Scholar] [CrossRef]
- Richardson, J.E. Cratering saturation and equilibrium: A new model looks at an old problem. Icarus 2009, 204, 697–715. [Google Scholar] [CrossRef]
- Soderblom, J.M.; Evans, A.J.; Johnson, B.C.; Melosh, H.J.; Miljković, K.; Phillips, R.J.; Andrews-Hanna, J.C.; Bierson, C.J.; Head, J.W.; Milbury, C. The fractured Moon: Production and saturation of porosity in the lunar highlands from impact cratering. Geophys. Res. Lett. 2015, 42, 6939–6944. [Google Scholar] [CrossRef]
- Marchi, S.; Bottke, W.F.; Kring, D.A.; Morbidelli, A. The onset of the lunar cataclysm as recorded in its ancient crater populations. Earth Planet. Sci. Lett. 2012, 325, 27–38. [Google Scholar] [CrossRef]
- Planetary and Space Science Centre. Earth Impact Database. Available online: http://passc.net/EarthImpactDatabase/New%20website_05-2018/Index.html (accessed on 2 May 2023).
- Craddock, R.A.; Howard, A.D. Simulated degradation of lunar impact craters and a new method for age dating farside mare deposits. J. Geophys. Res. Planets 2000, 105, 20387–20401. [Google Scholar] [CrossRef]
- Fassett, C.I.; Thomson, B.J. Crater degradation on the lunar maria: Topographic diffusion and the rate of erosion on the Moon. J. Geophys. Res. Planets 2014, 119, 2255–2271. [Google Scholar] [CrossRef]
- Ivanov, B.; Neukum, G.; Wagner, R. Size-frequency distributions of planetary impact craters and asteroids. In Collisional Processes in the Solar System; Springer: Berlin/Heidelberg, Germany, 2001; pp. 1–34. [Google Scholar]


| Image Name | Resolution (Meters/Pixel) | Incidence Angle (°) | Area Name |
|---|---|---|---|
| M1108260533L/R | 1.402 | 68.46 | Apollo 15 LS |
| M104490494L/R | 1.486 | 56.77 | Apollo 15 LS |
| M1203903057L | 1.166 | 70.99 | Mare west of Delisle |
| M192760872L | 1.314 | 69.66 | Apollo 17 LS |
| M129187331L/R | 0.486 | 54.19 | North Ray crater |
| M114071006L | 0.534 | 56.94 | Cone crater |
| M102472092L/R | 1.417 | 76.14 | Aristarchus crater |
| Area Name | Center Longitude, Latitude (E, N/°) | Area (km2) | Craters | Diameter Range Used in PF |
|---|---|---|---|---|
| Apollo 15LS | 3.55, 26.16 | 243.9778 | 13,851 | 100–540 m |
| Mare west of Delisle | −35.93, 29.44 | 31.1807 | 7766 | 130–250 m |
| Apollo 17LS | 30.53, 20.15 | 6.5534 | 1948 | 10–50 m |
| North Ray crater | 15.49, −8.81 | 2.2303 | 5801 | 8–45 m |
| Cone crater | −17.43, −3.63 | 0.4756 | 521 | 8–25 m |
| Aristarchus crater | −48.10, 23.15 | 31.9015 | 2709 | 30–150 m |
| CE-5 landing area | −52.31, 43.03 | 17,058.79 | 50,582 | 200 m–2 km |
| Mare Serenitatis | 19.80, 25.16 | 182,108.53 | 576 | 1–3 km |
| Mare Crisium | 61.57, 13.13 | 25,627.92 | 111 | 1–2.5 m |
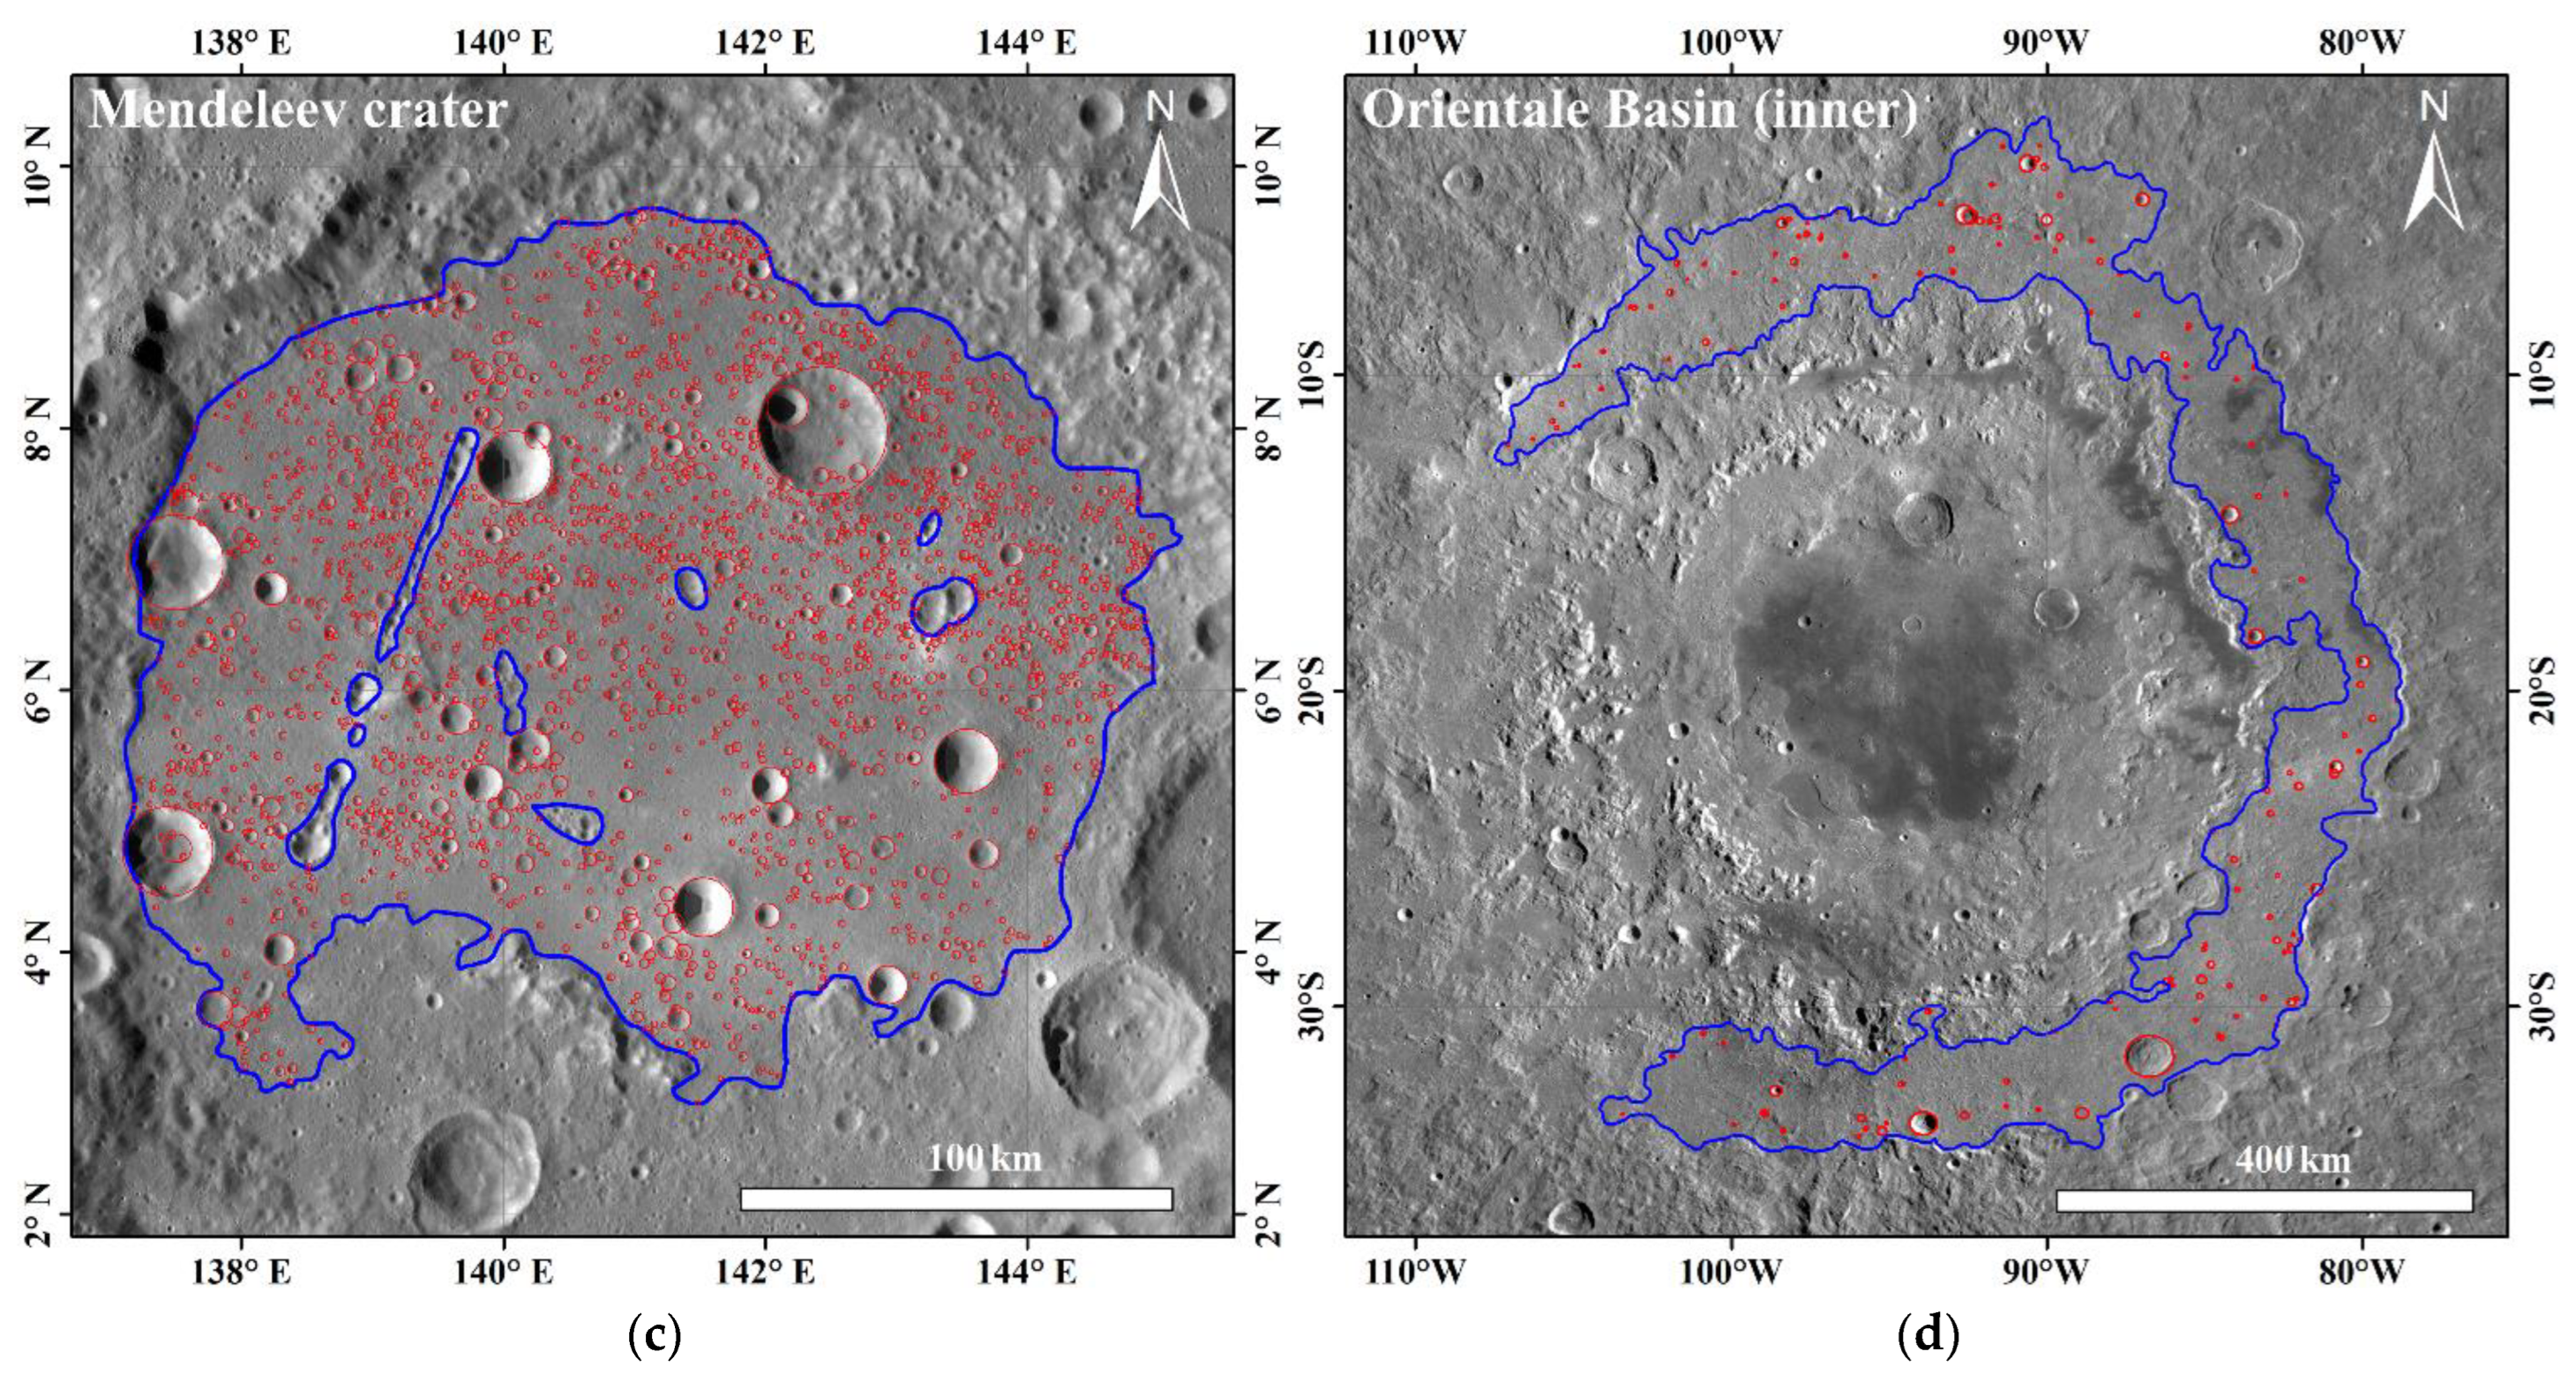
| Mendeleev crater | 141.03, 6.17 | 34,424.09 | 300 | 2–8 km |
| Orientale—inner | −93.98, −19.44 | 174,905.47 | 150 | 3–15 km |
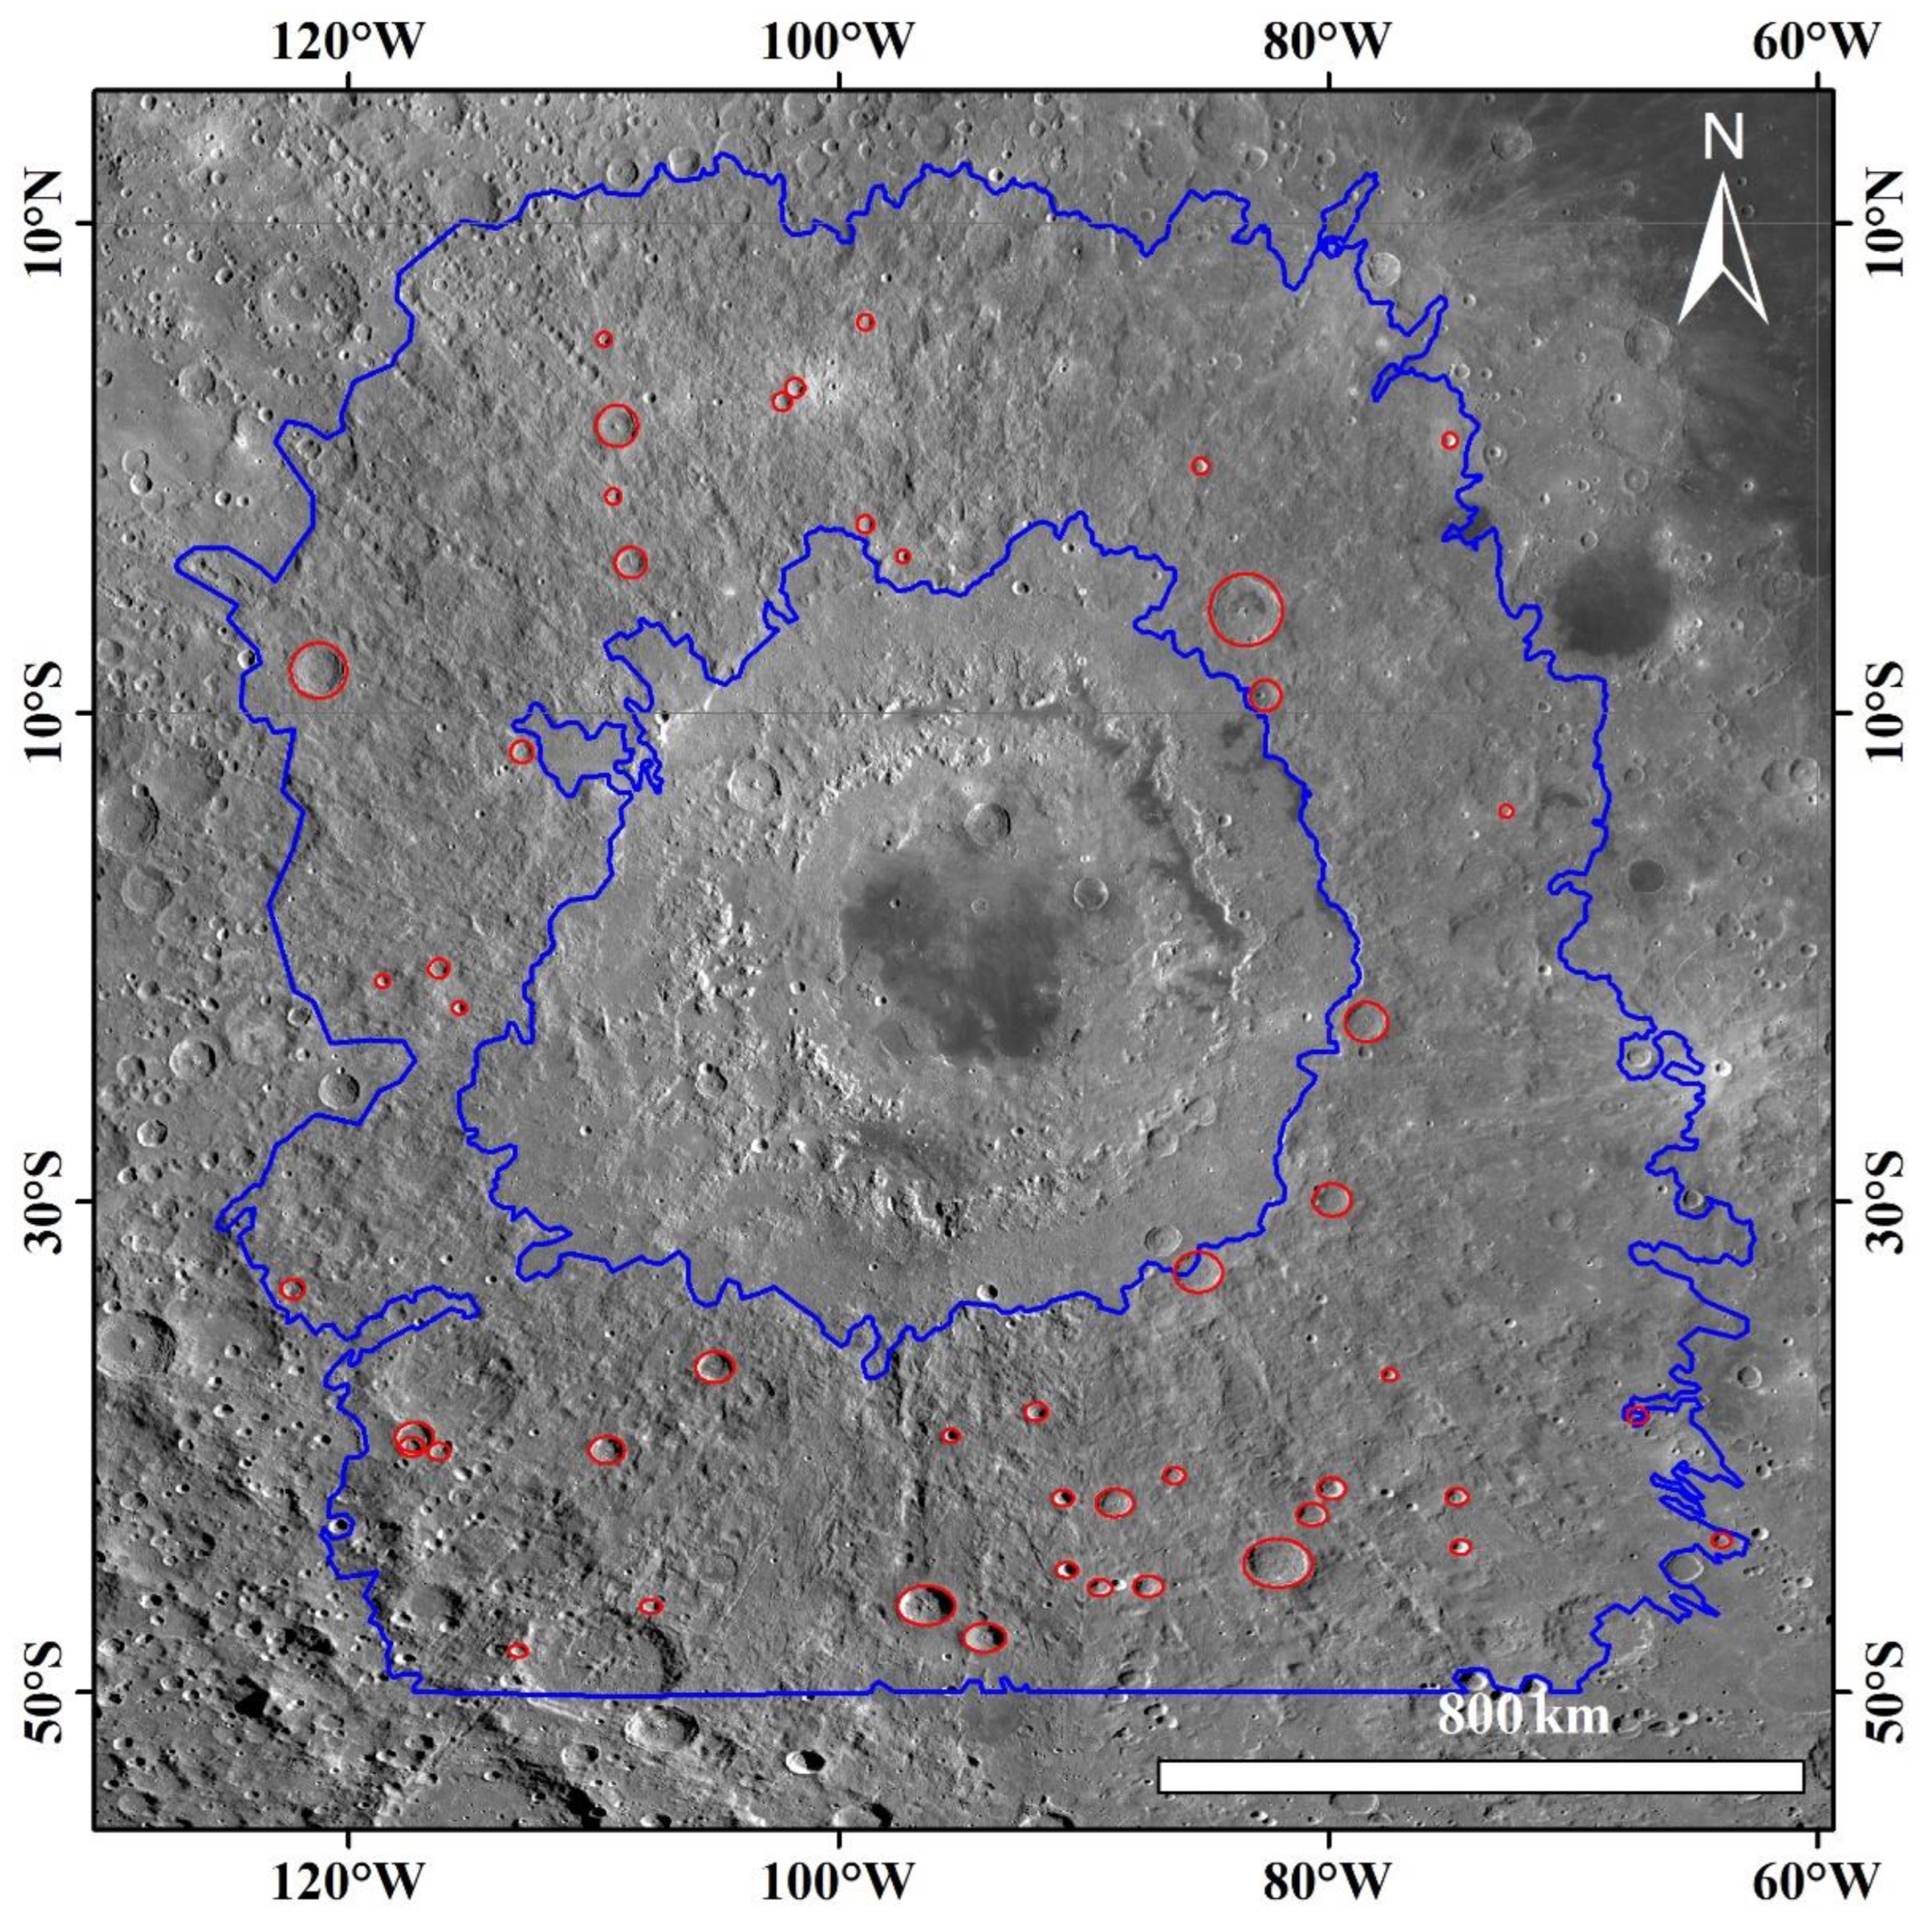
| Orientale—ejecta | −93.93, −19.57 | 1,678,511.18 | 291 | 10–30 km |
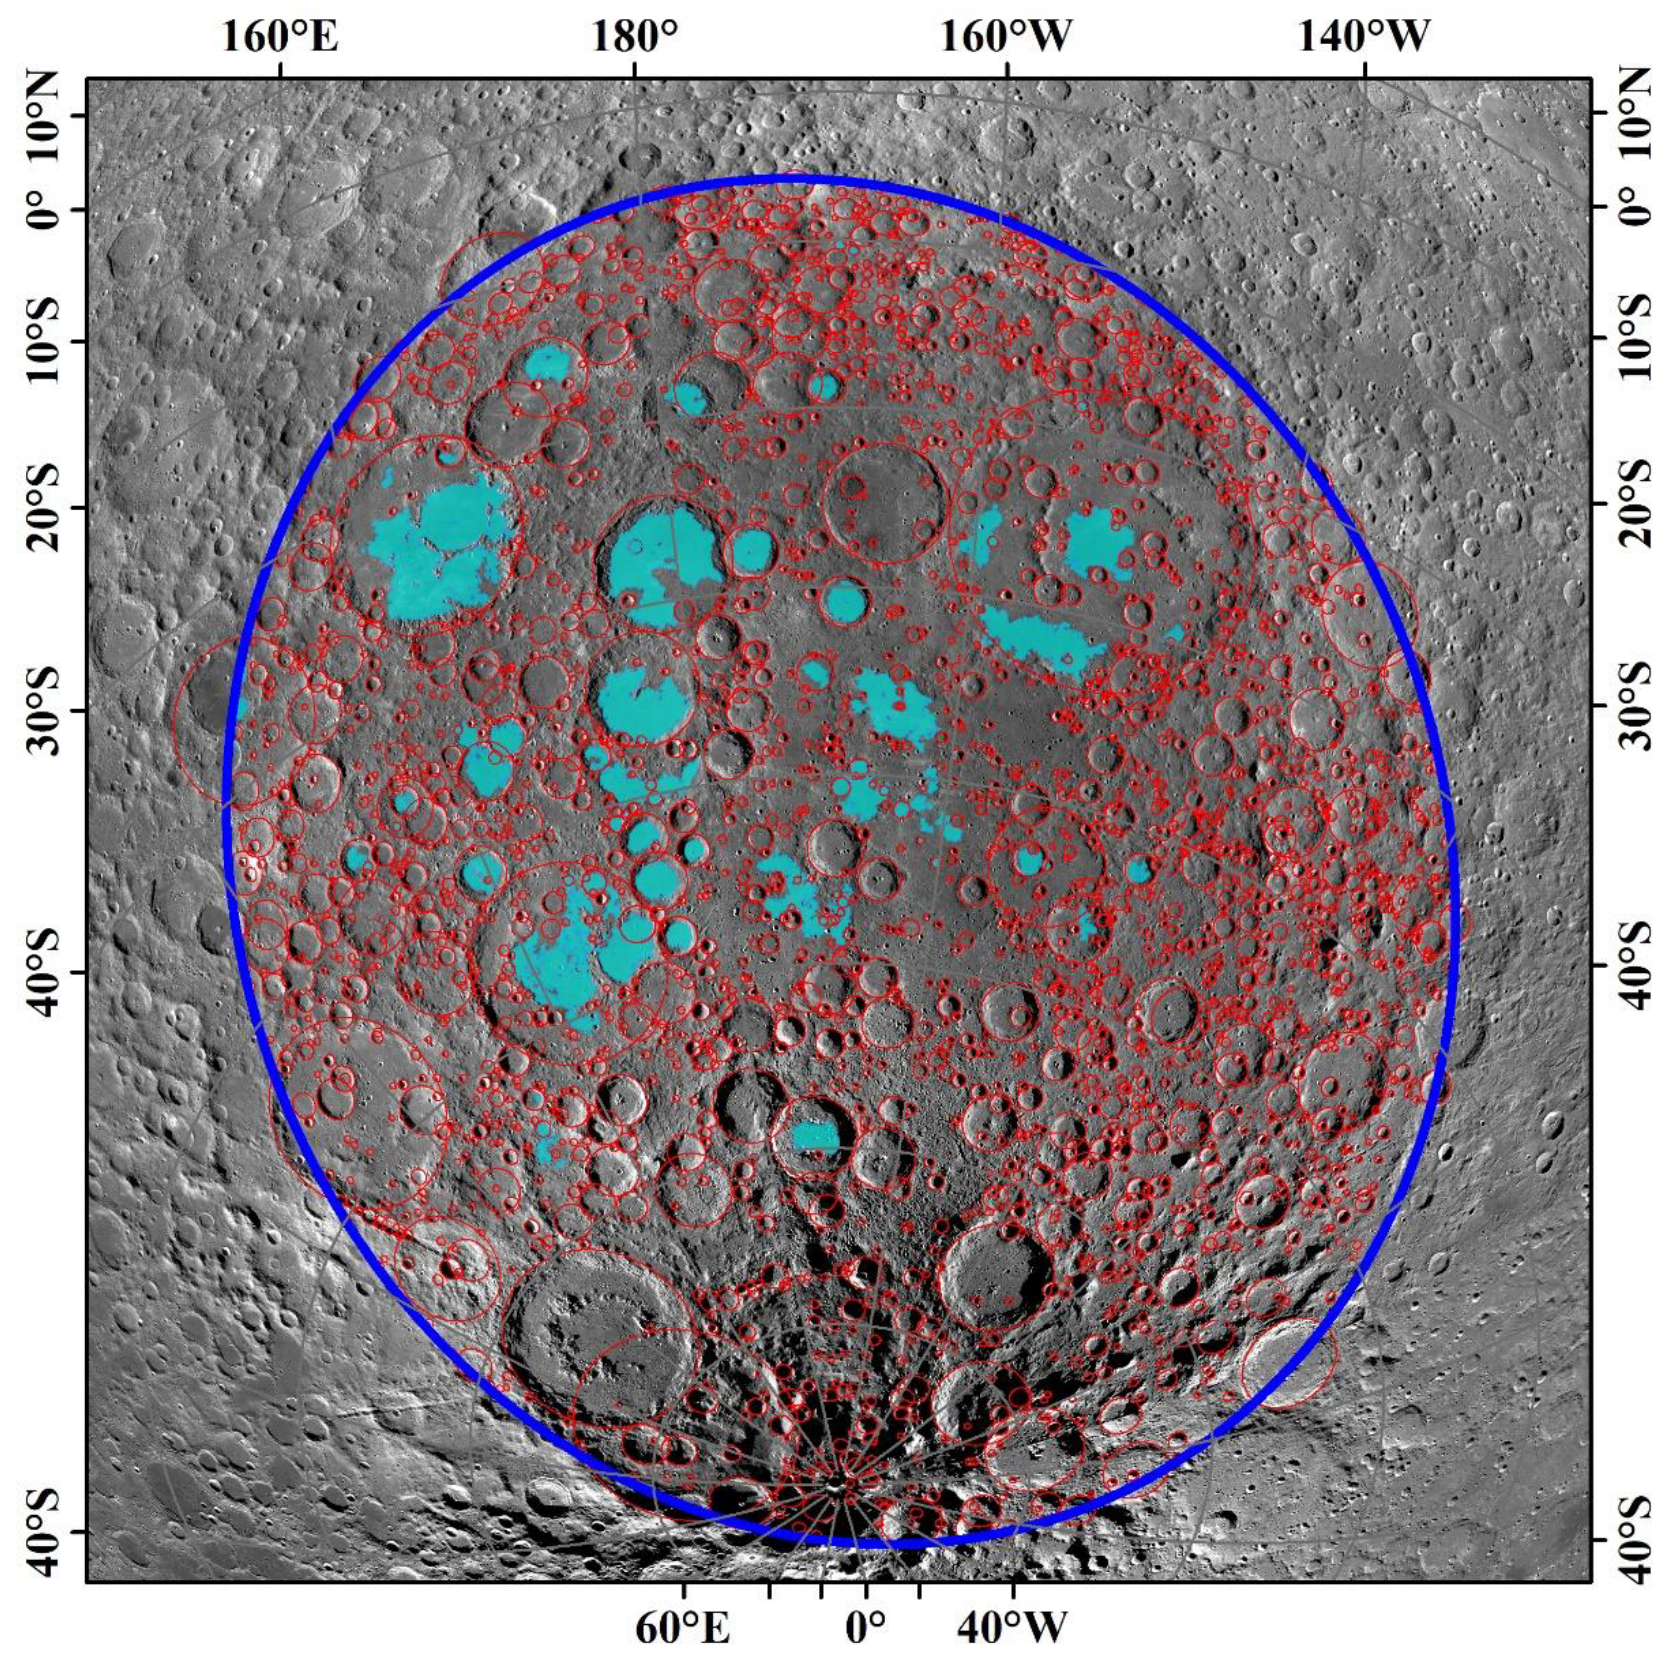
| SPA basin | −167.82, −52.73 | 3,995,786.93 | 58,847 | 20–300 km |
| 0 | −2.75653 | 3 | 0.57233 | 6 | 0.48853 | 9 | 0.024496 |
| 1 | −3.37748 | 4 | −0.83710 | 7 | −0.04537 | 10 | 0.011178 |
| 2 | 0.90317 | 5 | −0.12875 | 8 | −0.12384 | 11 | −0.002883 |
Disclaimer/Publisher’s Note: The statements, opinions and data contained in all publications are solely those of the individual author(s) and contributor(s) and not of MDPI and/or the editor(s). MDPI and/or the editor(s) disclaim responsibility for any injury to people or property resulting from any ideas, methods, instructions or products referred to in the content. |
© 2023 by the authors. Licensee MDPI, Basel, Switzerland. This article is an open access article distributed under the terms and conditions of the Creative Commons Attribution (CC BY) license (https://creativecommons.org/licenses/by/4.0/).
Share and Cite
Liu, J.; Yue, Z.; Di, K.; Gou, S.; Lin, Y. New Lunar Crater Production Function Based on High-Resolution Images. Remote Sens. 2023, 15, 2421. https://doi.org/10.3390/rs15092421
Liu J, Yue Z, Di K, Gou S, Lin Y. New Lunar Crater Production Function Based on High-Resolution Images. Remote Sensing. 2023; 15(9):2421. https://doi.org/10.3390/rs15092421
Chicago/Turabian StyleLiu, Jianan, Zongyu Yue, Kaichang Di, Sheng Gou, and Yangting Lin. 2023. "New Lunar Crater Production Function Based on High-Resolution Images" Remote Sensing 15, no. 9: 2421. https://doi.org/10.3390/rs15092421