Communication

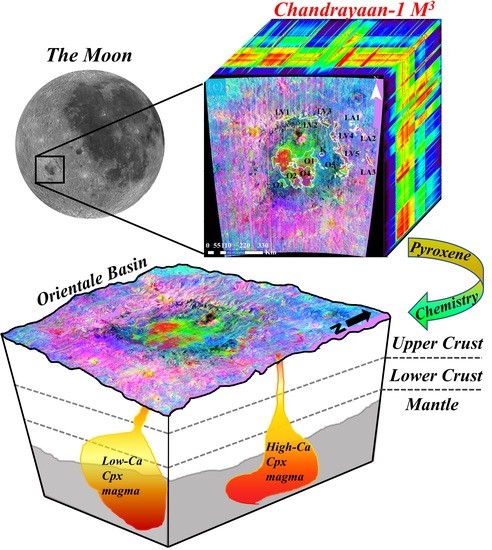
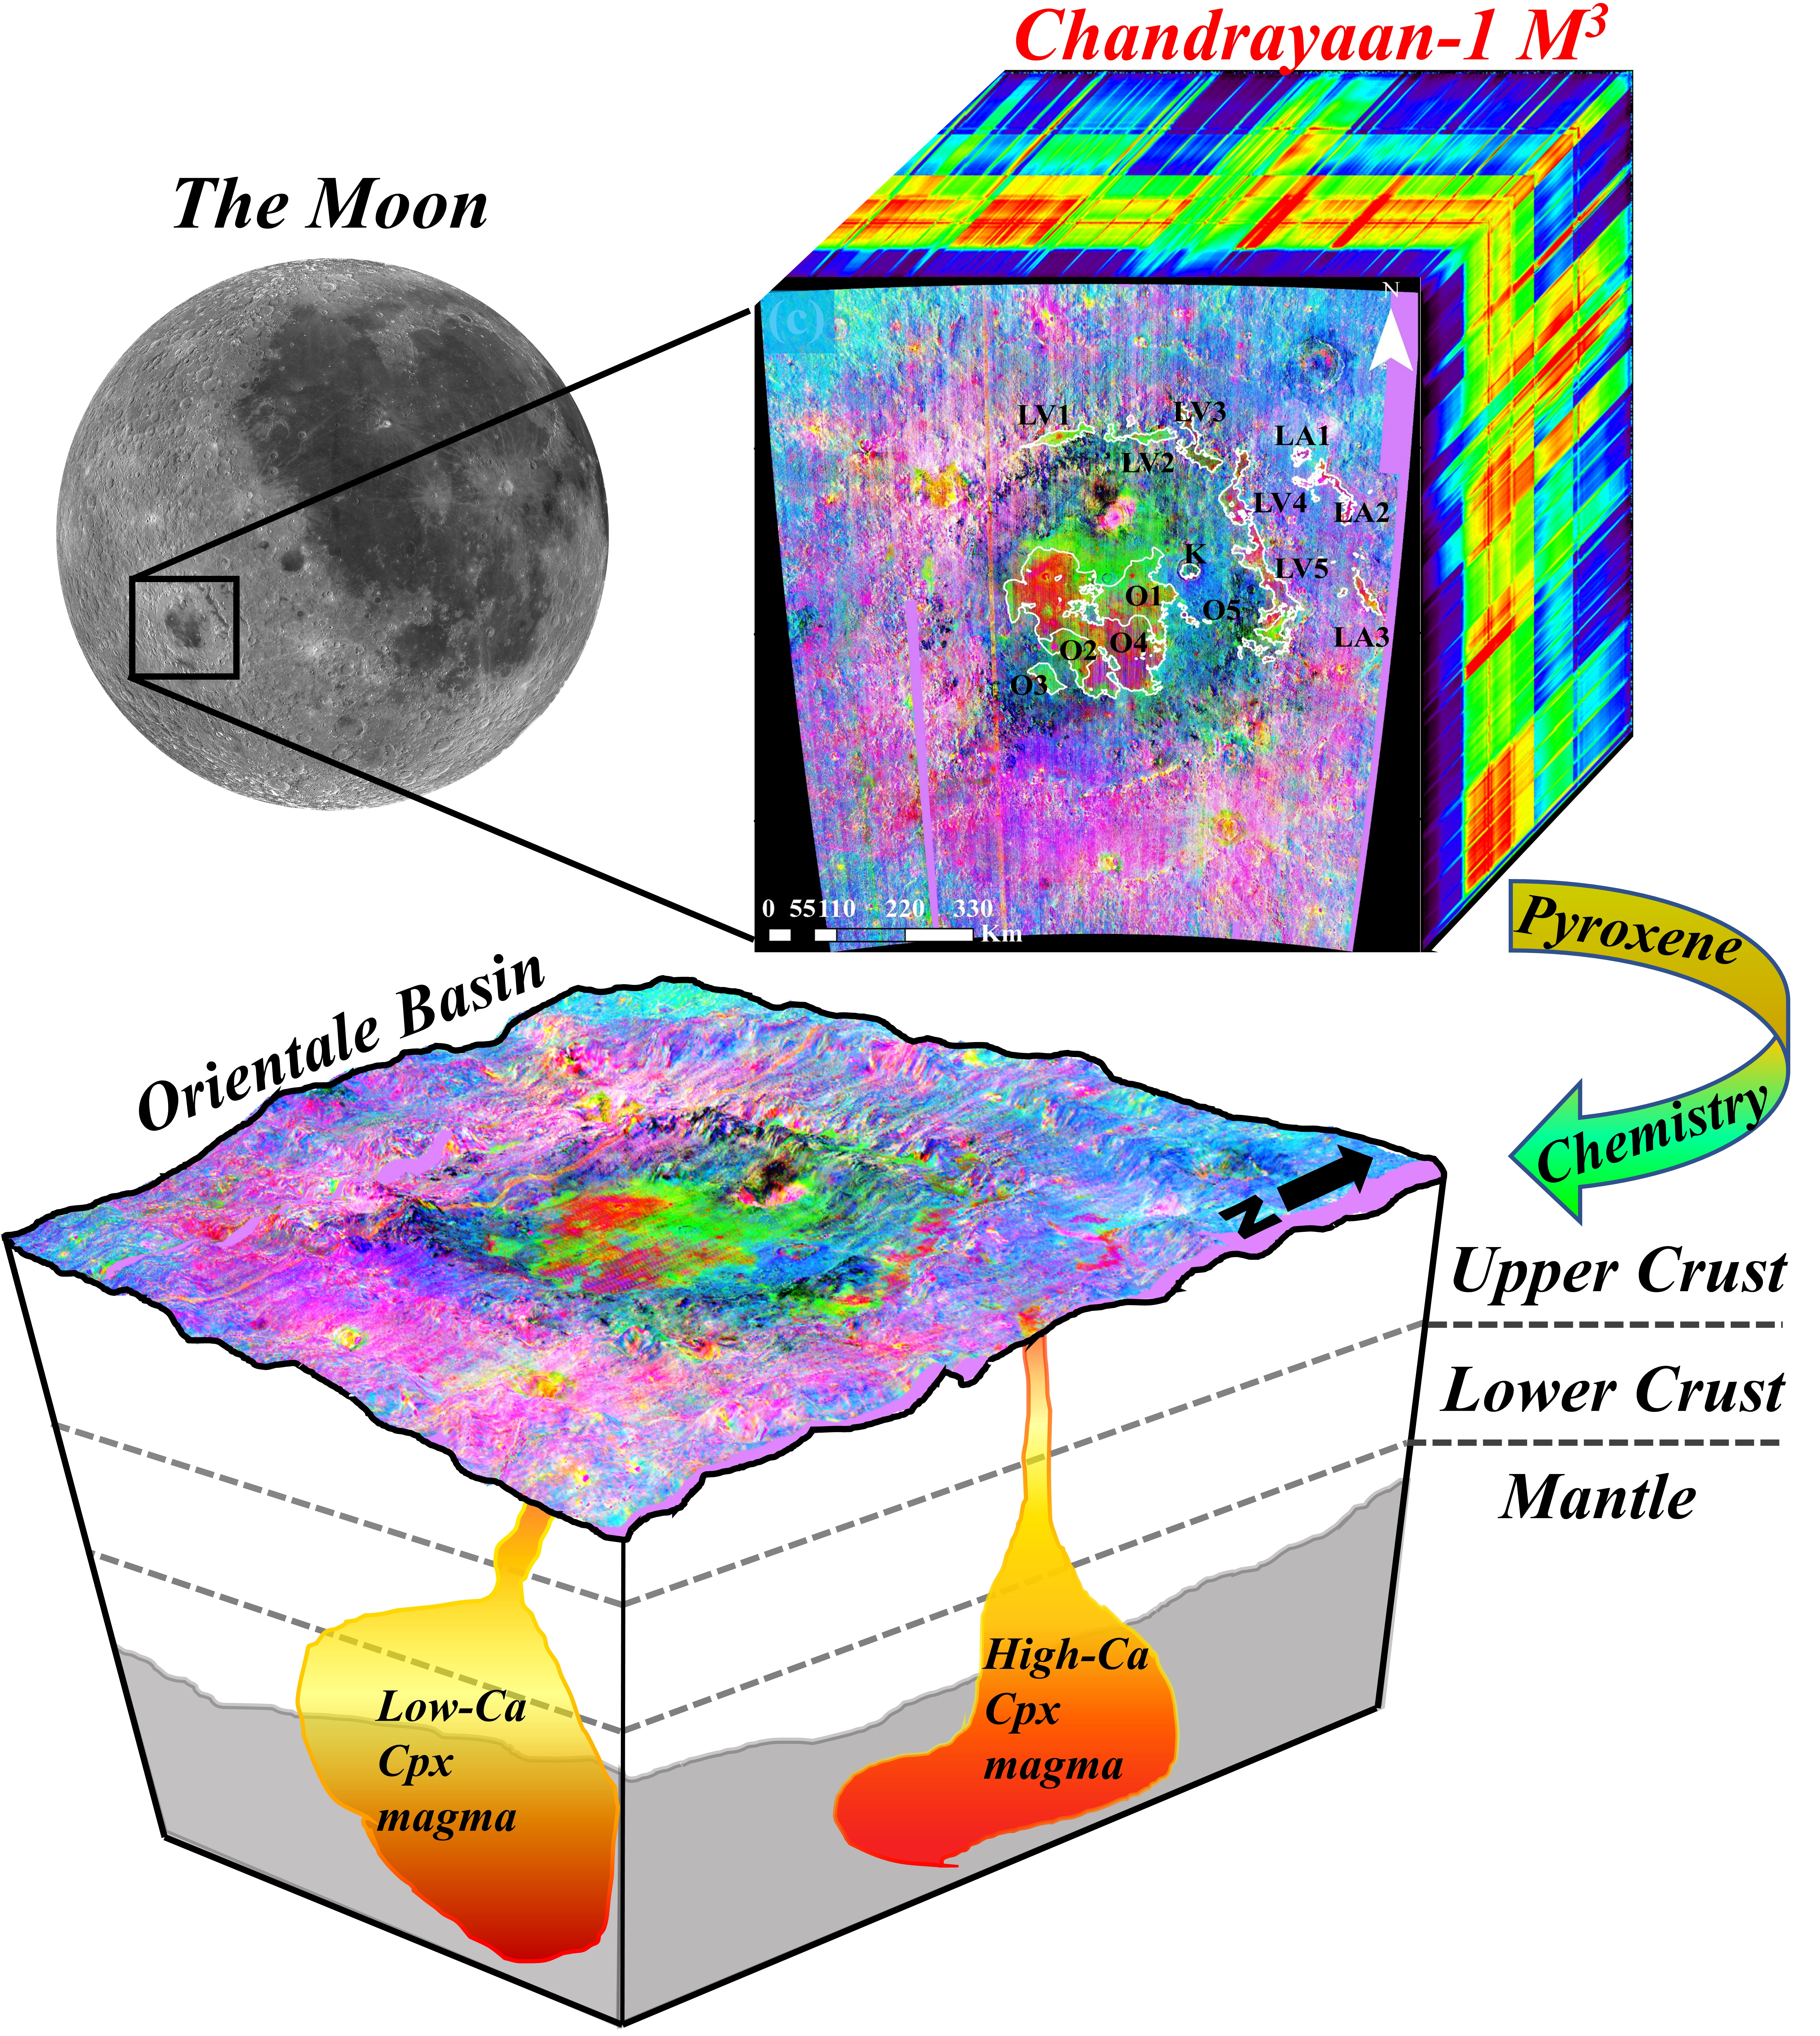
Hybrid Volcanic Episodes within the Orientale Basin, Moon

1
Space and Planetary Science Center and Department of Earth Sciences, Khalifa University, Abu Dhabi P.O. Box 127788, United Arab Emirates
2
M. G. Science Institute, Ahmedabad 380009, India
*
Author to whom correspondence should be addressed.
Remote Sens. 2023, 15(7), 1801; https://doi.org/10.3390/rs15071801
Submission received: 20 February 2023 / Revised: 21 March 2023 / Accepted: 22 March 2023 / Published: 28 March 2023
(This article belongs to the Special Issue Future of Lunar Exploration)

Abstract

:
Basalts from Mare Orientale are representative of lunar flood volcanism, which sheds light on the lunar farside’s thermal and volcanic past. We use Chandrayaan’s Moon Mineralogy Mapper data to examine the spectral and chemical makeup of the volcanic units located in the Orientale basin; the analysis specifically focuses on three formations: Mare Orientale, Lacus Veris, and Lacus Autumni. The main assemblage in these basaltic units consists of calcic augite and ferroaugite. Pyroxenes in the Orientale volcanic units have an average chemical composition of En35.53 Fs34.11 Wo30.35. The trend in the composition of pigeonites and augites suggests that the magma was fractionated as it crystallized. The pyroxene quadrilateral plot’s distinct chemical trends indicate that the Orientale Basin underwent a number of volcanic eruptions from heterogeneous magma sources during the Imbrium to Eratosthenian period.

Graphical Abstract

1. Introduction

The Moon’s composition continues to hold the key to comprehending the early stages of the Earth–Moon system’s evolution, along with the sequence of formative volcanic episodes in the chronology of other celestial bodies. In general, the lunar interior’s chemistry provides an understanding of the chemical differentiation triggered by the Theia impact event [1]. Over the years, a considerable amount of work has been dedicated to the genesis, upward migration, and volcanic discharge of basaltic magma on the surface of the Moon [2,3,4,5]. The mechanism proposed to regulate the emplacement and evolution of lunar basalts is instability within the lunar mantle resulting from a significant turnover [3,5,6]. Spectroscopists have investigated and demonstrated the mare basalt’s diverse mineralogy, which highlights the internal composition of the Moon [5,7,8,9,10,11].
On the Moon, ~17% of the surface is covered by 23 flat regions called lunar maria, located near or in impact basins [8,12]. The majority of the twenty-three lunar maria (twenty in total) can be found in the PKT region, whereas the remaining three (Mare Orientale, Moscoviense, and Ingenii) are located in the highlands [8,13]. Orientale is the youngest and best-preserved multi-ring impact basin, with three distinct concentric landforms (Inner Rook Ring, Outer Rook Ring, and Cordillera Ring) and a central depression referred to as the inner depression [5], shown in Figure 1. In [14], the authors claim that following the formation of the basin, lava erupted and flowed into it, leading to the formation of basalt deposits in the center and rim regions: (1) Mare Orientale displays a thin basaltic deposit in the inner depression. (2) Lacus Veris displays small basalt patches concentric to the Inner Montes Rook. (3) Lacus Autumni displays basaltic units between two intermediate rings (i.e., the Outer Montes Rook and Cordillera Ring).
Orientale, owing to its inadequate flooding, provides insights into the early stages of mare emplacement. For instance, it has been suggested that the composition of basaltic deposits in the Orientale basin indicates that it is mainly homogeneous, despite erupting over a time span of about ~2 Ga [5]. Thus, volcanic units of the Orientale basin were found to be the outcome of one eruptive phase, due to the absence of substantial mineralogical evidence supporting the existence of several distinct lava flow units. Lacus Veris and Lacus Autumni exhibit spectroscopic features that could result from anorthositic mixing or minor variations in the mineral concentration of basalt, despite having compositions that seem comparable to that of Mare Orientale [5]. The basaltic deposits of Lacus Veris and Autumni have a moderately higher percentage of titanium oxide content than Mare Orientale [5]. In contrast, Ref. [13] suggests that while Lacus Veris and Autumni only have a 6 wt% TiO2 content, Mare Orientale has about 15 wt% TiO2.
According to recent research, it is proposed that the basalts of Mare Orientale were created through a series of eruptions that commenced 3.77 Ga ago and continued for a prolonged duration of 1.51 Ga [8]. Moreover, it is believed that the basaltic deposits located on the periphery of the Orientale basin were discharged within 50 to 300 My after the impact event that occurred ~3.8 Ga ago, and remained active for ~0.67 Ga [8]. In reference to the study, basalts from the Orientale basin are distinguished by their history of multiple eruptions. On the other hand, Ref. [7] conducted a detailed spectral investigation of the Orientale basin’s features and, based on minor compositional variations and diverse basaltic assemblages for particular periods, suggested prolonged volcanic activity resulted from a multiphase eruption from heterogeneous or multiple sources. However, the origin of mantle deposits in the Orientale basin is still debatable. Moreover, no investigation has been conducted into the pyroxene mineralogy and chemistry of the Orientale volcanic units.
The purpose of this study is to resolve the contentious origin of mantle deposits and provide detailed characteristics of mare basalts in the Orientale basin by employing the data from a high-spatial-resolution and high-spectral-resolution spectrometer: the Moon Mineralogy Mapper. Here, we determined the chemical composition of the volcanic units of the basin, including FeO and TiO2 content, and derived the formation temperature of the lunar farside volcanic deposits, thereby providing new insights into the lunar farside mantle composition, crystallization chronology, and magma differentiation.

2. Materials and Methods

The Moon Mineralogy Mapper (M3) data used in this study have a spatial resolution of about ~140 m/pixel and 85 spectral bands covering the wavelength range of 0.43–3.0 µm. We utilized Level 2 data from the Planetary Data System, which were corrected for radiometric and photometric errors using the image-specific metadata [15,16]. Between 2.5 and 3 µm wavelength, the thermal aspect of the M3 spectrum results in a steeper curve, which can adversely affect the analysis of spectral features that rely on Band II absorptions [17]. To lessen this effect, we truncated the M3 data at 2.497 µm in this paper, similar to Zhang et al. [18]. Each image was georeferenced and stitched together to obtain a comprehensive map of the basin. Mafic-rich and calcic-plagioclase-rich lithology were distinguished using the integrated band depth (IBD) maps for 1 µm and 2 µm absorption [19,20]. The M3 data was used to extract the FeO content after accounting for the spectral characteristic angle parameter [21]. We applied Shkuratov’s model to retrieve the TiO2 content, as recommended in the study by Zhang & Bowles [21]. Shkuratov [22] examined the relationship between FeO and TiO2 on the lunar nearside by investigating the correlation between the two elemental oxides. The M3 dataset is in agreement with the return sample data, with a variation of less than 15% [21]. The equation to estimate FeO and TiO2 weight percentage is as following:
θFe = −arctan {(R950/750 − 1.26)/0.01}
FeO% = 17.83 × θFe − 6.82
log (TiO2 [%]) = 0.06 (FeO [%]) − 0.54
By fitting a fourth-order polynomial line to each spectrum, a method that was adopted from [2,3], spectral parameters such as band center (BC: wavelength of the minimum reflectance value of polynomial fitted spectra after the continuum is removed), band area (BA: total area beneath each individual continuum section), and band depth (BD: 1-BC) were calculated. In order to remove the olivine effect from the Band I center data of olivine-and-pyroxene-mixed reflectance spectra, the authors of [23,24] developed calibration equations. The estimated olivine-corrected BC I and BC II values are employed to calculate the molar fraction of Ca, Fe, and Mg assemblage in pyroxenes, using a series of equations provided by [24] to depict those data in the pyroxene quadrilateral [3]. The chemical variation of pyroxene, the history of magma crystallization, and the cooling temperature are investigated using a graphical two-pyroxene thermometer [25].

3. Results and Discussion

3.1. Mineralogy

We determined the distribution of pyroxenes in terms of Low-Ca Pyroxene (LCP) and High-Ca Pyroxene (HCP), as shown in the following band depth images (Figure 2a,b). Pyroxene has significant absorption at 1 µm and 2 µm, with LCP BC values ranging from 0.9 to 0.93 µm and 1.8 to 2.1 µm [26,27] and HCP BC values varying from 0.91 to 1.06 µm and 1.97 to 2.35 µm [26,27]. In Figure 2a, LCP-rich areas are presented as bright pixels, and we observed that these areas are restricted to (1) Small craters of basaltic units; (2) The Maunder crater, situated in the Inner Rook Ring; (3) The Montes Rook and the Hevelius formation. The band depth image for HCP, i.e., BD 2300 (Figure 2b), displays most of the basalt-rich regions as bright pixels, which means Band II depth is greater relative to Band I; this could be ascribed to the occurrence of clinopyroxenes.
All the basaltic units show pyroxene spectra with a variation in the Band I and Band II centers, and band depths except from Locations 1, 4, and 8. Spectra 1, 6, and 8 are located outside the central basalt fill of the mare basin. Plagioclase and mafic mineral mixture (Spectrum 1, Figure 2e,f) show a distinct band center at ~1.268 µm and weak absorption at ~0.81 µm and ~2.06 µm, which indicates the presence of mafic silicates. The mixture of felsic and mafic silicates likely infers that the impact melt sheet contains crustal anorthositic material.
Figure 2e,f show Spectrum 8, which exhibits strong absorption at ~1.283 µm, suggesting the presence of non-mare anorthositic material. The exposed plagioclase material is either related to upper crustal material from a raised floor of the Kopff crater, or more likely related to a buried collapsed platform [5].
We observed a concentration of olivine minerals in the ejecta blanket of the Il’in crater (Spectrum 4, Figure 2e,f), exposing the excavated fresh basaltic material from below the surface. Spectrum 4 displays strong Band I absorption with a BC at ~1.04 µm and weak Band II absorption with a BC at ~2.15 µm. The high concentration of FeO-rich glass could potentially cause a long ward shift in the BC II value [3,15]. On the other hand, glass will cause a short ward shift of the BC II and an increased BS II compared to Band I, which contrasts the sample reflectance of Spectrum 4. As a result, the long ward shift in BC I and the higher BS I seen in Spectrum 4 are decisively compatible with olivine abundance. This evidence points to the existence of olivine-rich basalt. The pyroxene spectra from mare units exhibit an additional absorption of around 1.3 µm, which could be due to plagioclase or high Fe2+ content. The occurrences of the mixture were noticed in association with fresh small-impact craters, which expose underlying basaltic rock.
Several studies employed the Spectral Parameter (SP) False Colour Composite (FCC) approach to document the differences in minerals and highlight the spectral diversity [28,29]. In the investigation carried out by Purohit et al. [28] that adopted SP FCC, troctolitic and noritic lithology, as well as spectral indications of highland and mare mixing were found in the floor-fracture crater Gassendi. The study of the Ohm crater noted the subjective interpretation of diverse composition in M3 FCC, reflecting the spatial extent of the crater’s ray system having an unconstrained proportion of mafic rock [29]. To study the spectral variability of the Orientale basin, we prepared the FCC image. The occurrence of LCP, which relates to norite lithology, is displayed with the magenta color in the band parameter map (Figure 2c). The green color shows the prevalence of HCP deposits consistent with the gabbroic composition, and the yellow color indicates the orthopyroxene and clinopyroxene mixture. The blue coloration represents the geographical distribution of anorthositic crust or plagioclase-dominant rock. In Figure 2c, bright white pixels show the presence of olivine minerals.

3.2. Albedo Variation

The difference in the surface albedo reflects the surface’s maturity and mineralogy [20,30]. We utilized the M31.578 µm channel as an albedo map to elucidate the variations in albedo within the Orientale volcanic units (Figure 2d). Due to the occurrence of mafic minerals, we found lower albedo in mare units compared to the bright surrounding highlands (>0.15). We delineated fourteen major basaltic units in total, namely O1, O2, O3, O4, O5, K, LV1, LV2, LV3, LV4, LV5, LA1, LA2, and LA3. The O4 unit shows the lowest albedo values (~0.04–0.064), which could be attributed to its high content of mafic minerals, specifically pyroxene. The units O1 and O2 surround the O4 unit in the NE and SW, with average albedo values of ~0.075 and ~0.087, respectively. The average albedo value of units O3 and O5 are ~0.103 and ~0.099, respectively, which is relatively higher than the other Mare Orientale units. The observed trend may have resulted from a lateral and vertical mix-up of highland material and thin mare deposits [5,13]. We determined the average albedo value of the Kopff crater’s basaltic unit to be ~0.099. The average albedo values in the Lacus Veris units range from ~0.106 to 0.137, likely due to the thin basaltic deposits and lateral mixing. The younger Lacus Autumni units [31] have relatively lower albedo values, ranging from ~0.088 to 0.105.

3.3. FeO and TiO2 Abundance Map

We generated the abundance maps of FeO and TiO2 (Figure 3a,b) using the M3 dataset [21]. In the Mare Orientale, we observed that the FeO content varies between approximately 9.8 wt% and 17.6 wt%, while the TiO2 content ranges from roughly less than or equal to 2 wt% to 7 wt%. The O4 unit shows high FeO (~14.2–17.6 wt%) and intermediate TiO2 (~5–7 wt%) content. The FeO and TiO2 contents of basalt at the Kopff crater are ~11.64–18 wt% and ~3–4 wt%, respectively. The FeO abundance in the Lacus Veris region ranges from ~8.3 to 16.7 wt%, whereas in Lacus Autumni it ranges between ~7.1 wt% and 17.05 wt%. Lacus Veris has a low-to-intermediate abundance of TiO2, ranging from ~2 to 5 wt%. The LA1 unit of Lacus Autumni exhibits intermediate titanium oxide ranges from ~5 to 6 wt%. The LA2 and LA3 units show a low abundance of TiO2, ranging from ~2 to 5 wt%.
The Clementine FeO weight percentage of the Mare Orientale is 8–18 wt%, for the Kopff crater it varies between 10 wt% and 18 wt%, and for Lacus Veris as well as Lacus Autumni it was observed to range from 6 to 16 wt% [32]. TiO2 weight percentage derived from the Clementine data for the Mare Orientale is ~1–8 wt%, for the Kopff crater it ranges from 1 to 3 wt%, whereas for Lacus Veris and Lacus Autumni it varies between ~1 wt% and 4 wt%, respectively [32].
The Kaguya ferrous oxide concentration of the Mare Orientale is ~8.87–18 wt%. For the Kopff crater it is ~7.4–13.9 wt%, while for Lacus Veris and Lacus Autumni it is ~6.23–15.6 wt% and ~8.9–17.74 wt%, respectively [33]. The weight percentage of titanium oxide derived from the LROC–WAC for the Mare Orientale is ~0–8 wt%, for the basaltic deposits of the Kopff crater it is ~0–3.1 wt%, and for Lacus Veris and Lacus Autumni it is ~<2–6 wt% and ~0–4.77 wt%, respectively [34]. Our results are in agreement with Kaguya, WAC, and Clementine-derived ranges of FeO and TiO2.

3.4. Compositional Variations from M3 Data Analysis

We categorized the mare region of the Orientale basin into fourteen spectral units (O1, O2, O3, O4, O5, K, LV1, LV2, LV3, LV4, LV5, LA1, LA2, and LA3) based on the differences observed in albedo, FeO, TiO2 content, minimal noise fraction (MNF) image, IBD parameter map, and absolute modelled age, previously defined by [5,31] (Figure 2d and Figure 3). The IBD map provides a representation of the primary compositional differences present in the basaltic plains of the lunar mare [2,3,4,28,35]. The M3 color composite (Figure 3c,d) exhibits the transition in mineral composition within the basaltic units, represented by different shades within the mare units of the basin. The limits of distinct mare units in the Orientale basin are marked by white boundaries, as illustrated in Figure 3. In Figure 3d, the blue areas denote the highland terrains and the Kipukas crater surrounded by the Mare Orientale. The mare’s basalt is evidently distinguishable from that of the neighboring highland terrain, owing to its yellow–orange shades. The low-titanium basaltic units show various shades of an orange hue, whereas medium-/intermediate-titanium mare units display a yellow color. We obtained reflectance spectra from each unit individually, as shown in Supplementary Figures S1–S3. The reflectance spectra obtained from various units are illustrated in these figures, featuring both the original spectra and those with the continuum removed. The spectra display major absorption bands at 1 µm and 2 µm wavelength, indicating the presence of mafic minerals such as pyroxenes or an olivine–pyroxene mixture.
The minimal noise fraction (MNF) transformation, a two-step Principal Component transformation, is used to (1) determine hyperspectral data’s dimensionality, (2) separate noise in the data, and (3) decrease computational needs for future processing [36]. In spectral data, MNF is useful for assessing statistical variability [29]. The MNF method seeks highest variance, which is effectual for inspecting the spectral difference [29]. On the other hand, the utilization of MNF involves the reorganization of the original information into a new configuration where the characteristics are restricted to a small number of components arranged in descending order of signal to noise ratio (SNR) for the purpose of enhancing image quality, and the distribution of data is intended to display the variability of each individual dataset [37]. This technique extracts high-quality attributes from spectral data into a few MNF components [29]. MNF Components 7, 8 and 9, depicted in Figure 3c, revealed interesting spectral changes based on a visual assessment of the MNF bands. MNF bands enhance spectral contrast (Figure 3c) and illustrate additional spectral changes in craters, which are not visible in the IBD map (Figure 3d). The craters located within the units O1, O2, K, LV1, and LV2 appear light pink on a green background. Unit O3 stands out as distinctive, owing to its polygonal shape, and depicts a green hue, shown in Figure 3c. The other units O4, O5, LV3, LV4, LV5, LA1, LA2, and LA3 appear light pink to orangish-pink in color; however, the craters located in these units appear dark pink to red. We investigated the spectral characteristics of each mapped unit by sampling the craters within that unit, and the results are discussed in the following Section 3.5.

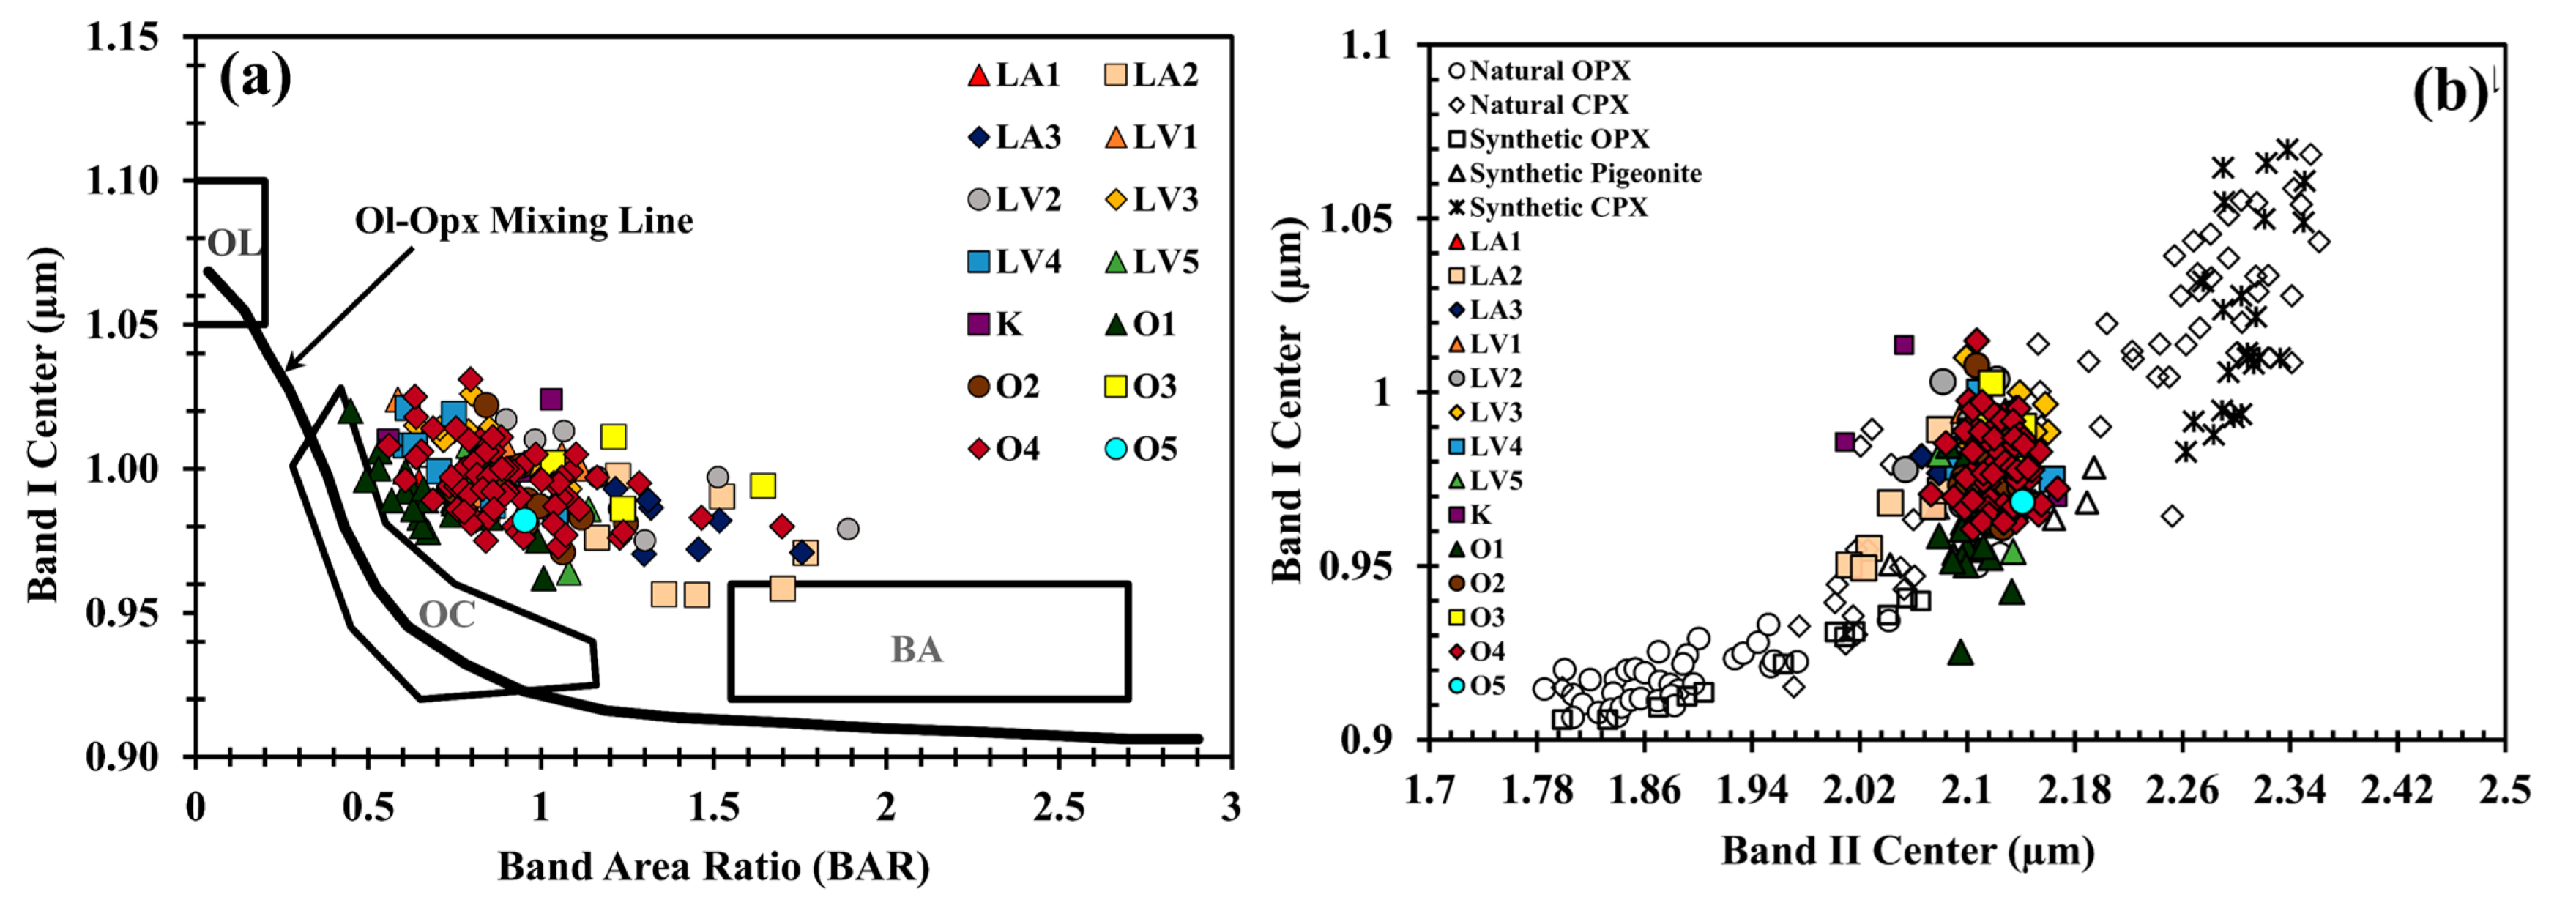
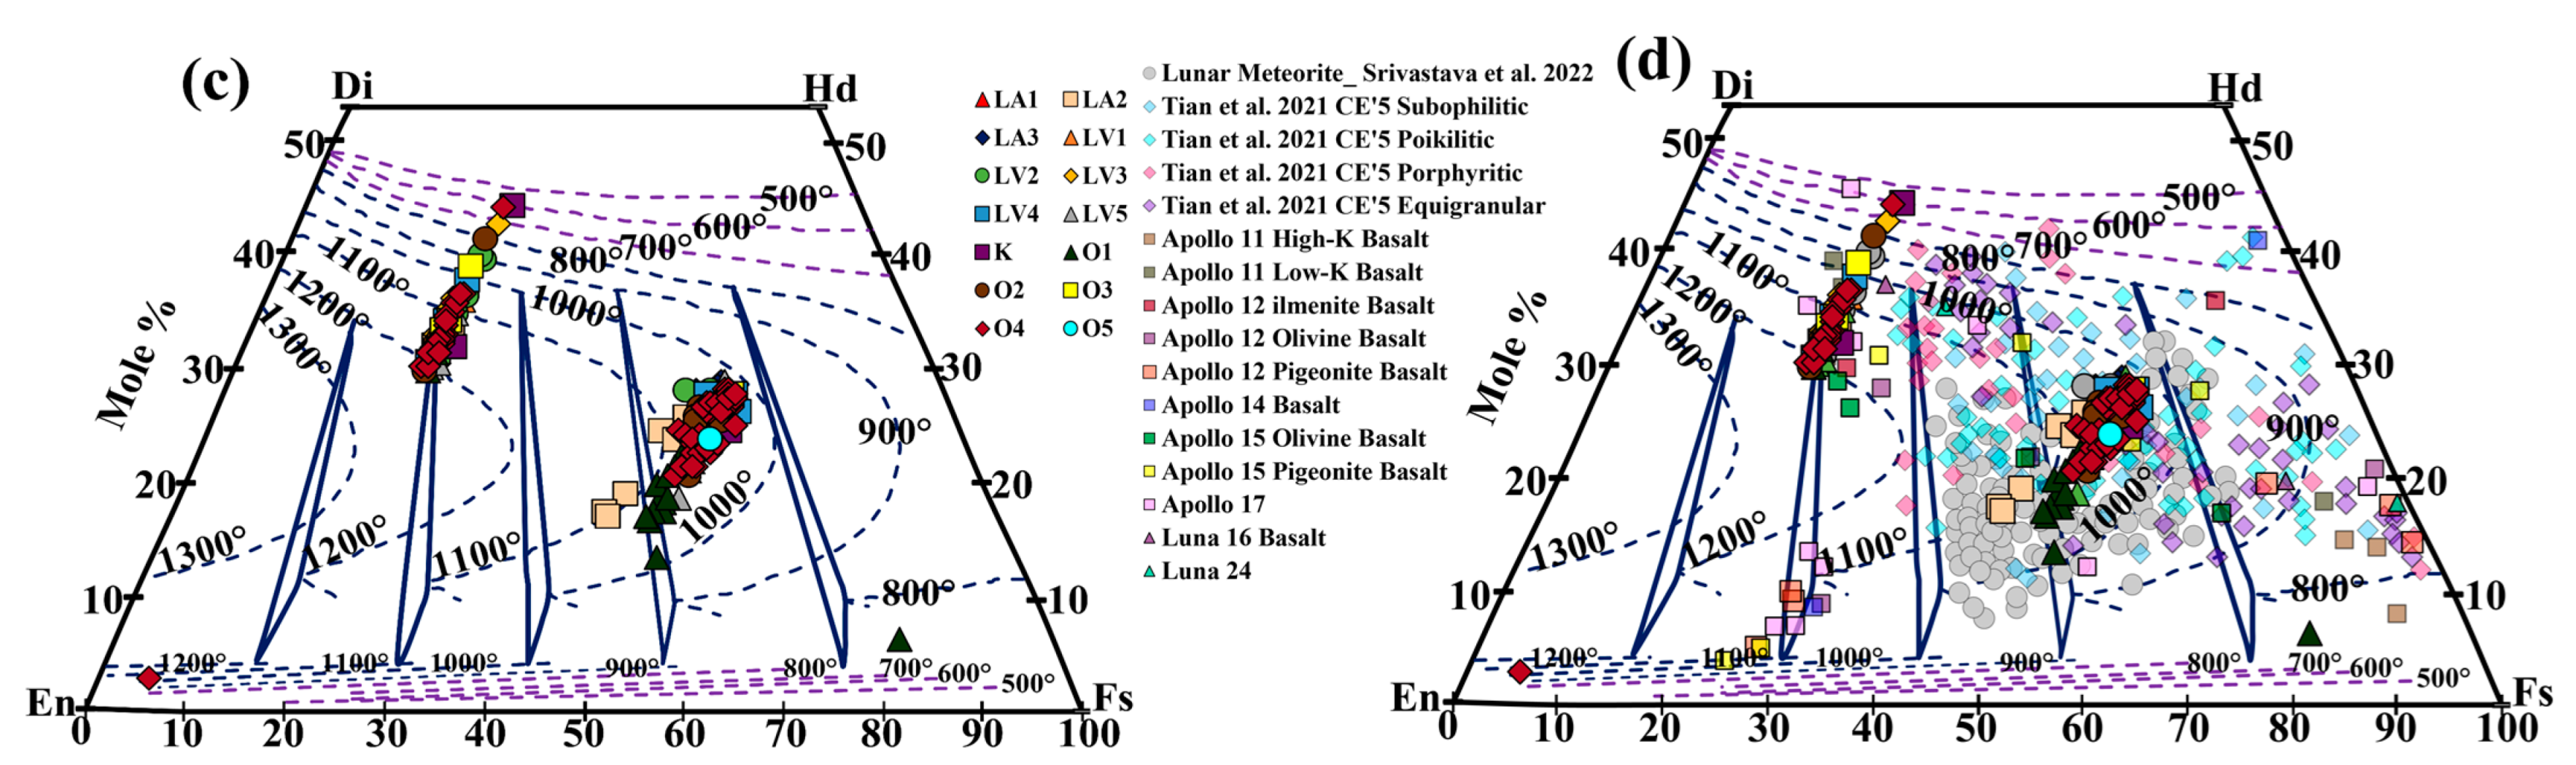
3.5. Composition of the Pyroxene-Based on Band Parameter Analysis

We collected approximately 181 M3 spectra from mare units of the Orientale basin to characterize their basalt composition. To determine the quantitative composition, we calculated the Band I and Band II parameters such as band center (BC), band area (BA), band strength (BS), and band area ratio (BAR, defined as the ratio of BA II to BA I) for the collected spectra, based on the method adopted from [2,3]. Measured data is provided in Table S1.
The units of Mare Orientale and the Kopff crater display BC I values between ~0.982 µm and ~1.011 µm and BC II values between ~2.076 µm and ~2.127 µm. In the Lacus Veris region, BC I values range from ~0.991 to ~1.009 µm, and BC II values vary from ~2.107 to ~2.127 µm. The Lacus Autumni units display both BC I and BC II values at relatively shorter wavelengths, ranging from ~0.983 to ~0.995 µm and ~2.061 to ~2.112 µm, respectively. Figure 4 shows the chemistry and crystallization history of pyroxene minerals.
We plotted BAR versus BC I (Figure 4a) to comprehend the olivine and pyroxene mixture in the collected spectrum. The mare composition falls in the region of clinopyroxenes. We observed that six mare units of the Orientale basin (O1, O4, LV1, LV3, LV4, and LA1) have BAR values ranging from ~0.646 to ~0.903, exhibiting the olivine-dominated mineralogy. We observed that as the olivine concentration in the spectrum increases, the BC I gets longer, with a concomitant reduction in the BAR [23]. Apart from the aforementioned six units, the BAR value for other mare units ranges from ~0.9 to ~1.37, which indicates a significant concentration of the clinopyroxene mineral. We observed an increase in BAR value as the pyroxene mineral dominates the spectral data [23]. This suggests that the minerals represent the transition from olivine to pyroxene dominance.
As most samples illustrate evidence of olivine and pyroxene mixture in spectral analysis, a correction factor [23,24] was employed to the BC I to eliminate the potential influence of olivine, as explained in Section 2. We measured the average displacement in the BC I to be ~0.0157 µm. Thus, the corrected BC I values are presented in Table S1. Natural pyroxene data from [38] and synthetic pyroxene data from [39] are displayed in Figure 4b alongside analyzed pyroxene data, to compare and interpret compositional affinity. The BC II vs BC I graph reveals the compositional trend from Low-Ca to High-Ca pyroxenes (Figure 4b). In the mare units, the bulk of the pyroxenes cluster between 2.061 and 2.128 µm, which indicates a shift in BCs towards longer wavelengths. This represents a compositional transition from sub-calcic to augite.
The estimated band parameters of pyroxene can be utilized to determine the proportionate amount of pyroxene compositions [2,3,4,24]. We used the calibration equations to calculate the abundance of these pyroxenes [24]. We projected the calculated element abundances onto a Wo–En–Fs quadrilateral plot to comprehend the relative amounts of Calcium-rich pyroxene, Magnesium-rich pyroxene (Clinoenstatite), and Iron-rich pyroxene (Clinoferrosilite) [25]. In Figure 4c, the average composition in the Mare Orientale, Kopff, Lacus Veris, and Lacus Autumni units are En33Fs397Wo28, En35Fs30Wo35, En39Fs28Wo33, and En35Fs39Wo26, respectively. This indicates the crystallization of pigeonite, sub-calcic ferroaugite, ferroaugite, and augite. These data were plotted along with the pyroxene composition from lunar meteorite samples as well as basalts returned by the Apollo, Luna and Chang ‘E-5 missions, as seen in Figure 4d. The study of pyroxene in the Kopff crater and Lacus Veris reveals Wo values greater than 30, meaning the pyroxene there is of an intermediate type that is closer to Type A, which could account for the relatively high BA I values. Type A pyroxene displays a complicated absorption at 1 µm which is caused by the presence of Fe2+ in the M1 site and Ca2+ in the M2 site [39]. This trend increases the calcium content in pyroxene [39]. The intermediate pyroxene type, which is more similar to Type A, has high BA I and low BA II values [40].The existence of high-calcium clinopyroxene in two out of four basalt formations indicates that the magma source is heterogeneous.
The pyroxene compositions in the basaltic units of the Orientale basin predominantly fall within the “forbidden zone” on the Wollastonite–Enstatite–Ferrosilite (Wo–En–Fs) quadrilateral plot (as illustrated in Figure 4c). This region signifies a state in which a pyroxene of intermediate composition is not stable under low-pressure conditions [25]. Fe-rich pyroxene with zoning to pyroxferroite, found in the forbidden region, has been identified in the Moon’s mare basalts, due to the combination of metastability and fast crystallization processes [41,42]. In addition to the conventional pyroxene–olivine–silicate suite, extremely Fe-rich pyroxene, or pyroxferroite (~Wo14En11Fs75), crystallizes in a metastable form due to the fast cooling of late-stage melts [3]. The pyroxenes from the O1, O2, O3, O4, LV1, LV2, LV4, LV5, LA2, and LA3 units show clusters near the Di-Hd line indicative of the presence of high-Mg-Ca augite. Pyroxenes from rapidly cooled basalts often have this type of grouping. The ferroaugites and pigeonites observed from these units tend to cluster in the forbidden zone. The crystallization process commences with an augitic composition rich in Mg and Ca, and as the temperature drops, it gradually shifts towards an endmember that is richer in Ca. The delayed nucleation of plagioclase in mare basalt liquids significantly influences the liquids’ Ca concentration and the subsequent pyroxenes of the residual liquid of low-to-intermediate titanium basalt. This therefore results in a chemical trend gap in these pyroxenes. The pyroxenes’ intermediate calcium concentration between clinopigeonite and clinopyroxene-augite indicates that they formed under the metastable condition from an iron-rich, late-stage magma at a fast cooling rate [43]. The crystallization temperature of these units ranges between ~1200 °C and 800 °C, as seen in Figure 4c. The augites found in the K and LV3 units form a distinct cluster close to the Di-Hd line, indicating that they crystallized from a magma with high concentrations of Mg and Ca. These minerals formed at temperatures between approximately 600 °C and 1200 °C. The ferroaugite compositions observed in units LA1 and O5, as illustrated in Figure 4c, suggest that they were formed through metastable crystallization from a melt that cooled rapidly in a later stage. However, the slow cooling of magma can sometimes lead to late-stage quenching of the residual melt, resulting in the crystallization of metastable pyroxene compositions that are often unstable in the forbidden region of the Wo–En–Fs ternary plot. Thus, the Fe-rich pyroxenes found in these basalts are plausibly the product of magma fractionation under rapid cooling settings [3]. In addition, the magma that was depleted in Mg and Ca and enriched in Fe underwent fractionation during the later stage, cooling rapidly at a temperature range of ~1100 to 1000 °C.
Figure 4. (a) BAR vs BC I graph [44]. The area of the OC polygon corresponds to mafic silicate composition of ordinary chondrites, whereas the BA rectangular region represents pyroxene-dominated basaltic achrondrites [44]. (b) BC II vs BC I (corrected) graph of pyroxene spectra from the mare units. (c) Pyroxene quadrilateral (Wo–En–Fs ternary) graph projecting the mole fraction of Ca, Mg, and Fe content in pyroxenes from each mare unit, along with the pyroxene isotherm determined by the graphical thermometer generated by [25]. (d) Comparison between the pyroxene chemistry of the mare units and that of the Apollo, Luna, Chang ‘E-5 (CE-5), and other lunar meteorite samples [41,42,45,46].
Remotesensing 15 01801 g004aRemotesensing 15 01801 g004b
The Orientale basin’s young mare deposits are contemporaneous with the young volcanic deposits discovered at PKT on the lunar nearside [31]. The peak volcanic eruptions, which occurred around 2 Ga, were not restricted to the PKT but also covered other parts of the Moon. The volcanism in the Orientale basin lasted about ~1.9 Ga (from the Imbrium to the Eratosthenian period), thus it is highly likely that the underlying mantle had a high initial temperature and/or a high concentration of radioactive sources [31].

4. Conclusions

The non-mare region of the Orientale basin shows a spectral mixture of plagioclase and mafic materials, indicating the exposure of upper crustal anorthositic rock. The mafic signature might be from the impact melt sheet that formed during the modification of the Orientale basin, which was later exposed by excavating the upper layer of the crust during the impacts that occurred after the basin’s development. The basaltic materials to the southwest of the Orientale basin are found to contain the olivine (troctolite or dunite), clinopyroxene, and cumulate of clinopyroxene and plagioclase (anorthositic gabbro or gabbroic anorthosite) that is plausibly the remnant of the lunar magma ocean and subsequent magmatic intrusions into the crust. The other probable origin might be from the derivation of deep lower-crustal or upper-mantle sources. The southeastern basaltic region exhibits a medium TiO2 concentration and is predominantly olivine ± clinopyroxene and clinopyroxene ± plagioclase material.
In this study, we examined the chemical variations of the multiple basaltic units in the Orientale basin. We derive that the pyroxenes of mare units, varying from pigeonite to calcic augite composition, crystallized at around ~1200 °C to ~600 °C. The pyroxene crystallization history, observed at fourteen basaltic units, indicates several volcanic episodes in the Orientale basin. Initially, most mare units were formed by the crystallization of Mg-enriched and Ca-enriched magma that underwent an ultra-late-stage cooling. Few units formed from Fe-enriched (or Mg-Ca-depleted) late-stage fractionated magma, distinctly. Thus, we suggest that the basaltic units of the Orientale basin erupted from a spectrum of magma sources and post-magma generation progressions during the Imbrium and Eratosthenian periods.

Supplementary Materials

The following supporting information can be downloaded at https://www.mdpi.com/article/10.3390/rs15071801/s1: Table S1: The average band parameter values of pyroxenes in the O1, O2, O3, O4, O5, K, LV1, LV2, LV3, LV4, LV5, LA1, LA2, and LA3 units, and the ages of these units established by past studies. Figure S1: Reflectance spectra of different minerals from the Mare Orientale region are shown in (a–j). Normal reflectance spectra and continuum-removed reflectance spectra for O1, O2, O3, O4, and O5 basaltic units have been plotted. The locations where spectra were collected are identified and marked in Figure 4d. Figure S2: Reflectance spectra of different minerals from the Lacus Veris region are shown in (a–j). Normal reflectance spectra and continuum-removed reflectance spectra for LV1, LV2, LV3, LV4, and LV5 basaltic units have been plotted. The locations where spectra were collected are identified and marked in Figure 4d. Figure S3: Reflectance spectra of different minerals from the Kopff Crater and the Lacus Autumni region are shown in (a–h). Normal reflectance spectra and continuum-removed reflectance spectra for K, LA1, LA2, and LA3 basaltic units have been plotted. The locations where spectra were collected are identified and marked in Figure 4d.

Author Contributions

Conceptualization, S.M.P., H., D.P., P.M.S. and M.R.E.-M.; methodology, S.M.P.; software, S.M.P., H., D.P. and M.R.E.-M.; validation, S.M.P. and P.M.S.; formal analysis, S.M.P.; investigation, S.M.P. and P.M.S.; resources, P.M.S. and M.R.E.-M.; data curation, S.M.P., H. and D.P.; visualization, S.M.P. and H.; writing—original draft, S.M.P. and H.; supervision, P.M.S. and M.R.E.-M.; funding acquisition, M.R.E.-M. All authors have read and agreed to the published version of the manuscript.

Funding

This project was funded by an internal grant from Khalifa University, United Arab Emirates (Grant No. 8474000336-KU-SPSC).

Data Availability Statement

The LROC–WAC global map is available on NASA’s LRO website at https://wms.lroc.asu.edu/lroc/view_rdr/WAC_GLOBAL (accessed on 11 August 2022). The SLDEM global map was downloaded from the USGS Astropedia website, https://astrogeology.usgs.gov/search/map/Moon/LRO/LOLA/Lunar_LRO_LOLAKaguya_DEMmerge_60N60S_512ppd (accessed on 3 November 2022). Moon Mineralogy Mapper (M3) data is publicly available on the Planetary Data System (PDS) Archive, at https://pds-geosciences.wustl.edu/dataserv/moon.html (accessed on 20 June 2022).

Acknowledgments

S. M. Patel, Harish, and M. R. El-Maarry acknowledge support for this work through an internal grant (8474000336-KU-SPSC).

Conflicts of Interest

The authors declare that they have no known competing financial interest or personal relationships that could have appeared to influence the work reported in this paper.

References

  1. Farcy, B.; Arevalo, R.; McDonough, W.F. Understanding the Lunar Nearside–Farside Dichotomy via In Situ Trace Element Measurements: The Scientific Framework of a Prospective Landed Mission. Planet. Sci. J. 2021, 2, 80. [Google Scholar] [CrossRef]
  2. Kaur, P.; Bhattacharya, S.; Chauhan, P.; Ajai; Kiran Kumar, A.S. Mineralogy of Mare Serenitatis on the near Side of the Moon Based on Chandrayaan-1 Moon Mineralogy Mapper (M3) Observations. Icarus 2013, 222, 137–148. [Google Scholar] [CrossRef]
  3. Thesniya, P.M.; Rajesh, V.J.; Flahaut, J. Ages and Chemistry of Mare Basaltic Units in the Grimaldi Basin on the Nearside of the Moon: Implications for the Volcanic History of the Basin. Meteorit. Planet. Sci. 2020, 55, 2375–2403. [Google Scholar] [CrossRef]
  4. Thesniya, P.M.; Rajesh, V.J. Pyroxene Chemistry and Crystallization History of Basaltic Units in the Mare Humorum on the Nearside of the Moon: Implications for the Volcanic History of the Region. Planet. Space Sci. 2020, 193, 105093. [Google Scholar] [CrossRef]
  5. Whitten, J.; Head, J.W.; Staid, M.; Pieters, C.M.; Mustard, J.; Clark, R.; Nettles, J.; Klima, R.L.; Taylor, L. Lunar Mare Deposits Associated with the Orientale Impact Basin: New Insights into Mineralogy, History, Mode of Emplacement, and Relation to Orientale Basin Evolution from Moon Mineralogy Mapper (M3) Data from Chandrayaan-1. J. Geophys. Res. 2011, 116, E00G09. [Google Scholar] [CrossRef] [Green Version]
  6. Hess, P.C.; Parmentier, E.M. Thermal Evolution of a Thicker KREEP Liquid Layer. J. Geophys. Res. 2001, 106, 28023–28032. [Google Scholar] [CrossRef]
  7. Karthi, A.; Arivazhagan, S. Chronological and Compositional Mapping of the Mare Orientale Basin Using Chandrayaan-1—M3 and LRO Datasets. Icarus 2022, 375, 114844. [Google Scholar] [CrossRef]
  8. Liu, J.; Liu, J.; Wang, J.; Zhu, K.; Zhang, L. Basalt Chronology of the Orientale Basin Based on CE-2 CCD Imaging and Implications for Lunar Basin Volcanism. Remote Sens. 2022, 14, 1426. [Google Scholar] [CrossRef]
  9. Lucey, P. Understanding the Lunar Surface and Space-Moon Interactions. Rev. Mineral. Geochem. 2006, 60, 83–219. [Google Scholar] [CrossRef]
  10. Pieters, C.M.; Head, J.W.; Sunshine, J.M.; Fischer, E.M.; Murchie, S.L.; Belton, M.; McEwen, A.; Gaddis, L.; Greeley, R.; Neukum, G.; et al. Crustal Diversity of the Moon: Compositional Analyses of Galileo Solid State Imaging Data. J. Geophys. Res. 1993, 98, 17127. [Google Scholar] [CrossRef]
  11. Staid, M.I.; Pieters, C.M.; Head, J.W. Mare Tranquillitatis: Basalt Emplacement History and Relation to Lunar Samples. J. Geophys. Res. 1996, 101, 23213–23228. [Google Scholar] [CrossRef]
  12. Head, J.W.; Hawke, B.R. Geology of the Apollo 14 Region (Fra Mauro): Stratigraphic History and Sample Provenance. Lunar Planet. Sci. Conf. Proc. 1975, 3, 2483–2501. [Google Scholar]
  13. Arivazhagan, S. Quantitative Characterization of Lunar Mare Orientale Basalts Detected by Moon Mineralogical Mapper on Chandrayaan-1. In Planetary Exploration and Science: Recent Results and Advances; Springer: Berlin/Heidelberg, Germany, 2015; pp. 21–43. [Google Scholar]
  14. Greeley, R. Modes of Emplacement of Basalt Terrains and an Analysis of Mare Volcanism in the Orientale Basin. Lunar Planet. Sci. Conf. Proc. 1976, 3, 2747–2759. [Google Scholar]
  15. Besse, S.; Sunshine, J.M.; Gaddis, L.R. Volcanic Glass Signatures in Spectroscopic Survey of Newly Proposed Lunar Pyroclastic Deposits: Lunar Volcanic Glass. J. Geophys. Res. Planets 2014, 119, 355–372. [Google Scholar] [CrossRef]
  16. Boardman, J.W.; Pieters, C.M.; Green, R.O.; Lundeen, S.R.; Varanasi, P.; Nettles, J.; Petro, N.; Isaacson, P.; Besse, S.; Taylor, L.A. Measuring Moonlight: An Overview of the Spatial Properties, Lunar Coverage, Selenolocation, and Related Level 1B Products of the Moon Mineralogy Mapper. J. Geophys. Res. 2011, 116, E00G14. [Google Scholar] [CrossRef] [Green Version]
  17. Clark, R.N.; Pieters, C.M.; Green, R.O.; Boardman, J.W.; Petro, N.E. Thermal Removal from Near-Infrared Imaging Spectroscopy Data of the Moon. J. Geophys. Res. 2011, 116, E00G16. [Google Scholar] [CrossRef] [Green Version]
  18. Zhang, X.; Wu, Y.; Ouyang, Z.; Bugiolacchi, R.; Chen, Y.; Zhang, X.; Cai, W.; Xu, A.; Tang, Z. Mineralogical Variation of the Late Stage Mare Basalts: Minerals of the late stage mare basalts. J. Geophys. Res. Planets 2016, 121, 2063–2080. [Google Scholar] [CrossRef] [Green Version]
  19. Mustard, J.F.; Pieters, C.M.; Isaacson, P.J.; Head, J.W.; Besse, S.; Clark, R.N.; Klima, R.L.; Petro, N.E.; Staid, M.I.; Sunshine, J.M.; et al. Compositional Diversity and Geologic Insights of the Aristarchus Crater from Moon Mineralogy Mapper Data. J. Geophys. Res. 2011, 116, E00G12. [Google Scholar] [CrossRef] [Green Version]
  20. Staid, M.I.; Pieters, C.M.; Besse, S.; Boardman, J.; Dhingra, D.; Green, R.; Head, J.W.; Isaacson, P.; Klima, R.; Kramer, G.; et al. The Mineralogy of Late Stage Lunar Volcanism as Observed by the Moon Mineralogy Mapper on Chandrayaan-1. J. Geophys. Res. 2011, 116, E00G10. [Google Scholar] [CrossRef]
  21. Zhang, W.; Bowles, N.E. Mapping Lunar TiO2 and FeO with M3 Data. Eur. Planet. Sci. Congr. 2013, 8, EPSC2013-374. [Google Scholar]
  22. Shkuratov, Y.G.; Kaydash, V.G.; Opanasenko, N.V. Iron and Titanium Abundance and Maturity Degree Distribution on the Lunar Nearside. Icarus 1999, 137, 222–234. [Google Scholar] [CrossRef] [Green Version]
  23. Cloutis, E.A.; Gaffey, M.J.; Jackowski, T.L.; Reed, K.L. Calibrations of Phase Abundance, Composition, and Particle Size Distribution for Olivine-Orthopyroxene Mixtures from Reflectance Spectra. J. Geophys. Res. 1986, 91, 11641. [Google Scholar] [CrossRef]
  24. Gaffey, M.J.; Cloutis, E.A.; Kelley, M.S.; Reed, K.L. Mineralogy of Asteroids. In Asteroids III; University of Arizona Press: Tuscon, AZ, USA, 2002; pp. 183–204. [Google Scholar]
  25. Lindsley, D.H.; Andersen, D.J. A Two-Pyroxene Thermometer. J. Geophys. Res. 1983, 88, A887. [Google Scholar] [CrossRef]
  26. Burns, R.G.; Huggins, F.E.; Abu-Eid, R.M. Polarized Absorption Spectra of Single Crystals of Lunar Pyroxenes and Olivines. Moon 1972, 4, 93–102. [Google Scholar] [CrossRef]
  27. Adams, J.B. Visible and Near-Infrared Diffuse Reflectance Spectra of Pyroxenes as Applied to Remote Sensing of Solid Objects in the Solar System. J. Geophys. Res. 1974, 79, 4829–4836. [Google Scholar] [CrossRef]
  28. Purohit, A.N.; Patel, S.M.; Thaker, A.D.; Solanki, P.M. Compositional and Morphological Analysis of Gassendi Crater. J. Earth Syst. Sci. 2021, 130, 57. [Google Scholar] [CrossRef]
  29. Patel, S.; Satyakumar, A.V.; El-Maarry, M.R.; Solanki, P. Compositional Variations in Ohm Ray Crater on the Farside of the Moon: Implications for Mafic Anomaly. Planet. Space Sci. 2023, 229, 105674. [Google Scholar] [CrossRef]
  30. Cheek, L.C.; Pieters, C.M.; Boardman, J.W.; Clark, R.N.; Combe, J.P.; Head, J.W.; Isaacson, P.J.; McCord, T.B.; Moriarty, D.; Nettles, J.W.; et al. Goldschmidt Crater and the Moon’s North Polar Region: Results from the Moon Mineralogy Mapper (M3). J. Geophys. Res. 2011, 116, E00G02. [Google Scholar] [CrossRef] [Green Version]
  31. Cho, Y.; Morota, T.; Haruyama, J.; Yasui, M.; Hirata, N.; Sugita, S. Young Mare Volcanism in the Orientale Region Contemporary with the Procellarum KREEP Terrane (PKT) Volcanism Peak Period ~2 Billion Years Ago: Young Volcanism in the Orientale Region. Geophys. Res. Lett. 2012, 39. [Google Scholar] [CrossRef]
  32. Bussey, D.B.J.; Spudis, P.D. Compositional Studies of the Orientale, Humorum, Nectaris, and Crisium Lunar Basins. J. Geophys. Res. 2000, 105, 4235–4243. [Google Scholar] [CrossRef]
  33. Lemelin, M.; Lucey, P.G.; Miljković, K.; Gaddis, L.R.; Hare, T.; Ohtake, M. The Compositions of the Lunar Crust and Upper Mantle: Spectral Analysis of the Inner Rings of Lunar Impact Basins. Planet. Space Sci. 2019, 165, 230–243. [Google Scholar] [CrossRef]
  34. Sato, H.; Robinson, M.S.; Lawrence, S.J.; Denevi, B.W.; Hapke, B.; Jolliff, B.L.; Hiesinger, H. Lunar Mare TiO2 Abundances Estimated from UV/Vis Reflectance. Icarus 2017, 296, 216–238. [Google Scholar] [CrossRef]
  35. Chauhan, M.; Bhattacharya, S.; Pathak, S.; Chauhan, P. Remote Spectral-Compositional Analysis of Basalt Mineralogy at Hansteen-Billy, Moon. Meteorit. Planet. Sci. 2018, 53, 2583–2595. [Google Scholar] [CrossRef]
  36. Green, A.A.; Berman, M.; Switzer, P.; Craig, M.D. A Transformation for Ordering Multispectral Data in Terms of Image Quality with Implications for Noise Removal. IEEE Trans. Geosci. Remote Sens. 1988, 26, 65–74. [Google Scholar] [CrossRef] [Green Version]
  37. Frassy, F.; Dalla Via, G.; Maianti, P.; Marchesi, A.; Nodari, F.R.; Gianinetto, M. Minimum Noise Fraction Transform for Improving the Classification of Airborne Hyperspectral Data: Two Case Studies. In Proceedings of the 2013 5th Workshop on Hyperspectral Image and Signal Processing: Evolution in Remote Sensing (WHISPERS), 26–28 June 2013, Gainesville, FL, USA; IEEE: Los Alamitos, CA, USA, 2013; pp. 1–4. [Google Scholar]
  38. Cloutis, E.A.; Gaffey, M.J. Pyroxene Spectroscopy Revisited: Spectral-Compositional Correlations and Relationship to Geothermometry. J. Geophys. Res. 1991, 96, 22809. [Google Scholar] [CrossRef]
  39. Klima, R.L.; Dyar, M.D.; Pieters, C.M. Near-Infrared Spectra of Clinopyroxenes: Effects of Calcium Content and Crystal Structure: Near-Infrared Spectra of Clinopyroxenes. Meteorit. Planet. Sci. 2011, 46, 379–395. [Google Scholar] [CrossRef]
  40. Qian, Y.; She, Z.; He, Q.; Xiao, L.; Wang, Z.; Head, J.W.; Sun, L.; Wang, Y.; Wu, B.; Wu, X.; et al. Mineralogy and Chronology of the Young Mare Volcanism in the Procellarum-KREEP-Terrane. Nat. Astron. 2023, 7, 287–297. [Google Scholar] [CrossRef]
  41. Papike, J.J.; Hodges, F.N.; Bence, A.E.; Cameron, M.; Rhodes, J.M. Mare Basalts: Crystal Chemistry, Mineralogy, and Petrology. Rev. Geophys. 1976, 14, 475. [Google Scholar] [CrossRef]
  42. Papike, J.J.; Vaniman, D.T. The Lunar Mare Basalt Suite. Geophys. Res. Lett. 1978, 5, 433–436. [Google Scholar] [CrossRef]
  43. Smith, D.; Lindsley, D.H. Stable and Metastable Augite Crystallization Trends in a Single Basalt Flow. Am. Mineral. 1971, 56, 225–233. [Google Scholar]
  44. Gaffey, M.J.; Bell, J.F.; Brown, R.H.; Burbine, T.H.; Piatek, J.L.; Reed, K.L.; Chaky, D.A. Mineralogical Variations within the S-Type Asteroid Class. Icarus 1993, 106, 573–602. [Google Scholar] [CrossRef]
  45. Srivastava, Y.; Basu Sarbadhikari, A.; Day, J.M.D.; Yamaguchi, A.; Takenouchi, A. A Changing Thermal Regime Revealed from Shallow to Deep Basalt Source Melting in the Moon. Nat. Commun. 2022, 13, 7594. [Google Scholar] [CrossRef]
  46. Tian, H.-C.; Wang, H.; Chen, Y.; Yang, W.; Zhou, Q.; Zhang, C.; Lin, H.-L.; Huang, C.; Wu, S.-T.; Jia, L.-H.; et al. Non-KREEP Origin for Chang’e-5 Basalts in the Procellarum KREEP Terrane. Nature 2021, 600, 59–63. [Google Scholar] [CrossRef]
Figure 1. The inset shows a Lunar Reconnaissance Orbiter Camera (LROC)-Wide Angle Camera (WAC) map with the Mare Orientale of the Moon highlighted by the black box. Based on the research of Whitten et al. (2011), the Orientale basin is shown with the main rings and labelled deposits in the SLDEM data (~59 m/pixel).
Remotesensing 15 01801 g001
Figure 2. The LROC–WAC map displays the Mare Orientale of the Moon. Spectral maps of the Orientale basin: (a) BD 1900; (b) BD 2300; (c) M3 FCC image (R: G: B-BD 1900: BD 2300: BD 1250); (d) M3 1.578 µm albedo map displaying the differences in albedo between the mare units. Reflectance spectra of different minerals from the basin region are shown in (e) normal and (f) continuum-removed spectra. The red circles in the image denote the sites from which spectral data of different minerals were sampled, as labelled in (c). The solid white lines define the limits of the different mare units. Projection: Stereographic centered at the Orientale basin.
Remotesensing 15 01801 g002
Figure 3. (a) FeO content retrieval result from M3 data, (b) TiO2 content retrieval result from M3 data, (c) MNF–FCC image (R: G: B-Component 7: 9: 8), and (d) M3 color composite image (R: G: B-IBD 1000: IBD 2000: M3 1.578 µm) demonstrating the differences in the mineral composition of basaltic units. The black circles in the image point to the sites from which the reflectance spectra were sampled. Image projection: Stereographic centered at the Orientale basin.
Remotesensing 15 01801 g003
Disclaimer/Publisher’s Note: The statements, opinions and data contained in all publications are solely those of the individual author(s) and contributor(s) and not of MDPI and/or the editor(s). MDPI and/or the editor(s) disclaim responsibility for any injury to people or property resulting from any ideas, methods, instructions or products referred to in the content.

