Article

Improvements in Forest Segmentation Accuracy Using a New Deep Learning Architecture and Data Augmentation Technique

1
Faculty of Information Technology, Beijing University of Technology, Beijing 100021, China
2
Beijing Laboratory of Advanced Information Network, Beijing 100021, China
3
School of Earth and Space Sciences, Peking University, Beijing 100871, China
*
Author to whom correspondence should be addressed.
Remote Sens. 2023, 15(9), 2412; https://doi.org/10.3390/rs15092412
Submission received: 29 March 2023 / Revised: 1 May 2023 / Accepted: 3 May 2023 / Published: 5 May 2023

Abstract

:
Forests are critical to mitigating global climate change and regulating climate through their role in the global carbon and water cycles. Accurate monitoring of forest cover is, therefore, essential. Image segmentation networks based on convolutional neural networks have shown significant advantages in remote sensing image analysis with the development of deep learning. However, deep learning networks typically require a large amount of manual ground truth labels for training, and existing widely used image segmentation networks struggle to extract details from large-scale high resolution satellite imagery. Improving the accuracy of forest image segmentation remains a challenge. To reduce the cost of manual labelling, this paper proposed a data augmentation method that expands the training data by modifying the spatial distribution of forest remote sensing images. In addition, to improve the ability of the network to extract multi-scale detailed features and the feature information from the NIR band of satellite images, we proposed a high-resolution forest remote sensing image segmentation network by fusing multi-scale features based on double input. The experimental results using the Sanjiangyuan plateau forest dataset show that our method achieves an IoU of 90.19%, which outperforms prevalent image segmentation networks. These results demonstrate that the proposed approaches can extract forests from remote sensing images more effectively and accurately.

Graphical Abstract

1. Introduction

As a significant component of terrestrial ecosystems, forest ecosystems are the largest, most widespread, and most complex in composition and richest in resources on land. The climate is influenced and regulated by the interactions between forest ecosystems and the atmosphere through the exchange of energy, water, carbon dioxide, and other compounds. Forest plays an essential role in the global carbon cycle, the global water cycle, the mitigation of global climate change, climate regulation, soil conservation, and environmental improvement [1,2,3]. In addition to providing a wide range of ecological services, forest ecosystems also provide various socio-economic benefits, including the provision of forest products and nature-based recreation [4]. Forest monitoring provides a better understanding of the impacts of climate change at local, regional, and global levels [5]. Therefore, in the current climate and biodiversity crisis, it is critical to monitor forests closely [6].
Historically, forest monitoring has been conducted through field surveys. These surveys are costly, unable to be completed in a short period of time, and impossible in some areas due to spatial constraints [6,7]. With the development of satellite sensors, remote sensing has provided unprecedented capabilities for large-scale forest monitoring [8].
Among the methods based on spectral vegetation indices, the normalized difference vegetation index (NDVI) has been widely applied [9]. Shimu et al. [10] proposed a change detection technique using NDVI to quantify temporary changes in Landsat RS images of mangroves in the Sundarbans from 2011 to 2019. This approach resulted in the creation of a Floras index, which represents the amount of highly vegetated area and indicates whether vegetation growth is possible. Pesaresi et al. [11] presented a methodology to detect and characterize forest plant communities using remotely sensed NDVI time-series data. This methodology supports the recognition and characterization of forest plant communities identified in the field by the phytosociological approach by using NDVI time-series data to encode phenological behaviors. Spruce et al. [12] demonstrated the potential of mapping percent tree mortality in forests exposed to regional bark beetle outbreaks and severe drought using MODIS NDVI data. Pesaresi et al. [13] proposed a methodological framework for applying functional principal component analysis to remotely sensed NDVI time-series data from Landsat-8 to map Mediterranean forest plant communities and habitats. Piragnolo et al. [14] used the Sentinel-2A remote sensing data to automatically calculate several vegetation indices, such as NDVI, via the web-GIS platform. The authors then evaluated the effectiveness of different indices in quantifying forest damage caused by windthrow in an Alpine region using cross-validation with ground-truth data. By comparing the results, the study identified the most suitable vegetation index for detecting and quantifying forest damage in remote sensing applications.
Among the machine learning algorithms, the application of Random Forest (RF) and Support Vector Machines (SVM) in remote sensing image classification has drawn much attention [15]. Mansaray et al. [16] utilized SVM and RF to improve rice mapping accuracy by single and different combinations of the data of Sentinel-1A, Landsat-8, and Sentinel-2A. Zagajewski et al. [17] used open data from Sentinel-2 and Landsat 8 to classify the dominant tree species (birch, beech, larch, and spruce) in the UNESCO Karkonosze Transboundary Biosphere Reserve, utilizing three machine learning algorithms, RF, SVM, and Artificial Neural Network (ANN), where the best results were obtained by the SVM-RBF classifier. Noi et al. [18] conducted a study on land use/cover classification using Sentinel-2 image data in the Red River Delta of Vietnam. The study compared the performance of RF, k-Nearest Neighbor (kNN), and SVM classifiers, with SVM having the highest overall accuracy among them. Zafari et al. [19] proposed a new method to classify crops using time-series data of WorldView-2 multispectral imagery acquired over Mali in 2014. The study compared the performance of SVM and RF classifiers and introduced a random forest kernel (RFK) in an SVM classifier. The RFK-SVM approach demonstrated superior performance in crop classification compared to using either classifier alone.
With the development of deep learning techniques, the Convolutional Neural Network (CNN) in particular, remarkable results have been achieved in the field of image segmentation. Long et al. [20] proposed the Full Convolutional Network (FCN), which replaces the traditional fully connected layer with convolutional layers trained from end-to-end, to achieve pixel-level image classification for the first time. Ronneberger et al. [21] proposed the U-Net for medical image segmentation, which achieves better segmentation by merging the feature information extracted from the encoder layer with the corresponding decoder layer through skip connections. Zhao et al. [22] proposed PSPNet, which fuses four different scales of global contextual information through the proposed pyramid pooling module for segmentation. The prevalent image segmentation networks such as SegNet [23], DeepLab V3+ [24], and DANet [25] have been widely used in various fields. In recent years, deep learning algorithms have shown significant potential in remote sensing image analysis [26]. In particular, in the field of remote sensing image segmentation, as the traditional spectral vegetation index-based methods are not robust for segmentation and machine learning methods are better at dealing with small samples [27], CNN-based image segmentation networks have been widely used [28]. Wei et al. [29] demonstrated that the CNN-based image segmentation network achieved much better results than the spectral vegetation index-based method and the machine-learning-based method in the task of mapping the large plateau forest of Sanjiangyuan. Among the prevalent deep learning image segmentation networks, U-Net, which is designed based on the encoder–decoder structure, is the most commonly used deep learning architecture to perform remote sensing image segmentation [30]. In the field of forest remote sensing image segmentation, Freudenberg et al. [31] developed a novel method for detecting oil palm plantations using very high-resolution satellite imagery, based on the U-Net architecture. The method was tested on large monoculture oil palm plantations in Jambi, Indonesia, and coconut palms located in the Bangalore Metropolitan Region of India. Wagner et al. [32] used U-Net to accurately segment natural forests and eucalyptus plantations in the Brazilian Atlantic rainforest using very high-resolution images (0.3 m) from the WorldView-3 satellite. Wagner et al. [33] used U-Net to identify, segment, and regionally map all canopy palm individuals in over ~3000 km2 of the Brazilian Amazon Forest using very high resolution (0.5 m) multispectral imagery from the GeoEye satellite. Flood et al. [34] used U-Net to map the presence of trees and large shrubs across large landscapes in Queensland, Australia, using high-resolution satellite imagery. Cao et al. [35] proposed Res-Unet by combining U-Net and the feature extraction network ResNet for tree classification using high-resolution remote sensing imagery.
Deep-learning-based image segmentation algorithms have shown good application prospects in remote sensing. However, the algorithms of image segmentation networks widely applied are not specifically designed for remote sensing images. Remote sensing images have wide coverage, large data scale, different scene types, relatively dense targets, and cover a large number of complex and diverse geographical landscape types. Images taken by mobile phones or cameras contain only red, green, and blue (RGB) bands, while remote sensing images taken by satellites, such as the ZY-3 satellite, also include NIR bands in addition to RGB bands. In addition, compared to images taken by mobile phones or cameras and medical images, the coverage of remote sensing images is more extensive and contains more semantic information at the same pixel size. Despite achieving relatively satisfactory results in remote sensing image segmentation tasks, existing widely used image segmentation algorithms face challenges in balancing the processing of image integrity and details due to the large scale and coverage of remote sensing images. Specifically, their ability to extract detailed feature information from large-scale images is insufficient, and they lack the ability to extract and integrate multi-scale feature information. This eventually leads to the loss of some details in segmented images. For example, Wei et al. [29] used few-shot learning to map a large area of plateau forest in the Sanjiangyuan region, but there was much room for improvement in the achieved results due to insufficient extraction of detailed feature information. Furthermore, training deep learning models typically requires large amounts of manually labelled ground truth data [36,37]. The lack of available training data is the main obstacle to applying deep learning to a wide range of practical monitoring applications [26]. For large-scale forest remote sensing image segmentation tasks, the manual labelling of ground truth labels requires a significant amount of time.
In this paper, faced with the problem of lack of a large number of manually labelled ground truth labels for training, we proposed a novel data augmentation method that was specifically designed for the forest remote sensing image segmentation task. This method expanded the training set by random permutation of subtiles within the remote sensing images. In this method, the original image was equally sliced into 8 × 8 sizes and then randomly arranged and combined into a new image while maintaining the same size. The size of the training set has been expanded from 800 samples to 1600 samples and enhanced the diversity and variability of the training samples by modifying various spatial distribution of forest trees within the remote sensing images. In addition, to improve the ability of the network to extract multi-scale detailed features of large-scale forest remote sensing images and feature information from the NIR band of satellite imagery, and to further improve the accuracy of high-resolution forest remote sensing image segmentation, we designed a deep learning segmentation network by fusing multi-scale features based on double input. The first input was the RGB bands and the second was the NIR band within the satellite data. The remote sensing image was split into two inputs to improve the extraction of feature information from the NIR band in remote sensing images. In order to extract detailed information of multiple spatial scales from forest remote sensing images, the proposed network was designed based on the encoder–decoder structure and combined the proposed convolution block, multi-scale feature fusion module, and feature amplification module.

2. Materials and Methods

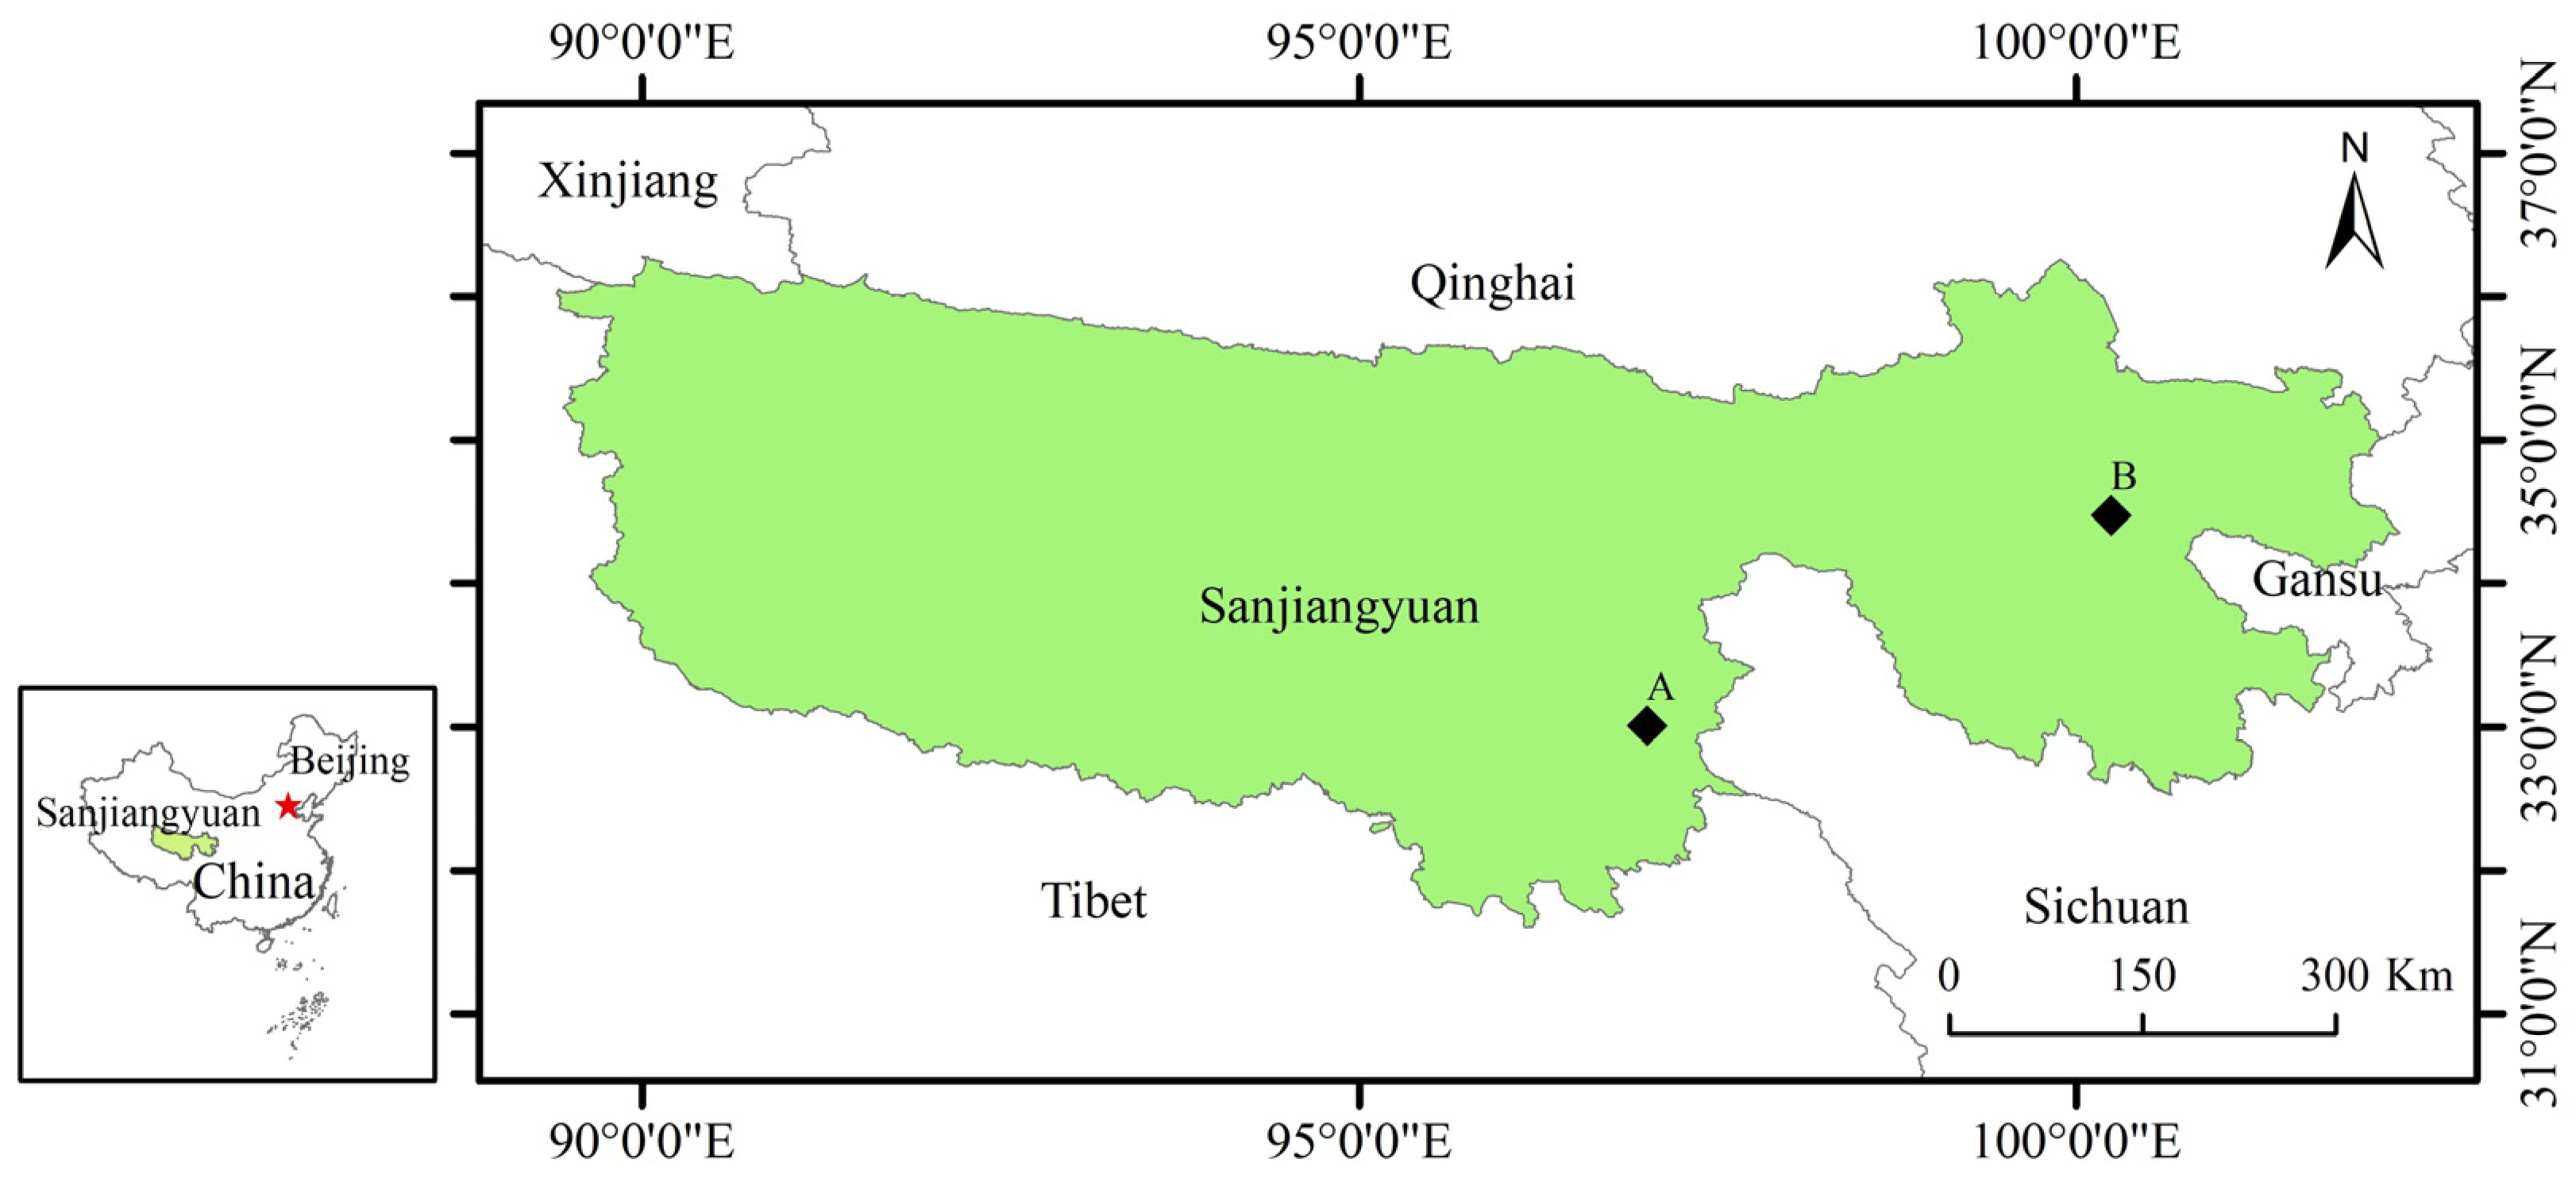
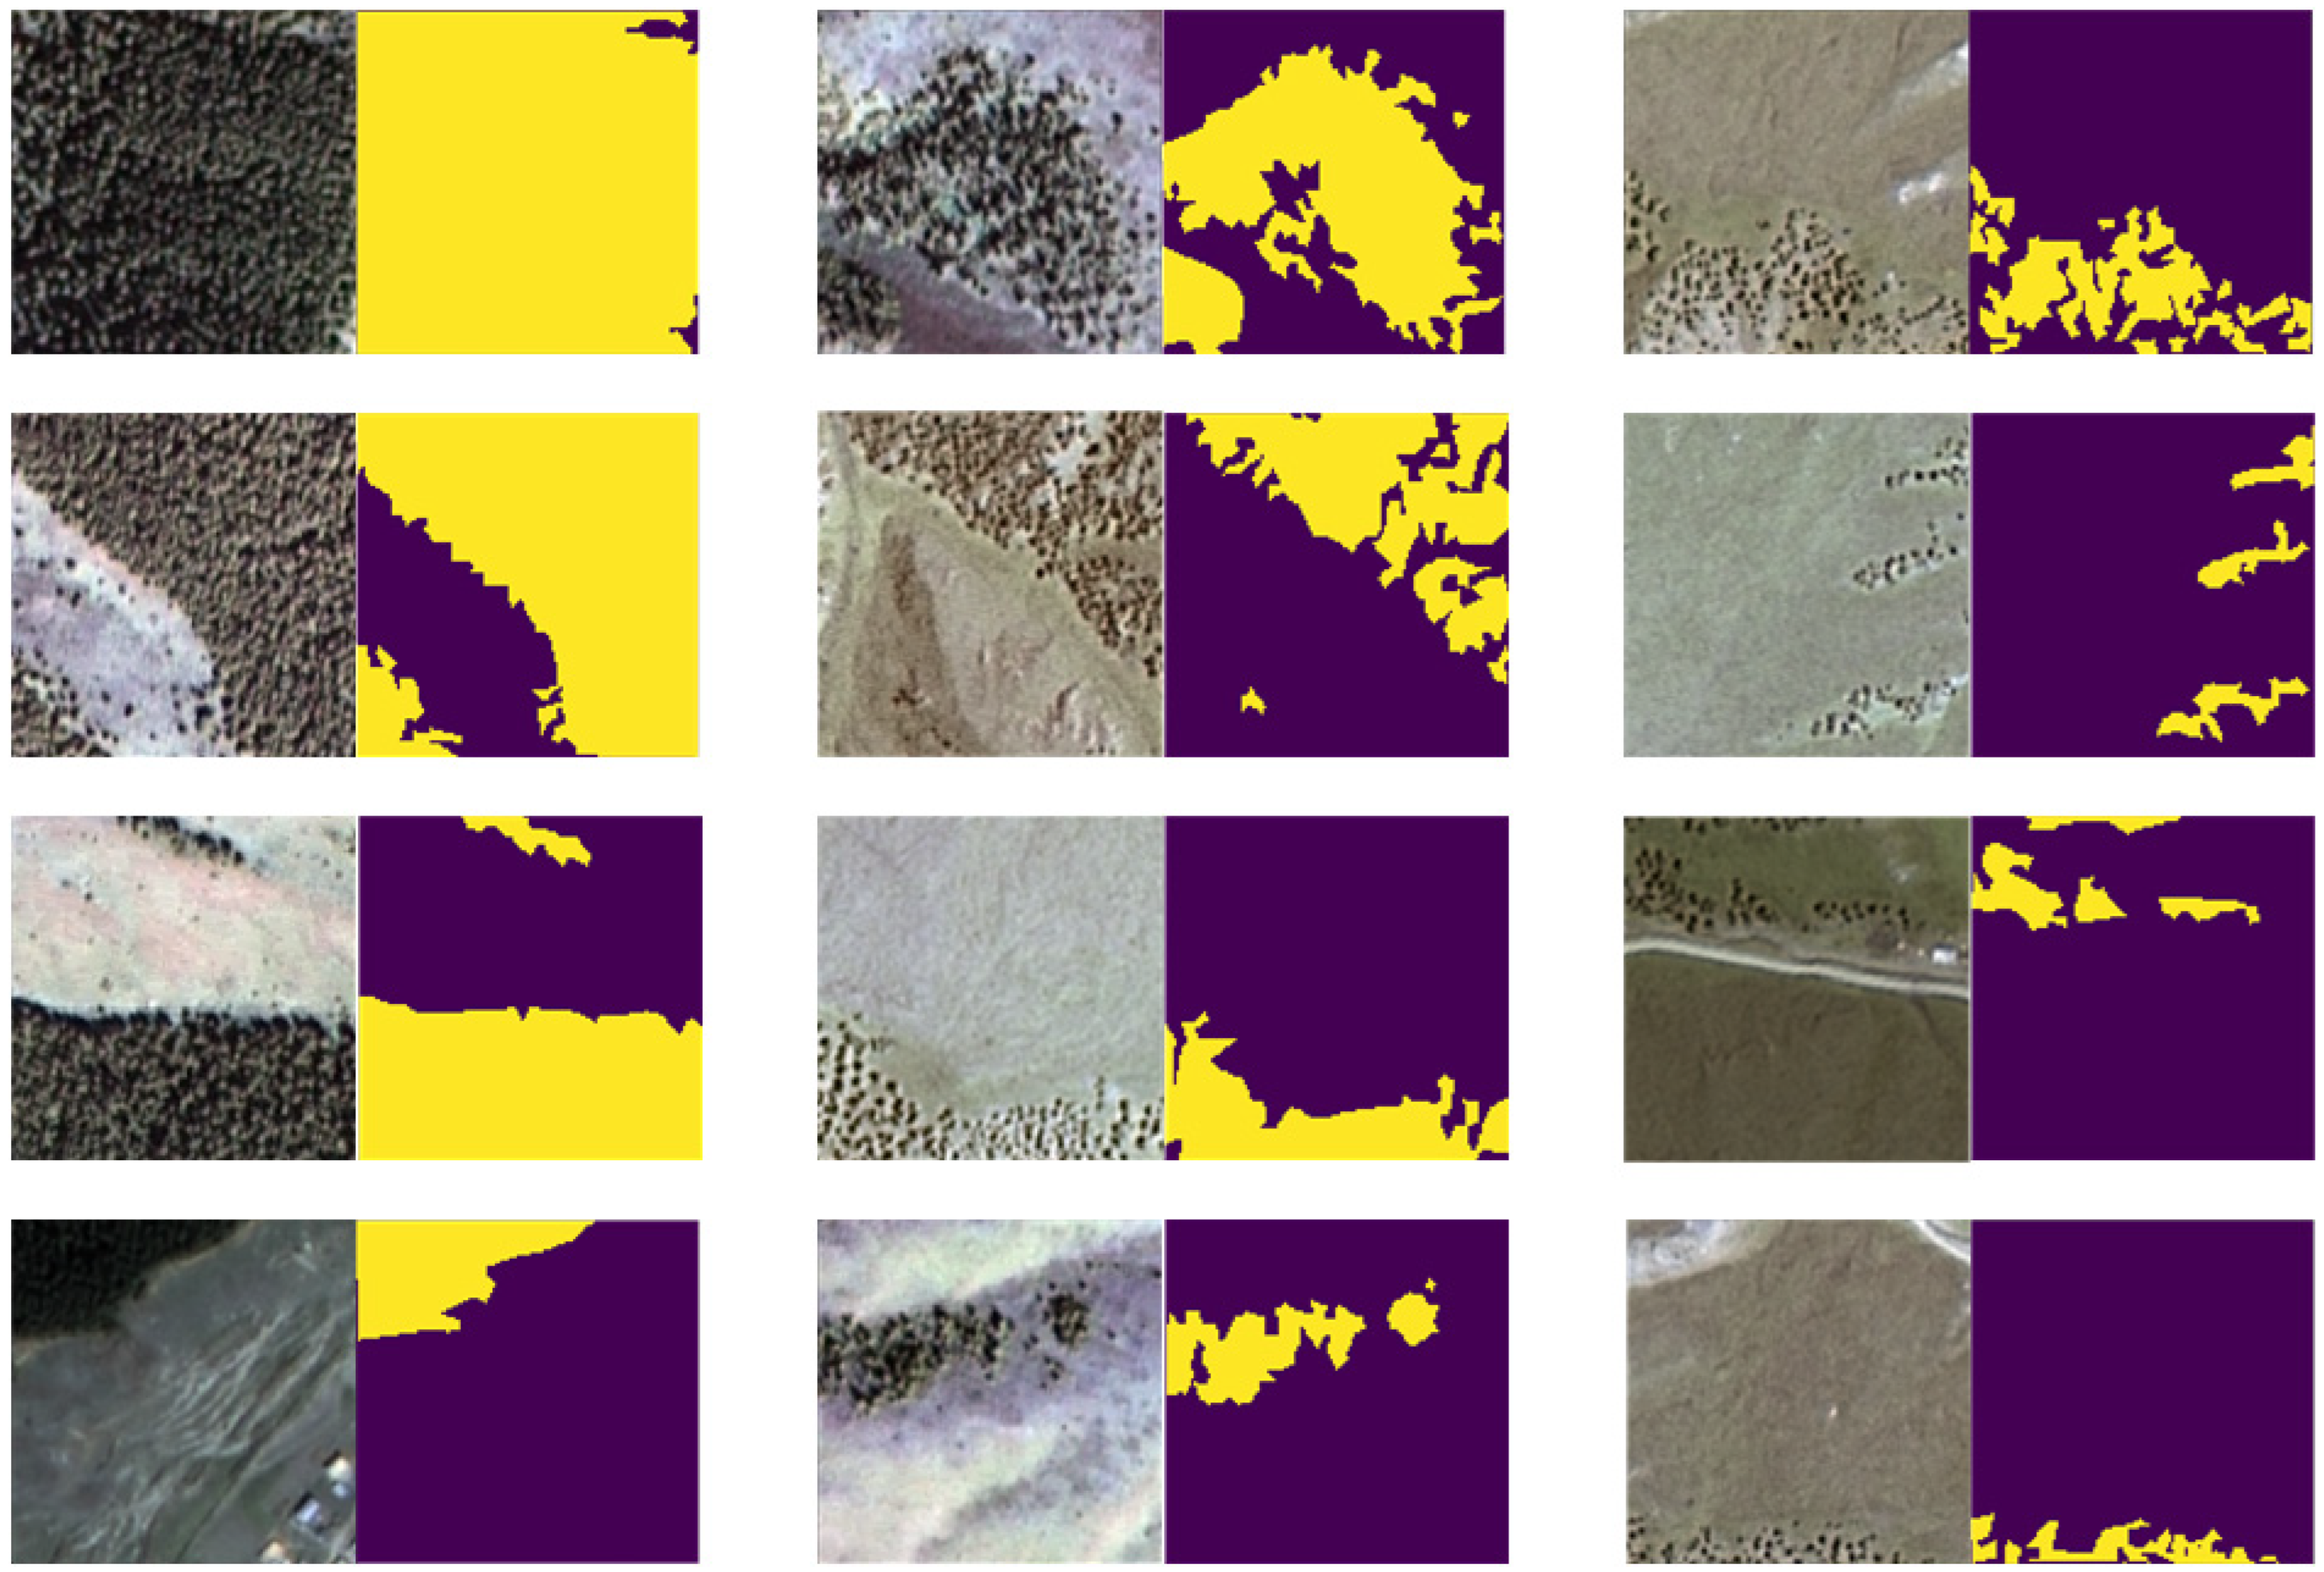
2.1. Study Area and Data

Our study area is located in the Sanjiangyuan National Nature Reserve (89°45′–102°23′E, 31°39′–36°12′N) in Qinghai Province, China. As shown in Figure 1, the average elevation of the Sanjiangyuan area is about 4500 m, and the total area is about 395,000 km2, of which the forest area is about 30,000 km2. The forest vegetation is diverse and widespread, mainly cold temperate coniferous forests with plateau zonation. The region’s climate type is plateau continental, with extensive wetlands and dense marshes, and has abundant water resources. Sanjiangyuan is called the “Chinese Water Tower” and is the birthplace of the Yangtze River, the Yellow River, and the Lancang River, which is an important source of fresh water in China [38,39,40]. Therefore, monitoring changes in the plateau forest cover of this region is important for water conservation, the global carbon cycle, climate change analysis, and combating global warming.
The large-scale plateau forest dataset in Sanjiangyuan was proposed by Wei et al. [29] and contains 38,708 remote sensing imagery samples and 1187 accurate manual ground truth forest segmentation labels of 128 × 128 pixels at a 2 m spatial resolution from the ZY-3 satellite. Table 1 shows the detailed information from the ZY-3 satellite data. These imagery samples were from Yushu County and Guoluo County, as shown in Figure 1. Table 2 shows the detailed information of the dataset. The dataset contained a rich variety of plateau forest types at different densities, surrounded by a variety of land cover environments. The visualization of some remote sensing image samples and their ground truth label data are shown in Figure 2. As shown in Figure 2, it is clear that the distribution of forests varies considerably among samples. This variation can be observed in various aspects, such as the extent of forest cover, forest density within each sample, and the surrounding environment. The complexity of this dataset is well represented. Such variations in the forest distribution can pose a significant challenge to the accurate segmentation of remote sensing images. It is, therefore, essential to develop effective image analysis techniques that can handle such diversity and variability in the data to achieve reliable and consistent results.

2.2. Proposed Network

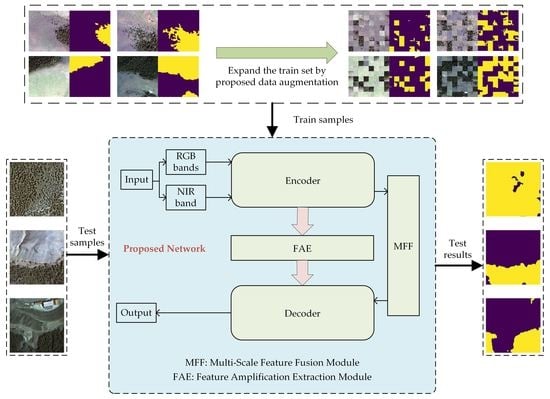
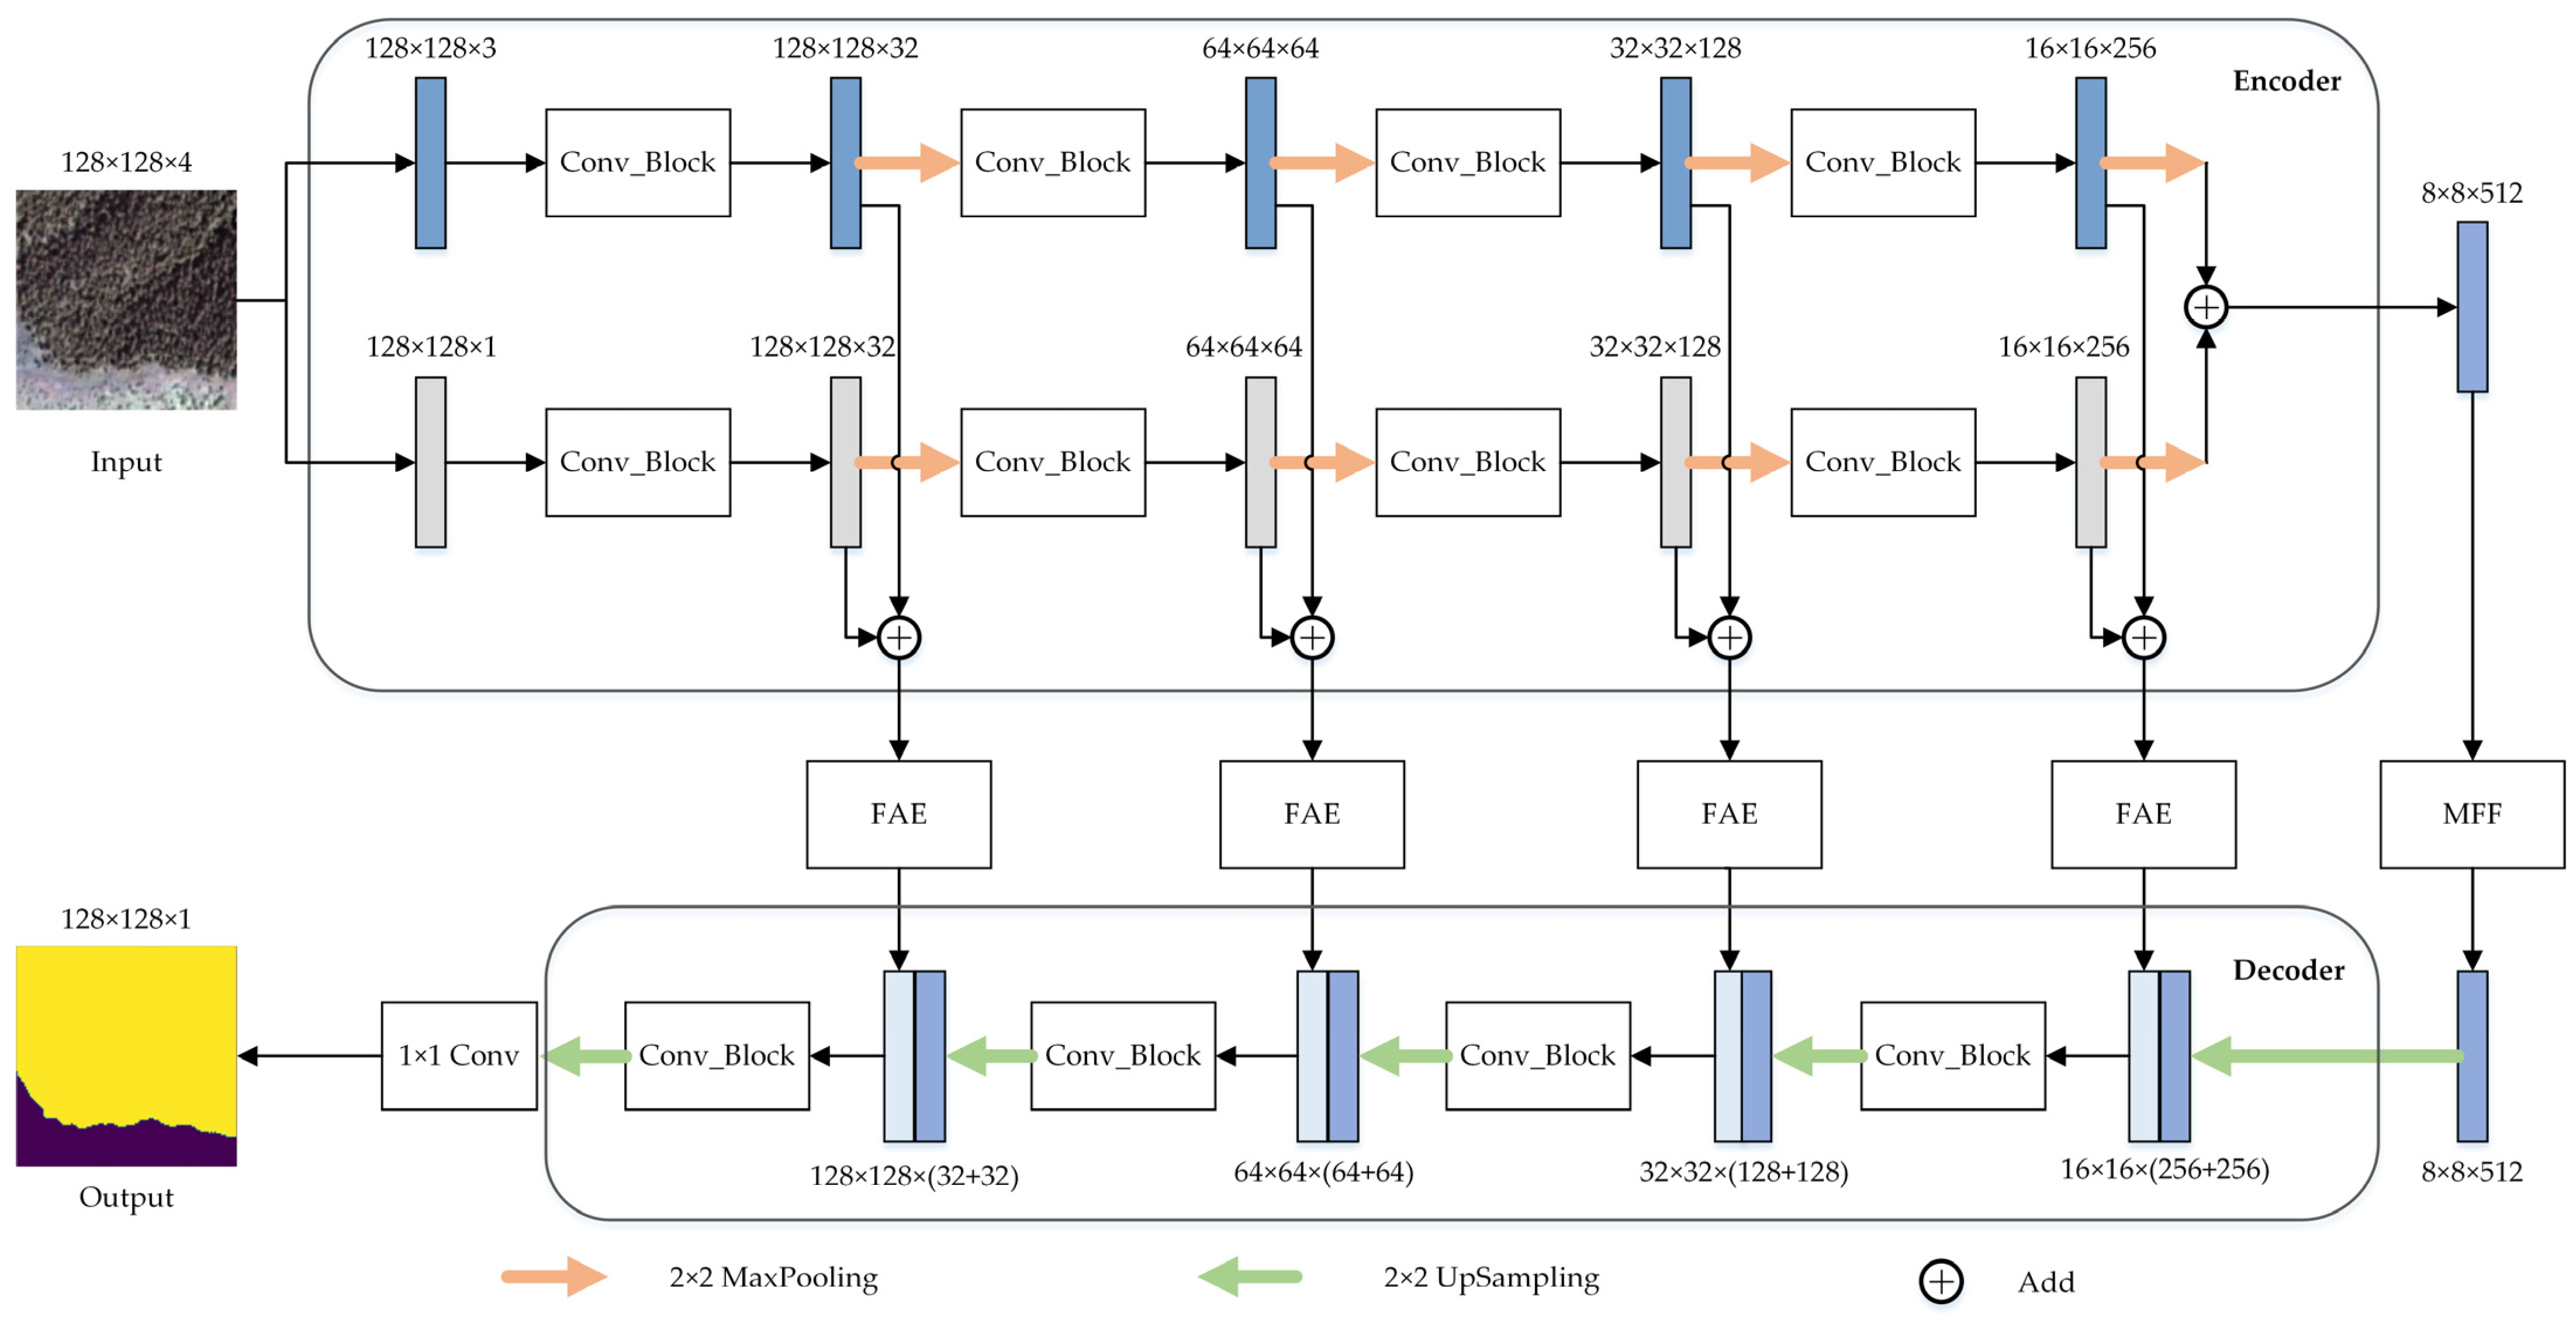
2.2.1. Overview of Proposed Network

Han et al. [41] compared the performance of widely used deep learning image segmentation algorithms (including FCN-8s, SegNet, and U-Net) of the remote sensing image classification using Gaofen-2 (GF2) satellite imagery in Xinxiang city in the Henan province in central China. The authors compared the performance of using the RGB + NIR bands with four channels as input and only RGB bands with three channels as input of high-spatial-resolution remote sensing imagery, respectively, and the inputs from the RGB + NIR bands performed better. Inspired by this, we realized that remote sensing image segmentation was different from traditional RGB image segmentation and that it was also important to extract feature information from the NIR band in satellite imagery to improve segmentation performance. Meanwhile, U-Net [21] was based on the encoder–decoder structure and was proposed to handle medical image segmentation tasks. It is the most widely used deep learning architecture for remote sensing image segmentation and has achieved satisfactory results [30]. In order to better extract the feature information of NIR band of satellite imagery, inspired by U-Net, we proposed a high-resolution forest remote sensing image segmentation network by fusing multi-scale features based on double input. The first input consisted of RGB bands with three channels, while the other input was the NIR band with one channel, and the double input put the feature information extraction of RGB bands and NIR band on the same level of importance. Compared with the combination of RGB + NIR bands with four channels as a single input, the strategy of double input greatly enhanced the feature information extraction of NIR band. In addition, the network was designed by encoder–decoder structure and incorporated the convolution block, the multi-scale feature fusion module, and the feature amplification extraction module proposed in this paper to map the segmentation results by fusing multi-scale features. The main architecture of the proposed network is shown in Figure 3.
As shown in Figure 3, we split the input of a 4-band (RGB + NIR) forest remote sensing image (128 × 128 × 4) from the ZY-3 satellite into RGB inputs (128 × 128 × 3) and NIR inputs (128 × 128 × 1) as double input. The feature information of two different inputs was extracted, respectively, from different spatial scales by repeated application of the convolution block, each followed by a 2 × 2 max pooling operation for downsampling, and two features were summed up together as input of the feature amplification extraction module after each convolution block in the encoder. We doubled the number of feature channels in the convolution block and halved the feature size by downsampling. Then, we summed up the two features encoded by the encoder through the add operation and used it as input of the multi-scale feature fusion module to extract global contextual semantic information by fusing multiple scales. Meanwhile, the feature amplification extraction module extracted detailed semantic information from different spatial scales. In the decoder, we extracted semantic information from different spatial scales by repeating the application of convolution blocks, each followed by a 2 × 2 transpose convolution operation for upsampling, and the input of each convolution block was from the concatenation of the same size feature from the feature amplification extraction module and upsampling. We halved the number of feature channels in the convolution block and doubled the feature size by upsampling. Finally, a 1 × 1 convolution layer with a sigmoid activation function was used to map the features to output in 128 × 128 pixels as the segmentation result.

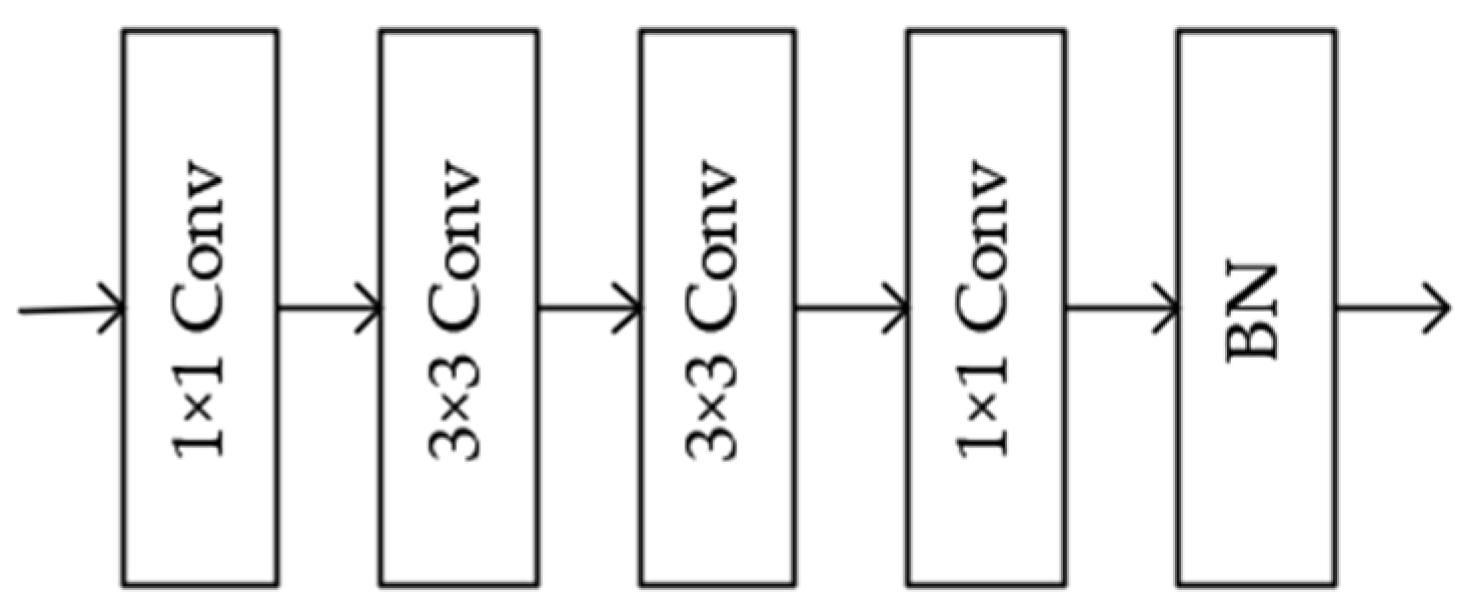
2.2.2. Convolution Block

Image segmentation algorithms based on encoder–decoder structures typically used two layers of convolution with a kernel size of 3 × 3 to extract feature information. However, remote sensing images have wide coverage and large data scale, and remote sensing images of the same size contain more semantic information compared to images in other fields. Therefore, a relatively small-scale convolution for the extraction of detailed feature information is required for the segmentation of remote sensing images. In order to improve the ability of the model to extract details from the remote sensing images, this paper proposed a convolution block that first used one-layer convolution with a kernel size of 1 × 1 to extract small-scale detail feature information. We then used two-layer convolution with a kernel size of 3 × 3 to further extract feature information and, finally, used one-layer convolution with a kernel size of 1 × 1 to extract small-scale detail feature information again. The structure is shown in Figure 4.
As shown in Figure 4, we used one layer with a kernel size of 1 × 1, two layers with a kernel size of 3 × 3, and one layer with a kernel size of 1 × 1. Convolution with Rectified Linear Unit (ReLU) activation function [42] was used for successive extraction of feature information, and the first convolution with a kernel size of 1 × 1 was used to change the number of feature channels. To accelerate the network convergence, we used batch normalization [43] in the last layer.

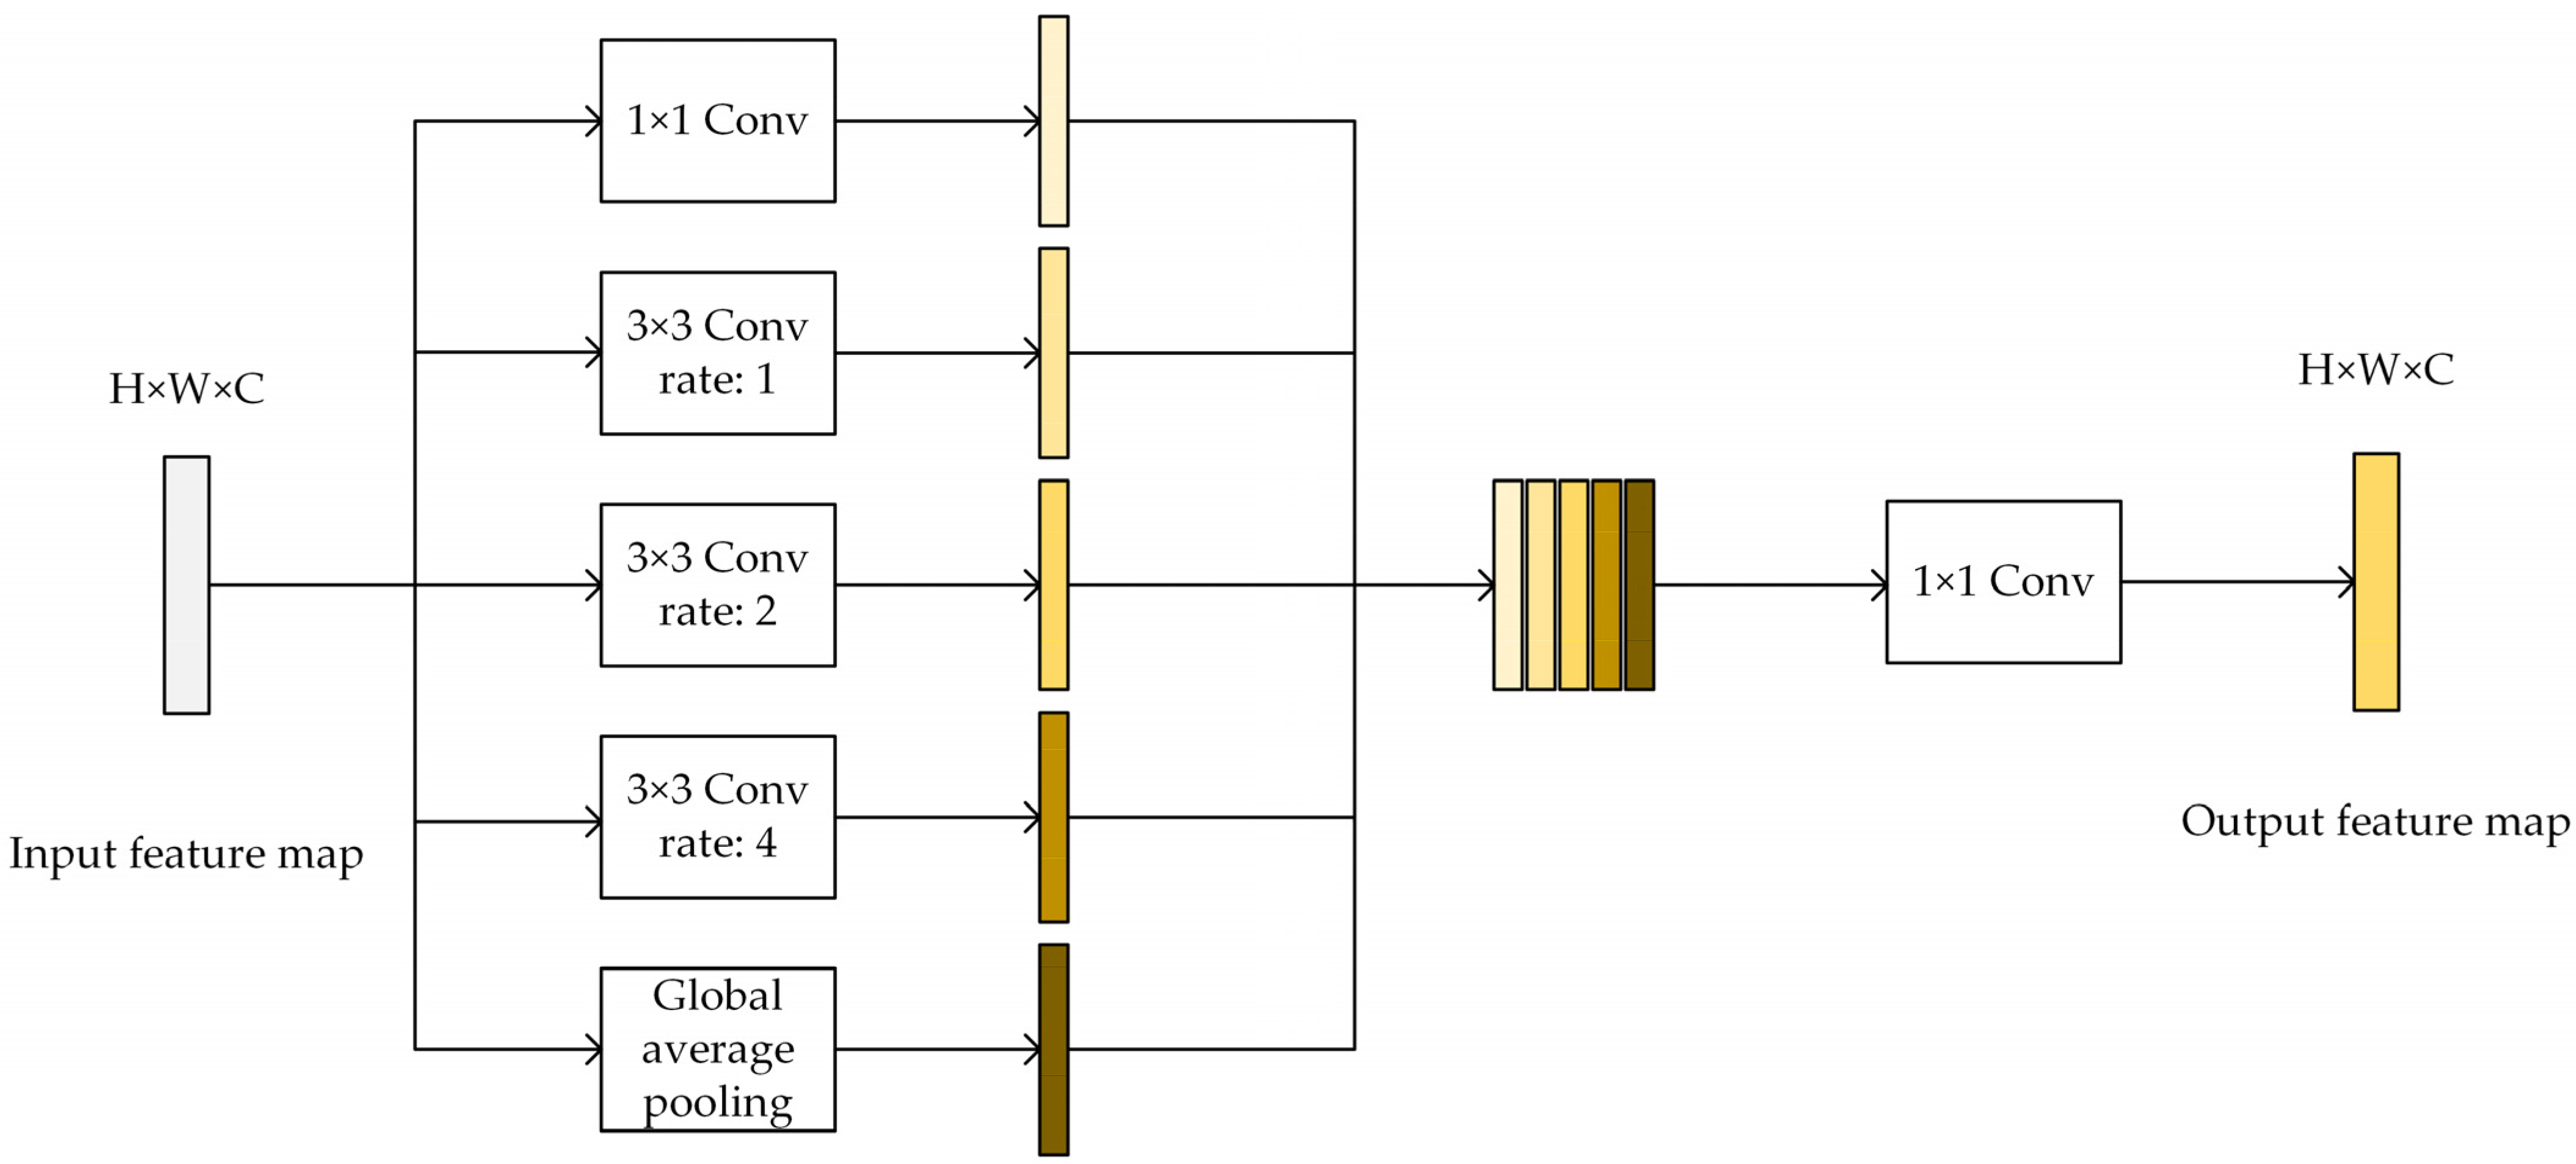
2.2.3. Multi-Scale Feature Fusion Module

Since atrous convolution can control the receptive field of the convolution layer by changing the dilation rate, image features of different resolutions were collected to obtain multi-scale global contextual semantic information for processing both global and detailed feature information, which, in turn, improved image segmentation performance. Inspired by the atrous spatial pyramid pooling (ASPP) of DeepLab V3+ [24], we proposed a multi-scale feature fusion module that was deployed at the bottom of the encoder and decoder. The structure is shown in Figure 5.
As shown in Figure 5, the multi-scale feature fusion module was a parallel structure consisting of several multiple branches, including one-layer convolution with a kernel size of 1 × 1, three-layer convolution with a kernel size of 3 × 3 with different dilation rates (1, 2, 4), and global average pooling. All convolution layers used the ReLU activation function. The 1 × 1 kernel size convolution and the 3 × 3 kernel size convolution with smaller dilation rate were used to extract local detail, and the 3 × 3 kernel size convolution with larger dilation rate and global average pooling was used to aggregate global contextual feature information. In the global average pooling, bilinear interpolation was applied to restore the size of the feature map to the same size as other branches. The feature maps from all branches were then concatenated, and convolution with a kernel size of 1 × 1 was used to make the output consistent with the size of the original input feature map.

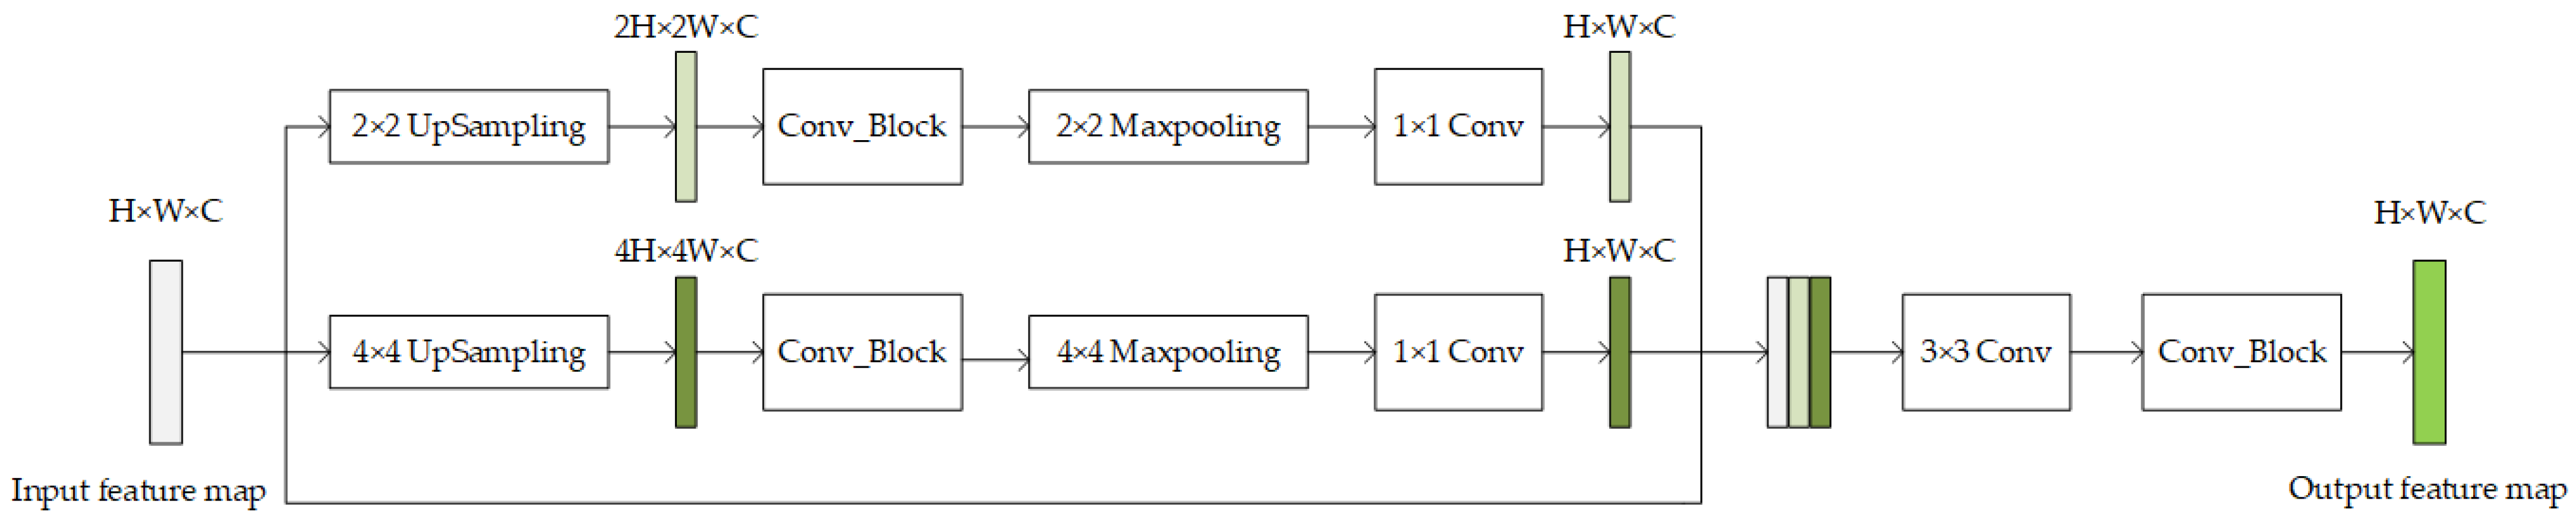
2.2.4. Feature Amplification Extraction Module

In U-Net, the low-level feature map of the decoder concatenated the high-level feature map from the corresponding stage of the encoder during upsampling to propagate contextual information to higher layers. Much of the literature has addressed and improved this part. Oktay et al. [44] proposed Attention U-Net and replaced this part as proposed Attention Gates. Ibtehaz et al. [45] proposed MultiResUNet and replaced this part as proposed Res Path. However, for segmentation tasks dealing with remote sensing images of forests, these improved networks were not as effective due to the lack of extraction of image detail information. In order to improve the processing ability of deep learning networks for forest remote sensing image detail features, a feature amplification extraction module was proposed in this paper. It was used in the connection part of the equivalent stage between encoder and decoder to extract the image detail feature information by amplification from different spatial scales. Its structure is shown in Figure 6.
As shown in Figure 6, the input feature map was operated by bilinear interpolation of sizes 2 × 2 and 4 × 4 for upsampling. The size of the input feature map was expanded to 2 and 4 times of the original input feature map, respectively. Then, the detailed feature information was extracted by the convolution block for each of the two different scales of amplified features, and then their size was restored by Maxpooling of sizes 2 × 2 and 4 × 4, respectively, followed by one-layer convolution with a kernel size of 1 × 1 with ReLU activation function to map the two features with the same size as the original input feature map. After that, we concatenated the two amplified features and the original input feature map, followed by one-layer convolution with a kernel size of 3 × 3 with ReLU activation function. Some semantic information from the encoder was retained during the extraction of detailed information from the amplified features. Finally, a convolution block was used to map the output feature map to the same size as the original input feature map.

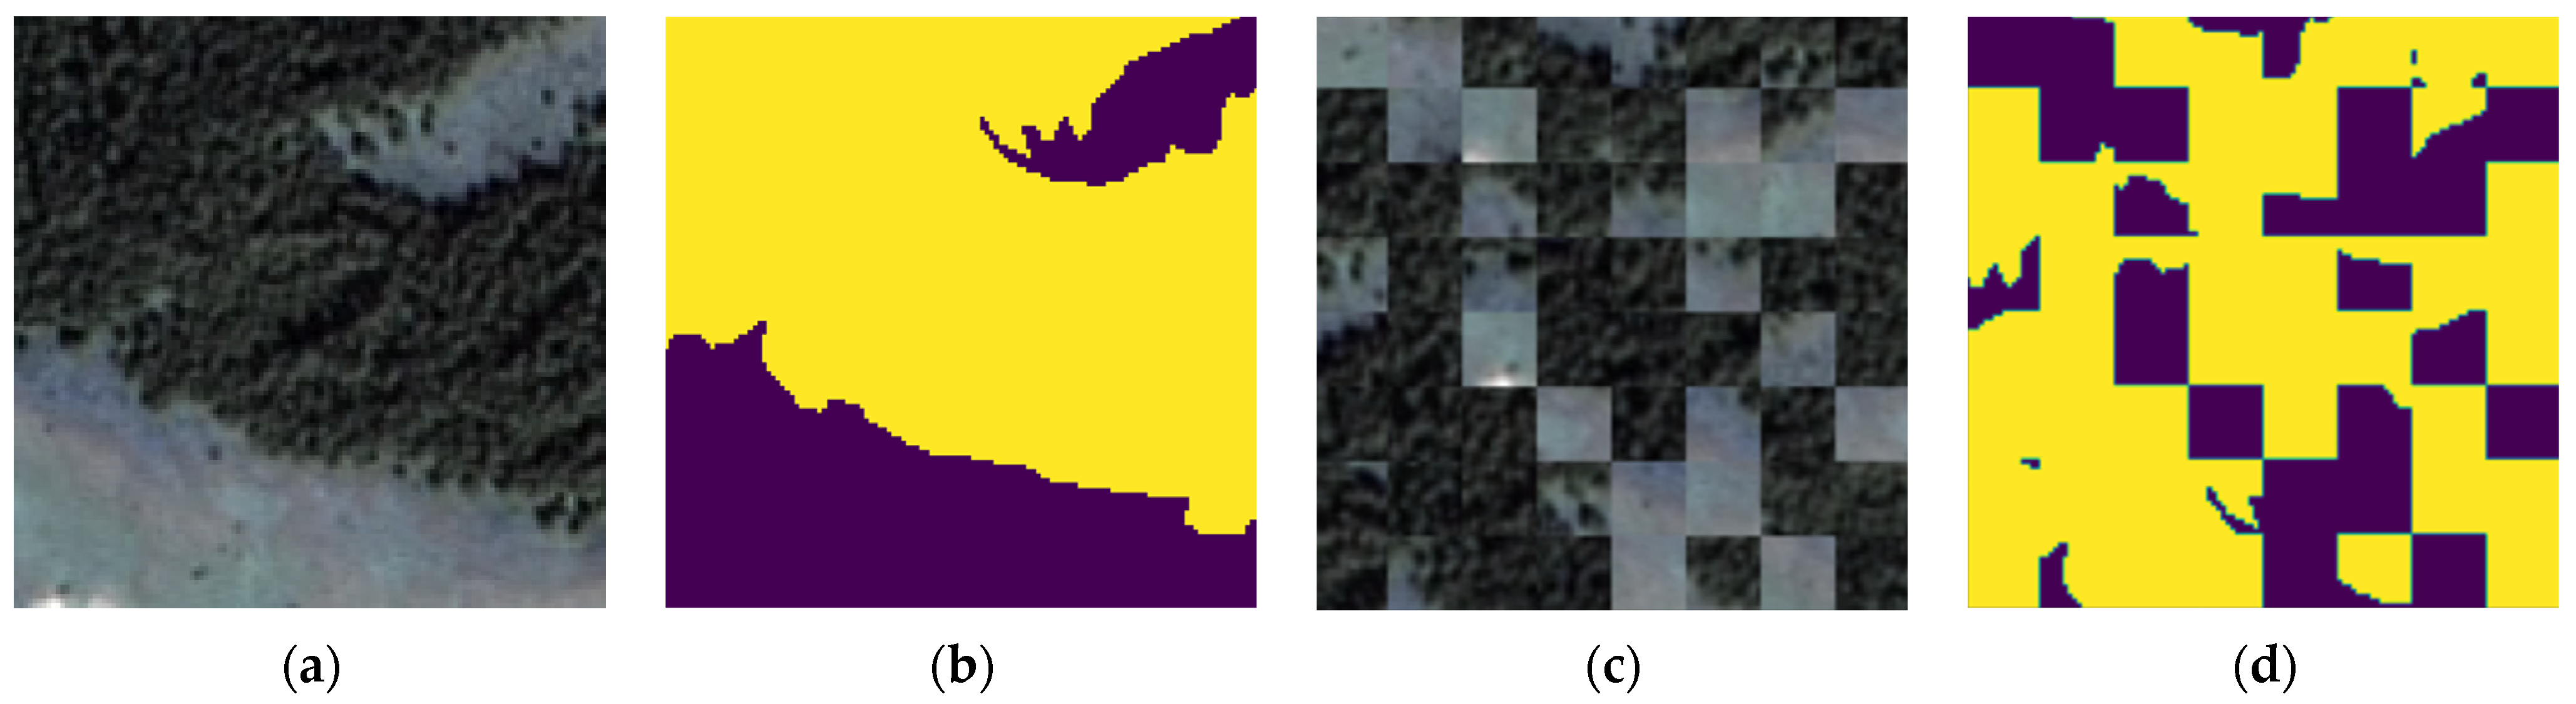
2.3. Proposed Data Augmentation

In deep learning, data augmentation has often been utilized to increase the size of a training dataset when the available data were limited. By artificially increasing the amount of data in the train set, this technique could effectively improve the robustness of the model during training. The existing data augmentation methods were mainly based on simple transformations of images. For example, geometric transformations, including flipping, scaling, translating, rotating and random cropping, and intensity transformations, including grayscale and color transformation [46]. These methods were relatively straightforward for data processing and could only increase the quantity of the dataset, without necessarily guaranteeing an improvement in data quality. For instance, flipping and rotating operations did not alter the forest distribution in the remote sensing image, and the resulting augmented image may not be significantly different from the original. Similarly, while grayscale and color transformations could enhance the diversity and variability of the training samples, they could also introduce noise and inconsistencies into the data, which could lead to overfitting or poor generalization performance of the deep learning algorithm. Effective data augmentation methods not only expanded the amount of data in the dataset but also took into account that the quality of the expanded data has a positive impact on the training of the model.
The images in the Sanjiangyuan plateau forest dataset were only forest and non-forest binary classification images, and there were many types of forests and complex geographical landscape distributions. In order to reduce the cost of manual labeling and solve the problem of the lack of a large number of manually labelled ground truth labels, and to further improve the robustness of remote sensing forest image segmentation networks, we proposed a novel data augmentation method that expanded the training data by modifying the spatial distribution of the forest in remote sensing images based on the characteristics of the forest and non-forest binary classification segmentation task. The operation was as follows: the original image of 128 × 128 pixels was cut into 64 blocks of equal size by 8 × 8 equally, and these blocks were rearranged and randomly combined to form a new image of the same size as the original image of 128 × 128 pixels. The visualization effect is shown in Figure 7.
After the proposed data augmentation operation, the spatial distribution of forest trees in the expanded training images was more random, sacrificing some of the image wholeness and thus greatly increasing the data complexity. The data augmentation proposed in this paper expanded the training data from 800 to 1600 and improved the ability of the network to perceive image details and increased the robustness of forest remote sensing image segmentation networks. The experiments in Section 3 showed that the proposed data augmentation method can effectively improve the accuracy of image segmentation networks.

2.4. Comparison with Existing Methods

To verify the effectiveness of the proposed network, we compared a number of prevalent image segmentation algorithms that were widely utilized in the field of remote sensing image segmentation, including FCN [20], DeepLab [24], PSPNet [22], DANet [25], SegNet [23], U-Net [21], and the improved networks MultiResUNet [45] and Attention U-Net [44] based on U-Net. FCN had three architectures, including FCN-8s, FCN-16s, and FCN-32s, and this paper used FCN-8s, which has been shown to perform best in the semantic segmentation task after many contrast experiments [47]. In the DeepLab series, this paper used the latest version DeepLab V3+.

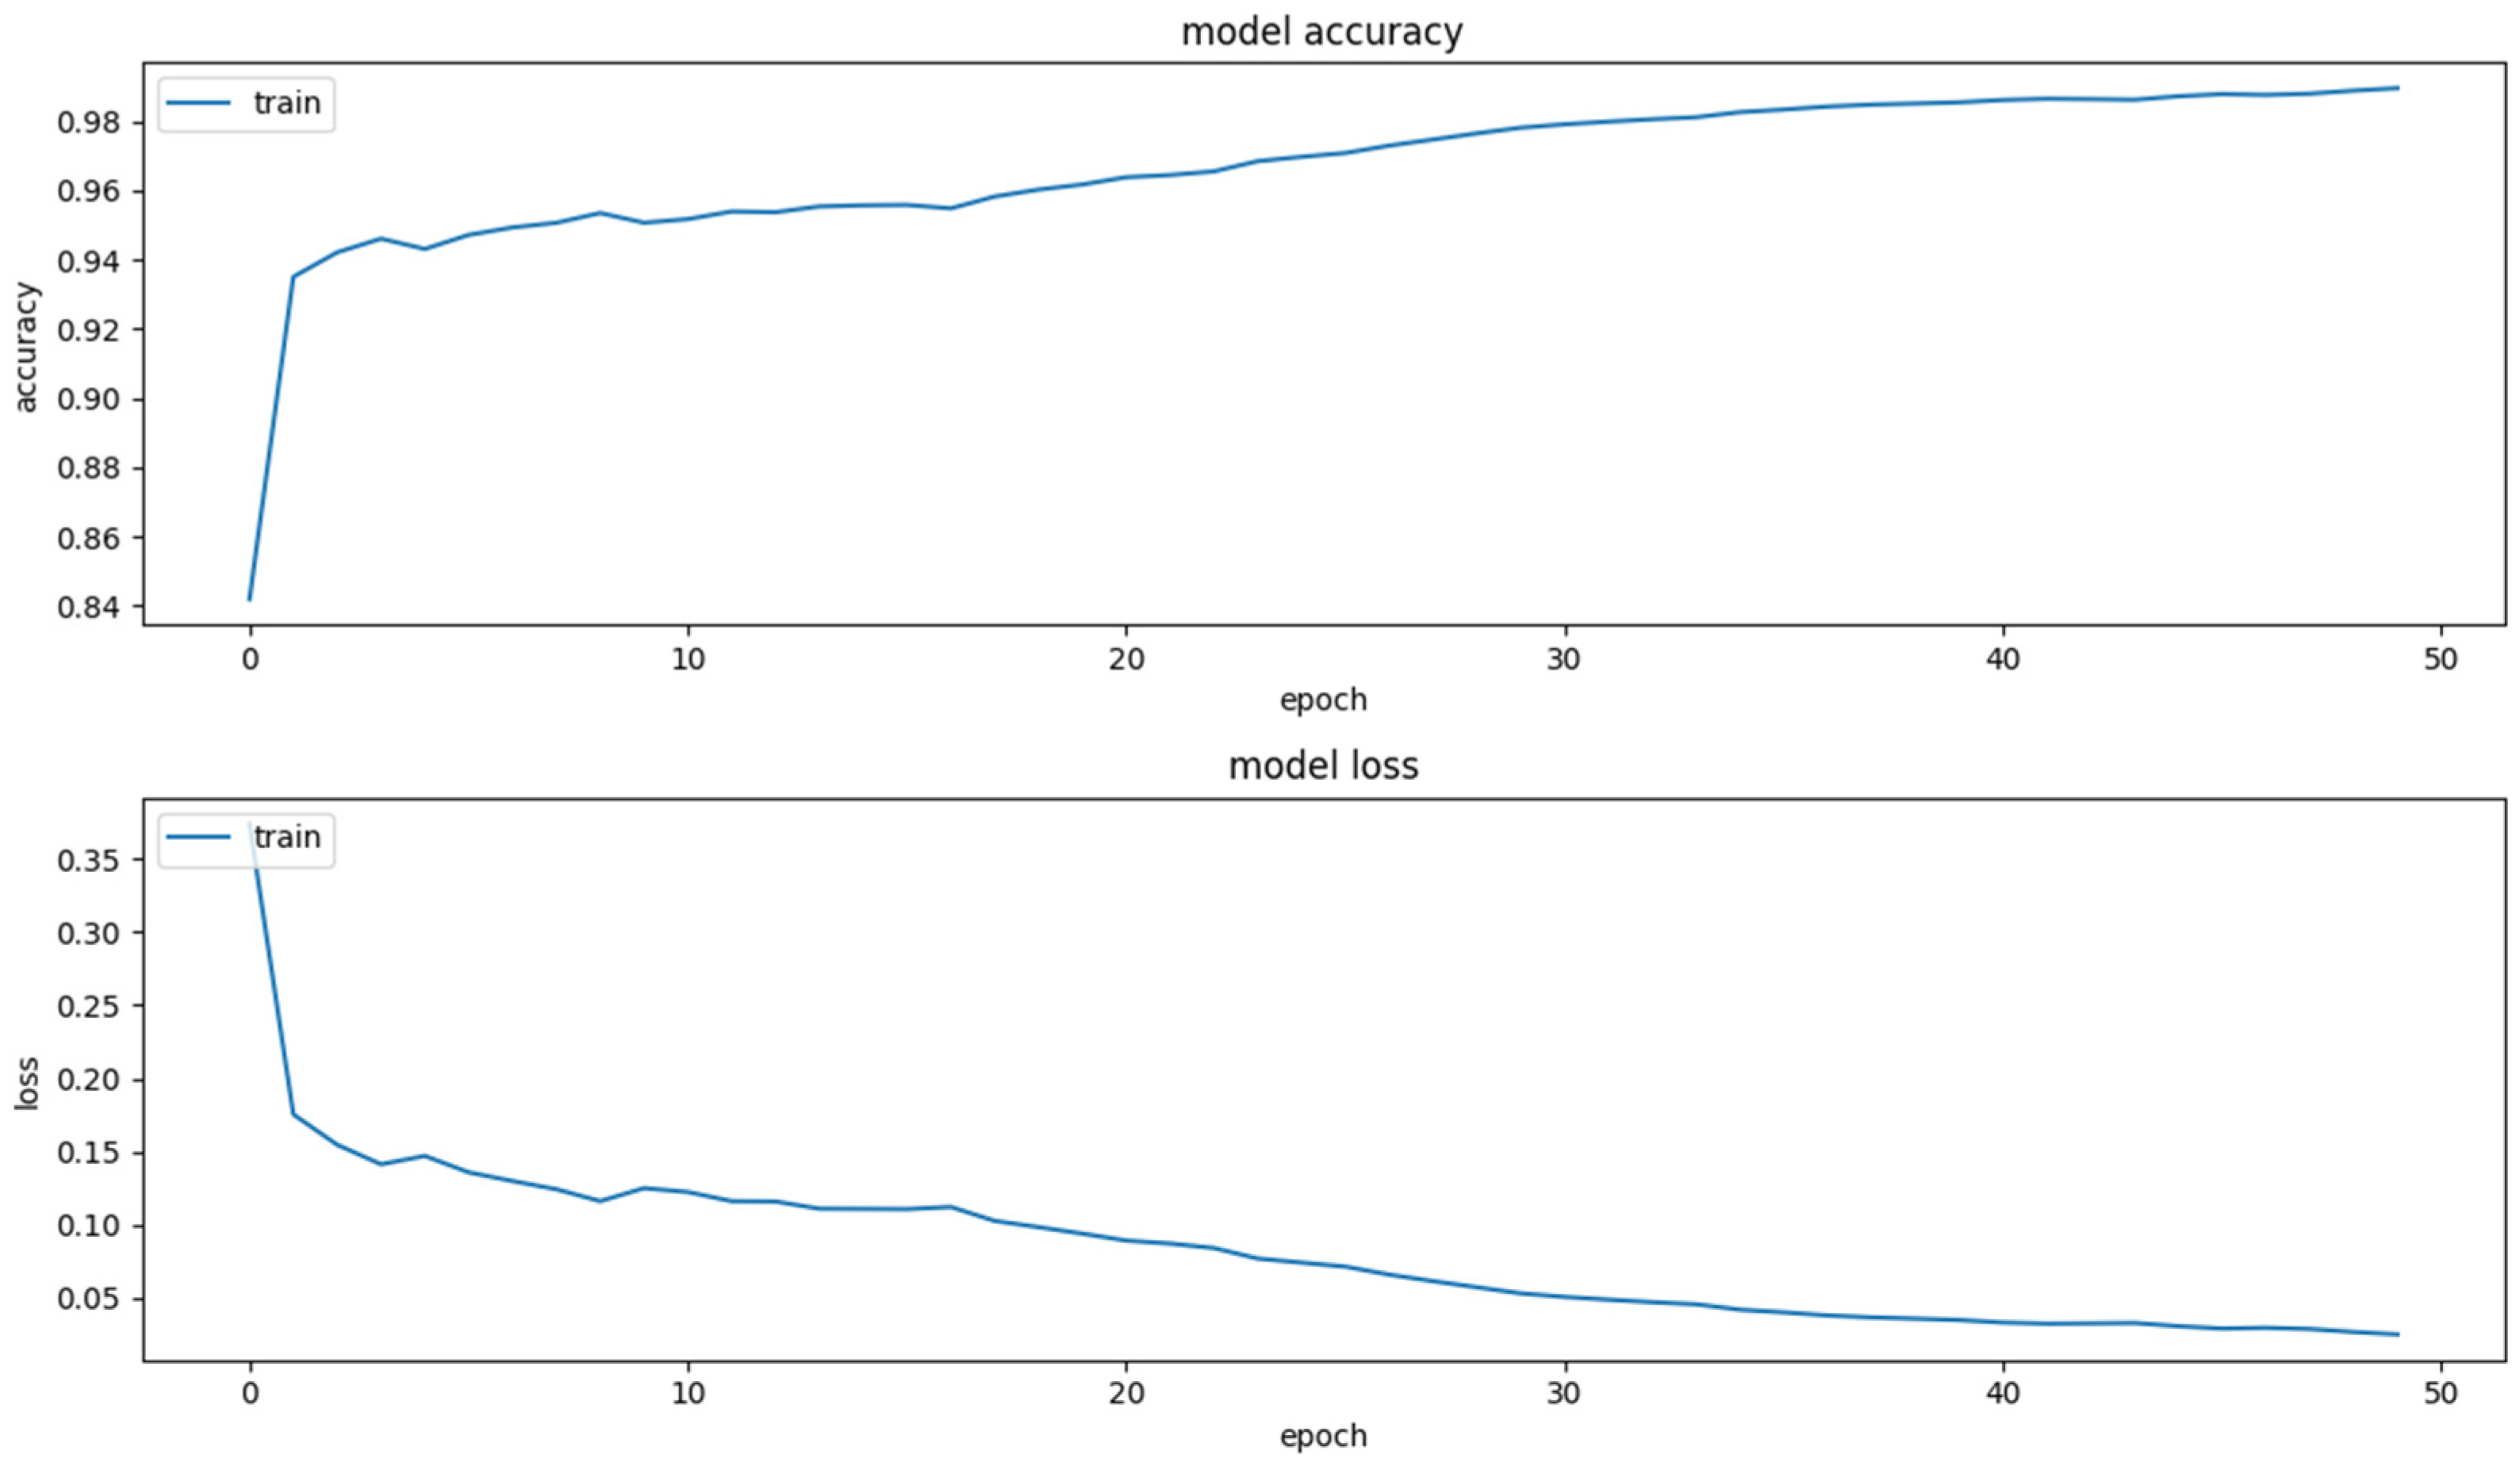
2.5. Network Training

The experimental environment in this paper comprised Ubuntu 20.04 with an Intel Xeon Gold 5218R CPU and a Nvidia GeForce RTX 3090 24G GPU. All image segmentation networks in this paper were implemented using the Keras [48] framework and a TensorFlow [49] backend with CUDA11.7 and CUDNN8.2.4, and the development language was Python 3.8. To ensure the fairness of the comparative experiments, the proposed model was trained under the same conditions as the comparative prevalent image segmentation network. For all CNN models, we set the batch size as 16 and trained for 50 epochs and using the Adam optimizer [50] with a learning rate of 0.0001 to improve the convergence speed and effectiveness of networks. We used the binary cross-entropy function [51] as the loss function to be calculated and utilized as a training guide, which was commonly used for image segmentation tasks, and the loss function was expressed as follows:
l o s s = i = 1 n y ^ i log y i + ( 1 y ^ i ) log ( 1 y ^ i )
In this function, y ^ i represents the output of current model, and y i represents the output of expectation.
In the large-scale plateau forest dataset in Sanjiangyuan, there were 1187 forest remote sensing image samples with accurate manual ground truth labels, of which 800 were used for the train set and 387 for the test set. In the data augmentation comparison experiment, the train set data were expanded from 800 to 1600 by the data augmentation proposed in this paper, and the test set data remained unchanged at 387. It is worth noting that the dataset consisted of 1187 images from Yushu and Guoluo counties. We randomly shuffled the distribution of remote sensing images to ensure that different types of forest images were evenly represented in the dataset. This approach was adopted to ensure the scientific validity of the experiment by ensuring that both the train set and test set contained different types of forest remote sensing data. In addition, all compared methods used a combination of RGB + NIR with four channels as a single input to the network. To maintain experimental consistency and fairness, none of the methods used pre-built models, and all were trained end-to-end, tested by using test set with 387 samples.

2.6. Accuracy Evaluation Metrics

There are various accuracy evaluation metrics for image segmentation. In this paper, precision, recall, F1 score, and Intersection over Union (IoU) [52] were used to quantitatively evaluate the result of forest remote sensing image segmentation in different image segmentation algorithms. They were formulated as in the below equations:
p r e c i s i o n = T P T P + F P
r e c a l l = T P T P + F N
F 1 = 2 × p r e c i s i o n × r e c a l l p r e c i s i o n + r e c a l l = 2 T P 2 T P + F N + F P
I o U = T P T P + F P + F N
where TP is true positive and represents the number of correctly classified forest pixels. FP is false positive and represents the number of non-forest pixels classified as forest. FN is false negative and represents the number of forest pixels classified as non-forest. TN is not used but is true negative and represents the number of correctly classified non-forest pixels.
Precision is the proportion of predicted forest pixels that are true forests, while recall is the proportion of true forest pixels that are correctly detected. F1 score is the combination of precision and recall. IoU is the most common metric for semantic segmentation, which is sensitive to some pixel errors in the result mapping and, therefore, served as the main reference evaluation metric in this paper.

3. Results

3.1. Segmentation Accuracy Assessment

To verify the effectiveness of the proposed forest remote sensing segmentation network and the proposed data augmentation algorithm, we compared the proposed network with the widely used image segmentation algorithms in train set sizes of 800 and 1600 (containing 800 samples expanded by data augmentation), respectively, and the segmentation performance of all methods was further investigated by quantitative evaluation.
The training curve of the proposed forest remote sensing image segmentation network model is shown in Figure 8.
As can be seen in Figure 8, the two curves show the variation in the accuracy and the loss of the training model on the train set, respectively. After 50 epochs of training, we can clearly see that both the accuracy curve and the loss curve have reached a satisfactory state. In addition, the loss curve increased slightly three times in the first 20 epochs of the start, and the accuracy curve was accompanied by a slight decrease. Overall, both the accuracy and loss curves show good trends, reflecting the good convergence of the proposed forest remote sensing image segmentation network.
To ensure a fair comparison between different models, we tested all trained models, whether using 800 or 1600 samples for training, on the same test set with 387 samples. The results of comparing the segmentation performance of different networks trained with 800 and 1600 samples respectively are shown in Table 3.
It can be observed from Table 3 that DeepLabV3+ performed the most poorly in forest remote sensing image segmentation among the widely used deep learning image segmentation networks, and FCN-8s also had below average performance due to their over large scale of upsampling. Compared with other prevalent networks, U-Net and Attention U-Net developed on U-Net improvement performed better in terms of segmentation effect, but MultiResUNet developed on U-Net improvement did not perform as well as U-Net in the field of remote sensing image segmentation. Attention U-Net was designed by using proposed Attention Gates based on encoder–decoder structure and DANet (Dual Attention Network) was designed by merging proposed Position Attention Module and Channel Attention Module. Although they both utilized attention mechanisms in their networks, the Attention U-Net, designed based on the encoder–decoder structure, performed better in the field of forest remote sensing images segmentation. In addition, algorithms designed based on the Encoder–Decoder structure performed relatively well in compared prevalent segmentation networks. Therefore, we proposed a network based on the encoder–decoder structure. Using IoU as the main reference evaluation criterion, when the segmentation network was trained on a training set of 800 samples, the proposed network outperformed the compared widely used segmentation networks with an IoU of 89.71%, which was 1.76% better than U-Net, the most widely used in remote sensing, and, compared to Attention U-Net, the best performer in the compared prevalent image segmentation networks, IoU improved by 0.97%. Furthermore, the proposed network also achieved the optimal level of precision, recall, and F1 score when compared to the prevalent image segmentation networks.
With the proposed data augmentation algorithms, the size of the train set was increased from 800 to 1600 samples. By training with more samples with a more complex spatial distribution of the forest, all networks had different degrees of improvement. DeepLabV3+ had the most pronounced lifting effect but still had the poorest results. The FCN-8s also had a significant improvement, with slightly below average performance. After expanding the train set with data augmentation, PSPNet outperformed DANet, U-Net, and MultiResUnet, and Attention U-Net still performed best among the compared segmentation networks. The performance of the proposed network was further improved with an IoU of 90.19, which was a 0.48% improvement in comparison to the performance of the train set of 800 samples without data augmentation. By training with 1600 samples, the IoU of the proposed network was improved by 1.99% compared to U-Net and 1.05% compared to Attention U-Net. Compared to training without data augmentation algorithms, the improvement was more evident.

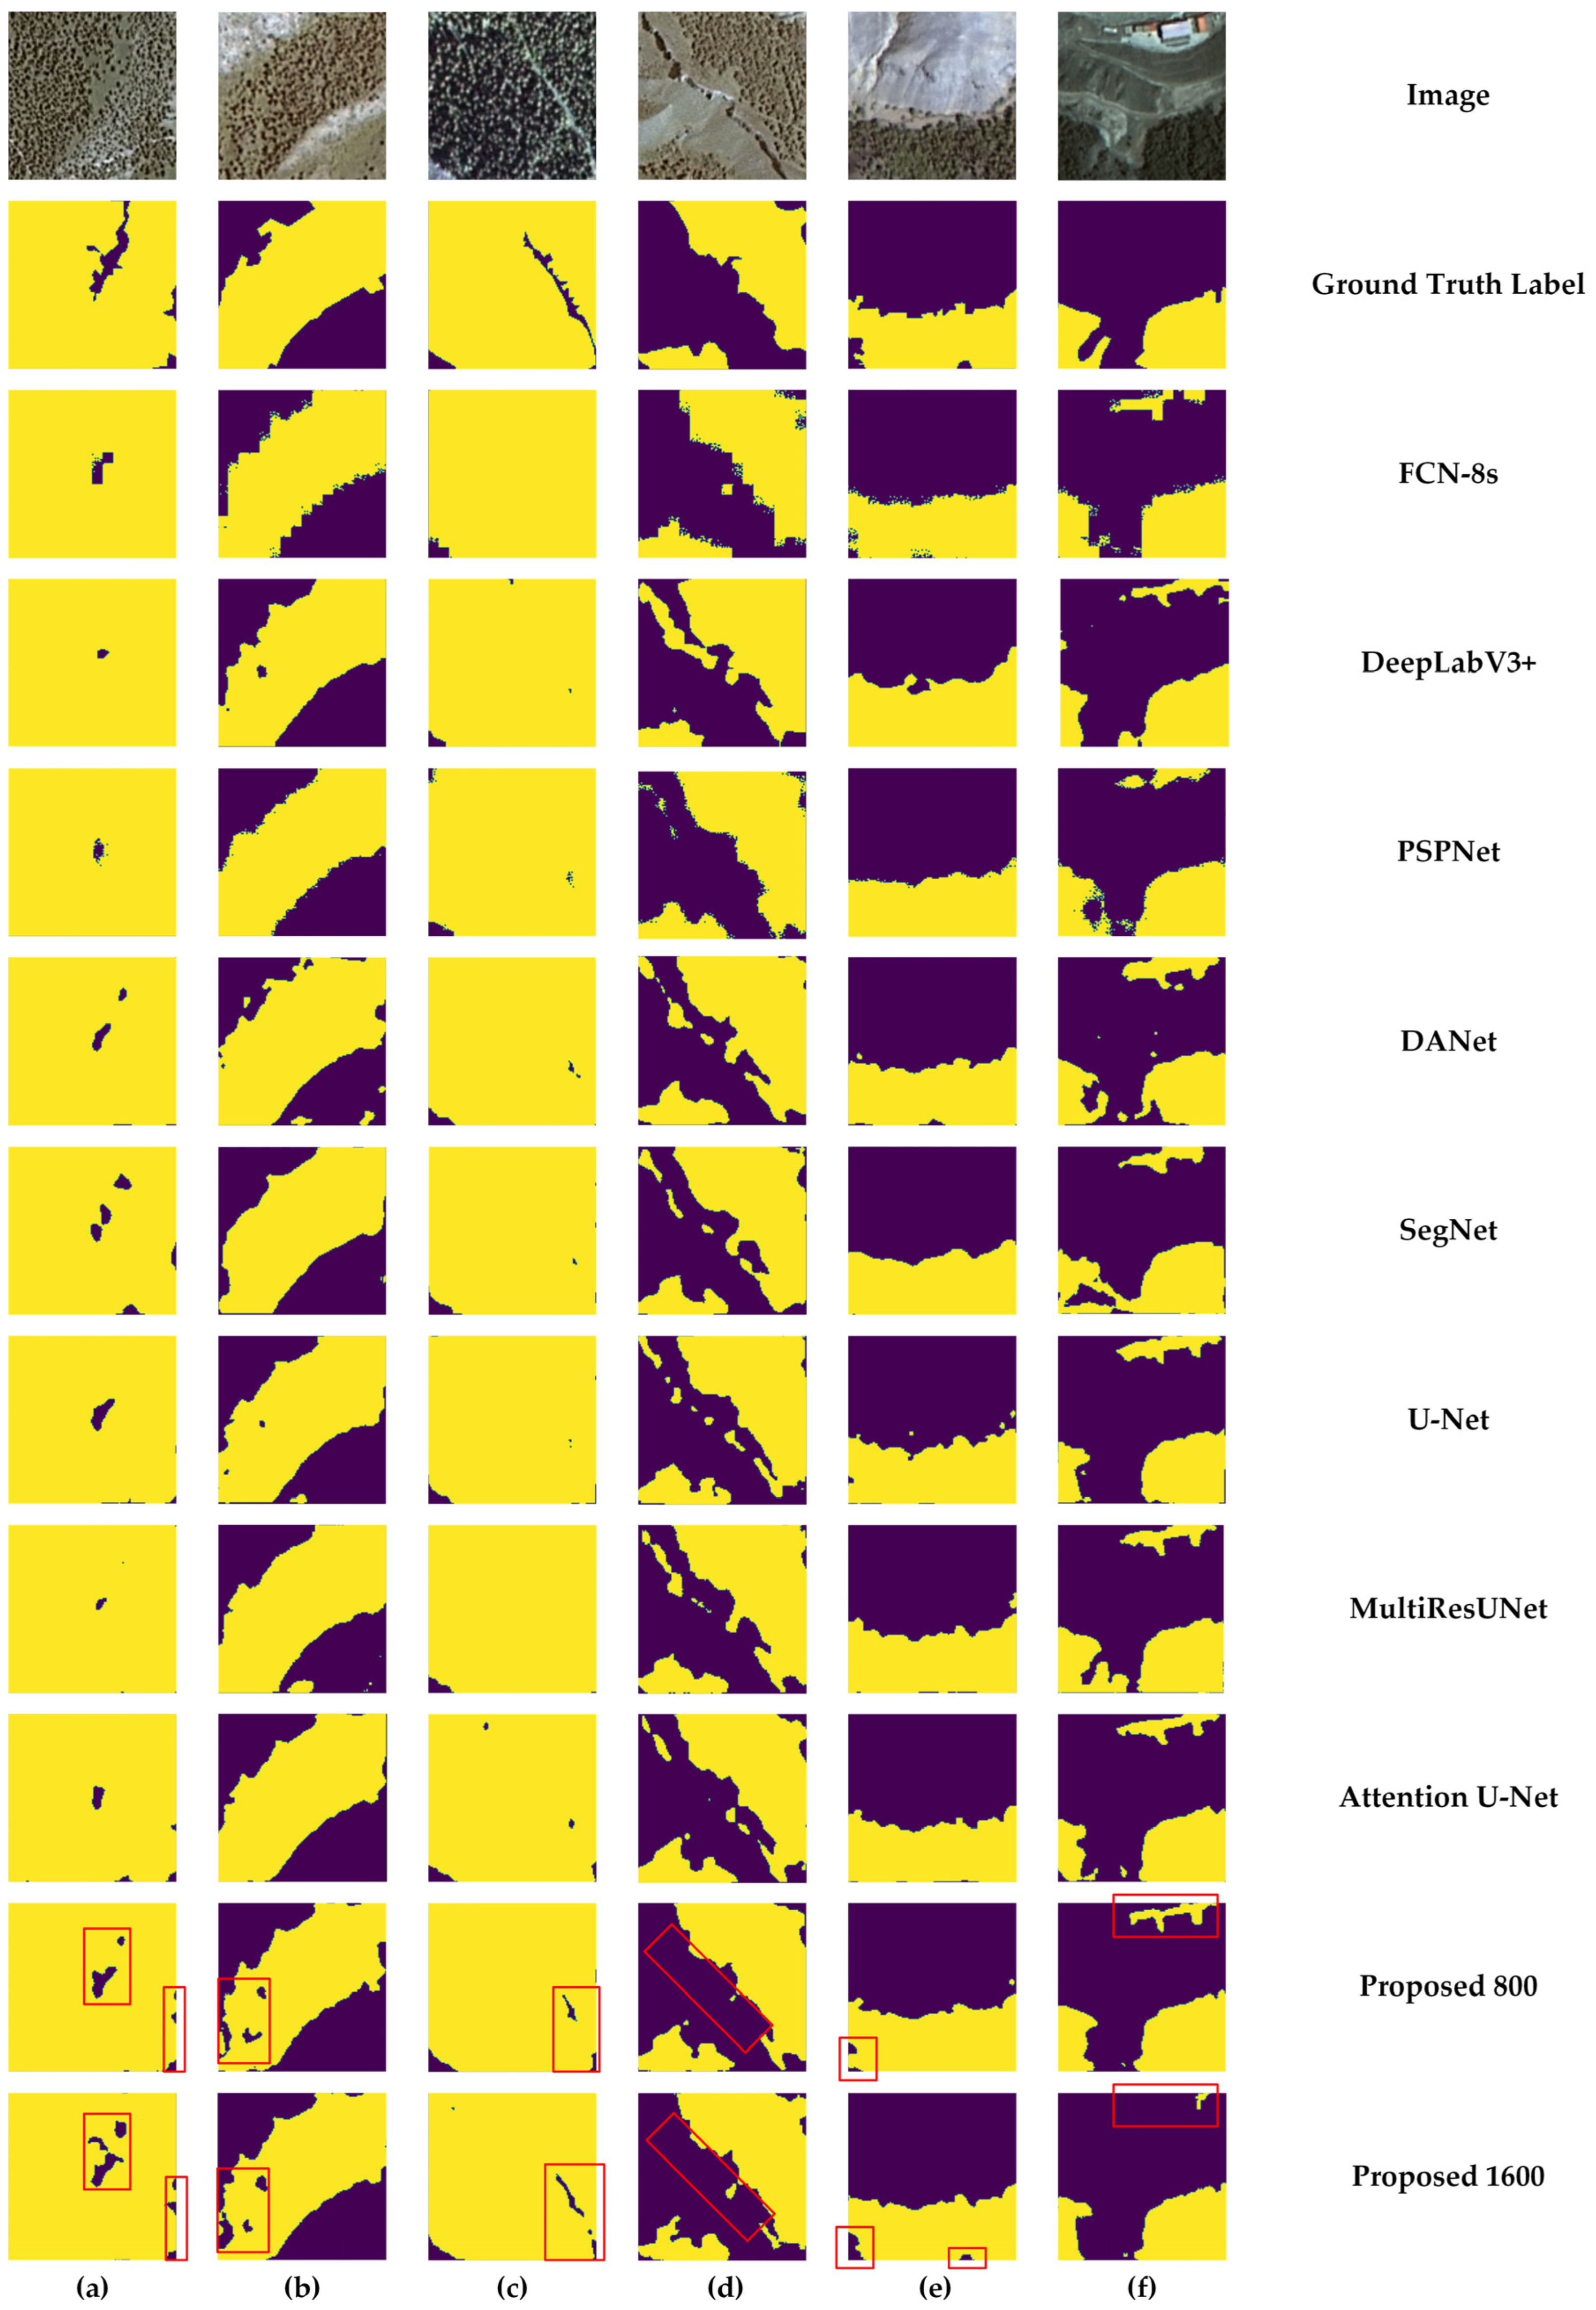
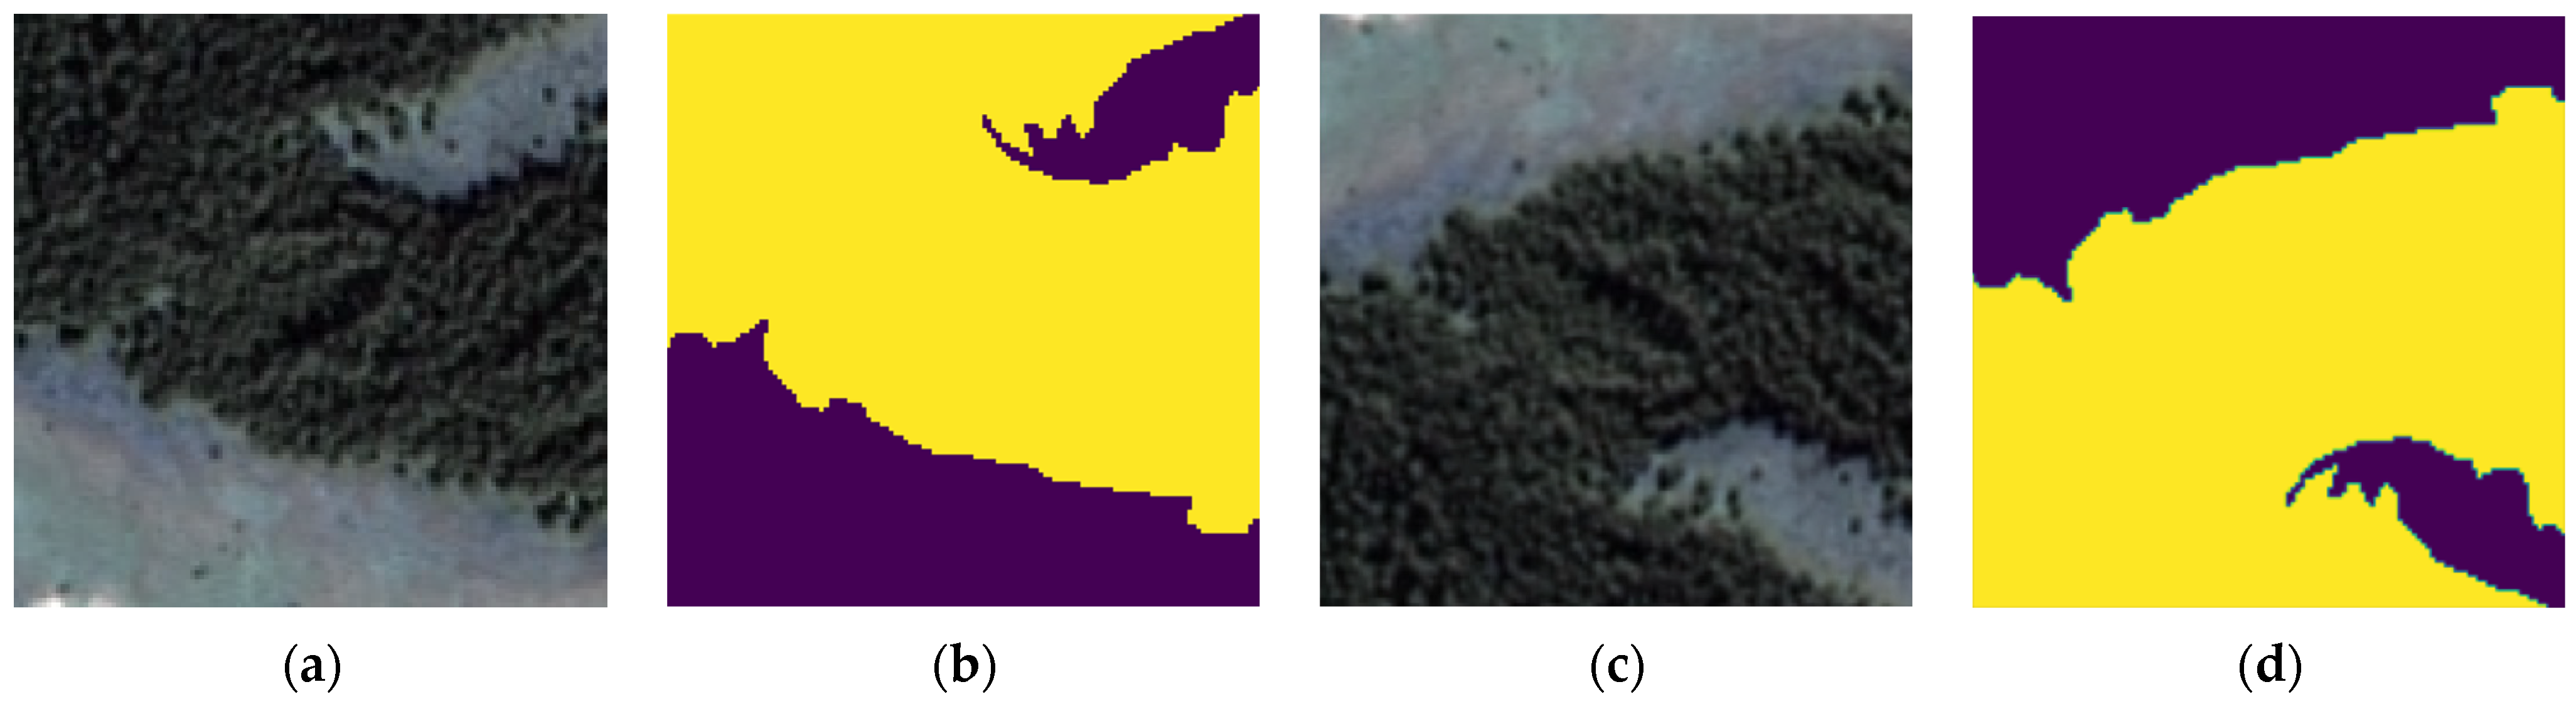
3.2. Segmentation Visual Assessment

To better demonstrate the advantages of the proposed methods, a visualization of the comparison of the forest segmentation results of different algorithms is shown in Figure 8. There are six representative forest remote sensing images of different types are shown. Combining the segmentation results of all the remote sensing images of the forest in the figure, it is evident that the segmentation results produced by PSPNet and FCN had some undesired noise at the forest boundaries, and the forest segmentation results were presented in the shape of small rectangles in the results produced by FCN. The segmentation results generated by other methods had relatively clear and smooth forest boundaries. While DeepLab V3+ provided the worst segmentation results in the accuracy assessment of different evaluation metrics, the forest boundaries were relatively smooth and clear in visualization.
As shown in images (a), (c), and (e) in Figure 9, it is difficult for the compared widely used segmentation networks to extract the non-forest parts of small areas in the image. As the proposed network was designed according to the characteristics of forest remote sensing images and had a strong ability to extract detailed feature information, it had a very impressive performance in extracting the non-forest parts of small areas in the image, and, by training with 1600 samples, which was expanded by the proposed data augmentation, the ability to extract detailed feature information was further improved, and the segmentation effect was further improved. Additionally, as shown in image (b) in Figure 9, even if the small part of the non-forest was not labeled in the ground truth, the proposed network with or without the proposed data augmentation algorithm could identify these detailed parts. As shown in image (d) in Figure 9, the compared segmentation networks incorrectly identified non-forested parts of the image as forests, whereas the proposed network accurately identified them as non-forested. This demonstrated the ability of the proposed network to identify non-forested parts of forest remote sensing images. However, for the non-forest parts of the image (f) in Figure 9, the proposed network also incorrectly identified them as forest, but, after training with 1600 samples expanded with the proposed data augmentation, the proposed network improved the accuracy of identifying the non-forest parts significantly. As a result, this demonstrated the effectiveness of the proposed data augmentation approach. This improved the ability of detail feature information extraction and the accuracy of the remote sensing image segmentation network in complex scenarios.

3.3. Data Augmentation Assessment

The experiments in Section 3.1 and Section 3.2 demonstrated that the proposed data augmentation method was effective in improving the accuracy of the different CNN models in different degrees. To demonstrate the advantages of the proposed data augmentation method over the common data augmentation method, we also expanded the training data from 800 to 1600 by flipping to train networks as contrast experiments. The visualization effect of the remote sensing image and flipped image with their ground truth labels is shown in Figure 10. As shown in Figure 10, the remote sensing image and its ground truth label was flipped in in the vertical direction. The training models used were the same as those used in Section 3.1, including the compared image segmentation networks and the proposed remote sensing image segmentation model. The train set contained 1600 samples, and the only difference from the train set used in Section 3.1 was that 800 of these samples were expanded by flipping. To ensure a fair comparison, all the trained models were tested on a test set with 387 samples as same as the experiments in Table 3. The results of comparing the segmentation performance of different networks trained with 1600 samples are shown in Table 4.
As shown in Table 4, when comparing the results of models trained with 1600 samples (expanded by flipping) to those models trained with the original 800 samples (without data augmentation), there appeared to be a slight improvement in the segmentation accuracy for all methods. The improvement was relatively evident for FCN-8 and DeepLab V3+, as they performed poorly when trained without data augmentation. However, the improvement was far from the performance of the models trained with 1600 samples (expanded by the proposed data augmentation method). It can be seen that the proposed data augmentation method had some advantages in improving the performance of the forest remote sensing image segmentation. It is worth noting that the proposed remote sensing image segmentation network achieved the best results, even in the case of training with 1600 samples expanded by flipping.

4. Discussion

In this paper, we proposed a novel data augmentation algorithm that modified the spatial distribution of remote sensing images to expand the training set and proposed a high-resolution forest remote sensing image segmentation network by fusing multi-scale features based on double input.
To verify the effectiveness of the proposed method, we performed comparative experiments using the widely used image segmentation networks under the same conditions. By using the same train set, test set, and evaluation metrics, the comparison experiments provided a fair and objective evaluation of the proposed method’s performance in both objective accuracy assessment and subjective visual assessment. Among the methods compared, as shown in Table 3, FCN-8s and DeepLab V3+ performed relatively poorly and below average, while PSPNet, DANet, and U-Net were close to each other. The performance of Attention U-Net, which was designed based on U-Net, was significantly better than that of U-Net. Additionally, it reached an IoU of 88.74% trained with original 800 samples, which was also the best performance among the methods compared. However, the performance of MultiResUnet, which was also designed based on U-Net, decreased slightly compared to U-Net. The proposed forest remote sensing image segmentation network achieved the best results, with a more significant improvement in performance compared to the prevalent networks. As also could be seen in Figure 9, in the results obtained by FCN-8 and PSPNet, there was a lot of noise at the edges of the forest. The results obtained by Attention U-Net were relatively good, while the results obtained by the other widely used networks compared were similar. The proposed network had a clear advantage over the compared prevalent image segmentation models. In addition, with 1600 samples of training expanded using the proposed data augmentation method, as shown in Table 3, the performance of all methods improved to varying degrees. The proposed network had further improved its performance and achieved a 90.19% in IoU. In the visual assessment results, as shown in Figure 9, the superiority of the proposed method was better demonstrated. Compared to the widely used networks, the proposed network could identify local details and forest and non-forest parts more effectively, and the proposed data augmentation method further improved the results. Furthermore, to further demonstrate the advantages of the proposed data augmentation method, we compared it with a common data augmentation method: flipping. By flipping, the training samples were also expanded from 800 to 1600. However, as shown in Table 4, the improvement in results obtained by training under the same conditions was only slightly enhanced, which was far inferior to the proposed data augmentation method. The performance of FCN-8s and DeepLab V3+ has been improved relatively effectively, which indicated that these two networks required a larger amount of training data to achieve satisfactory results [53]. For other networks, the used common data augmentation methods did not significantly alter the original image [54]. We believe the changes in the orientation of the remote sensing image had little effect on the recognition of the forest by the network since the forest had changed its location [55] and the forest itself remained unchanged. However, the proposed data augmentation method greatly altered the spatial distribution of the forest in the image and increased the complexity of the forest remote sensing image, resulting in improved effectiveness in image segmentation. Both the proposed network and the data augmentation demonstrated their effectiveness in improving the accuracy of forest remote sensing image segmentation. However, the comparison revealed that the proposed network was more innovative, and the improvement effect was more evident.
Compared to other widely used image segmentation networks, our proposed network significantly improved the extraction of detailed features from remote sensing images. Moreover, the robustness of the network was further improved after training with the proposed data augmentation method. Therefore, we believe that the proposed data augmentation algorithm could be applied to similar binary classification remote sensing image segmentation tasks, such as road extraction [56], water extraction [57], agricultural land mapping [58], and more. Furthermore, we also believe that the proposed network could also be applied to other remote sensing image segmentation tasks and even to non-remote sensing tasks that require small detail feature information extraction.
However, there were some limitations to this study. The dataset used for this research was manually annotated by human eye observation of remotely sensed imagery, but the labeling of forest extent was inaccurate due to the 2 m resolution remotely sensed imagery not being very clear. We believe that a higher accuracy rate could be achieved through the methods proposed in this paper by accurately relabeling this dataset through technical means such as fieldwork or aerial photography [59] or by using a higher resolution remote sensing image dataset [60]. Meanwhile, the cost of fieldwork could be greatly reduced by using the proposed data augmentation algorithm. Moreover, the dataset only classified forest and non-forest and did not accurately classify tree species, which is an area for future work. To achieve accurate classification of tree species, we will need to acquire more specific data and conduct more in-depth research on tree species classification [61]. Despite these limitations, our proposed data augmentation algorithm and high-resolution forest remote sensing image segmentation network have demonstrated promising results, and we believe that they will be useful in future remote sensing studies.

5. Conclusions

Forest ecosystems provide a wide range of ecological services and socio-economic benefits. There are still a number of challenges in applying deep learning to forest cover monitoring using high-resolution remote sensing imagery.
In this paper, in order to reduce the cost of manual labelling and expand the training data, we proposed a novel data augmentation algorithm to expand the training set from 800 to 1600 by modifying the remote sensing spatial distribution based on the characteristics of the forest remote sensing image segmentation task. In addition, in order to strengthen the ability to extract multi-scale detailed feature information and feature information in the NIR band in remote sensing images and to improve the accuracy of image segmentation networks in extracting forests from remote sensing images, we proposed a high-resolution forest remote sensing image segmentation network by fusing multi-scale features based on double input. One of the inputs was a conventional RGB band, and the other was a NIR band in remote sensing images. The proposed network was designed based on the encoder–decoder structure and was equipped with a proposed convolution block, multi-scale feature fusion module, and feature amplification extraction module. With the help of the convolution block, the network strengthened its ability to extract feature information from remote sensing images based on the use of convolution with a kernel size of 1 × 1. Inspired by ASPP, the multi-scale feature fusion module had been designed to fuse global contextual semantic information from different scales. Feature amplification extraction module designed to be used in the connection part of the equivalent stage between encoder and decoder to extract the detail feature information by amplification from different spatial scales. With and without training of the data augmentation algorithm, the IoU of the proposed network reached 90.19% and 89.71%, respectively, using the Sanjiangyuan plateau forest dataset, which temporally scaled from May to June. Compared to using only U-Net, which is the most widely used in remote sensing, the IoU of the proposed network with the proposed algorithm was improved by 2.24%.
The proposed methods achieved good performance in the forest segmentation task of high-resolution remote sensing images and had important implications for large-scale forest mapping, forest conservation, climate analysis, forest ecosystem management, and sustainable development, as they can provide a more accurate method for analyzing the variation in surface forest area over different temporal scales.

Author Contributions

Y.H. designed methods and conducted the experiments and performed the programming. Z.W. and K.J. prepared the original research resources and data curation. Y.H. wrote the paper, K.J. and Z.W. revised the paper. K.J. supervised the study. All authors have read and agreed to the published version of the manuscript.

Funding

This research was funded by the Basic Research Program of Qinghai Province, grant number 2020-ZJ-709.

Data Availability Statement

Not applicable.

Conflicts of Interest

The authors declare no conflict of interest.

References

  1. Bonan, G.B. Forests and climate change: Forcings, feedbacks, and the climate benefits of forests. Science 2008, 320, 1444–1449. [Google Scholar] [CrossRef]
  2. Xiao, J.-L.; Zeng, F.; He, Q.-L.; Yao, Y.-X.; Han, X.; Shi, W.-Y. Responses of Forest Carbon Cycle to Drought and Elevated CO2. Atmosphere 2021, 12, 212. [Google Scholar] [CrossRef]
  3. Shaheen, H.; Khan, R.W.A.; Hussain, K.; Ullah, T.S.; Nasir, M.; Mehmood, A. Carbon stocks assessment in subtropical forest types of Kashmir Himalayas. Pak. J. Bot 2016, 48, 2351–2357. [Google Scholar]
  4. Raymond, C.M.; Bryan, B.A.; MacDonald, D.H.; Cast, A.; Strathearn, S.; Grandgirard, A.; Kalivas, T. Mapping community values for natural capital and ecosystem services. Ecol. Econ. 2009, 68, 1301–1315. [Google Scholar] [CrossRef]
  5. Belgiu, M.; Drăguţ, L. Random forest in remote sensing: A review of applications and future directions. ISPRS J. Photogramm. Remote Sens. 2016, 114, 24–31. [Google Scholar] [CrossRef]
  6. Nguyen, T.-A.; Kellenberger, B.; Tuia, D. Mapping forest in the Swiss Alps treeline ecotone with explainable deep learning. Remote Sens. Environ. 2022, 281, 113217. [Google Scholar] [CrossRef]
  7. AHoscilo, A.; Lewandowska, A. Mapping Forest Type and Tree Species on a Regional Scale Using Multi-Temporal Sentinel-2 Data. Remote Sens. 2019, 11, 929. [Google Scholar] [CrossRef]
  8. Camarretta, N.; Harrison, P.A.; Bailey, T.; Potts, B.; Lucieer, A.; Davidson, N.; Hunt, M. Monitoring Forest Structure to Guide Adaptive Management of Forest Restoration: A Review of Remote Sensing Approaches. New For. 2020, 51, 573–596. [Google Scholar] [CrossRef]
  9. Huete, A.R. Vegetation Indices, Remote Sensing and Forest Monitoring. Geogr. Compass 2012, 6, 513–532. [Google Scholar] [CrossRef]
  10. Shimu, S.; Aktar, M.; Afjal, M.; Nitu, A.; Uddin, M.; Al Mamun, M. NDVI based change detection in Sundarban Mangrove Forest using remote sensing data. In Proceedings of the 2019 4th International Conference on Electrical Information and Communication Technology (EICT), Khulna, Bangladesh, 20–22 December 2019; pp. 1–5. [Google Scholar]
  11. Pesaresi, S.; Mancini, A.; Casavecchia, S. Recognition and Characterization of Forest Plant Communities through Remote-Sensing NDVI Time Series. Diversity 2020, 12, 313. [Google Scholar] [CrossRef]
  12. Spruce, J.P.; Hicke, J.A.; Hargrove, W.W.; Grulke, N.E.; Meddens, A.J.H. Use of MODIS NDVI Products to Map Tree Mortality Levels in Forests Affected by Mountain Pine Beetle Outbreaks. Forests 2019, 10, 811. [Google Scholar] [CrossRef]
  13. Pesaresi, S.; Mancini, A.; Quattrini, G.; Casavecchia, S. Mapping Mediterranean Forest Plant Associations and Habitats with Functional Principal Component Analysis Using Landsat 8 NDVI Time Series. Remote Sens. 2020, 12, 1132. [Google Scholar] [CrossRef]
  14. Piragnolo, M.; Pirotti, F.; Zanrosso, C.; Lingua, E.; Grigolato, S. Responding to Large-Scale Forest Damage in an Alpine Environment with Remote Sensing, Machine Learning, and Web-GIS. Remote Sens. 2021, 13, 1541. [Google Scholar] [CrossRef]
  15. Sheykhmousa, M.; Mahdianpari, M.; Ghanbari, H.; Mohammadimanesh, F.; Ghamisi, P.; Homayouni, S. Support Vector Machine Versus Random Forest for Remote Sensing Image Classification: A Meta-Analysis and Systematic Review. IEEE J. Sel. Top. Appl. Earth Obs. Remote Sens. 2020, 13, 6308–6325. [Google Scholar] [CrossRef]
  16. Mansaray, L.R.; Wang, F.; Huang, J.; Yang, L.; Kanu, A.S. Accuracies of support vector machine and random forest in rice mapping with Sentinel-1A, Landsat-8 and Sentinel-2A datasets. Geocarto Int. 2020, 35, 1088–1108. [Google Scholar] [CrossRef]
  17. Zagajewski, B.; Kluczek, M.; Raczko, E.; Njegovec, A.; Dabija, A.; Kycko, M. Comparison of random forest, support vector machines, and neural networks for post-disaster forest species mapping of the Krkonoše/Karkonosze Transboundary Biosphere Reserve. Remote Sens. 2021, 13, 2581. [Google Scholar] [CrossRef]
  18. Thanh Noi, P.; Kappas, M. Comparison of Random Forest, k-Nearest Neighbor, and Support Vector Machine Classifiers for Land Cover Classification Using Sentinel-2 Imagery. Sensors 2017, 18, 18. [Google Scholar] [CrossRef] [PubMed]
  19. Zafari, A.; Zurita-Milla, R.; Izquierdo-Verdiguier, E. Integrating support vector machines and random forests to classify crops in time series of Worldview-2 images. Image Signal Process. Remote Sens. XXIII 2017, 10427, 243–253. [Google Scholar]
  20. Long, J.; Shelhamer, E.; Darrell, T. Fully convolutional networks for semantic segmentation. In Proceedings of the IEEE Conference on Computer Vision and Pattern Recognition, Boston, MA, USA, 7–12 June 2015; pp. 3431–3440. [Google Scholar]
  21. Ronneberger, O.; Fischer, P.; Brox, T. U-net: Convolutional networks for biomedical image segmentation. In Proceedings of the Medical Image Computing and Computer-Assisted Intervention–MICCAI 2015: 18th International Conference, Munich, Germany, 5–9 October 2015; Springer: Cham, Switzerland, 2015; pp. 234–241. [Google Scholar]
  22. Zhao, H.; Shi, J.; Qi, X.; Wang, X.; Jia, J. Pyramid Scene Parsing Network. In Proceedings of the 2017 IEEE Conference on Computer Vision and Pattern Recognition (CVPR), Honolulu, HI, USA, 21–26 July 2017; pp. 6230–6239. [Google Scholar]
  23. Badrinarayanan, V.; Kendall, A.; Cipolla, R. SegNet: A Deep Convolutional Encoder-Decoder Architecture for Image Segmentation. IEEE Trans. Pattern Anal. Mach. Intell. 2017, 39, 2481–2495. [Google Scholar] [CrossRef]
  24. Chen, L.C.; Zhu, Y.; Papandreou, G.; Schroff, F.; Adam, H. Encoder-decoder with atrous separable convolution for semantic image segmentation. In Proceedings of the European Conference on Computer Vision (ECCV), Munich, Germany, 8–14 September 2018; pp. 801–818. [Google Scholar]
  25. Fu, J.; Liu, J.; Tian, H.; Li, Y.; Bao, Y.; Fang, Z.; Lu, H. Dual Attention Network for Scene Segmentation. In Proceedings of the 2019 IEEE/CVF Conference on Computer Vision and Pattern Recognition (CVPR), Long Beach, CA, USA, 15–20 June 2019; pp. 3141–3149. [Google Scholar]
  26. Ma, L.; Liu, Y.; Zhang, X.; Ye, Y.; Yin, G.; Johnson, B.A. Deep Learning in Remote Sensing Applications: A Meta-Analysis and Review. ISPRS J. Photogramm. Remote Sens. 2019, 152, 166–177. [Google Scholar] [CrossRef]
  27. Xia, M.; Cui, Y.; Zhang, Y.; Xu, Y.; Liu, J.; Xu, Y. DAU-Net: A novel water areas segmentation structure for remote sensing image. Int. J. Remote Sens. 2021, 42, 2594–2621. [Google Scholar] [CrossRef]
  28. Jiang, B.; An, X.; Xu, S.; Chen, Z. Intelligent Image Semantic Segmentation: A Review Through Deep Learning Techniques for Remote Sensing Image Analysis. J. Indian Soc. Remote Sens. 2022, 1–14. [Google Scholar] [CrossRef]
  29. Wei, Z.; Jia, K.; Jia, X.; Liu, P.; Ma, Y.; Chen, T.; Feng, G. Mapping Large-Scale Plateau Forest in Sanjiangyuan Using High-Resolution Satellite Imagery and Few-Shot Learning. Remote Sens. 2022, 14, 388. [Google Scholar] [CrossRef]
  30. Boston, T.; Van Dijk, A.; Larraondo, P.R.; Thackway, R. Comparing CNNs and Random Forests for Landsat Image Segmentation Trained on a Large Proxy Land Cover Dataset. Remote Sens. 2022, 14, 3396. [Google Scholar] [CrossRef]
  31. Freudenberg, M.; Nölke, N.; Agostini, A.; Urban, K.; Wörgötter, F.; Kleinn, C. Large scale palm tree detection in high resolution satellite images using U-Net. Remote Sens. 2019, 11, 312. [Google Scholar] [CrossRef]
  32. Wagner, F.H.; Sanchez, A.; Tarabalka, Y.; Lotte, R.G.; Ferreira, M.P.; Aidar, M.P.M.; Gloor, E.; Phillips, O.L.; Aragão, L.E.O.C. Using the U-net convolutional network to map forest types and disturbance in the Atlantic rainforest with very high resolution images. Remote Sens. Ecol. Conserv. 2019, 5, 360–375. [Google Scholar] [CrossRef]
  33. Wagner, F.H.; Dalagnol, R.; Tagle Casapia, X.; Streher, A.S.; Phillips, O.L.; Gloor, E.; Aragão, L.E. Regional mapping and spatial distribution analysis of canopy palms in an amazon forest using deep learning and VHR images. Remote Sens. 2020, 12, 2225. [Google Scholar] [CrossRef]
  34. Flood, N.; Watson, F.; Collett, L. Using a U-net convolutional neural network to map woody vegetation extent from high resolution satellite imagery across Queensland, Australia. Int. J. Appl. Earth Obs. 2019, 82, 101897. [Google Scholar] [CrossRef]
  35. Cao, K.; Zhang, X. An Improved Res-UNet Model for Tree Species Classification Using Airborne High-Resolution Images. Remote Sens. 2020, 12, 1128. [Google Scholar] [CrossRef]
  36. Wei, Z.; Jia, K.; Jia, X.; Xie, Y.; Jiang, Z. Large-Scale River Mapping Using Contrastive Learning and Multi-Source Satellite Imagery. Remote Sens. 2021, 13, 2893. [Google Scholar] [CrossRef]
  37. Rendenieks, Z.; Nita, M.D.; Nikodemus, O.; Radeloff, V.C. Half a century of forest cover change along the Latvian-Russian border captured by object-based image analysis of Corona and Landsat TM/OLI data. Remote Sens. Environ. 2020, 249, 112010. [Google Scholar] [CrossRef]
  38. Wei, Y.; Wang, W.; Tang, X.; Li, H.; Hu, H.; Wang, X. Classification of Alpine Grasslands in Cold and High Altitudes Based on Multispectral Landsat-8 Images: A Case Study in Sanjiangyuan National Park, China. Remote Sens. 2022, 14, 3714. [Google Scholar] [CrossRef]
  39. Chen, D.; Li, Q.; Li, C.; He, F.; Huo, L.; Chen, X.; Zhang, L.; Xu, S.; Zhao, X.; Zhao, L. Density and Stoichiometric Characteristics of Carbon, Nitrogen, and Phosphorus in Surface Soil of Alpine Grassland in Sanjiangyuan. Pol. J. Environ. Stud. 2022, 31, 3531–3539. [Google Scholar] [CrossRef] [PubMed]
  40. Zhang, Y.; Yao, X.; Zhou, S.; Zhang, D. Glacier changes in the Sanjiangyuan Nature Reserve of China during 2000–2018. J. Geogr. Sci. 2022, 32, 259–279. [Google Scholar] [CrossRef]
  41. Han, Z.; Dian, Y.; Xia, H.; Zhou, J.; Jian, Y.; Yao, C.; Wang, X.; Li, Y. Comparing Fully Deep Convolutional Neural Networks for Land Cover Classification with High-Spatial-Resolution Gaofen-2 Images. ISPRS Int. J. Geo-Inf. 2020, 9, 478. [Google Scholar] [CrossRef]
  42. Nair, V.; Hinton, G.E. Rectified linear units improve Restricted Boltzmann machines. In Proceedings of the 27th International Conference on Machine Learning (ICML-10), Haifa, Israel, 21–24 June 2010; pp. 807–814. [Google Scholar]
  43. Sergey, I.; Christian, S. Batch Normalization: Accelerating Deep Network Training by Reducing Internal Covariate Shift. In Proceedings of the International Conference on Machine Learning, Lille, France, 6–11 July 2015. [Google Scholar]
  44. Oktay, O.; Schlemper, J.; Folgoc, L.L.; Lee, M.; Heinrich, M.; Misawa, K.; Mori, K.; McDonagh, S.; Hammerla, N.Y.; Kainz, B.; et al. Attention u-net: Learning where to look for the pancreas. arXiv 2018, arXiv:1804.03999. [Google Scholar]
  45. Ibtehaz, N.; Rahman, M.S. MultiResUNet: Rethinking the U-Net architecture for multimodal biomedical image segmentation. Neural Netw. 2020, 121, 74–87. [Google Scholar] [CrossRef]
  46. Oubara, A.; Wu, F.; Amamra, A.; Yang, G. Survey on Remote Sensing Data Augmentation: Advances, Challenges, and Future Perspectives. International Conference on Computing Systems and Applications (CSA), Algiers, Algeria, 17–18 May 2022; Springer: Cham, Switzerland, 2022; pp. 95–104. [Google Scholar]
  47. He, C.; Li, S.; Xiong, D.; Fang, P.; Liao, M. Remote Sensing Image Semantic Segmentation Based on Edge Information Guidance. Remote Sens. 2020, 12, 1501. [Google Scholar] [CrossRef]
  48. Moolayil, J. An Introduction to Deep Learning and Keras: A Fast-Track Approach to Modern Deep Learning with Python; Apress: Thousand Oaks, CA, USA, 2018; pp. 1–16. [Google Scholar]
  49. Drakopoulos, G.; Liapakis, X.; Spyrou, E.; Tzimas, G.; Sioutas, S. Computing long sequences of consecutive fibonacci integers with tensorflow. In Proceedings of the International Conference on Artificial Intelligence Applications and Innovations, Dubai, United Arab Emirates, 30 November 2019; pp. 150–160. [Google Scholar]
  50. Kingma, D.P.; Ba, J. Adam: A method for stochastic optimization. In Proceedings of the 3rd International Conference on Learning Representations (ICLR), San Diego, CA, USA, 7–9 May 2015. [Google Scholar]
  51. Usha Ruby, A. Binary cross entropy with deep learning technique for Image classification. Int. J. Adv. Trends Comput. Sci. Eng. 2020, 9, 5393–5397. [Google Scholar]
  52. Cui, H.; Chen, S.; Hu, L.; Wang, J.; Cai, H.; Ma, C.; Liu, J.; Zou, B. HY1C/D-CZI Noctiluca scintillans Bloom Recognition Network Based on Hybrid Convolution and Self-Attention. Remote Sens. 2023, 15, 1757. [Google Scholar] [CrossRef]
  53. Kim, J.; Chi, M. SAFFNet: Self-Attention-Based Feature Fusion Network for Remote Sensing Few-Shot Scene Classification. Remote Sens. 2021, 13, 2532. [Google Scholar] [CrossRef]
  54. Shorten, C.; Khoshgoftaar, T.M. A survey on Image Data Augmentation for Deep Learning. J. Big Data 2019, 6, 60. [Google Scholar] [CrossRef]
  55. Wang, Z.; Zhou, Y.; Wang, F.; Wang, S.; Xu, Z. SDGH-Net: Ship Detection in Optical Remote Sensing Images Based on Gaussian Heatmap Regression. Remote Sens. 2021, 13, 499. [Google Scholar] [CrossRef]
  56. Wei, Z.; Zhang, Z. Remote Sensing Image Road Extraction Network Based on MSPFE-Net. Electronics 2023, 12, 1713. [Google Scholar] [CrossRef]
  57. Wang, Z.; Gao, X.; Zhang, Y.; Zhao, G. MSLWENet: A Novel Deep Learning Network for Lake Water Body Extraction of Google Remote Sensing Images. Remote Sens. 2020, 12, 4140. [Google Scholar] [CrossRef]
  58. Xiang, K.; Yuan, W.; Wang, L.; Deng, Y. An LSWI-Based Method for Mapping Irrigated Areas in China Using Moderate-Resolution Satellite Data. Remote Sens. 2020, 12, 4181. [Google Scholar] [CrossRef]
  59. Jenčo, M.; Fulajtár, E.; Bobáľová, H.; Matečný, I.; Saksa, M.; Kožuch, M.; Gallay, M.; Kaňuk, J.; Píš, V.; Oršulová, V. Mapping Soil Degradation on Arable Land with Aerial Photography and Erosion Models, Case Study from Danube Lowland, Slovakia. Remote Sens. 2020, 12, 4047. [Google Scholar] [CrossRef]
  60. Li, M.; Stein, A. Mapping Land Use from High Resolution Satellite Images by Exploiting the Spatial Arrangement of Land Cover Objects. Remote Sens. 2020, 12, 4158. [Google Scholar] [CrossRef]
  61. Chehreh, B.; Moutinho, A.; Viegas, C. Latest Trends on Tree Classification and Segmentation Using UAV Data—A Review of Agroforestry Applications. Remote Sens. 2023, 15, 2263. [Google Scholar] [CrossRef]
Figure 1. Sanjiangyuan National Nature Reserve (89°45′–102°23′E, 31°39′–36°12′N) in Qinghai Province, China. Two black diamond marks A and B represent the location of the dataset: mark A in the middle of Sanjiangyuan is located in Yushu County, Qinghai Province; mark B in the eastern part of Sanjiangyuan is located in Guoluo County, Qinghai Province.
Remotesensing 15 02412 g001
Figure 2. The visualization of some remote sensing image samples and their ground truth label data. In each pair of images, the remote sensing image is on the left, and the corresponding ground truth label is on the right.
Remotesensing 15 02412 g002
Figure 3. The main architecture of the proposed network. The upper part is the encoder, and the lower part is the decoder. The rectangles labelled with h × w × c (where h, w, and c indicate the image height, image width, and the feature channel number, respectively) are the feature map, and two adjacent rectangles represent the concatenation operation at the feature channel dimension. The symbol “+” indicates the summation of two features by an add operation, and the red and green arrows indicate a max pooling and up sampling layer of size 2 × 2, respectively. In addition, “Conv_block” represents the proposed convolution block; “FAE” represents the proposed feature amplification extraction module; “MFF” represents the proposed multi-scale feature fusion module; “1 × 1 Conv” represents a convolution layer with a kernel size of 1 × 1.
Remotesensing 15 02412 g003
Figure 4. The structure of the convolution block. “1 × 1 Conv” represents a convolution layer with a kernel size of 1 × 1; “3 × 3 Conv” represents a convolution layer with a kernel size of 3 × 3; “BN” represents the Batch Normalization.
Remotesensing 15 02412 g004
Figure 5. The structure of the multi-scale feature fusion module. Five adjacent rectangles represent the concatenation operation at the feature channel dimension. “1 × 1 Conv” represents a convolution layer with a kernel size of 1 × 1; “3 × 3 Conv” with “rate” represents a convolution layer with a kernel size of 3 × 3 with dilation rates 1, 2, and 4, respectively.
Remotesensing 15 02412 g005
Figure 6. The structure of the feature amplification extraction module. The rectangles labelled with H × W × C are the feature maps of different sizes, and three adjacent rectangles indicate the concatenation operation at the feature channel dimension. “Conv_block” represents the proposed convolution block; “1 × 1 Conv” represents a convolution layer with a kernel size of 1 × 1; “3 × 3 Conv” represents a convolution layer with a kernel size of 3 × 3; “2 × 2 UpSampling” and “4 × 4 UpSampling” represent up sampling layer of size 2 × 2 and 4 × 4, respectively; “2 × 2 Maxpooling” and “4 × 4 Maxpooling” represent max pooling layer of size 2 × 2 and 4 × 4, respectively.
Remotesensing 15 02412 g006
Figure 7. The visualization effect of remote sensing image and augmentation image with their ground truth labels. (a) original forest remote sensing image; (b) ground truth label of the original forest remote sensing image; (c) remote sensing image after data augmentation; (d) ground truth label of the remote sensing image after data augmentation.
Remotesensing 15 02412 g007
Figure 8. The training curve of the proposed forest remote sensing image segmentation network model. The first curve represents the variation in the accuracy of training model and the second curve represents the variation in the loss of training model.
Remotesensing 15 02412 g008
Figure 9. The visualization of the comparison of the forest segmentation results of different algorithms. Rows from the top to bottom represent the original images, the corresponding ground truth labels, segmentation results of FCN-8s, DeepLabV3+, PSPNet, DANet, SegNet, U-Net, MultiResUnet, Attention U-Net, proposed network trained by 800 samples, and proposed network trained by 1600 samples (expanded by proposed data augmentation), respectively. The subfigures (af) are representative of the segmentation results of six different areas. The results shown in the red square demonstrated the effectiveness of the proposed method.
Remotesensing 15 02412 g009
Figure 10. The visualization effect of remote sensing image and flipped image with their ground truth labels. (a) original forest remote sensing image; (b) ground truth label of the original forest remote sensing image; (c) remote sensing image after flipping; (d) ground truth label of the remote sensing image after flipping.
Remotesensing 15 02412 g010
Table 1. Detailed information of the ZY-3 satellite data.
Parameter TypeDetails
temporal resolution5 days
spatial resolution2 m
spectral range0.45–0.89 μm
orbital altitude505.984 km
Table 2. Detailed information for the large-scale plateau forest dataset in Sanjiangyuan.
Parameter TypeDetails
data sourcesZY-3 satellite imagery
number of samples38,708
number of manual ground truth labels1187
sample size128 × 128 pixels
number of spectral bands4
manual ground truth size128 × 128 pixels
resolution for each pixel2 m
time period of the dataJanuary 2017–December 2017
period of the manual ground truthMay 2017–June 2017
Table 3. The results of comparing the segmentation performance of different networks trained with 800 and 1600 samples respectively.
Train Samples8001600
Evaluation MetricsPRF1IoUPRF1IoU
FCN-8s [20]93.0589.9291.0684.5893.6392.3992.7787.05
DeepLab V3+ [24]88.2687.6786.9278.2891.7990.4290.5383.60
PSPNet [22]92.7493.7392.9887.4492.5195.0593.4888.29
DANet [25]92.8793.9393.0487.6592.1494.8493.1887.90
SegNet [23]92.3893.7492.7687.1192.5194.1793.0987.61
U-Net [21]93.3193.8493.3087.9592.6094.8693.4188.20
MultiResUNet [45]92.4594.0993.0087.5792.5894.4793.3588.11
Attention U-Net [44]94.0993.9893.7288.7493.8294.7094.0089.14
Proposed94.3794.8094.3689.7194.5995.1294.6290.19
Note: P: Precision, R: Recall, F1: F1 score, IoU: Intersection over Union, Proposed: proposed network.
Table 4. The results of comparing the segmentation performance of different networks trained with 1600 samples.
Evaluation MetricsPRF1IoU
FCN-8s [20]92.2992.3292.0185.82
DeepLab V3+ [24]88.3292.3089.1681.78
PSPNet [22]92.7594.0793.1587.70
DANet [25]92.5394.3493.1387.76
SegNet [23]93.1692.9792.8187.18
U-Net [21]93.6993.4393.2987.99
MultiResUNet [45]93.7093.1593.1087.65
Attention U-Net [44]93.3194.9393.7788.83
Proposed94.0895.1694.4089.79
Note: P: Precision, R: Recall, F1: F1 score, IoU: Intersection over Union, Proposed: proposed network.
Disclaimer/Publisher’s Note: The statements, opinions and data contained in all publications are solely those of the individual author(s) and contributor(s) and not of MDPI and/or the editor(s). MDPI and/or the editor(s) disclaim responsibility for any injury to people or property resulting from any ideas, methods, instructions or products referred to in the content.

