Article

Compensated Attention Feature Fusion and Hierarchical Multiplication Decoder Network for RGB-D Salient Object Detection

School of Microelectronics and Communication Engineering, Chongqing University, Chongqing 400044, China
*
Author to whom correspondence should be addressed.
Remote Sens. 2023, 15(9), 2393; https://doi.org/10.3390/rs15092393
Submission received: 15 April 2023 / Revised: 30 April 2023 / Accepted: 1 May 2023 / Published: 3 May 2023

Abstract

:
Multi-modal feature fusion and effectively exploiting high-level semantic information are critical in salient object detection (SOD). However, the depth maps complementing RGB image fusion strategies cannot supply effective semantic information when the object is not salient in the depth maps. Furthermore, most existing (UNet-based) methods cannot fully exploit high-level abstract features to guide low-level features in a coarse-to-fine fashion. In this paper, we propose a compensated attention feature fusion and hierarchical multiplication decoder network (CAF-HMNet) for RGB-D SOD. Specifically, we first propose a compensated attention feature fusion module to fuse multi-modal features based on the complementarity between depth and RGB features. Then, we propose a hierarchical multiplication decoder to refine the multi-level features from top down. Additionally, a contour-aware module is applied to enhance object contour. Experimental results show that our model achieves satisfactory performance on five challenging SOD datasets, including NJU2K, NLPR, STERE, DES, and SIP, which verifies the effectiveness of the proposed CAF-HMNet.

1. Introduction

Salient object detection refers to detecting and segmenting most visually distinctive regions or objects from general scenes [1]. As a fundamental pre-processing technique, SOD is significant for many visual media processing tasks, such as object detection [2], image retrieval [3], visual tracking [4], remote sensing image segmentation [5,6], and semantic segmentation [7].
Previous traditional SOD methods mostly segment salient objects based on hand-crafted features [8,9]. Recently, Convolutional Neural Network (CNN)-based methods [10,11] have exhibited significant advancements in salient object detection (SOD) owing to their powerful feature representation capabilities, as well as the utilization of transfer learning in segmentation tasks such as medical imaging segmentation of unsupervised domain adaptation [12,13,14,15]. In the SOD field, visible and depth images provide different sights of the same scene. They are expected to be complementary when used for SOD. Visible images aim to supply objects’ appearance and color information, while depth maps are responsive to their spatial information. The complementary characteristics of visible and depth images are very helpful in different light conditions, such as dim light, nighttime, and so on [16]. Hence, it is necessary to explore how to fuse multi-modal features effectively.
However, it is a hot potato to effectively blend depth and RGB features when the object region is not salient in the depth maps. As shown in Figure 1, it is hard to find out the object region from depth maps, since the object and the background are located on the same depth level. It may lead to error-prone fusion and bring some negative influences when the depth maps lack clear object semantic information. Existing approaches mainly focus on three kinds of fusion strategies to effectively fuse RGB and depth images: early fusion, middle fusion, and late fusion. Some methods [17,18,19] view depth maps as the fourth channel of RGB and encode them together (early fusion). This strategy seems simple but ignores modality-specific characteristics of the RGB and depth images. Thus, it cannot effectively dig out the multi-modal information and cannot achieve comparable results. Moreover, to effectively learn the salient feature from the RGB and depth modalities, some methods [8,20,21] first apply a two-stream backbone network to predict saliency results. Then, the yielding results are fused as the final prediction (late fusion). Given that the depth and RGB information may positively influence each other, other algorithms [22,23,24] fuse depth and RGB features (middle fusion). Currently, the feature fusion strategy (middle fusion) is widely adopted since it can take more comprehensively the characteristics of multi-modal features into account.
Depth maps can provide complementary information for SOD. However, depth maps with poor quality may bring some negative influences by randomly distributed erroneous or missing regions on the depth maps [25,26]. Consequently, it is critical to explore the efficient multi-modal feature fusion strategy. Researchers have proposed many kinds of solutions to tackle the purifying issues of poor-quality depth maps. For example, D3Net [25] adopts a gate mechanism to eliminate poor-quality depth maps. SSF [26] discriminatively selects helpful cues from RGB and depth data by designing a complementary interaction module that takes account of global location and local detail complementarities from two modalities. EF-Net [27] adopts a color hint map to enhance the depth maps. HDFNet [28] applies densely connected structures to collect different modal features. DQSD [29] embeds a depth quality-aware module into a two-stream framework, assigning the weight of depth features before performing the fusion. JL-DCF [18] proposed a joint learning strategy to learn the robust RGB and depth features simultaneously. BTS-Net [30] devised a bi-direction transfer-and-selection block for cross-modal reference and fusion. HAINet [31] proposed an alternate interaction module to filter out distractors in depth features and then applied the resulting purified depth features to enhance the corresponding RGB features. BBSNet [32] proposed a depth enhanced block to mine the depth cues and boost the compatibility of cross-modal feature fusion. However, the methods mentioned above ignore many depth maps without sufficient salient object information.
From our careful inspection, we found that, with depth maps complementing RGB image fusion strategies such as BBSNet [32], it is hard to acquire helpful depth channel attention to enhance depth features when there is little clear object information in them. These strategies may fail to excavate the depth semantic information in such a condition, as they only apply depth channel attention to enhance the depth features.
As a result, we propose a RGB Compensated Depth Attention (RCDA) module, which combines RGB channel attention and depth channel attention, to fully excavate depth semantic information. Concretely, the depth channel attention may not effectively reflect the importance of each layer of depth features when the salient object is not obvious in the depth map. In this case, we employ RGB channel attention to compensate depth channel attention, as RGB feature maps contain rich semantic information. Thus, our RCDA module can exploit the complementarity between depth and RGB features to excavate the depth information when the objects is not salient in the depth map. Compared with the depth enhanced module proposed in BBSNet [32], the major highlight of our RCDA module is that it takes into account negative impacts caused by poor-quality depth maps lacking salient object information. In the depth maps complementing RGB image fusion strategies, we endeavor to excavate helpful depth semantic information to fuse multi-modal features.
Moreover, multi-level feature aggregation is one of the most important parts in U-shape structure. It can restore the semantic features back to the input size by deconvolution or up-sampling operation. Generally, the multi-level features are categorized into two kinds: low-level and high-level semantic features. The high-level semantic features carry rich long-range contextual information and the low-level features include more fine-grained information. Therefore, it is essential to design an effective decoder to boost the performance of SOD.
To this end, DSS [33] proposes a top-down method to integrate multi-level features, achieving significantly improved SOD performance. Chen et al. [34] progressively cascade the blended features and add level-wise dense supervision from deep to shallow for decoding. TANet [35] proposes a cross-modal distillation stream by introducing an attention-aware cross-modal fusion structure in the decoder. SSRCNN [19] applies a depth recurrent CNN to features at each stage for rendering salient objects and deep supervision is applied in the decoding strategy. DMRA [36] introduces a recurrent attention strategy that can model the internal semantic relation of the blended features and can progressively refine local details with memory-oriented scene understanding, to generate saliency results. TriTransNet [37] designs a three-stream decoding structure to process the semantic features that are generated from three transformer-based encoders with shared weights. ICNet [38] proposes an information conversion module in the decoder stream to interactively collect high-level depth and RGB features. BASNet [39] designs a multi-scale residual refinement module to optimize the initial saliency maps via learning the residuals between outputted saliency maps and ground truth. CIRNet [40] proposes a convergence collection architecture which flows the depth and RGB features into the corresponding RGB-D decoding branches through a gated fusion mechanism. To obtain salient objects with clear boundaries, MobileSal [41] proposes a compact pyramid refinement module to aggregate multi-level features.
Nevertheless, the high-level semantic information tends to be weakened progressively while aggregating multi-level features from top down [42]. It is significant to exploit abstract high-level semantic features to guide low-level features effectively [42,43,44]. Most existing multi-level feature aggregate strategies cannot fully exploit high-level semantic features to guide low-level detailed features. Specifically, most multi-level feature aggregation strategies cannot effectively suppress background distractors and highlight object regions. As shown in Figure 2, we can observe that the ‘Level-3’ features focus more on object regions (as shown in the yellow circle). However, the background distractors cannot be effectively suppressed (as shown in the red rectangle), and the object region is blurred in ‘Level-2’ and ‘Level-1’ features (as shown in the blue circle). Therefore, it is essential to explore an effective multi-level feature aggregate strategy.
To address the issues mentioned above, we propose a Hierarchical Multiplication Decoder (HMD) that can better exploit high-level semantic information to guide low-level features. The proposed HMD can progressively aggregate high-level semantic information to refine the low-level features by hierarchical multiplication strategy from top down. Our hierarchical multiplication mechanism can effectively suppress background distractors and enhance salient object regions.
In addition, a contour-aware module (CAM) is applied to tackle the dilemma of coarse object boundaries. We design the CAM as an independent sub-task rather than a part of the HMD, to improve the scalability of our model. Experiments on five challenging RGB-D SOD datasets with four metrics demonstrated that CAF-HMNet achieves satisfactory results.
In general, our main contributions can be summarized as follows:
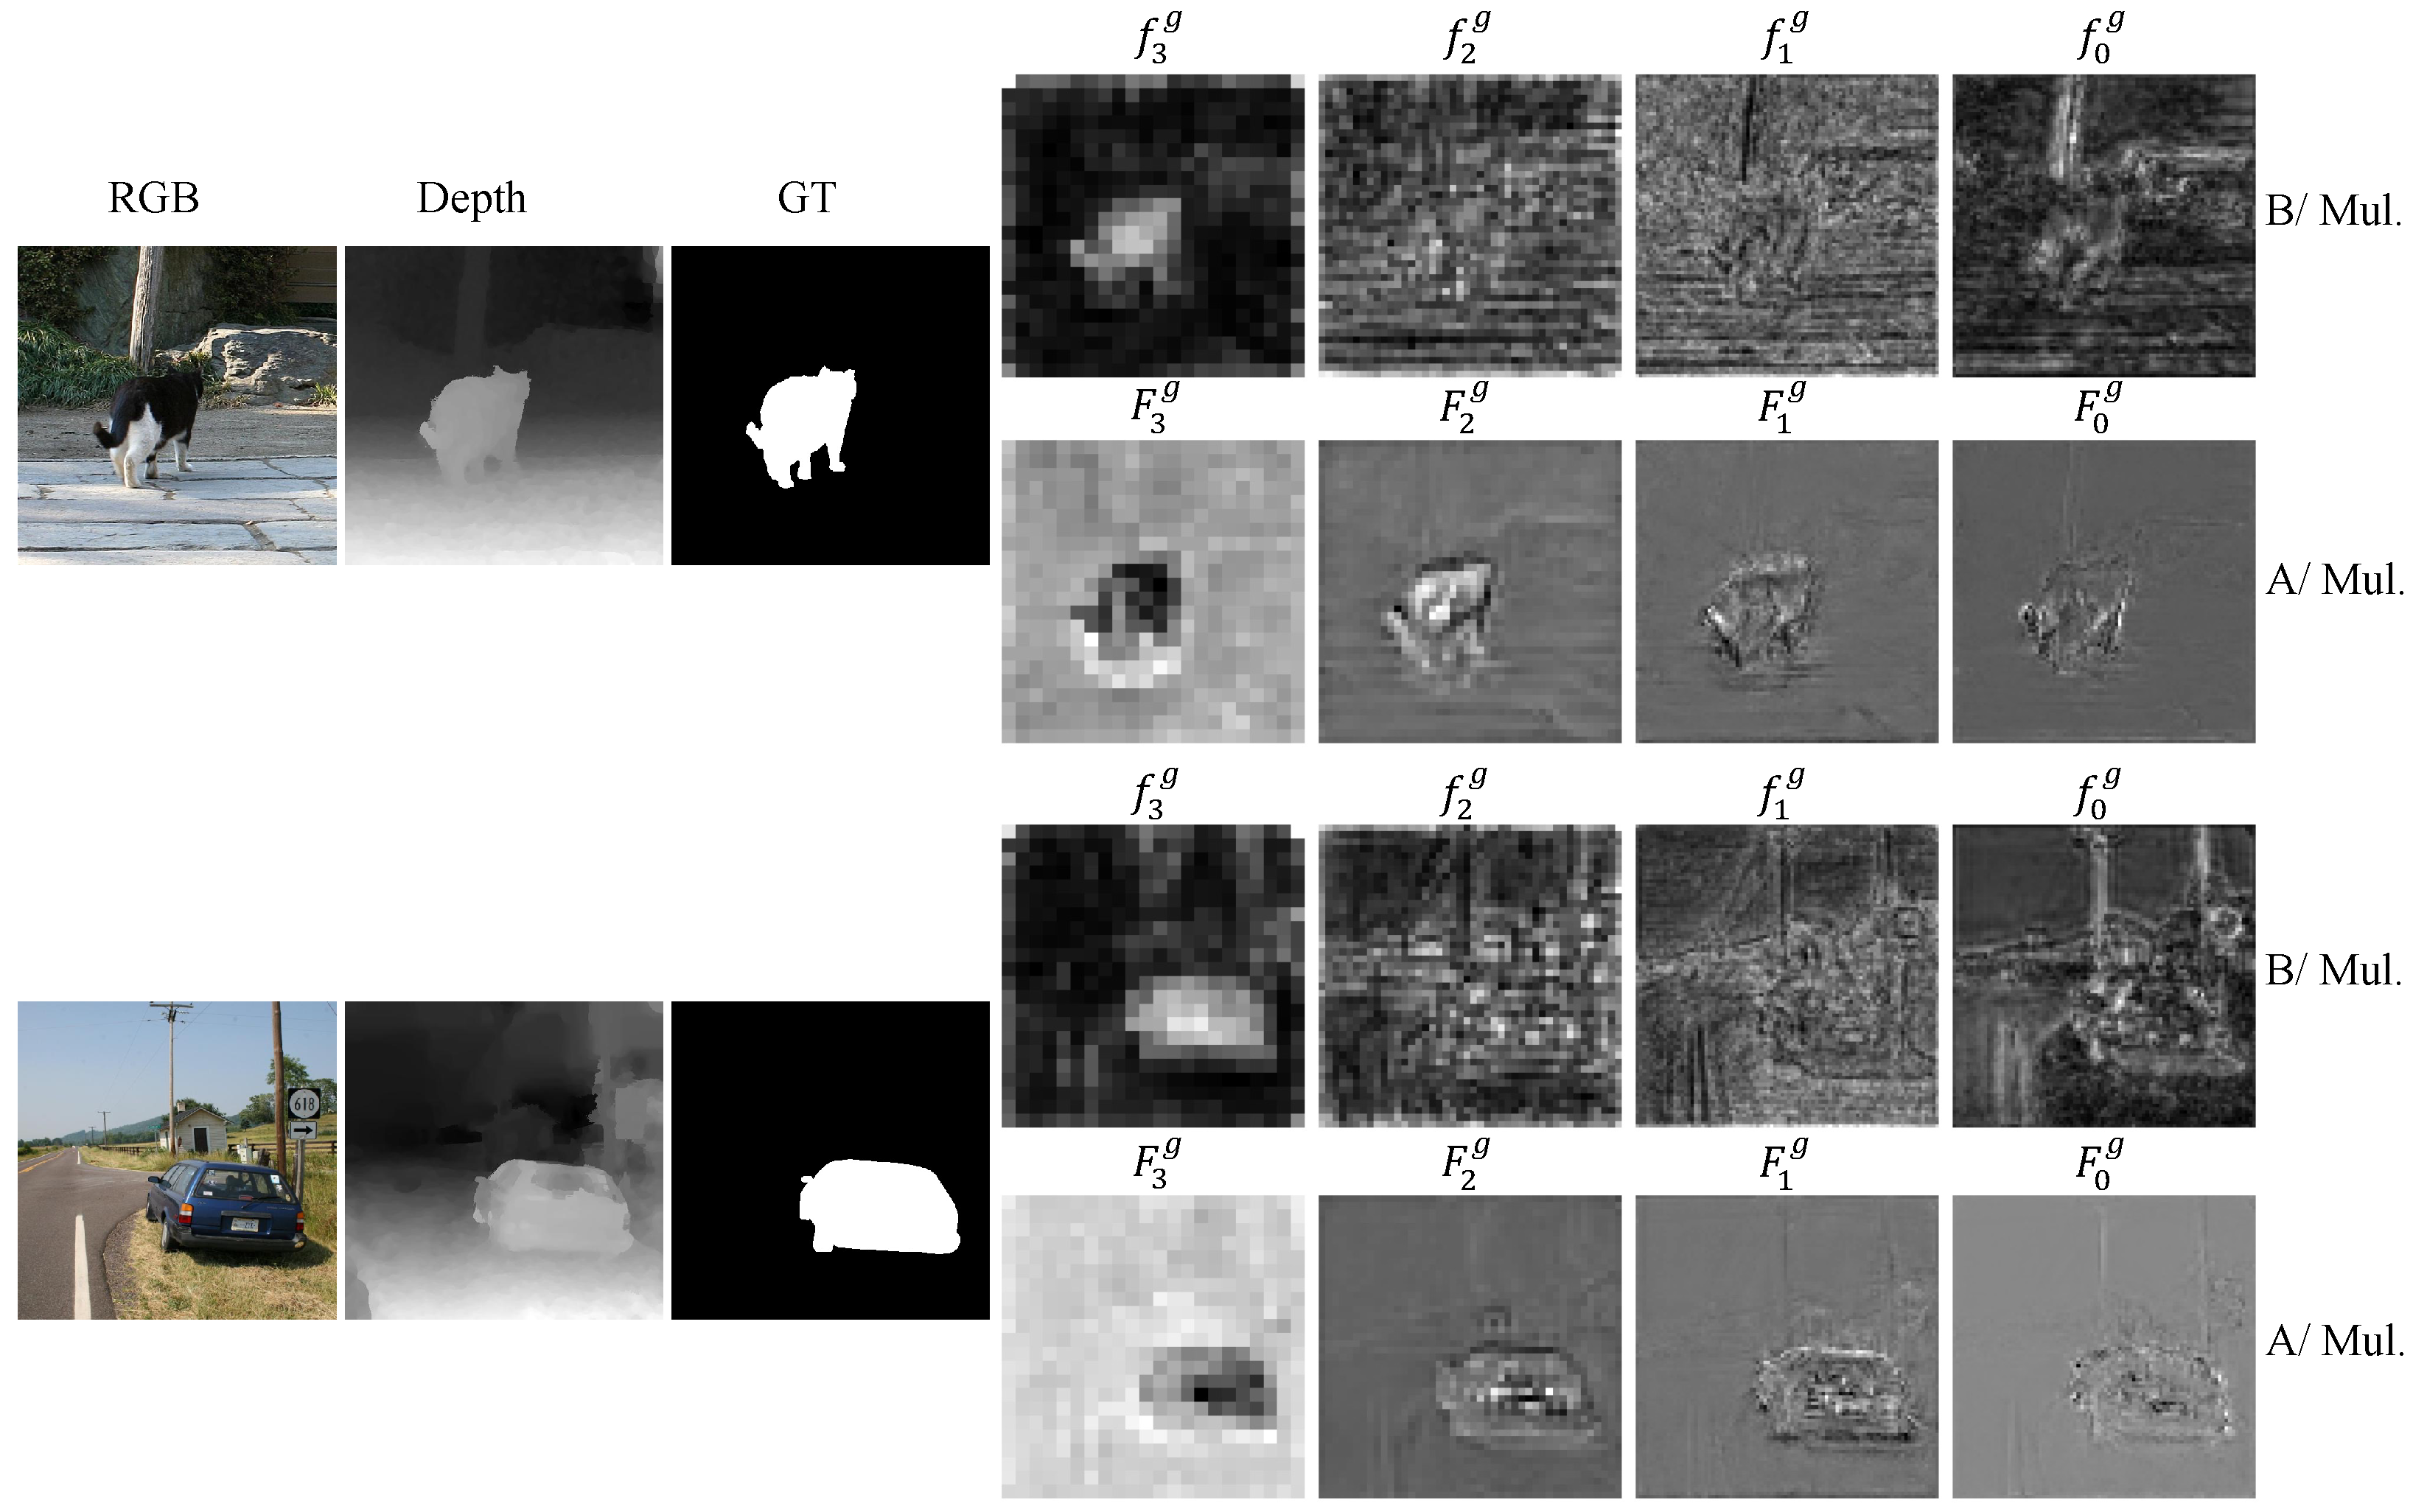
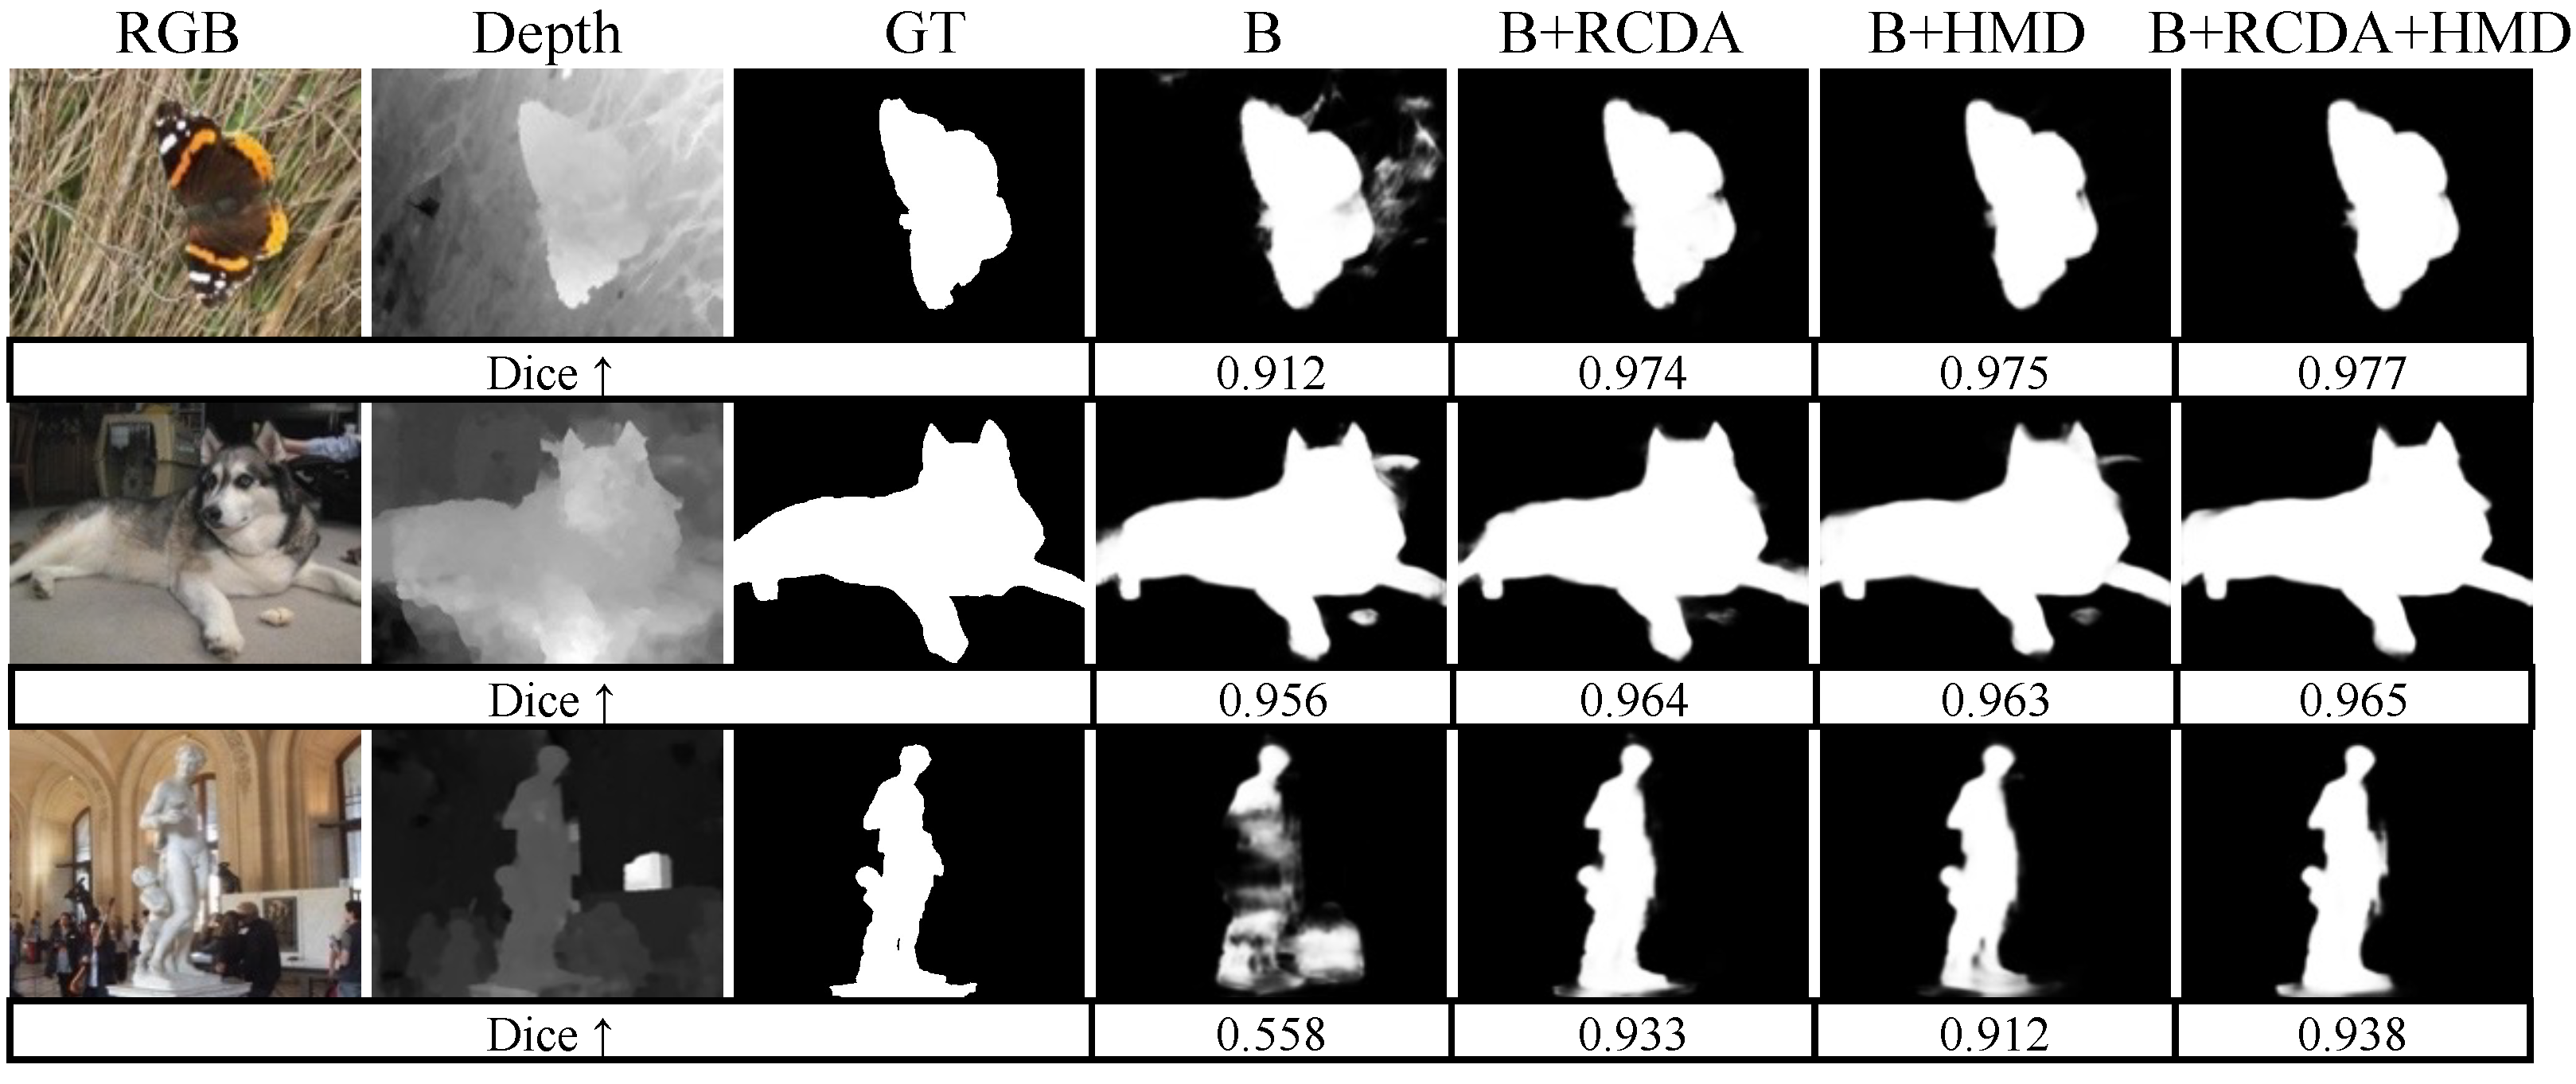
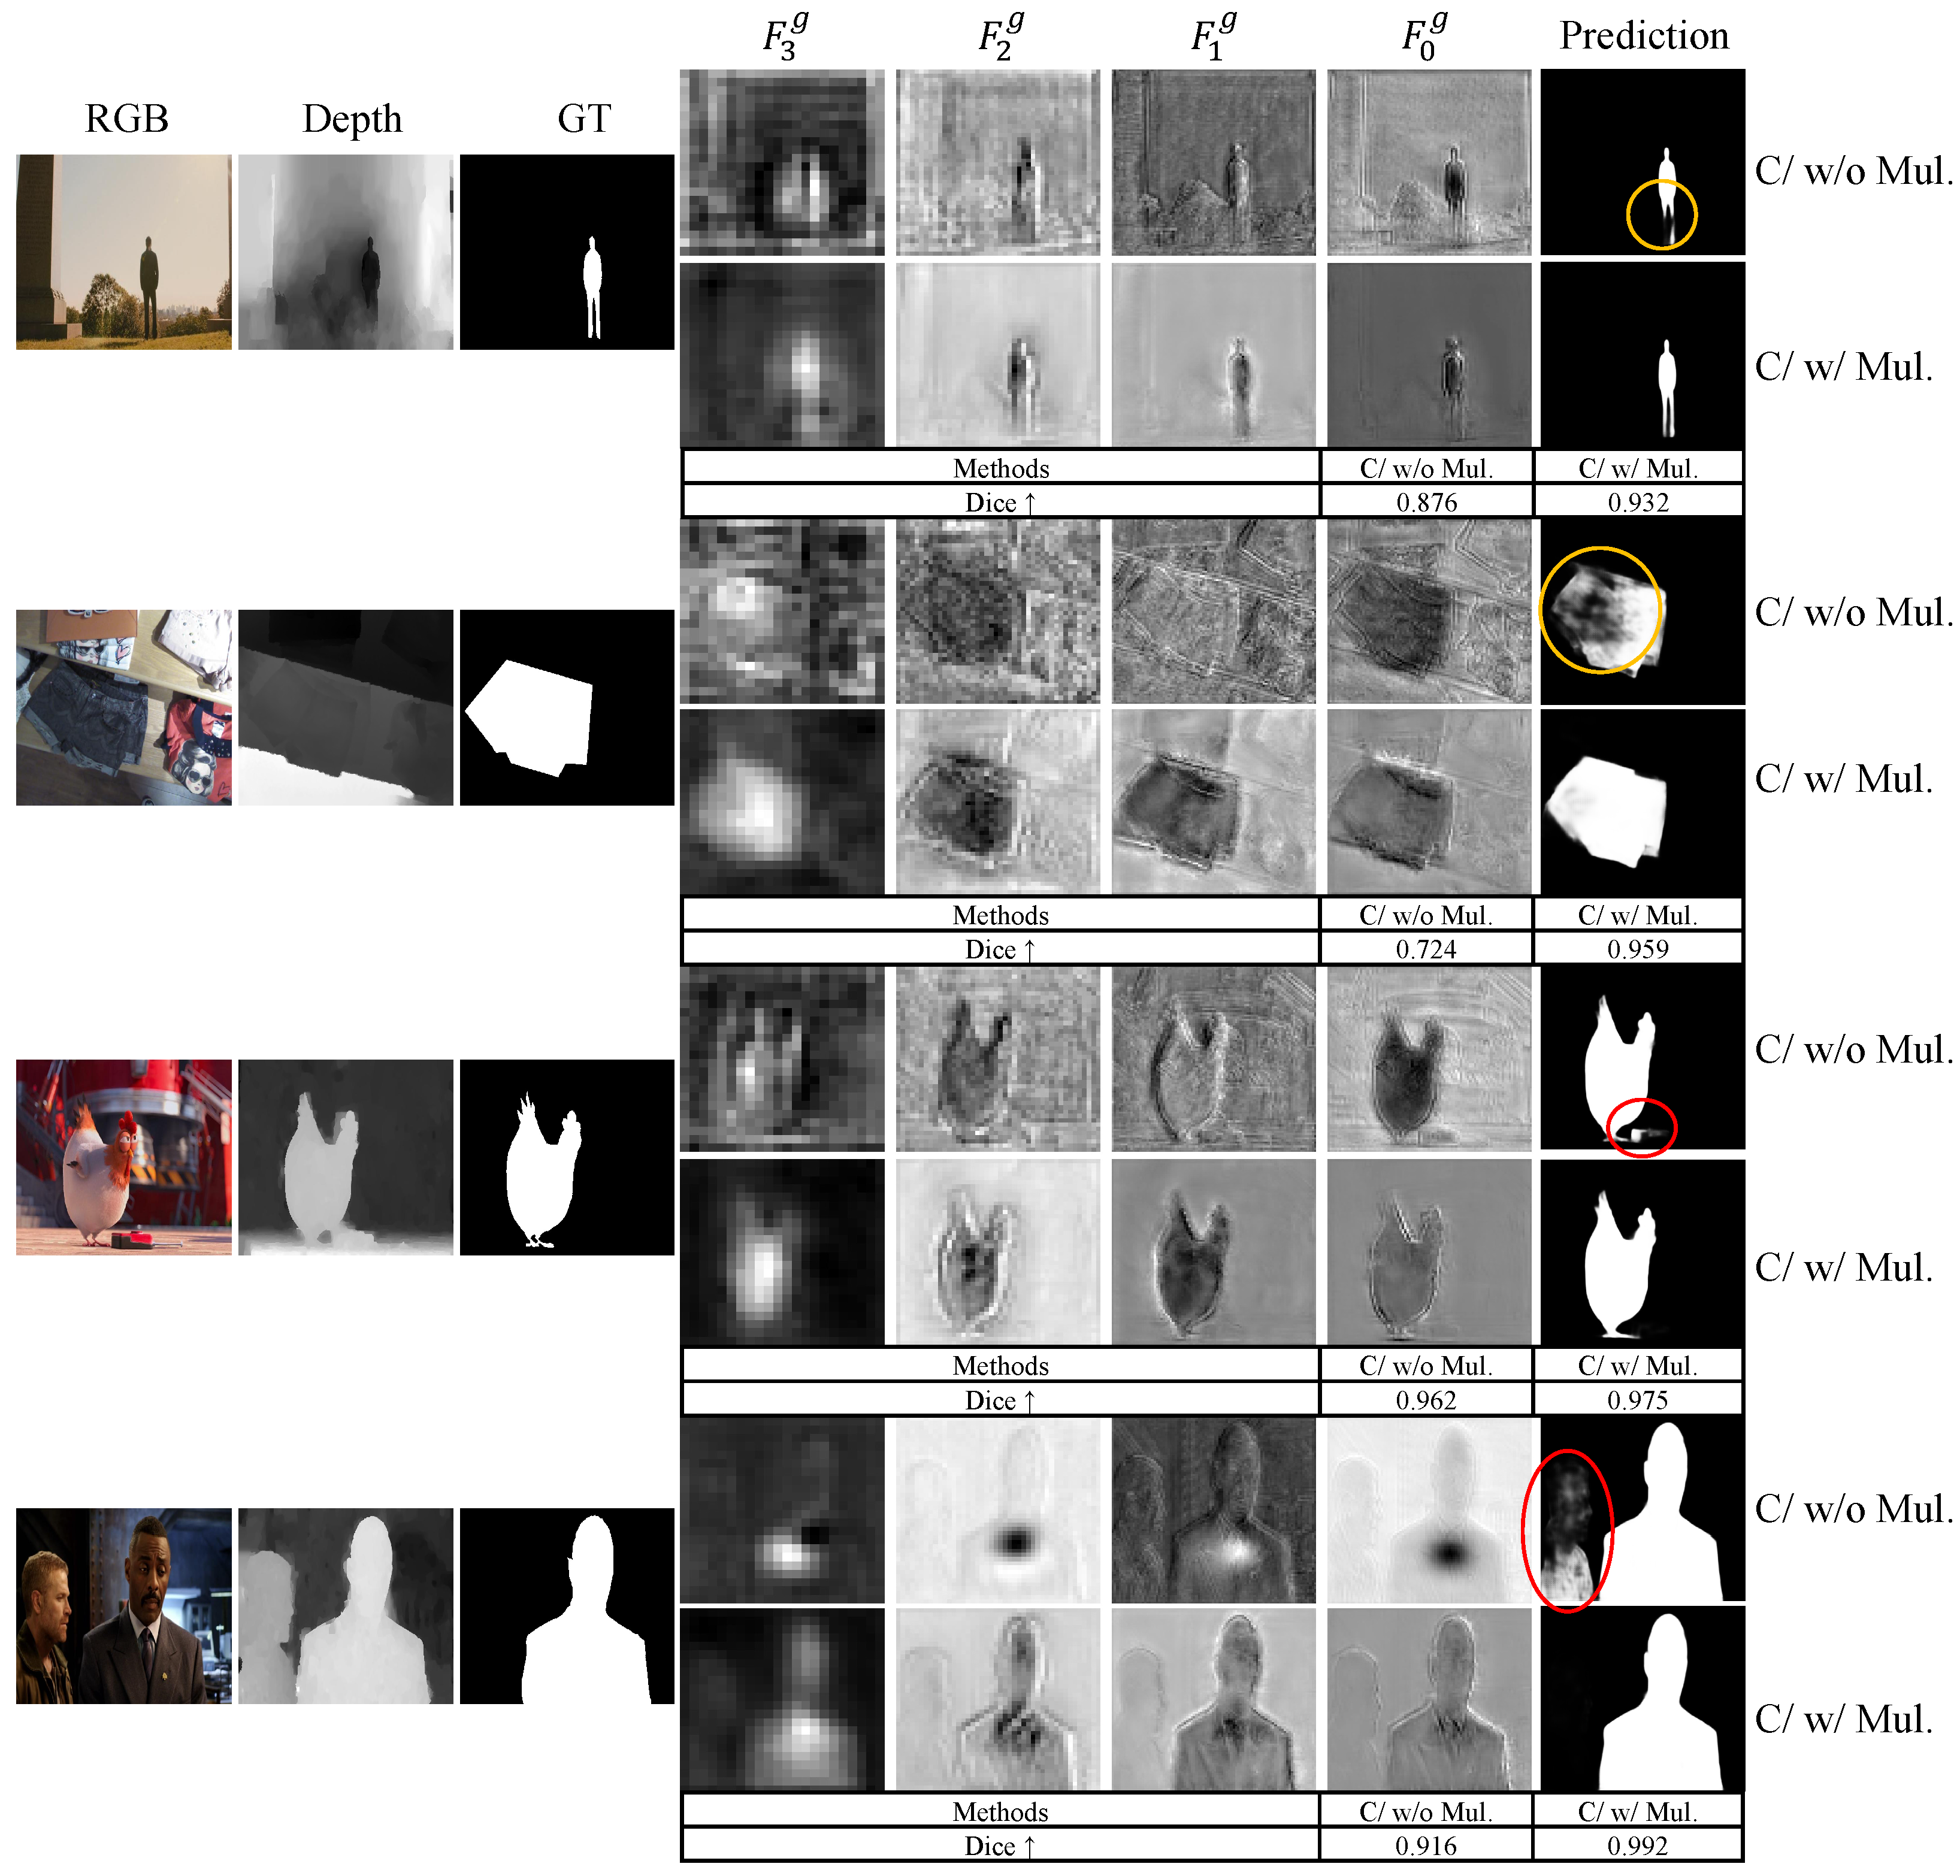
  • We propose a hierarchical multiplication decoder to effectively suppress background distractors and enhance the salient object regions, based only on a simple multiplication operation in a hierarchical manner.
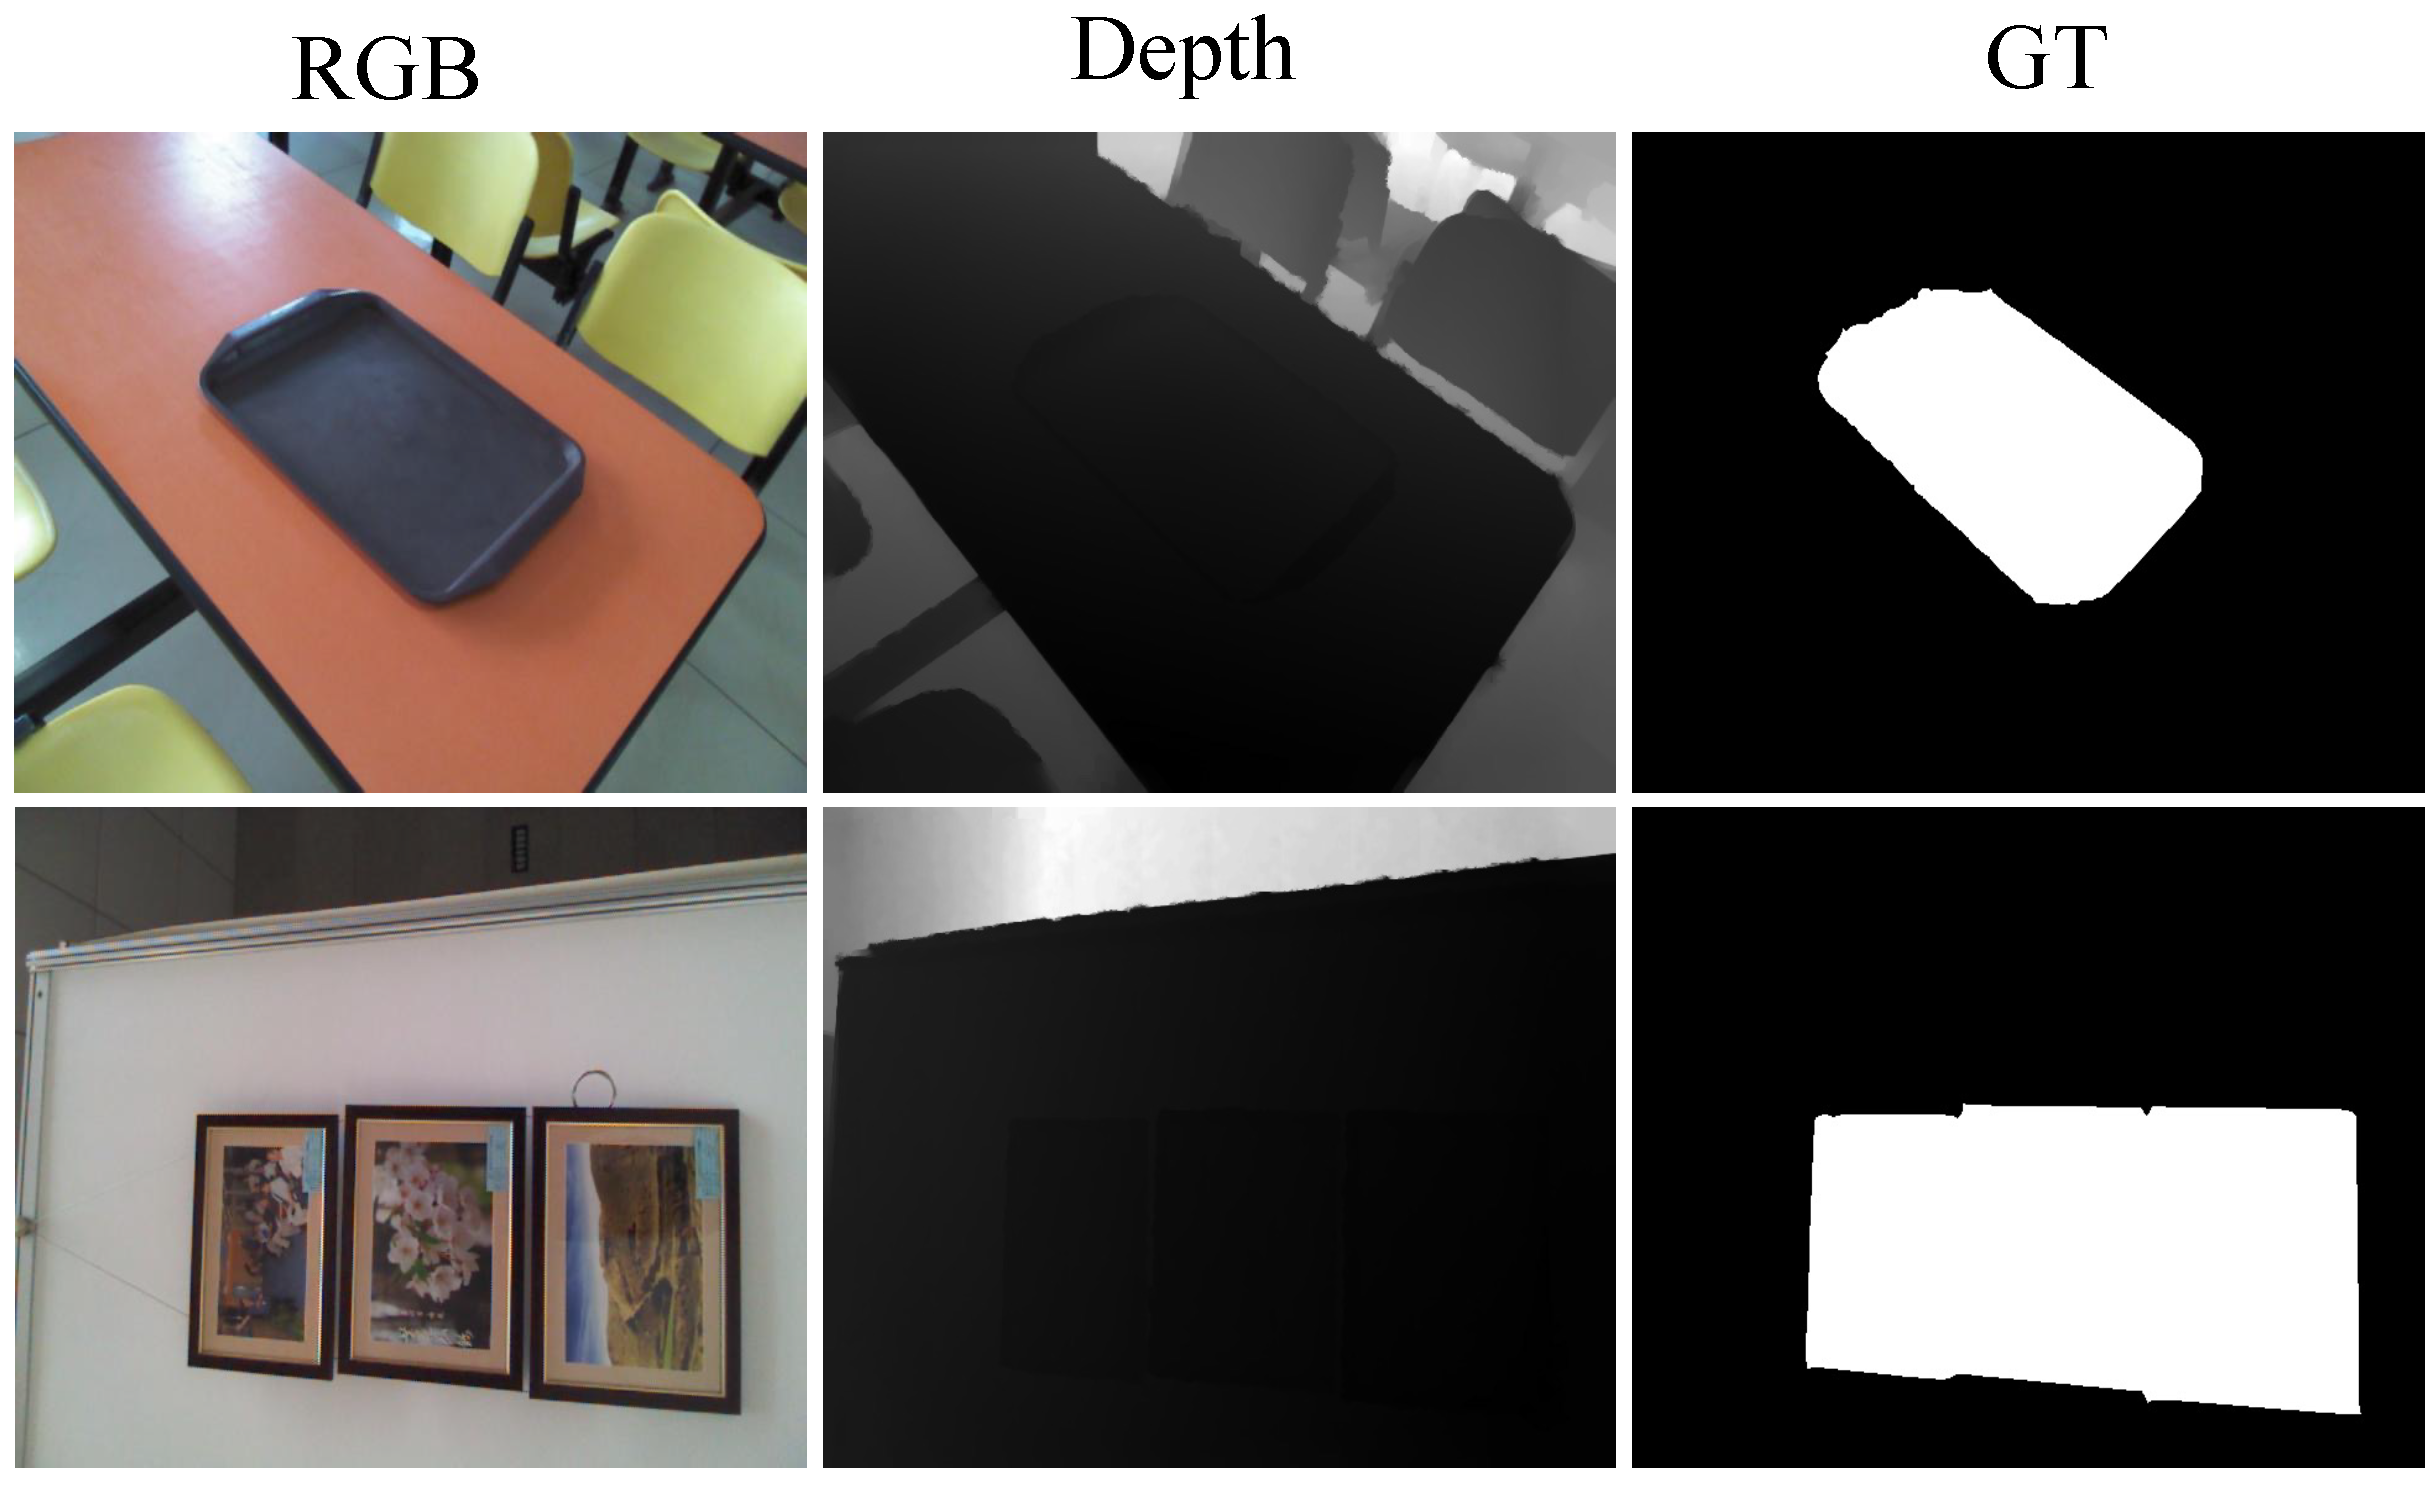
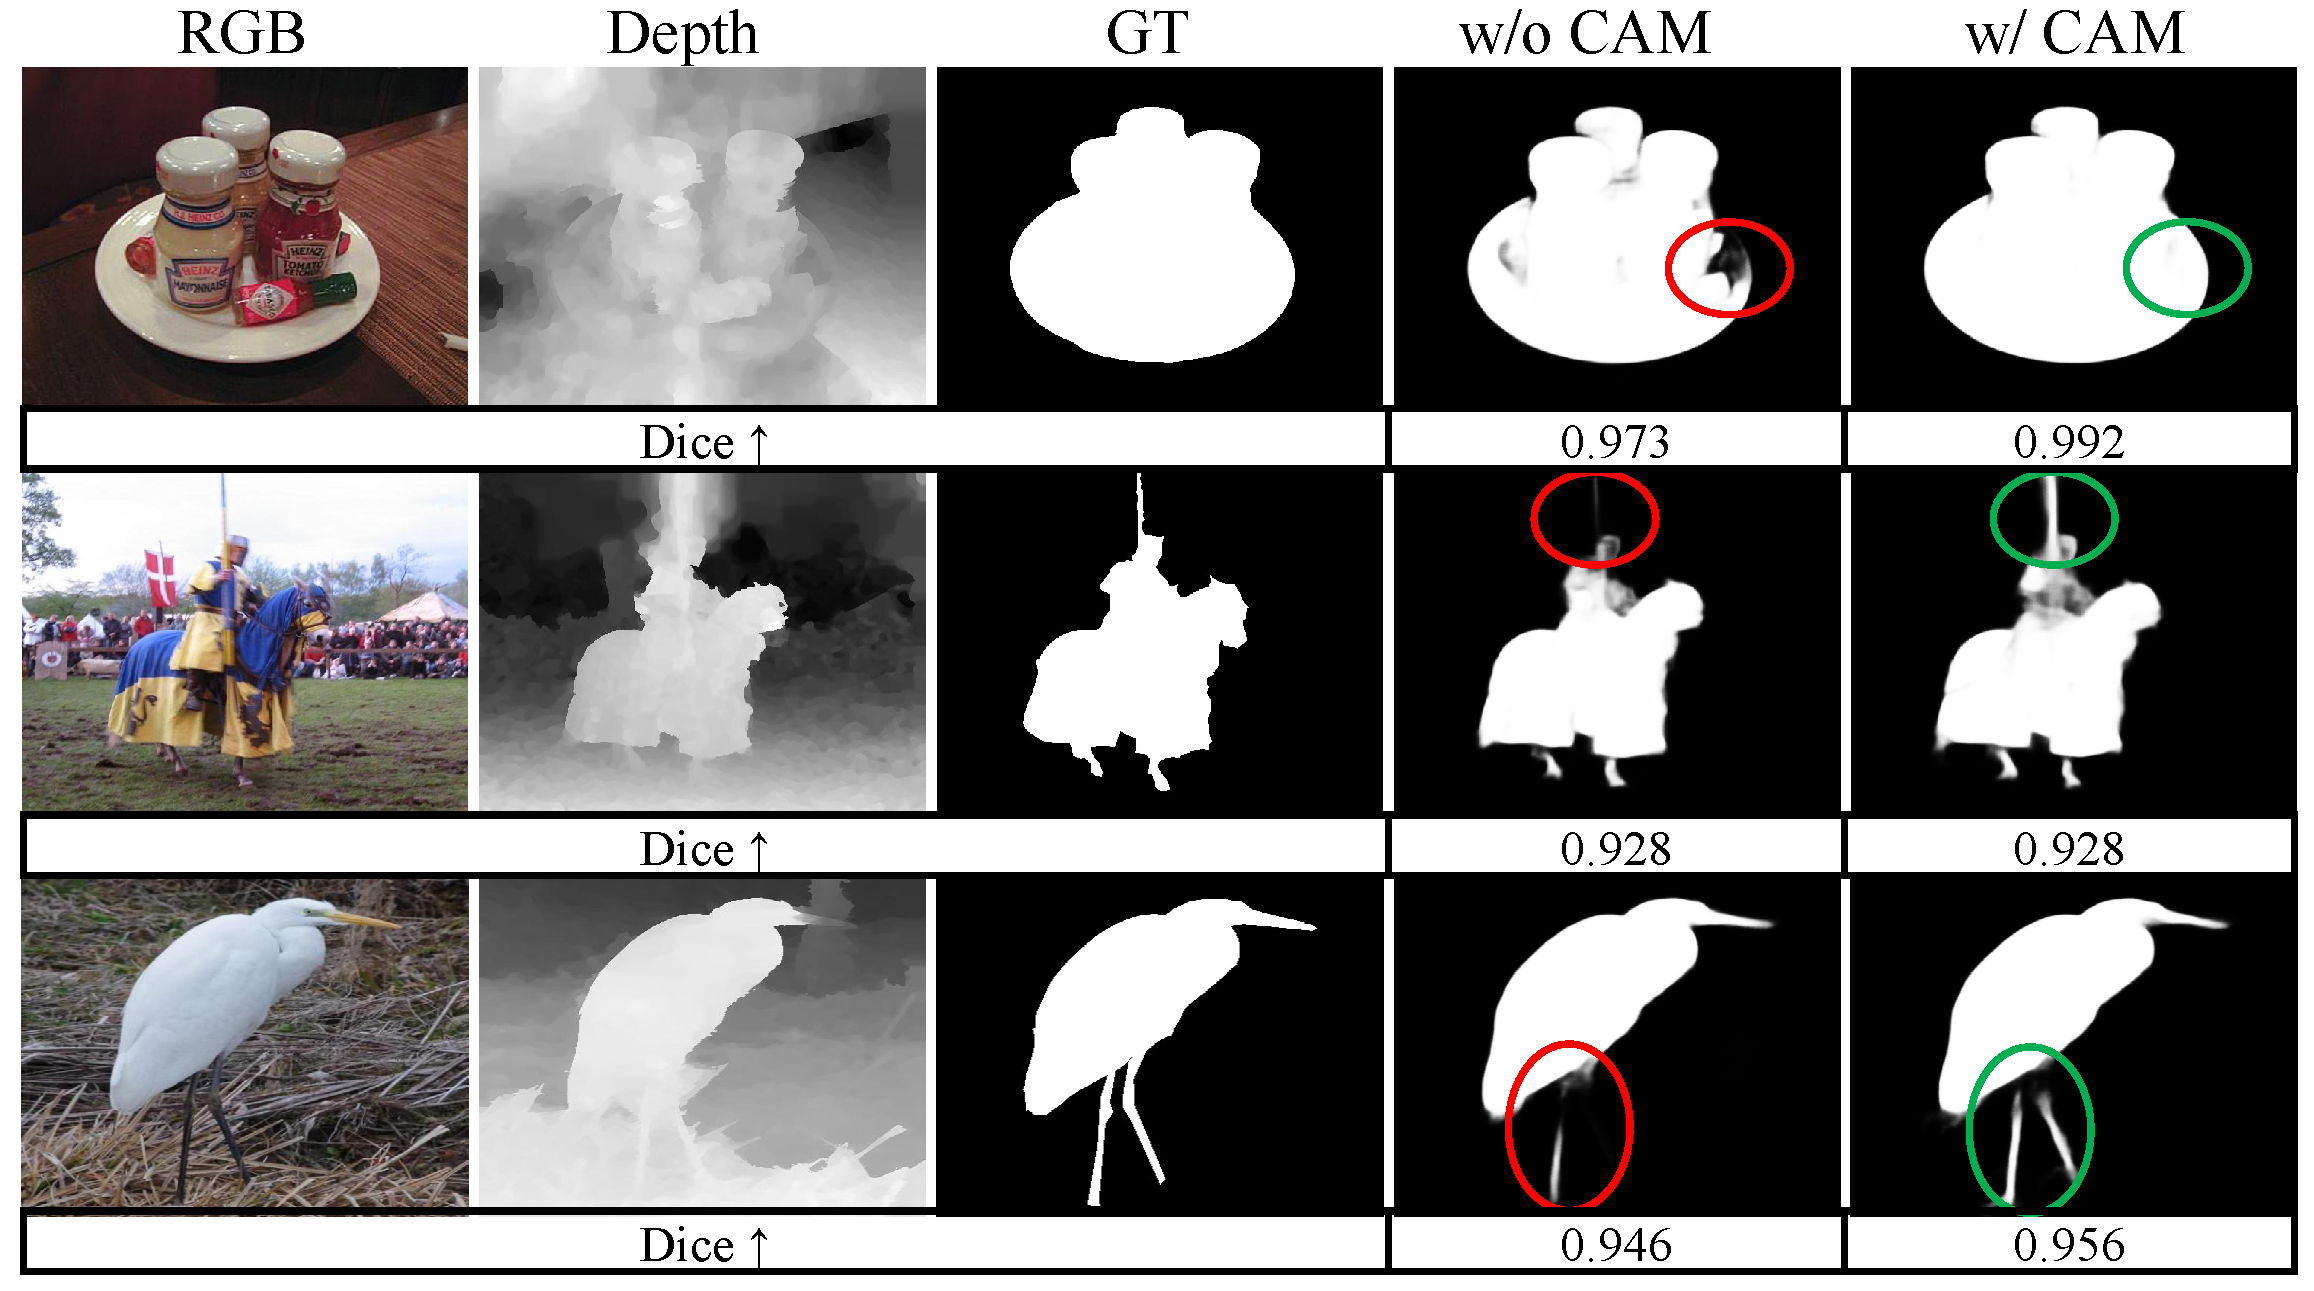
  • To fully capture the depth cues when the object information is not salient in depth maps, we introduce an RGB Compensated Depth Attention module, which additionally introduces RGB to enhance the depth channel attention to highlight objects.
  • Due to the advantages of the proposed CAF-HMNet, it pushes the performance of RGB-D SOD to a new level, achieving satisfactory performance on five public datasets.

2. Materials and Methods
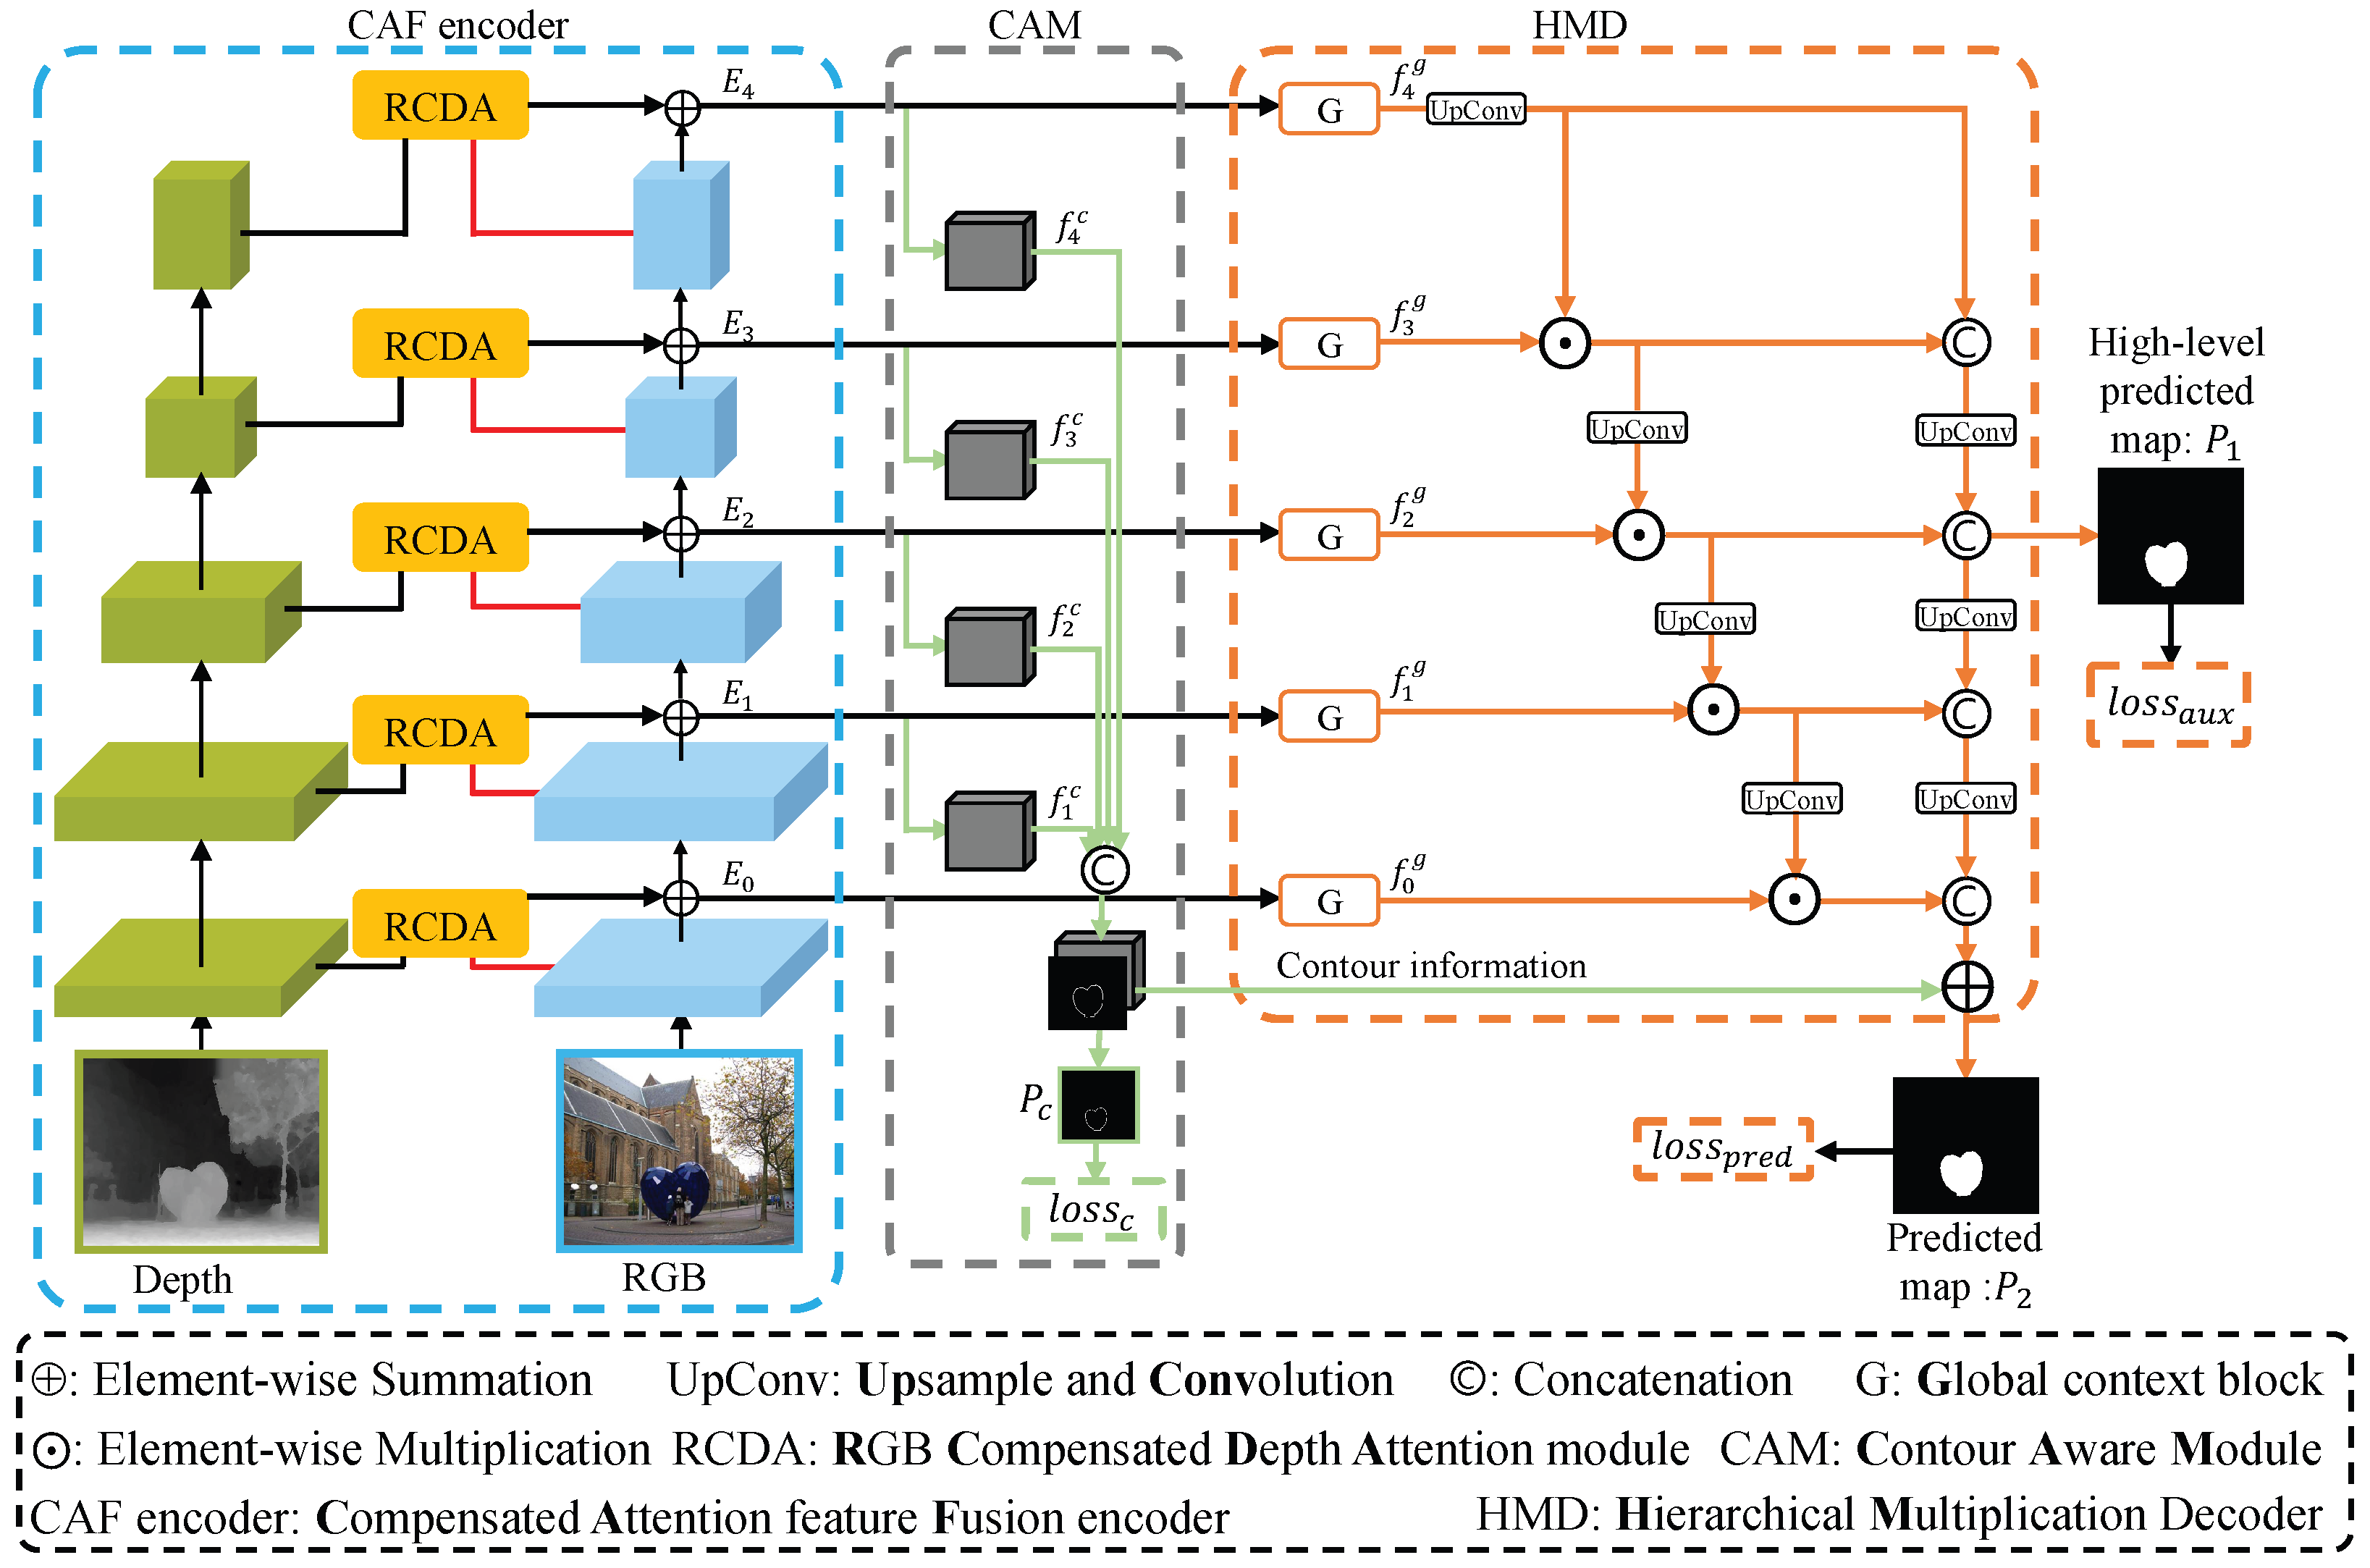
2.1. Overview

The overall framework of the proposed CAF-HMNet is shown in Figure 3. It consists of three modules: a compensated attention feature fusion encoder (CAF encoder), a hierarchical multiplication decoder (HMD), and a contour-aware module (CAM). We adopt ResNet-50 [45] as the backbone. For convenience, RGB, depth, and fused features can be denoted as { x 0 r g b , x 1 r g b , x 2 r g b , x 3 r g b , x 4 r g b }, { x 0 d , x 1 d , x 2 d , x 3 d , x 4 d }, and { E 0 , E 1 , E 2 , E 3 , E 4 }, respectively.
We firstly introduce the RCDA module to enhance the depth features for the encoder. Then, an HMD is designed to better exploit high-level semantic information. It can more fully exploit global contextual information of high-level semantic features to guide low-level features, refining multi-level features from coarse to fine. There are two flows in the HMD: multiplication flow and concatenation flow. On the one hand, the high-level semantic features can guide their next-level features via hierarchical element-wise multiplication operation. The hierarchical multiplication strategy can boost the representative capability of multi-level features. On the other hand, the high-level semantic information can be preserved by concatenation operation. Additionally, the CAM is applied to deal with the dearth issue of contour information. Then, the semantic and contour information is fused in the end, to further improve the performance of SOD.

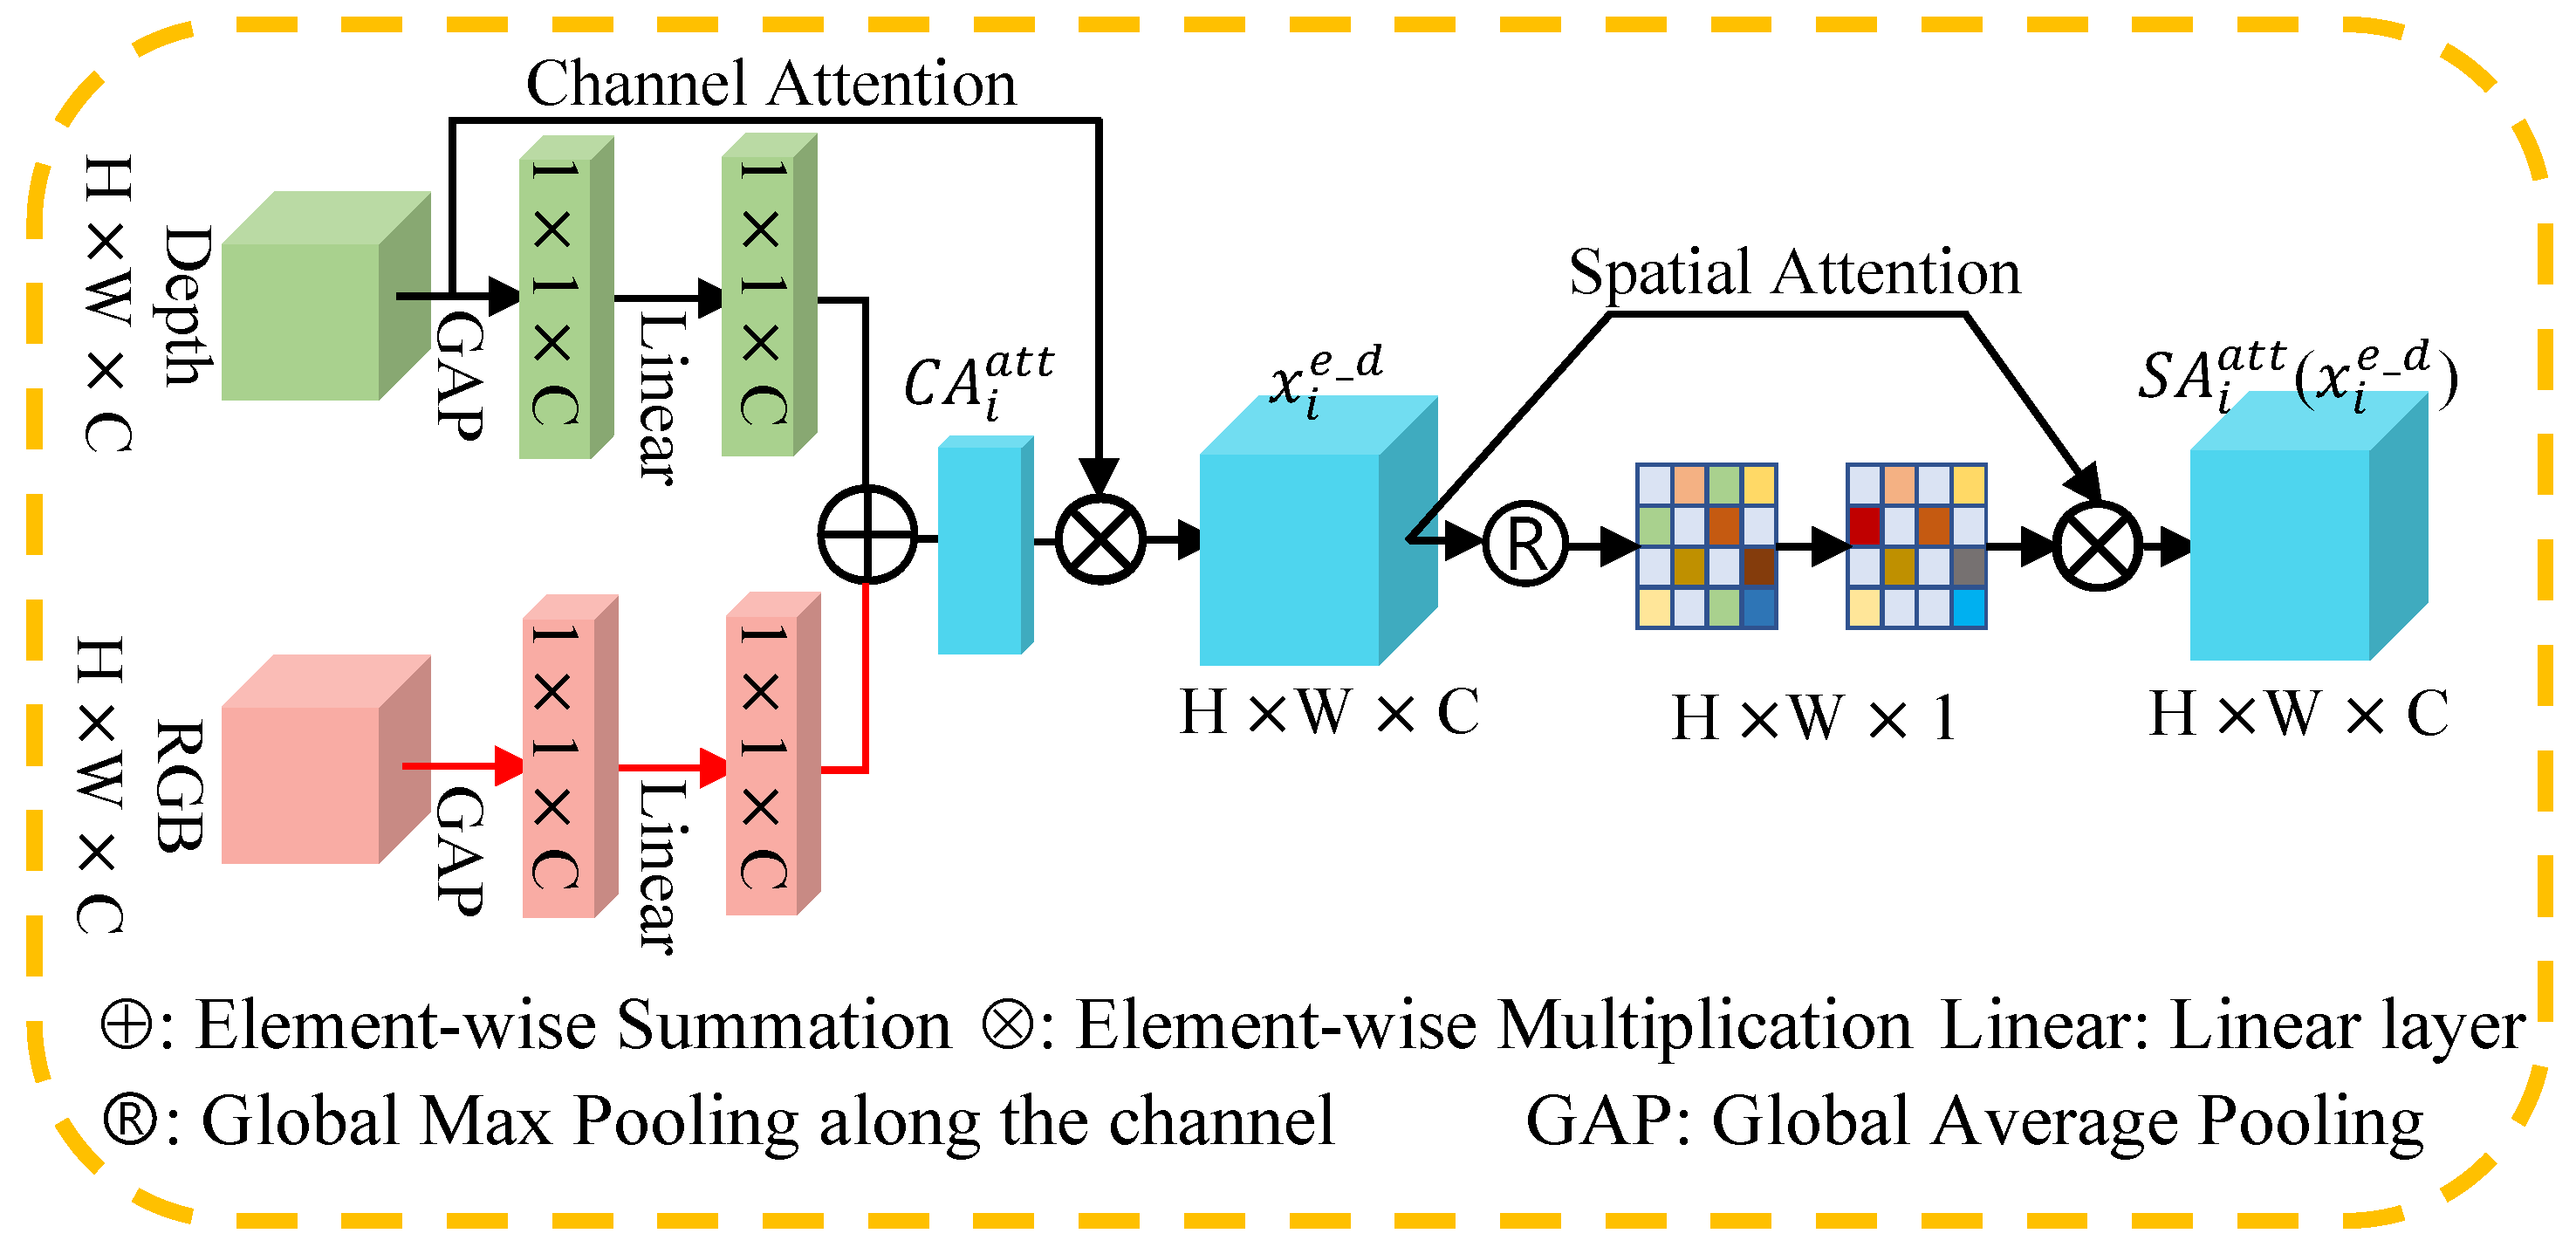
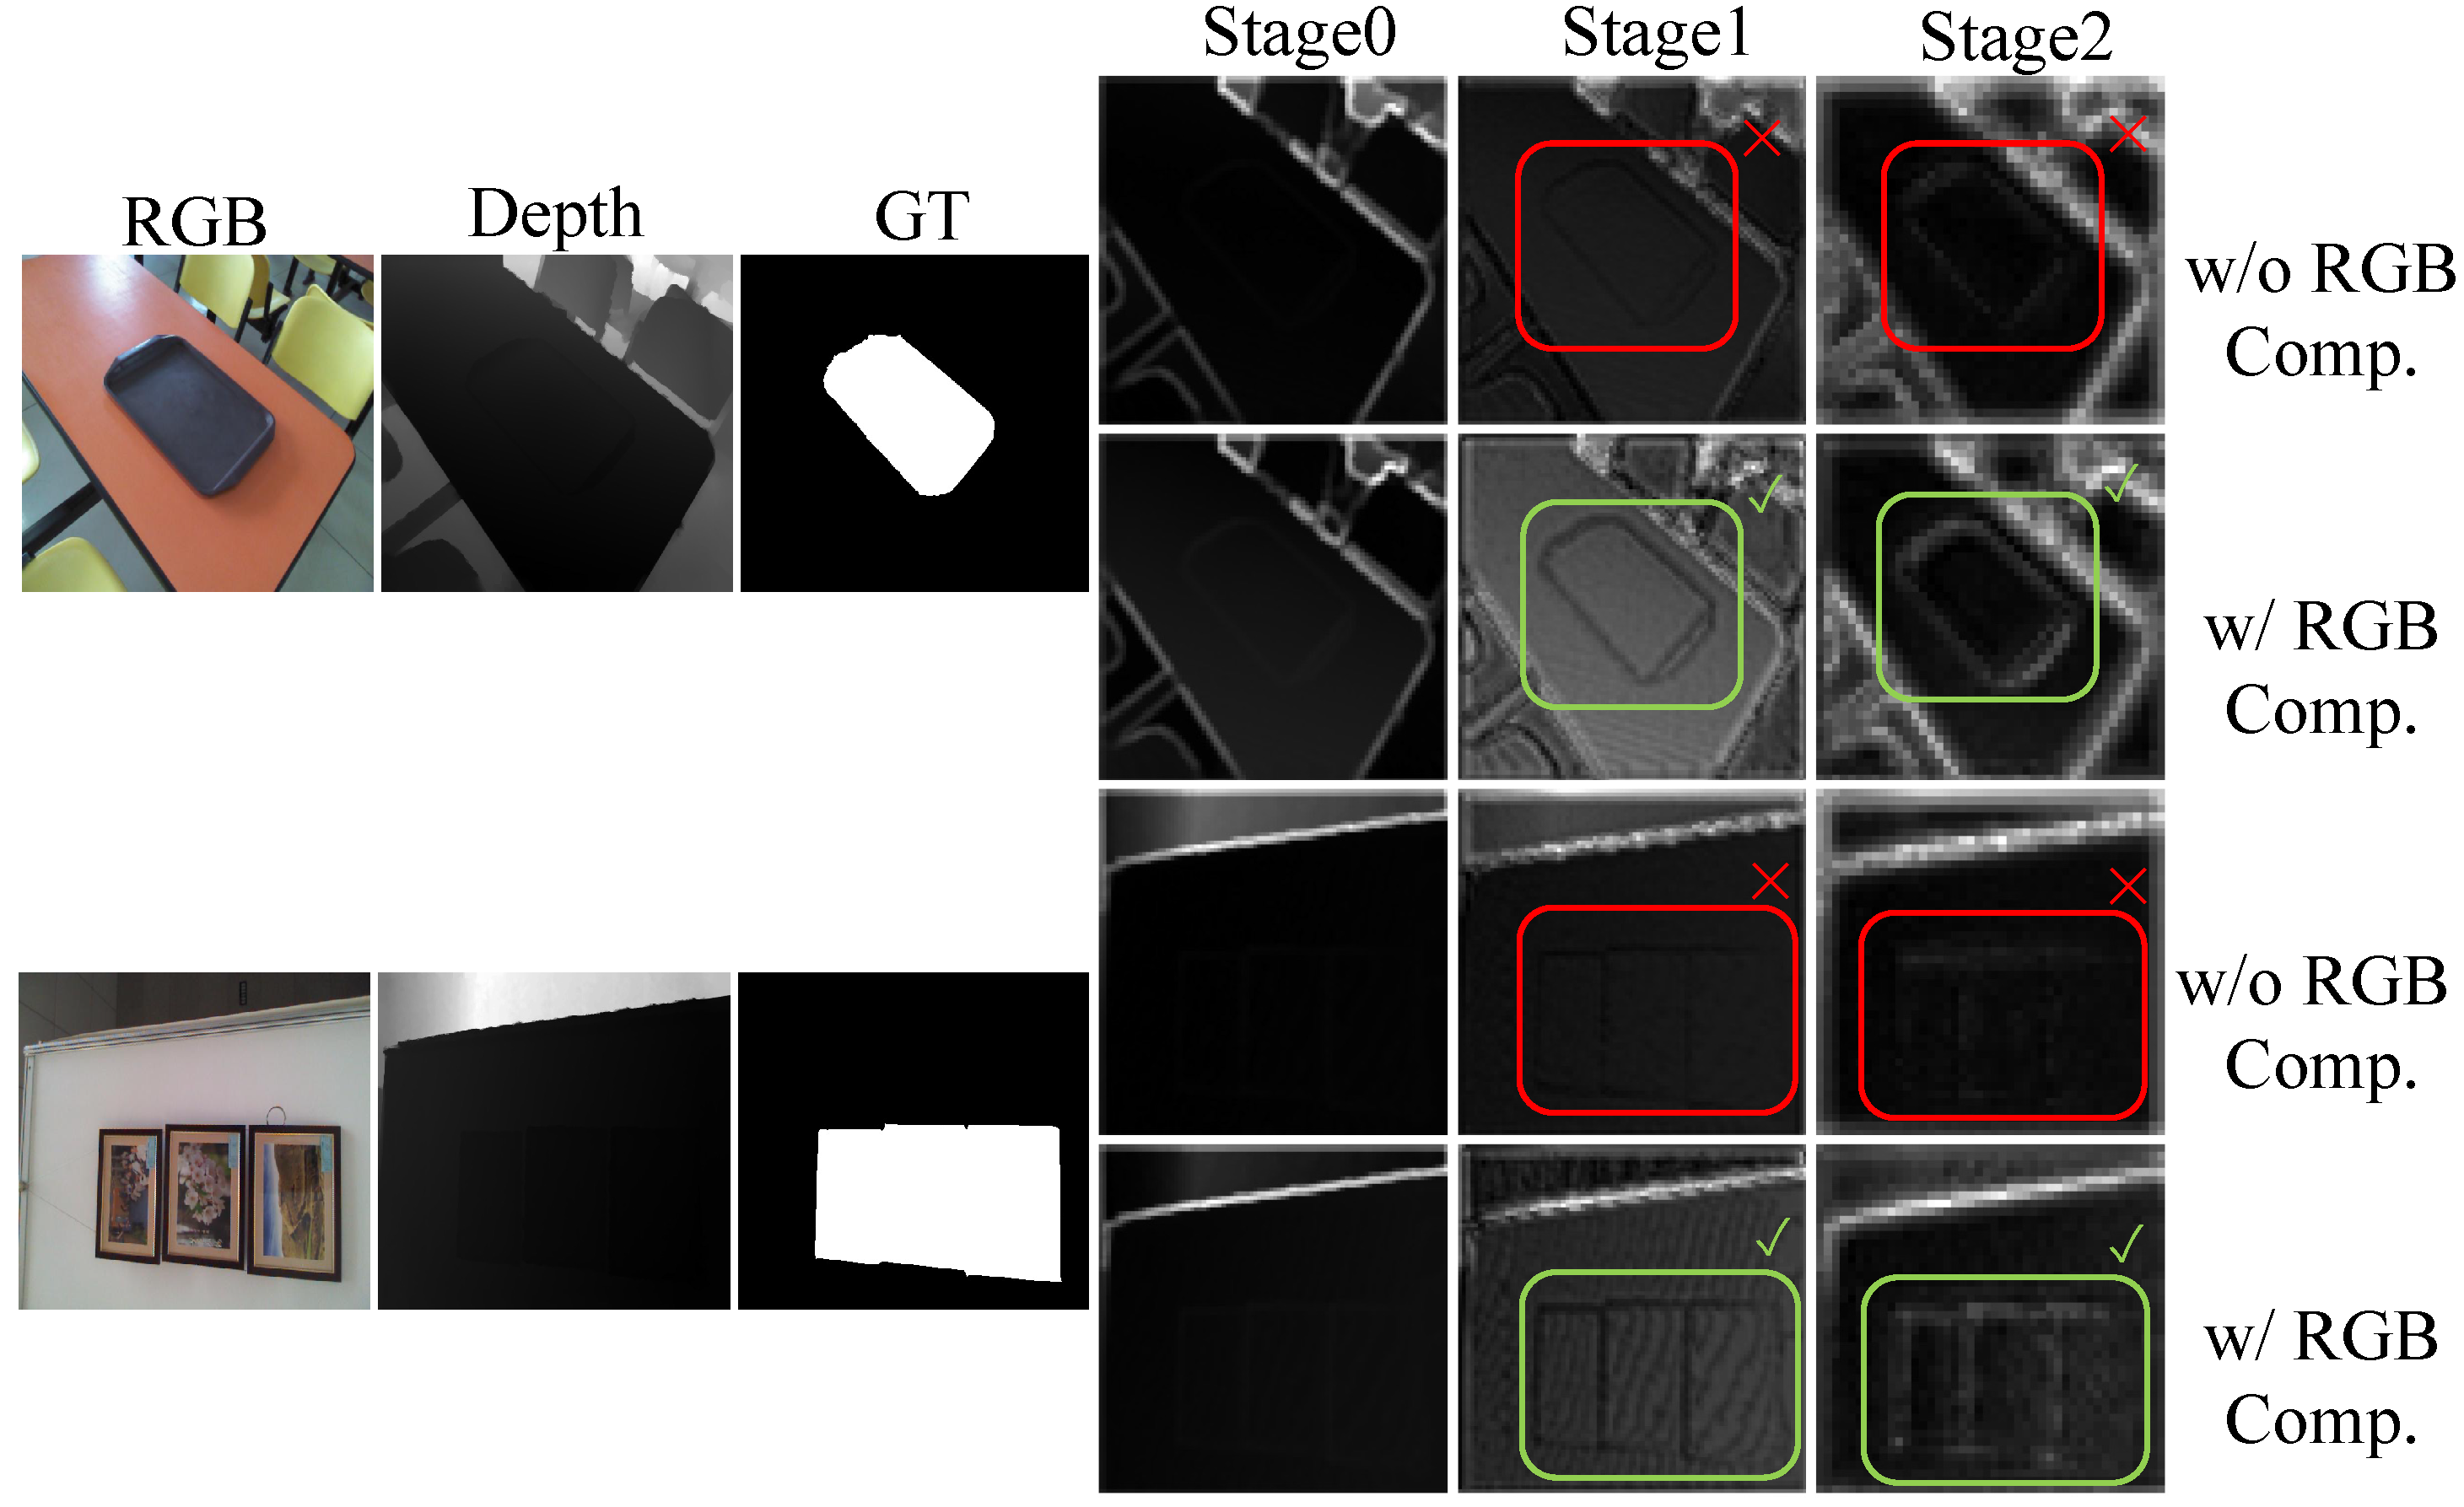
2.2. RGB Compensated Depth Attention Module

Visible and depth images, as different expressive forms of the same scene, are expected to be complementary when used for SOD. However, in the depth maps complementing RGB image fusion strategies, previous methods may bring some negative influences and lead to an error-prone fusion when the object cues are not clear in the depth maps.
To solve the problems, we introduce an RCDA module to enhance depth features using an attention mechanism. RCDA module consists of RGB compensated channel attention and spatial attention, as shown in Figure 4. It fuses RGB channel attention and depth channel attention via addition operation. RCDA module is attached before every side-out from the RGB and depth branch to fuse two kinds of features. Such a strategy can enhance the saliency representation of depth features.
Moreover, our channel attention scheme is different from BBSNet [32] and CBAM [46]. We consider the negative effect caused by poor-quality depth maps which lacks clear object semantic information. We propose using RGB compensated depth channel attention to enhance depth maps, as the object information may not be salient in depth maps but can be clear in RGB images. Compared with BBSNet [32] and CBAM [46] that use maximum pooling or both maximum pooling and average pooling to enhance feature maps, we only adopt average pooling to obtain the compensated depth channel attention from both depth and RGB modalities. More specifically, we propose using the spatial statistics of RGB features to complement the spatial statistics of depth features, as average pooling has been commonly utilized to learn the extent of the target object effectively [47] and compute spatial statistics [48]. Thus, compensated channel attention can be used to mine effective depth semantic information.
Theoretically, the ith i 0 , 1 , 2 , 3 , 4 level depth features x i d R C × H × W and ith level RGB features x i r g b R C × H × W are set as the inputs of RCDA module. Global Average Pooling (GAP) is performed on depth features and RGB features separately to obtain channel attention for both, producing vector G ( X ) R C × 1 × 1 with its kth channel G ( X ) = 1 H × W m H n W X k ( m , n ) . The RGB compensated depth channel attention can be defined as follows:
C A i a t t = F C i d ( G ( x i d ) ) + F C i r g b ( G ( x i r g b ) ) ,
where F C i d R C × C and F C i r g b R C × C indicate weights of two linear layers and the ReLU operator δ ( · ) . C A i a t t denotes ith level fused channel attention. This operation in Equation (1) can compensate the depth channel attention when the depth maps lack clear object information, aiming to fully excavate helpful depth features. The output channel attention vector is used to enhance x i d :
x i e _ d = σ ( C A i a t t ) x i d ,
where σ ( · ) , σ ( C A i a t t ) , and x i e d denote the sigmoid function, importance of each channel, and enhanced depth features, respectively. ⊗ represents the matrix multiplication. Next, spatial attention is generated via global max pooling (GMP) operation for each pixel in the enhanced depth features. The spatial attention is implemented as:
S A i a t t ( x i e _ d ) = C o n v ( R m a x ( x i e _ d ) ) x i e _ d ,
where R m a x ( · ) denotes the GMP operation for each point in the features along the channel axis. C o n v ( · ) represents a convolutional layer with 7 × 7 filter.
To demonstrate the effectiveness of the RCDA module, we visualize some features x i e _ d in RCDA module, as shown in Figure 5. ‘Stage0’, ‘Stage1’, and ‘Stage2’ denote the channel attention features of RCDA module in stage 0, stage 1, and stage 2 of the CAF encoder, respectively. Since there is rarely clear object information in depth maps, the effectiveness of using depth channel attention to enhance depth features is poor, as shown in row ‘w/o RGB Com.’. Considering the object is relatively clear in RGB image, we propose using RGB channel attention to compensate for depth channel attention. From Figure 5, we can observe that there is little difference between the features without RGB compensation and features with RGB compensation in Stage0. However, with the further refinement, the object region in the features with RGB compensation is more salient in Stage1 and Stage2, as shown in row ‘w/RGB Comp.’. It verifies the effectiveness of the proposed RCDA.

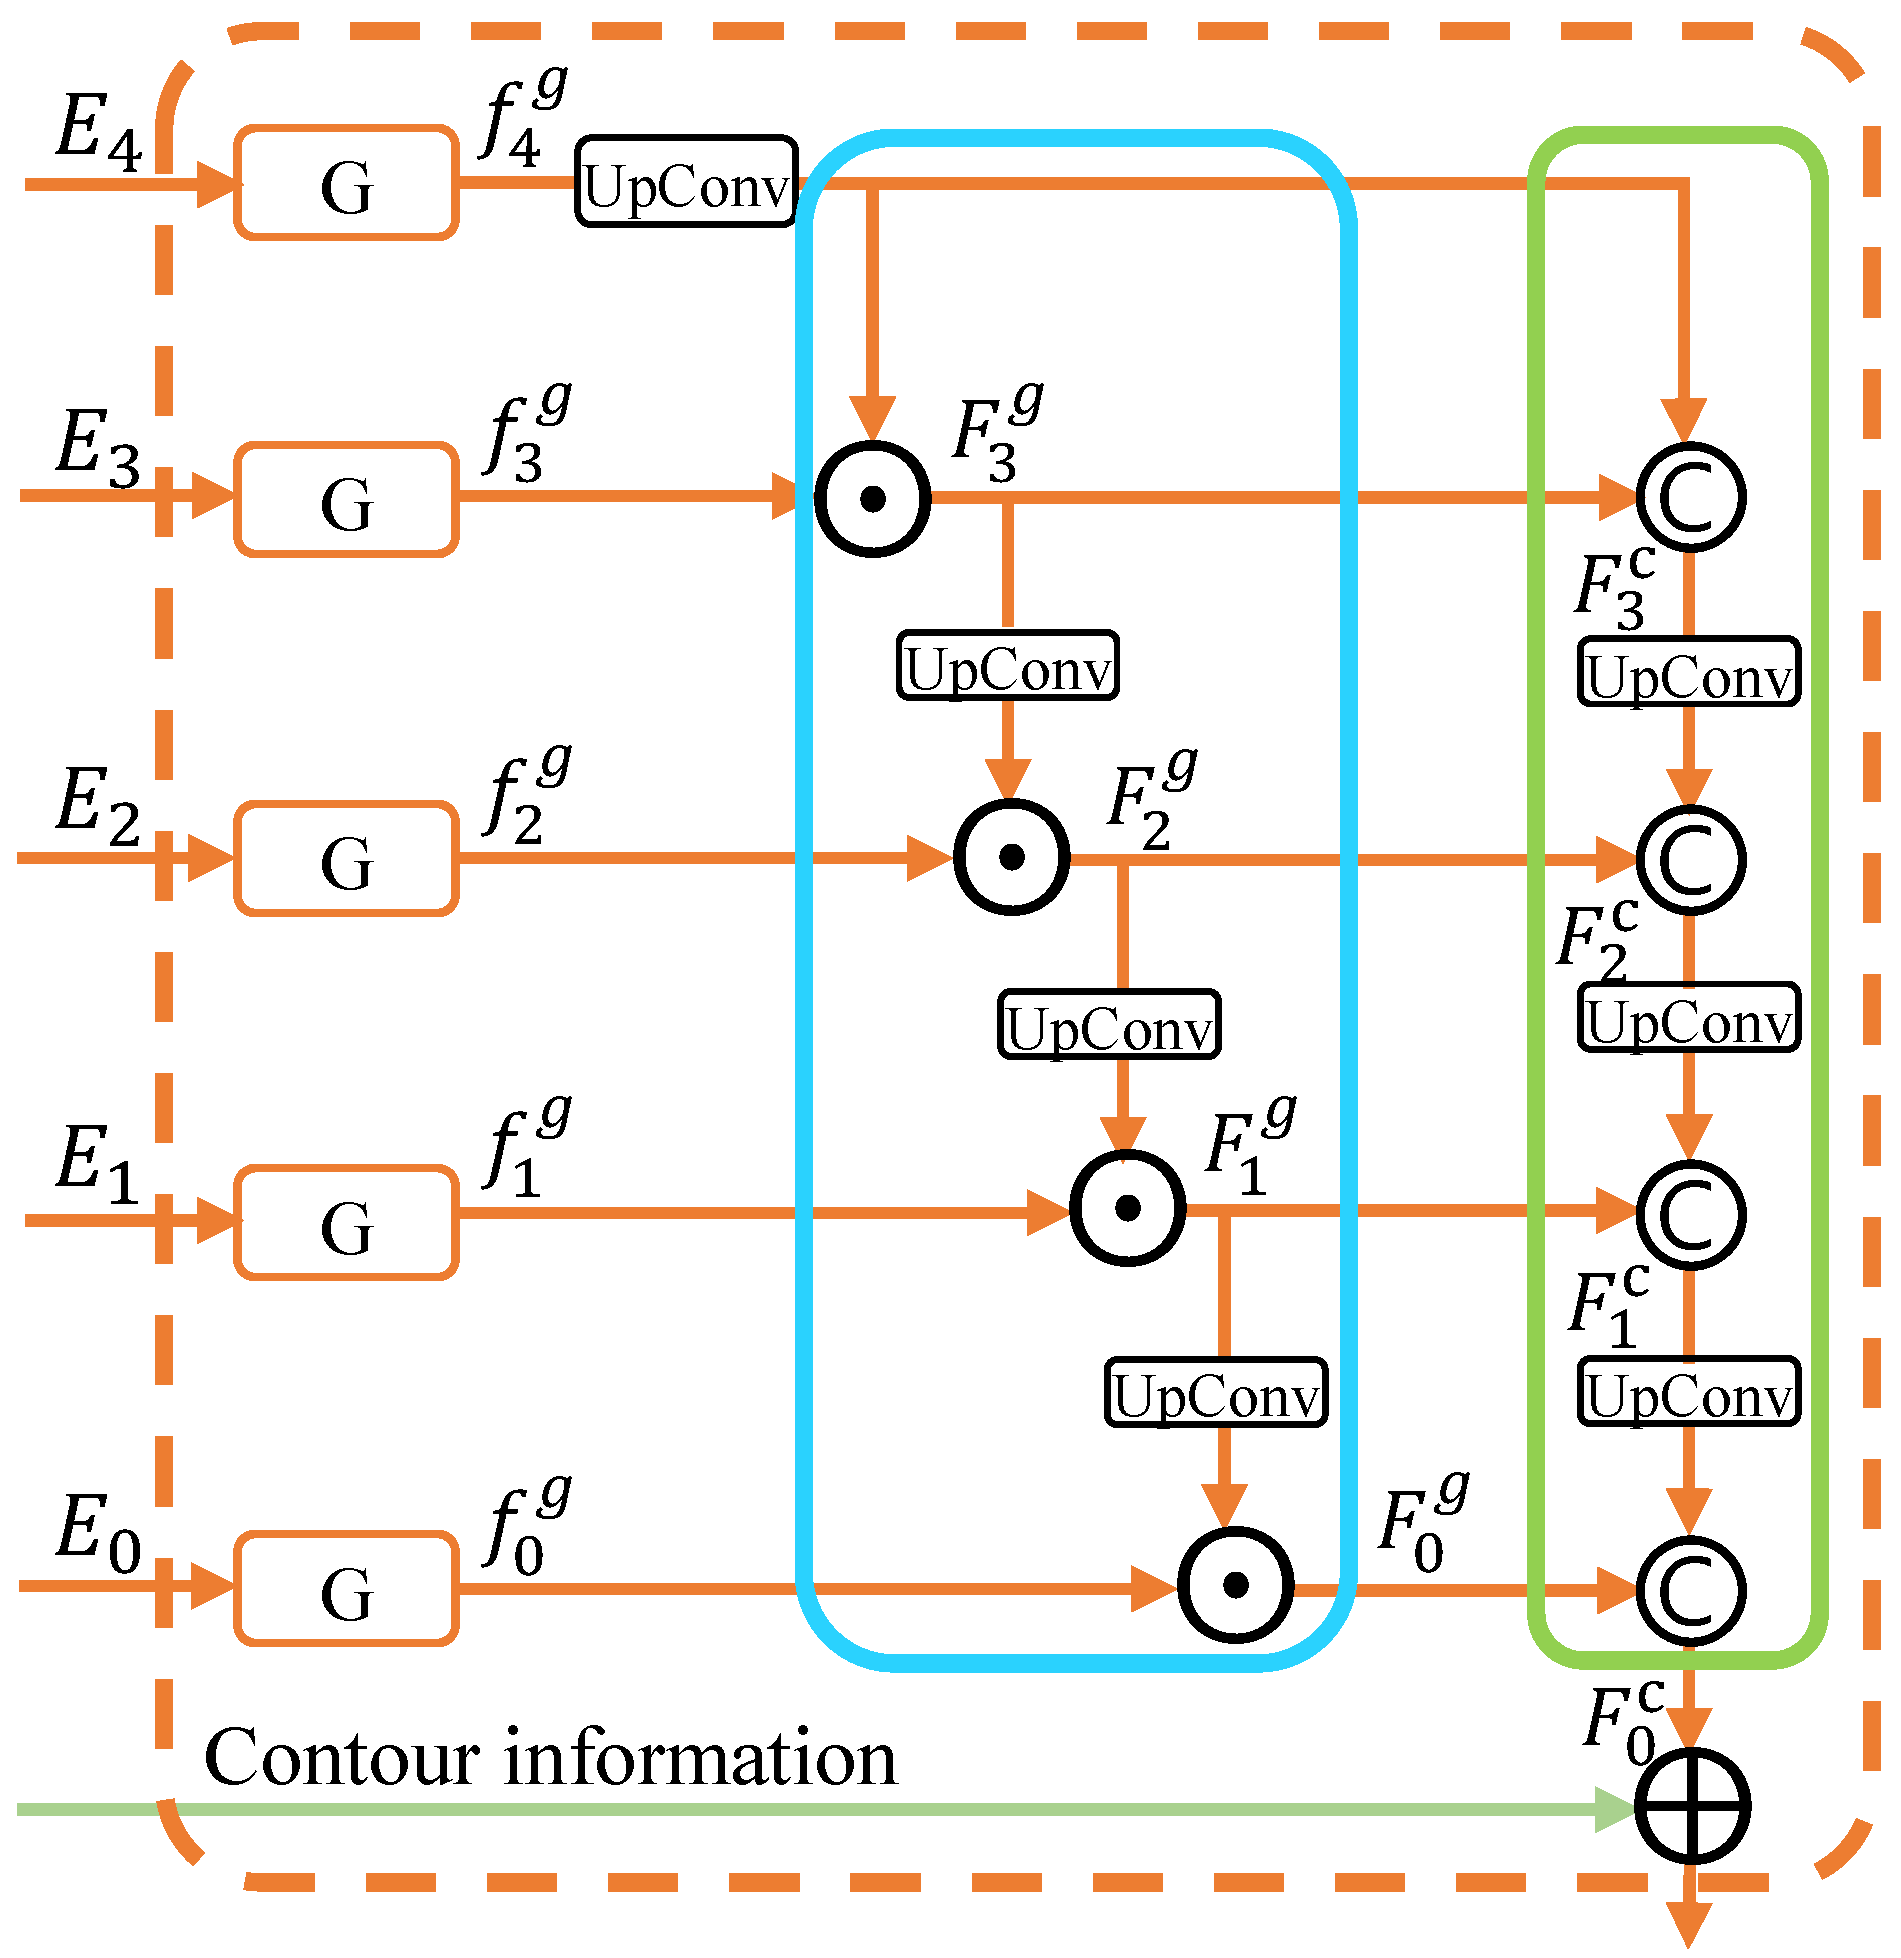
2.3. Hierarchical Multiplication Decoder

Both high-level semantic features and low-level detailed features are very important for SOD. In the process of decoding, we need to highlight the object region and suppress the non-object region (background). However, the existing U-shape decoding strategy may fail to effectively achieve this goal. It may lead to inaccurate locations of salient objects and defective prediction.
To address this issue, we propose a simple and efficient multiplication-based hierarchical decoder to refine the multi-level features from coarse to fine. Meanwhile, the proposed HMD can capture rich semantic information and global context with a larger receptive field. The design of HMD is shown in Figure 6. There are two parts in our multiplication-based hierarchical decoder, including the global context block (G block) and the hierarchical aggregation strategy, which consists of hierarchical multiplication flow and concatenation flow.
We first embed a G block in each stage, which can provide a larger receptive field with stronger global context [32,49]. More importantly, to effectively collect multi-level features, we propose multiplication-based hierarchical decoding mechanism to progressively refine the multi-level features from coarse to fine. The high-level semantic features can guide their next-level features by element-wise multiplication operation, as shown in blue box of Figure 6. With the hierarchical multiplication operation, the salient region and background can be more obviously distinguished. Then, the refined features are concatenated with their higher-level semantic features (as shown in green box of Figure 6), so more high-level semantic features can be preserved. The proposed hierarchical multiplication decoding mechanism has the benefit of eliminating the ambiguity of the semantic features. Therefore, the object region would be more salient while the background distractors can be effectively suppressed by the hierarchical refinement strategy.
Specifically, the fused multi-modal features E i would be fed into G block to capture the global contextual information. The G block includes four parallel branches. A 1 × 1 convolution is adopted to unify the channel number to 32 in every branch, followed by a convolution with kernel size of 2 k 1 being adopted in the kth branch ( k 2 , 3 , 4 ) to extract multi-scale features. Then, all branches are tailed by a 3 × 3 convolution with dilation rate of 2 k 1 . Finally, the outputs of the four branches are concatenated and unified to channel 32 with a 1 × 1 convolution [32]. The outputs of the G block are defined by:
f j g = G ( E j ) ,
where E j and G ( · ) represent the jth level input features and global context block, respectively. The purpose of G block is to capture long-range contextual information from the fused multi-modal features.
To more thoroughly excavate the high-level semantic features, we leverage a multiplication-based hierarchical decoding mechanism to refine the features from coarse to fine. For convenience, the multi-level semantic features with and without refinement can be denoted as F 0 g , F 1 g , F 2 g , F 3 g and f 0 g , f 1 g , f 2 g , f 3 g , f 4 g , respectively. The proposed hierarchical multiplication mechanism mainly includes four steps. For simplicity, we do not mention the ‘UpConv’ operation for resizing in the following.
  • Firstly, refine f 3 g by f 4 g with element-wise multiplication to obtain F 3 g . Concatenate f 4 g and F 3 g to obtain F 3 c .
  • Secondly, refine f 2 g by F 3 g with element-wise multiplication to obtain F 2 g . Concatenate F 2 g and F 3 c to obtain F 2 c .
  • Thirdly, refine f 1 g by F 2 g with element-wise multiplication to obtain F 1 g . Concatenate F 1 g and F 2 c to obtain F 1 c .
  • Finally, refine f 0 g by F 1 g with element-wise multiplication to obtain F 0 g . Concatenate F 0 g and F 1 c to obtain F 0 c , as the final output of HMD.
With the multiplication strategy, those object regions can be more salient while background information would be suppressed. Thus, the higher-level semantic information can guide its next-level features with hierarchical multiplication operation. The hierarchical multiplication flow can be defined as follows:
f 4 u _ p = U p C o n v ( f 4 g ) F 3 g = f 3 g f 4 u _ p
F 4 i u _ p = U p C o n v ( F 4 i g ) F 4 i 1 g = f 4 i 1 g F 4 i u _ p
where i { 1 , 2 , 3 } , and U p C o n v ( · ) denote the up-sampling operation and standard 3 × 3 convolution operation. ⊙ indicates element-wise multiplication.
The multi-level features’ representative ability becomes stronger after hierarchical multiplication. Meanwhile, each refined feature is concatenated with its last-level features as the output features. Thus, more high-level semantic information can be preserved via hierarchical concatenation. The hierarchical concatenated flow can be defined as:
F 3 c = c a t ( F 3 g , f 4 u _ p ) F 4 i 1 c = c a t ( F 4 i 1 g , U p C o n v ( F 4 i c ) )
where c a t ( · ) represents the concatenation of multiple semantic features. F 3 c and F 4 i 1 c indicates the 3rd and ( 4 i 1 ) th level output of HMD, respectively.
To intuitively prove the effectiveness of our HMD, we provide some visual examples in Figure 7, including features before hierarchical multiplication flow (referring to f 1 g , f 2 g , f 3 g , and f 4 g in Figure 6) and features after hierarchical multiplication flow (referring to F 0 g , F 1 g , F 2 g , and F 3 g in Figure 6). We can observe that the features before multiplication operation (denoted as ‘B/Mul’ in Figure 7) are coarse and blurred. The background of the refined features (denoted as ‘A/Mul’ in Figure 7) is smoother and the object region is clearer after hierarchical multiplication. It demonstrates the background distractors has been effectively suppressed and the object region has been highlighted. The visual examples verified the effectiveness of the proposed hierarchical multiplication mechanism.

2.4. Loss Function

We observe that the predicted maps produced by some existing RGB-D SOD algorithms suffer from coarse object boundaries. Thus, we apply a CAM to boost contour quality by explicitly utilizing contour information. Specifically, the fused features from each stage of the backbone are fed into CAM and their channels are unified to 256 by 3 × 3 convolutional layers. To make the contour regions more salient, the multi-scale contour features are directly supervised by the binary contour labels [50]. Here, a 1 × 1 convolution and a sigmoid function are used to map the contour features to predicted edge maps. All contour features are resized to the same size and then concatenated together. Finally, we exploit it to refine the semantic features that are generated from HMD. We adopt binary cross entropy (BCE) loss [51] to supervise the contour prediction ( P c ) and the contour loss is defined as:
l o s s c ( P c , G c ) = G c log P c + ( 1 G c ) log ( 1 P c ) ,
where P c and G c mean the predicted contour saliency maps and ground truth binary contour saliency maps, respectively. We jointly optimize the model by defining the total loss:
l o s s t o t a l = l o s s p r e d + l o s s a u x + α l o s s c .
The weight α is used to keep a trade-off between the contour and semantic loss. We empirically set α = 0.3 . The l o s s p r e and l o s s a u x represent the prediction loss and auxiliary loss for which BCE is widely used. The l o s s a u x and l o s s p r e are computed as:
l o s s a u x ( P 1 , G ) = G log P 1 + ( 1 G ) log ( 1 P 1 ) ,
l o s s p r e d ( P 2 , G ) = G log P 2 + ( 1 G ) log ( 1 P 2 ) ,
where P 1 , P 2 are the predicted results of middle stage and the last stage, and G indicates the ground truth. More specifically, the BCE loss can be formulated as:
l o s s ( P , G ) = 1 W × H G i , j log P i , j + ( 1 G i , j ) log ( 1 P i , j ) ,
where G i , j and P i , j are the ground truth and predicted value in the spatial position ( i , j ) of image. W and H denote the width and height of image, respectively.

3. Results

3.1. Datasets

The proposed method has been quantitatively evaluated on five widely used RGB-D SOD datasets, including NJU2K [24], NLPR [52], STERE [53], DES [54], and SIP [25]. A simple introduction about five datasets is given below: NJU2K [24] includes 1985 image pairs and ground truth with different challenging and complex objects. The stereo images are gathered from the Internet and 3D movies. It is divided into a testing set and a training set, which incorporates 500 and 1485 images, respectively. NLPR [52] includes 1000 images with single or multiple salient objects, which are harvested by Kinect in different environments. It is split into a testing set and a training set, which contains 300 and 700 images, respectively. STERE [53] incorporates 1000 pairs of binocular pictures for testing. These images are mainly downloaded from the Internet. DES [54] is a relatively small testing dataset that contains 135 images captured by Microsoft Kinect in indoor circumstances. SIP [25] contains 929 accurately annotated high-resolution images, which involve various real-world scenes. One of the main characteristics is that it contains multiple salient persons per image.
Training/Testing dataset. We adopt the same training setting as previous studies [55,56]. In total, 1485 images from the NJU2K dataset and 700 images from the NLPR dataset are used as the training set. All the images of SIP, DES, STERE, and the remaining images in the NLPR and NJU2K datasets are applied as the testing set.

3.2. Evaluation Metrics

Four mainstream metrics are adopted to evaluate the performance of the proposed CAF-HMNet, incorporating mean absolute error ( M A E ) [57], S-measure ( S α ) [58], maximum F-measure ( F β ) [59], and maximum E-measure ( E ξ ) [60].
S-measure. The S-measure evaluates both object-aware and region-aware structural similarity between ground truth and predicted maps. It combines the object-aware ( S 0 ) and region-aware ( S r ) structural similarity as the final structure metric:
S α = α S 0 + ( 1 α ) S r ,
where α [ 0 , 1 ] and α = 0.5 is the default setting [58].
E-measure. The E-measure simultaneously captures local pixel matching information and global statistics. It is formulated as:
E ξ = 1 W × H x = 1 W y = 1 H f ( 2 φ G T φ F M φ G T φ G T + φ F M φ F M ) ,
where f ( · ) is a quadratic function. ∘ indicates the Hadamard product. φ G T and φ F M are the bias matrix of ground-truth maps and binary foreground maps, respectively.
F-measure. The F-measure is a region-based similarity, and it is the weighted harmonic mean of recall and precision. The F-measure can evaluate the overall performance. It is formulated as:
F β = ( 1 + β 2 ) · P r e c i s i o n · R e c a l l β 2 · P r e c i s i o n + R e c a l l .
As advised by previous works [41,61], β 2 is set to 0.3.
MAE. The MAE calculates the average value of the per pixel absolute error between the ground truth and the prediction.
M A E = 1 W × H i = 1 W j = 1 H | P ¯ ( i , j ) G ¯ ( i , j ) | ,
where P ¯ and G ¯ denote the predicted results and ground truth. W and H represent the image width and height.

3.3. Implementation Details

The input depth and RGB image pairs are reshaped to 352 × 352 during the training and inference phase. Different image enhancement methods are utilized for the training dataset, i.e., border clipping, random flipping, and rotating. The backbone network parameters are pre-trained on ImageNet [62]. We use PyTorch default settings to initialize the remaining network parameters. The Adam optimizer algorithm [63] is employed to train our model. The batch size is set to 10. The initial learning rate is set to 1 × 10 4 and is divided by 10 per 60 epochs with total 200 epochs. The PyTorch [64] framework is used to conduct experiments base on a single RTX 3090 GPU platform. The parameters and FLOPs of our CAF-HMNet are 72.05 M and 43.30 G, respectively.

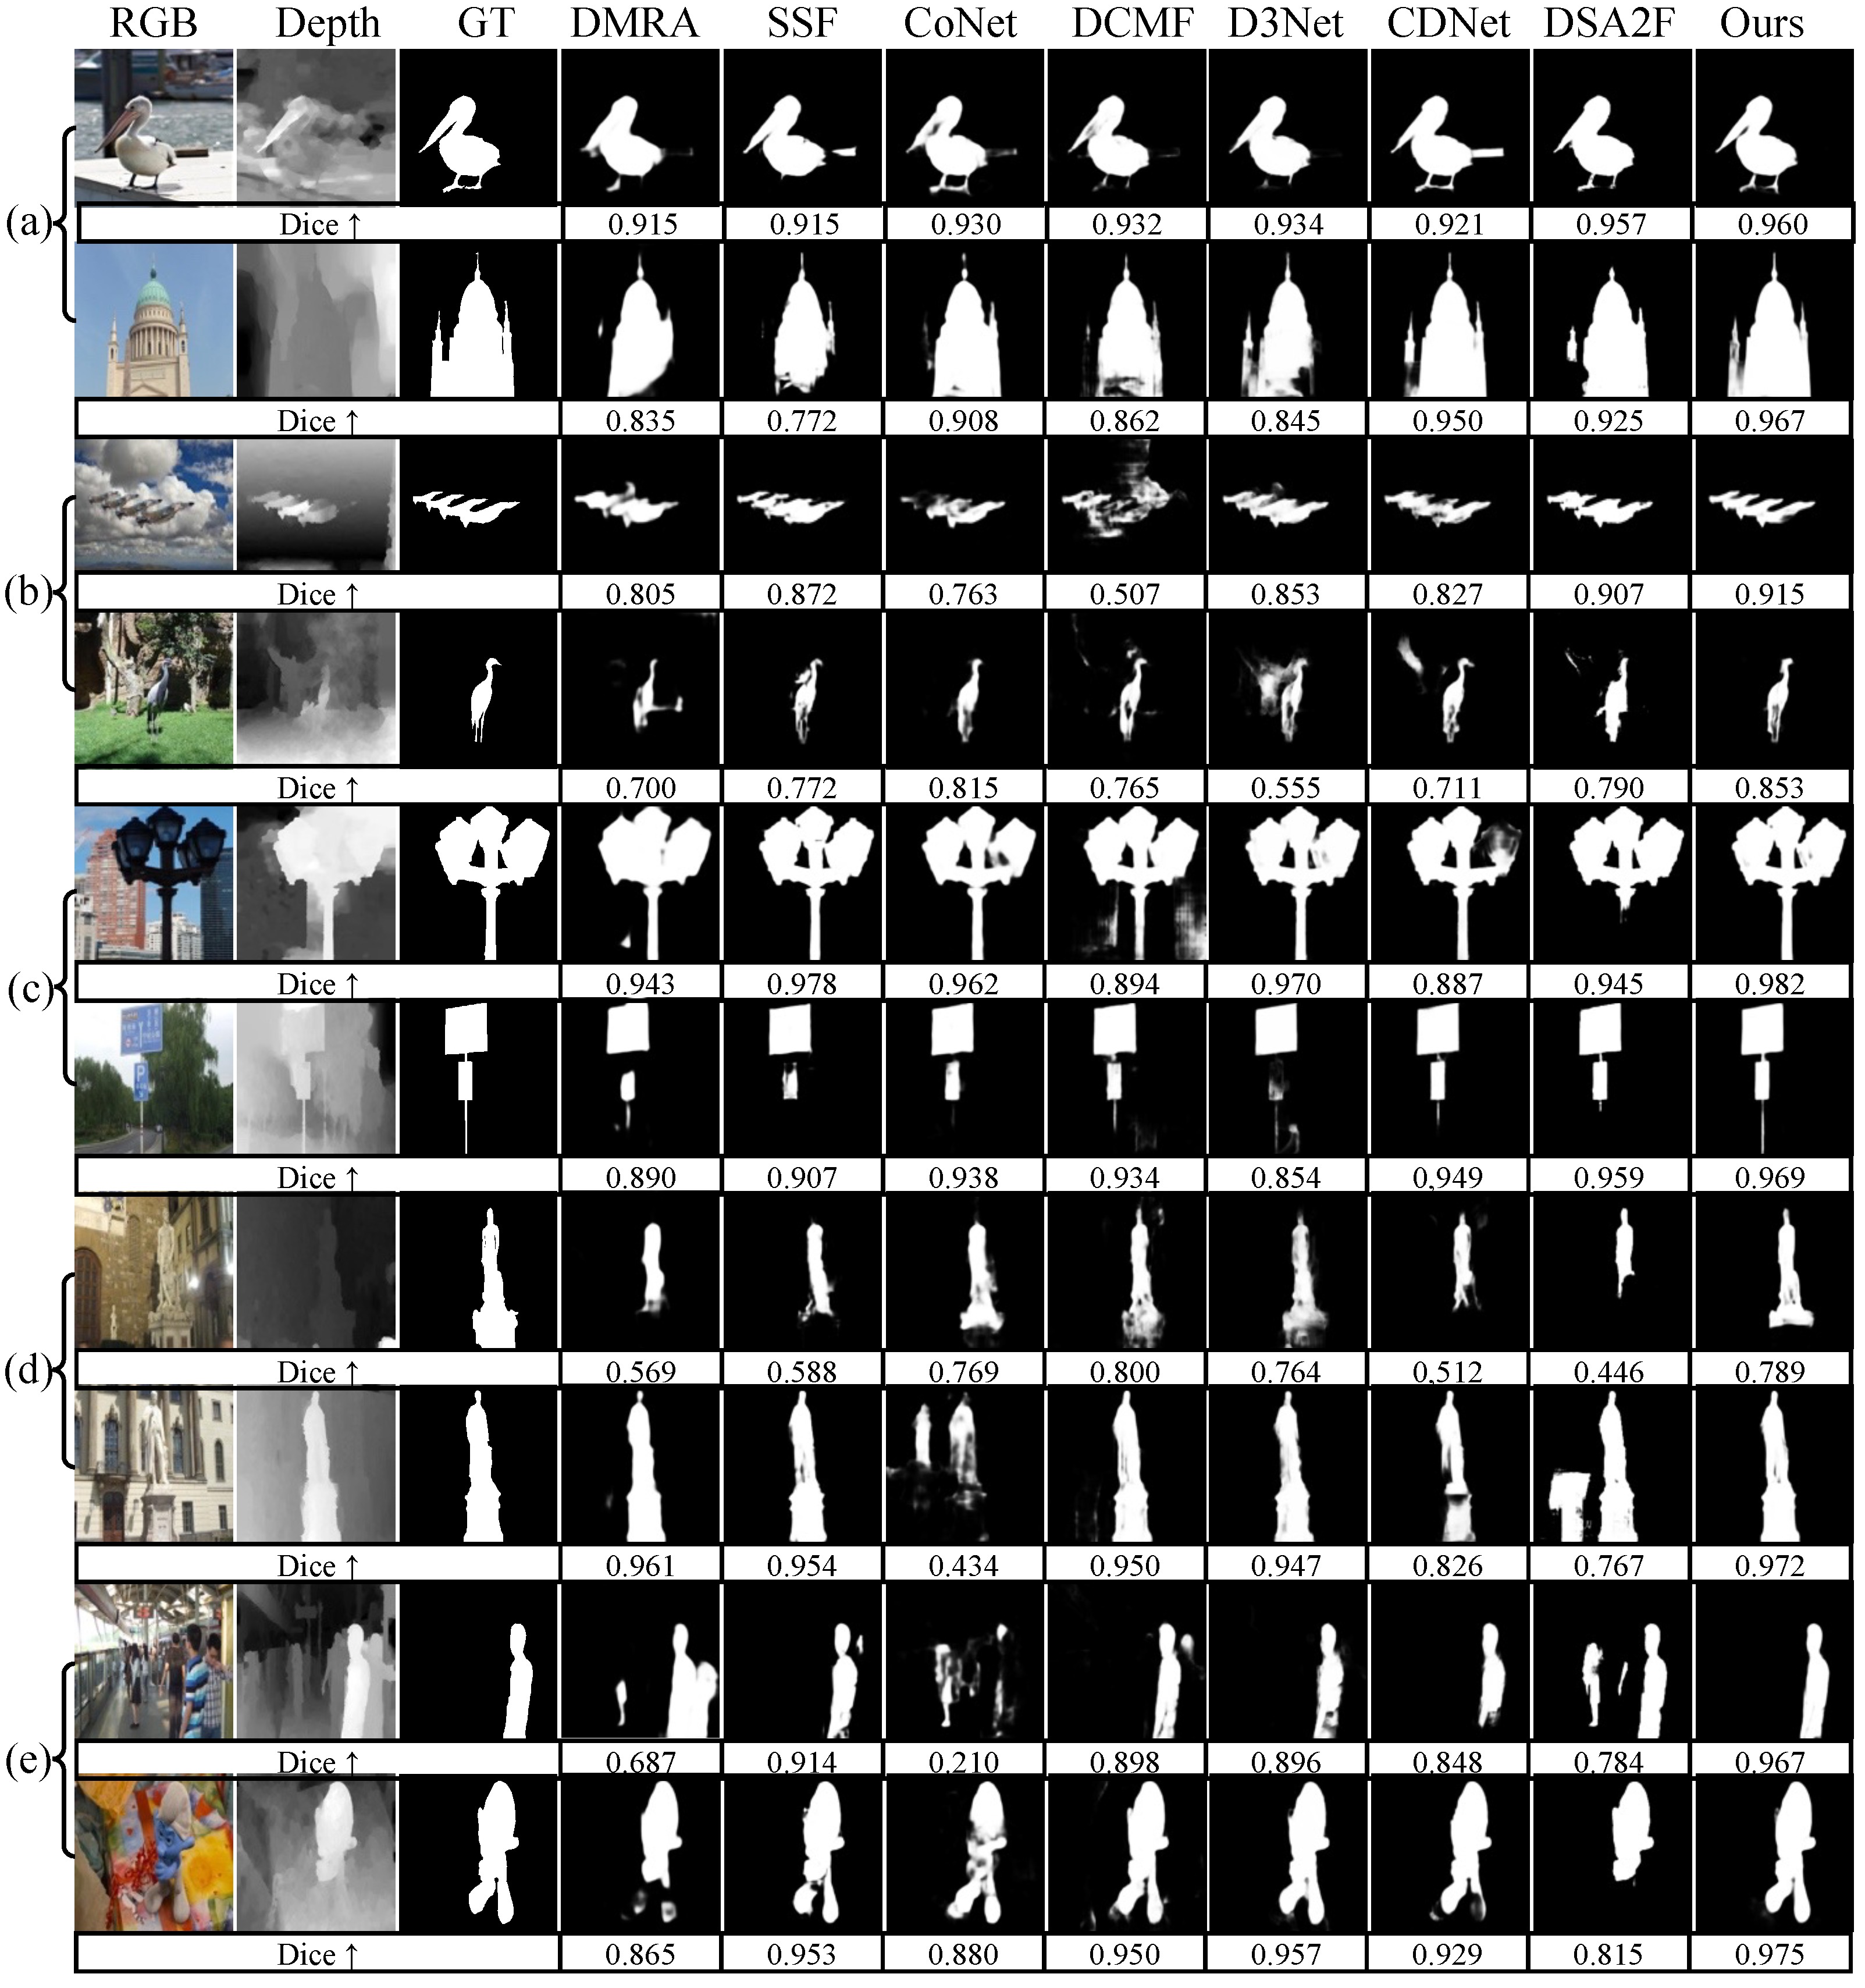
3.4. Comparison with State-of-the-Art Methods

We compare our CAF-HMNet with thirteen SOTA RGB-D models, including TANet [35], DMRA [36], SSF [26], DRLF [65], CoNet [66], DCMF [67], A2dele [68], D3Net [25], ICNet [38], DANet [69], BBSNet [32], CDNet [70], and DSA2F [71]. The saliency maps for comparison are supplied by the authors to ensure comparison fairness.
Quantitative Evaluation. The quantitative comparison in Table 1 shows that our method achieves satisfactory results, compared with other SOTA CNN-based methods, in terms of all four evaluation metrics. It has performance gains over the best compared algorithms (CVPR’21 DSA2F [71] and TIP’21 CDNet [70]) for the metrics ( S α , m a x F β , m a x E ξ , and M A E ) on five mainstream datasets. This is mainly attributed to two aspects: firstly, our RCDA module can singularize more depth semantic information. Secondly, the HMD can effectively suppress background distractors and highlight the salient object region. The experiment results verify that our model is successful in exploiting the high-level semantic information to guide low-level features and multi-modal feature fusion.
Moreover, we conduct multiple experiments and report both the average performance and standard deviation. As shown in Table 2, the S α and F β on NJU2K are 0.923 ± 0.001 and 0.923 ± 0.002, respectively. The maximum standard deviation is 0.00476, while the minimum standard deviation is 0.00050, indicating the consistently small variance in the results obtained. Hence, both the average performance and standard deviation confirm that our comparisons hold statistical significance.
Qualitative Comparison. To further demonstrate the superior performance of our model, we supply some visual predicted maps of the proposed method and various SOTA methods in Figure 8. From the predicted maps, we can observe that our proposed method has better detection performance than other SOTA methods under various challenging situations: small object (1st and 2nd rows), low-quality depth maps (3rd and 4th rows), slim structure (5th and 6th rows), low contrast scene (7th and 8th rows), and complex scene (9th and 10th rows). Additionally, we also report the Dice similarity coefficient (Dice) metric for reference at the bottom of each scene. ↑ denotes that the higher the better.
In Figure 8a, we first display two examples of poor-quality depth maps where the object information is not clearly visible. Nevertheless, our proposed method can accurately detect salient objects in these cases, indicating the efficacy of our RCDA module. Second, two small object examples are shown in Figure 8b. Although the aircraft on the upper-left of the first row is tiny, our method can exactly detect it. Third, we present two examples with slim structures in Figure 8c. As shown in the second row, most SOTA methods fail to detect the stem of instruction board, while our method can precisely segment the salient object, even though the stem of the instruction board is slim and easily neglected. Fourth, Figure 8d shows examples with low contrast between the background and target regions. Many methods fail to segment the complete object. Our method can segment the object more accurately and completely.
Finally, there are two examples of complex scenes in Figure 8e. From the first row, we can find that most SOTA methods make the wrong detection. However, our method can accurately detect the salient object by effectively suppressing the background distractors. In the second row, our method completely segments the object by highlighting the foreground object while other methods output the incomplete results.

4. Discussion

In this section, we conduct ablation experiments on the NJU2K [24], NLPR [52], STERE [53], and SIP [25] datasets to study the effectiveness of different modules in our method. The baseline is our CAF-HMNet without additional modules (i.e., RCDA, HMD, and CAM).
The effectiveness of the RGB compensated depth attention module. To illustrate the advantages of the RCDA module in the proposed CAF-HMNet, we conduct an ablation experiment. We use the RCDA module for multi-modal feature fusion rather than the element-wise addition used at baseline. The baseline’s performance is illustrated in row 1. Row 2 (denoted as ‘B + RCDA’) represents the model which adopts the RCDA module for multi-modal feature fusion. As shown in Table 3, ablation studies on the STERE dataset have demonstrated the effectiveness of the RCDA module, yielding an improvement of 1.6, 1.7, and 1.1 points in S α , F β , and E ξ over baseline when using the RCDA module for multi-modal feature fusion. Compared with baseline, using the RCDA module significantly improves the performance. This verifies the effectiveness of the RCDA module. Additionally, we conduct an ablation study where maximum pooling is incorporated in the channel and spatial attention of our RCDA module. As shown in Table 4, we can find that the model with maximum pooling cannot effectively improve the performance but the computational complexity is increased. Therefore, the maximum pooling operation is not considered in our RCDA module.
Moreover, to intuitively show the advantages of the RCDA module, we visualize some examples in Figure 9. The ‘B’ and ‘B + RCDA’ columns in Figure 9 show that the predicted maps of the baseline can be optimized by adding the RCDA module. There is richer object semantic information after the RCDA module is used, which proves the effectiveness of our method.
The effectiveness of the hierarchical multiplication decoder. We conduct an ablation experiment to validate the effectiveness of the proposed HMD. We adopt HMD to aggregate multi-level features instead of the UNet decoder utilized in the baseline. The performance of the baseline with HMD is illustrated in row 3 (denoted as ‘B + HMD’) of Table 3. From the experimental results, we can see huge performance gains from using our HMD.
Moreover, some visual examples are shown to intuitively prove the effectiveness of HMD. As shown in Figure 9, adding HMD can generate predicted maps with both more sufficient semantic information and clearer detailed information. This demonstrates that the proposed hierarchical multiplication mechanism efficiently utilizes high-level semantic information to guide low-level features.
Finally, from row 4 of Table 3, we can find that the baseline with both RCDA module and HMD achieves the best performance on most metrics. Compared with the previous model, the ‘B + RCDA + HMD’ model outputs more complete and accurate features, as shown in Figure 9. This is mainly owed to the RCDA module and the HMD. The quantitative results and visualized features demonstrate the effectiveness of the proposed modules.
The effectiveness of the contour-aware module. To show the effectiveness of the CAM, we remove the CAM from the proposed CAF-HMNet for the ablation study. From Figure 10, we can find that our CAF-HMNet (denoted as ‘w/CAM’) can predict more completed salient object regions and clearer boundaries compared with the model without the contour-aware module (denoted as ‘w/o CAM’). For example, our model can effectively predict the legs of the bird, as shown in the green circle of the second row. In summary, the model with CAM can generate clearer boundaries and more integrated salient objects.
The superiority of the hierarchical multiplication decoder. To intuitively show the superiority of the hierarchical multiplication decoding mechanism, we visualize some concatenated features (referring to F 0 c , F 1 c , F 2 c , and F 3 c in Figure 6) with and without hierarchical multiplication (denoted as ‘C/w/Mul.’ and ‘C/w/o Mul.’, respectively, in Figure 11). It is obvious that the predicted maps without hierarchical multiplication operation have insufficient semantic information (as shown in the yellow circle of Figure 11) and wrong predictions (as shown in the red circle of Figure 11). However, we can correct these deficiencies by adding our hierarchical multiplication mechanism. The visualized features further demonstrate that the proposed hierarchical multiplication decoding mechanism can effectively enhance the salient object region and suppress the background distractors.

5. Conclusions

In this paper, we reveal the deficiencies of existing U-shape SOD methods, from the perspective of multi-modal feature fusion and the utilization of high-level semantic information. To address these issues, we propose the compensated attention feature fusion and hierarchical multiplication decoder network. Specifically, we firstly design a compensated attention feature fusion module to solve the multi-modal feature fusion issue. Secondly, we propose a hierarchical multiplication decoder to fully exploit high-level semantic information to guide low-level features. Experiments on five challenging RGB-D SOD datasets demonstrate that the proposed method achieves promising performance under four widely used evaluation measures. In particular, our CAF-HMNet achieves 92.2% S α , 92.3% F β , 95.3% E ξ , and 3.4% M A E on the NJU2K dataset and 93.7% S α , 92.9% F β , 96.9% E ξ , and 2.0% M A E on the NLPR dataset.

Author Contributions

Conceptualization, X.T. and H.L.; methodology, Z.Z. and H.L.; validation, Z.Z. and F.C.; writing—original draft preparation, Z.Z. and H.L.; writing—review and editing, H.L., F.C. and X.T. All authors have read and agreed to the published version of the manuscript.

Funding

This work was supported in part by the National Natural Science Foundation of China (Nos. U20A20157, 62001063, and U2133211) and the China Postdoctoral Science Foundation (2020M673135).

Data Availability Statement

The source code will be available at https://github.com/Azhihong/CAF-HMNet accessed on 30 April 2023. We utilized two public 2-D semantic labeling datasets, Vaihingen and Potsdam, provided by the International Society for Photogrammetry and Remote Sensing (ISPRS) https://www2.isprs.org/commissions/comm2/wg4/benchmark/semantic-labeling/ accessed on 30 April 2023.

Conflicts of Interest

The authors declare no conflict of interest.

References

  1. Borji, A.; Cheng, M.M.; Hou, Q.; Jiang, H.; Li, J. Salient object detection: A survey. Comput. Vis. Media 2019, 5, 117–150. [Google Scholar] [CrossRef]
  2. Cheng, G.; Han, J.; Zhou, P.; Xu, D. Learning rotation-invariant and fisher discriminative convolutional neural networks for object detection. IEEE Trans. Image Process. 2018, 28, 265–278. [Google Scholar] [CrossRef] [PubMed]
  3. Gao, Y.; Shi, M.; Tao, D.; Xu, C. Database saliency for fast image retrieval. IEEE Trans. Multimed. 2015, 17, 359–369. [Google Scholar] [CrossRef]
  4. Jia, X.; Lu, H.; Yang, M.H. Visual tracking via coarse and fine structural local sparse appearance models. IEEE Trans. Image Process. 2016, 25, 4555–4564. [Google Scholar] [CrossRef]
  5. Chen, F.; Liu, H.; Zeng, Z.; Zhou, X.; Tan, X. BES-Net: Boundary enhancing semantic context network for high-resolution image semantic segmentation. Remote Sens. 2022, 14, 1638. [Google Scholar] [CrossRef]
  6. Zhang, Q.; Cong, R.; Li, C.; Cheng, M.M.; Fang, Y.; Cao, X.; Zhao, Y.; Kwong, S. Dense attention fluid network for salient object detection in optical remote sensing images. IEEE Trans. Image Process. 2020, 30, 1305–1317. [Google Scholar] [CrossRef]
  7. Zhao, K.; Han, Q.; Zhang, C.B.; Xu, J.; Cheng, M.M. Deep hough transform for semantic line detection. IEEE Trans. Pattern Anal. Mach. Intell. 2021, 44, 4793–4806. [Google Scholar] [CrossRef]
  8. Zhu, C.; Li, G.; Wang, W.; Wang, R. An innovative salient object detection using center-dark channel prior. In Proceedings of the IEEE International Conference on Computer Vision Workshops, Venice, Italy, 22–29 October 2017; pp. 1509–1515. [Google Scholar]
  9. Cheng, M.M.; Mitra, N.J.; Huang, X.; Torr, P.H.; Hu, S.M. Global contrast based salient region detection. IEEE Trans. Pattern Anal. Mach. Intell. 2014, 37, 569–582. [Google Scholar] [CrossRef]
  10. Ronneberger, O.; Fischer, P.; Brox, T. U-net: Convolutional networks for biomedical image segmentation. In Proceedings of the International Conference on Medical Image Computing and Computer-Assisted Intervention, Munich, Germany, 5–9 October 2015; pp. 234–241. [Google Scholar]
  11. Zhao, J.X.; Liu, J.J.; Fan, D.P.; Cao, Y.; Yang, J.; Cheng, M.M. EGNet: Edge guidance network for salient object detection. In Proceedings of the IEEE/CVF International Conference on Computer Vision, Seoul, Repulic of Korea, 27 October–2 November 2019; pp. 8779–8788. [Google Scholar]
  12. Liu, Z.; Zhu, Z.; Zheng, S.; Liu, Y.; Zhou, J.; Zhao, Y. Margin preserving self-paced contrastive learning towards domain adaptation for medical image segmentation. IEEE J. Biomed. Health Inform. 2022, 26, 638–647. [Google Scholar] [CrossRef]
  13. Bateson, M.; Kervadec, H.; Dolz, J.; Lombaert, H.; Ayed, I.B. Source-free domain adaptation for image segmentation. Med Image Anal. 2022, 82, 102617. [Google Scholar] [CrossRef]
  14. Stan, S.; Rostami, M. Domain Adaptation for the Segmentation of Confidential Medical Images. arXiv 2021, arXiv:2101.00522. [Google Scholar]
  15. Yao, K.; Su, Z.; Huang, K.; Yang, X.; Sun, J.; Hussain, A.; Coenen, F. A novel 3D unsupervised domain adaptation framework for cross-modality medical image segmentation. IEEE J. Biomed. Health Inform. 2022, 26, 4976–4986. [Google Scholar] [CrossRef]
  16. Zhang, H.; Fromont, E.; Lefevre, S.; Avignon, B. Multispectral fusion for object detection with cyclic fuse-and-refine blocks. In Proceedings of the 2020 IEEE International Conference on Image Processing (ICIP), Abu Dhabi, United Arab Emirates, 25–28 October 2020; pp. 276–280. [Google Scholar]
  17. Cong, R.; Lei, J.; Fu, H.; Huang, Q.; Cao, X.; Ling, N. HSCS: Hierarchical sparsity based co-saliency detection for RGBD images. IEEE Trans. Multimed. 2018, 21, 1660–1671. [Google Scholar] [CrossRef]
  18. Fu, K.; Fan, D.P.; Ji, G.P.; Zhao, Q. JL-DCF: Joint learning and densely-cooperative fusion framework for RGB-D salient object detection. In Proceedings of the IEEE/CVF Conference on Computer Vision and Pattern Recognition, Seattle, WA, USA, 13–19 June 2020; pp. 3052–3062. [Google Scholar]
  19. Liu, Z.; Shi, S.; Duan, Q.; Zhang, W.; Zhao, P. Salient object detection for RGB-D image by single stream recurrent convolution neural network. Neurocomputing 2019, 363, 46–57. [Google Scholar] [CrossRef]
  20. Fan, X.; Liu, Z.; Sun, G. Salient region detection for stereoscopic images. In Proceedings of the 2014 19th International Conference on Digital Signal Processing, Hong Kong, China, 20–23 August 2014; pp. 454–458. [Google Scholar]
  21. Wang, N.; Gong, X. Adaptive fusion for RGB-D salient object detection. IEEE Access 2019, 7, 55277–55284. [Google Scholar] [CrossRef]
  22. Chen, Z.; Cong, R.; Xu, Q.; Huang, Q. DPANet: Depth potentiality-aware gated attention network for RGB-D salient object detection. IEEE Trans. Image Process. 2020, 30, 7012–7024. [Google Scholar] [CrossRef]
  23. Li, C.; Cong, R.; Kwong, S.; Hou, J.; Fu, H.; Zhu, G.; Zhang, D.; Huang, Q. ASIF-Net: Attention steered interweave fusion network for RGB-D salient object detection. IEEE Trans. Cybern. 2020, 51, 88–100. [Google Scholar] [CrossRef]
  24. Ju, R.; Ge, L.; Geng, W.; Ren, T.; Wu, G. Depth saliency based on anisotropic center-surround difference. In Proceedings of the 2014 IEEE international conference on image processing (ICIP), Paris, France, 27–30 October 2014; pp. 1115–1119. [Google Scholar]
  25. Fan, D.P.; Lin, Z.; Zhang, Z.; Zhu, M.; Cheng, M.M. Rethinking RGB-D salient object detection: Models, data sets, and large-scale benchmarks. IEEE Trans. Neural Netw. Learn. Syst. 2020, 32, 2075–2089. [Google Scholar] [CrossRef]
  26. Zhang, M.; Ren, W.; Piao, Y.; Rong, Z.; Lu, H. Select, supplement and focus for RGB-D saliency detection. In Proceedings of the IEEE/CVF Conference on Computer Vision and Pattern Recognition, Seattle, WA, USA, 13–19 June 2020; pp. 3472–3481. [Google Scholar]
  27. Chen, Q.; Fu, K.; Liu, Z.; Chen, G.; Du, H.; Qiu, B.; Shao, L. EF-Net: A novel enhancement and fusion network for RGB-D saliency detection. Pattern Recognit. 2021, 112, 107740. [Google Scholar] [CrossRef]
  28. Pang, Y.; Zhang, L.; Zhao, X.; Lu, H. Hierarchical dynamic filtering network for rgb-d salient object detection. In Proceedings of the European Conference on Computer Vision, Glasgow, UK, 23–28 August 2020; pp. 235–252. [Google Scholar]
  29. Chen, C.; Wei, J.; Peng, C.; Qin, H. Depth-quality-aware salient object detection. IEEE Trans. Image Process. 2021, 30, 2350–2363. [Google Scholar] [CrossRef]
  30. Zhang, W.; Jiang, Y.; Fu, K.; Zhao, Q. BTS-Net: Bi-directional transfer-and-selection network for RGB-D salient object detection. In Proceedings of the 2021 IEEE International Conference on Multimedia and Expo (ICME), Shenzhen, China, 5–9 July 2021; IEEE: Piscataway, NJ, USA, 2021; pp. 1–6. [Google Scholar]
  31. Li, G.; Liu, Z.; Chen, M.; Bai, Z.; Lin, W.; Ling, H. Hierarchical alternate interaction network for RGB-D salient object detection. IEEE Trans. Image Process. 2021, 30, 3528–3542. [Google Scholar] [CrossRef] [PubMed]
  32. Zhai, Y.; Fan, D.P.; Yang, J.; Borji, A.; Shao, L.; Han, J.; Wang, L. Bifurcated backbone strategy for RGB-D salient object detection. IEEE Trans. Image Process. 2021, 30, 8727–8742. [Google Scholar] [CrossRef] [PubMed]
  33. Hou, Q.; Cheng, M.M.; Hu, X.; Borji, A.; Tu, Z.; Torr, P.H. Deeply supervised salient object detection with short connections. In Proceedings of the IEEE Conference on Computer Vision and Pattern Recognition, Honolulu, HI, USA, 21–26 July 2017; pp. 3203–3212. [Google Scholar]
  34. Chen, H.; Li, Y. Progressively complementarity-aware fusion network for RGB-D salient object detection. In Proceedings of the IEEE Conference on Computer Vision and Pattern Recognition, Salt Lake City, UT, USA, 18–23 June 2018; pp. 3051–3060. [Google Scholar]
  35. Chen, H.; Li, Y. Three-stream attention-aware network for RGB-D salient object detection. IEEE Trans. Image Process. 2019, 28, 2825–2835. [Google Scholar] [CrossRef] [PubMed]
  36. Piao, Y.; Ji, W.; Li, J.; Zhang, M.; Lu, H. Depth-induced multi-scale recurrent attention network for saliency detection. In Proceedings of the IEEE/CVF International Conference on Computer Vision, Seoul, Repulic of Korea, 27 October–2 November 2019; pp. 7254–7263. [Google Scholar]
  37. Liu, Z.; Wang, Y.; Tu, Z.; Xiao, Y.; Tang, B. TriTransNet: RGB-D salient object detection with a triplet transformer embedding network. In Proceedings of the 29th ACM International Conference on Multimedia, Chengdu, China, 20–24 October 2021; pp. 4481–4490. [Google Scholar]
  38. Li, G.; Liu, Z.; Ling, H. ICNet: Information conversion network for RGB-D based salient object detection. IEEE Trans. Image Process. 2020, 29, 4873–4884. [Google Scholar] [CrossRef] [PubMed]
  39. Qin, X.; Zhang, Z.; Huang, C.; Gao, C.; Dehghan, M.; Jagersand, M. Basnet: Boundary-aware salient object detection. In Proceedings of the IEEE/CVF Conference on Computer Vision and Pattern Recognition, Long Beach, CA, USA, 15–20 June 2019; pp. 7479–7489. [Google Scholar]
  40. Cong, R.; Lin, Q.; Zhang, C.; Li, C.; Cao, X.; Huang, Q.; Zhao, Y. CIR-Net: Cross-modality interaction and refinement for RGB-D salient object detection. IEEE Trans. Image Process. 2022, 31, 6800–6815. [Google Scholar] [CrossRef]
  41. Wu, Y.H.; Liu, Y.; Xu, J.; Bian, J.W.; Gu, Y.C.; Cheng, M.M. MobileSal: Extremely efficient RGB-D salient object detection. IEEE Trans. Pattern Anal. Mach. Intell. 2021, 44, 10261–10269. [Google Scholar] [CrossRef]
  42. Wu, Z.; Su, L.; Huang, Q. Cascaded partial decoder for fast and accurate salient object detection. In Proceedings of the IEEE/CVF Conference on Computer Vision and Pattern Recognition, Long Beach, CA, USA, 15–20 June 2019; pp. 3907–3916. [Google Scholar]
  43. Liu, J.J.; Hou, Q.; Cheng, M.M.; Feng, J.; Jiang, J. A simple pooling-based design for real-time salient object detection. In Proceedings of the IEEE/CVF Conference on computer VISION and Pattern Recognition, Long Beach, CA, USA, 15–20 June 2019; pp. 3917–3926. [Google Scholar]
  44. Wang, T.; Zhang, L.; Wang, S.; Lu, H.; Yang, G.; Ruan, X.; Borji, A. Detect globally, refine locally: A novel approach to saliency detection. In Proceedings of the IEEE Conference on Computer Vision and Pattern Recognition, Salt Lake City, UT, USA, 18–22 June 2018; pp. 3127–3135. [Google Scholar]
  45. He, K.; Zhang, X.; Ren, S.; Sun, J. Deep residual learning for image recognition. In Proceedings of the IEEE Conference on Computer Vision and Pattern Recognition, Las Vegas, NV, USA, 27–30 June 2016; pp. 770–778. [Google Scholar]
  46. Woo, S.; Park, J.; Lee, J.Y.; Kweon, I.S. Cbam: Convolutional block attention module. In Proceedings of the European Conference on Computer Vision (ECCV), Munich, Germany, 8–14 September 2018; pp. 3–19. [Google Scholar]
  47. Zhou, B.; Khosla, A.; Lapedriza, A.; Oliva, A.; Torralba, A. Learning deep features for discriminative localization. In Proceedings of the IEEE Conference on Computer Vision and Pattern Recognition, Las Vegas, NV, USA, 27–30 June 2016; pp. 2921–2929. [Google Scholar]
  48. Chen, L.; Zhang, H.; Xiao, J.; Nie, L.; Shao, J.; Liu, W.; Chua, T.S. Sca-cnn: Spatial and channel-wise attention in convolutional networks for image captioning. In Proceedings of the IEEE Conference on Computer Vision and Pattern Recognition, Honolulu, HI, USA, 21–26 July 2017; pp. 5659–5667. [Google Scholar]
  49. Liu, S.; Huang, D. Receptive field block net for accurate and fast object detection. In Proceedings of the European Conference on Computer Vision (ECCV), Munich, Germany, 8–14 September 2018; pp. 385–400. [Google Scholar]
  50. Zhao, Z.; Xia, C.; Xie, C.; Li, J. Complementary trilateral decoder for fast and accurate salient object detection. In Proceedings of the 29th ACM International Conference on Multimedia, Chengdu, China, 20–24 October 2021; pp. 4967–4975. [Google Scholar]
  51. De Boer, P.T.; Kroese, D.P.; Mannor, S.; Rubinstein, R.Y. A tutorial on the cross-entropy method. Ann. Oper. Res. 2005, 134, 19–67. [Google Scholar] [CrossRef]
  52. Peng, H.; Li, B.; Xiong, W.; Hu, W.; Ji, R. RGBD salient object detection: A benchmark and algorithms. In Proceedings of the European Conference on Computer Vision, Zurich, Switzerland, 6–12 September 2014; pp. 92–109. [Google Scholar]
  53. Niu, Y.; Geng, Y.; Li, X.; Liu, F. Leveraging stereopsis for saliency analysis. In Proceedings of the 2012 IEEE Conference on Computer Vision and Pattern Recognition, Providence, RI, USA, 16–21 June 2012; pp. 454–461. [Google Scholar]
  54. Cheng, Y.; Fu, H.; Wei, X.; Xiao, J.; Cao, X. Depth enhanced saliency detection method. In Proceedings of the International Conference on Internet Multimedia Computing and Service, Xiamen, China, 10–12 July 2014; pp. 23–27. [Google Scholar]
  55. Ji, W.; Yan, G.; Li, J.; Piao, Y.; Yao, S.; Zhang, M.; Cheng, L.; Lu, H. Dmra: Depth-induced multi-scale recurrent attention network for rgb-d saliency detection. IEEE Trans. Image Process. 2022, 31, 2321–2336. [Google Scholar] [CrossRef]
  56. Zhao, J.X.; Cao, Y.; Fan, D.P.; Cheng, M.M.; Li, X.Y.; Zhang, L. Contrast prior and fluid pyramid integration for RGBD salient object detection. In Proceedings of the IEEE/CVF Conference on Computer Vision and Pattern Recognition, Long Beach, CA, USA, 16–17 June 2019; pp. 3927–3936. [Google Scholar]
  57. Perazzi, F.; Krähenbühl, P.; Pritch, Y.; Hornung, A. Saliency filters: Contrast based filtering for salient region detection. In Proceedings of the 2012 IEEE Conference on Computer Vision and Pattern Recognition, Providence, RI, USA, 16–21 June 2012; pp. 733–740. [Google Scholar]
  58. Fan, D.P.; Cheng, M.M.; Liu, Y.; Li, T.; Borji, A. Structure-measure: A new way to evaluate foreground maps. In Proceedings of the IEEE International Conference on Computer Vision, Venice, Italy, 22–29 October 2017; pp. 4548–4557. [Google Scholar]
  59. Achanta, R.; Hemami, S.; Estrada, F.; Susstrunk, S. Frequency-tuned salient region detection. In Proceedings of the 2009 IEEE Conference on Computer Vision and Pattern Recognition, Miami, FL, USA, 20–25 June 2009; pp. 1597–1604. [Google Scholar]
  60. Fan, D.P.; Gong, C.; Cao, Y.; Ren, B.; Cheng, M.M.; Borji, A. Enhanced-alignment Measure for Binary Foreground Map Evaluation. In Proceedings of the IJCAI, Stockholm, Sweden, 13–19 July 2018. [Google Scholar]
  61. Borji, A.; Cheng, M.M.; Jiang, H.; Li, J. Salient object detection: A benchmark. IEEE Trans. Image Process. 2015, 24, 5706–5722. [Google Scholar] [CrossRef]
  62. Deng, J.; Dong, W.; Socher, R.; Li, L.J.; Li, K.; Fei-Fei, L. Imagenet: A large-scale hierarchical image database. In Proceedings of the 2009 IEEE Conference on Computer Vision and Pattern Recognition, Miami, FL, USA, 20–25 June 2009; pp. 248–255. [Google Scholar]
  63. Kingma, D.P.; Ba, J. Adam: A Method for Stochastic Optimization. In Proceedings of the ICLR (Poster), San Diego, CA, USA, 7–9 May 2015. [Google Scholar]
  64. Paszke, A.; Gross, S.; Massa, F.; Lerer, A.; Bradbury, J.; Chanan, G.; Killeen, T.; Lin, Z.; Gimelshein, N.; Antiga, L.; et al. Pytorch: An imperative style, high-performance deep learning library. Adv. Neural Inf. Process. Syst. 2019, 32. [Google Scholar] [CrossRef]
  65. Wang, X.; Li, S.; Chen, C.; Fang, Y.; Hao, A.; Qin, H. Data-level recombination and lightweight fusion scheme for RGB-D salient object detection. IEEE Trans. Image Process. 2020, 30, 458–471. [Google Scholar] [CrossRef]
  66. Ji, W.; Li, J.; Zhang, M.; Piao, Y.; Lu, H. Accurate RGB-D salient object detection via collaborative learning. In Proceedings of the European Conference on Computer Vision, Glasgow, UK, 23–28 August 2020; pp. 52–69. [Google Scholar]
  67. Chen, H.; Deng, Y.; Li, Y.; Hung, T.Y.; Lin, G. RGBD salient object detection via disentangled cross-modal fusion. IEEE Trans. Image Process. 2020, 29, 8407–8416. [Google Scholar] [CrossRef]
  68. Piao, Y.; Rong, Z.; Zhang, M.; Ren, W.; Lu, H. A2dele: Adaptive and attentive depth distiller for efficient RGB-D salient object detection. In Proceedings of the IEEE/CVF Conference on Computer Vision and Pattern Recognition, Seattle, WA, USA, 13–19 June 2020; pp. 9060–9069. [Google Scholar]
  69. Zhao, X.; Zhang, L.; Pang, Y.; Lu, H.; Zhang, L. A single stream network for robust and real-time RGB-D salient object detection. In Proceedings of the European Conference on Computer Vision, Glasgow, UK, 23–28 August 2020; pp. 646–662. [Google Scholar]
  70. Jin, W.D.; Xu, J.; Han, Q.; Zhang, Y.; Cheng, M.M. CDNet: Complementary depth network for RGB-D salient object detection. IEEE Trans. Image Process. 2021, 30, 3376–3390. [Google Scholar] [CrossRef]
  71. Sun, P.; Zhang, W.; Wang, H.; Li, S.; Li, X. Deep RGB-D saliency detection with depth-sensitive attention and automatic multi-modal fusion. In Proceedings of the IEEE/CVF Conference on Computer Vision and Pattern Recognition, Nashville, TN, USA, 20–25 June 2021; pp. 1407–1417. [Google Scholar]
Figure 1. The objects are not salient in the depth maps. The 1st, 2nd, and 3rd columns denote RGB, depth, and ground truth images, respectively.
Remotesensing 15 02393 g001
Figure 2. The illustration of features generated from a U-shape structure decoder. ‘RGB’, ‘Depth’, and ‘GT’ are the raw image. ‘Level-3’, ‘Level-2’, and ‘Level-1’ denote the 3rd, 2nd, and 1st level features generated from a U-shape structure decoder, in a coarse-to-fine fashion. In the low-level features, the background distractors cannot be effectively suppressed and the object region cannot be highlighted.
Remotesensing 15 02393 g002
Figure 3. The overall framework of the proposed CAF-HMNet. It is an encoder–decoder architecture. The proposed RCDA is embedded in the decoder which is used for multi-modal feature fusion. The HMD decoder is used to aggregate the multi-level features.
Remotesensing 15 02393 g003
Figure 4. Architecture of the RGB compensated depth channel attention module.
Remotesensing 15 02393 g004
Figure 5. Visual comparison of the features x i e _ d without RGB compensation (w/o RGB Comp.) and features x i e _ d with RGB compensation (w/RGB Comp.) in the RCDA module.
Remotesensing 15 02393 g005
Figure 6. Structure of the hierarchical multiplication decoder. ‘G’ represents global context block. ⊙ and © denote element-wise multiplication and concatenation of features, respectively.
Remotesensing 15 02393 g006
Figure 7. Visual comparison of features. B/Mul. = Before Multiplication; A/Mul. = After Multiplication. The features are relatively coarse before multiplication and the features are finer after multiplication. This shows that our hierarchical multiplication strategy can refine the features from coarse to fine.
Remotesensing 15 02393 g007
Figure 8. Visual comparison with other state-of-the-art models. Different from other models, the proposed method locates the salient object accurately with fewer background distractors in different scenarios, including (a) poor-quality depth maps, (b) small objects, (c) slim structures, (d) low-contrast scenes, and (e) complex scenes.
Remotesensing 15 02393 g008
Figure 9. Visual comparison of gradually adding different modules. ‘B’, ‘B + RCDA’, ‘B + HMD’, and ‘B + RCDA + HMD’ denote the corresponding row of Table 3. Column 4 ‘B’ denotes the predictions of baseline. Column 5 ‘B+RCDA’ represents the output of baseline with RCDA module. ‘B+HMD’ and ‘B+RCDA+HMD’ mean the predictions of baseline with HMD, and baseline with both the RCDA module and HMD, respectively.
Remotesensing 15 02393 g009
Figure 10. The comparison of the visual predicted maps with CAM (w/CAM) and features without CAM (w/o CAM).
Remotesensing 15 02393 g010
Figure 11. Visual comparison of Concatenated features with hierarchical Multiplication (C/w/Mul.) and Concatenated features without hierarchical Multiplication (C/w/o Mul.).
Remotesensing 15 02393 g011
Table 1. Quantitative evaluation of the proposed model with different methods, using S-measure ( S α ) , max F-measure ( F β ) , max E-measure ( E ξ ) , and MAE (M) scores on five datasets. ↑ (↓) means that the higher (lower) the better. We highlight the best performance in each row with bold font.
DatasetsMetricTANet
TIP19 [35]
DMRA
ICCV19 [36]
SSF
CVPR20 [26]
DRLF
TIP20 [65]
CoNet
ECCV20 [66]
DCMF
TIP20 [67]
A2dele
CVPR20 [68]
D3Net
TNNLS20 [25]
ICNet
TIP20 [38]
DANet
ECCV20 [69]
BBSNet
ECCV20 [32]
CDNet
TIP21 [70]
DSA2F
CVPR21 [71]
Ours
NJU2K S α 0.8780.8860.8990.8860.8940.8890.8690.9000.8940.8990.9170.8850.9040.922
F β 0.8740.8860.8860.8830.8720.8590.8740.9000.8680.8710.8990.8660.8980.923
E ξ 0.9250.9270.9130.9260.9120.8970.8970.9500.9050.9080.9170.9110.9220.953
M 0.0600.0510.0430.0550.0470.0520.0510.0410.0520.0450.0370.0480.0390.034
NLPR S α 0.8860.8990.9140.9030.9070.9000.8960.9120.9230.9200.9240.9020.9180.937
F β 0.8630.8790.8750.8800.8480.8390.8780.8970.8700.8750.8800.8480.8920.929
E ξ 0.9410.9470.9490.9390.9360.9330.9450.9530.9440.9510.9540.9350.9500.969
M 0.0410.0310.0260.0320.0310.0350.0280.0300.0280.0270.0250.0320.0240.020
STERE S α 0.8710.8350.8870.8880.9080.8830.8780.8990.9030.9010.9010.8960.8970.909
F β 0.8610.8470.8670.8780.8850.8410.8740.8910.8650.8680.8760.8730.8930.906
E ξ 0.9230.9110.9210.9290.9230.9040.9150.9380.9150.9210.9200.9220.9270.946
M 0.0600.0660.0460.0500.0410.0540.0440.0460.0450.0430.0430.0420.0390.039
DES S α 0.8580.9000.9050.8950.9100.8770.8850.8980.9200.9240.9180.8750.9160.924
F β 0.8270.8880.8760.8690.8610.8200.8650.8850.8890.8990.8710.8390.9010.920
E ξ 0.9100.9430.9480.9400.9450.9230.9220.9460.9590.9680.9510.9210.9550.961
M 0.0460.0300.0250.0300.0270.0400.0280.0310.0270.0230.0250.0340.0230.022
SIP S α 0.8350.8060.8680.8500.8580.8590.8260.8600.8540.8750.8790.8230.8620.883
F β 0.8300.8210.8510.8130.8420.8190.8250.8610.8360.8550.8830.8050.8650.892
E ξ 0.8950.8750.9110.8910.9090.8980.8920.9090.8990.9140.9220.8800.9080.926
M 0.0750.0850.0560.0710.0630.0680.0700.0630.0690.0540.0550.0760.0570.050
Table 2. The experimental results of repeated experiments under the same setting. No. x denotes the x-th time experimental results. AP = Average Performance and SD = Standard Deviation.
ModelsNJU2KNLPRSTERE
S α F β E ξ M S α F β E ξ M S α F β E ξ M
No. 10.9220.9230.9530.0340.9370.9290.9690.0200.9090.9060.9460.039
No. 20.9220.9240.9540.0330.9300.9170.9620.0230.9080.9030.9430.040
No. 30.9220.9210.9520.0340.9300.9180.9650.0220.9050.9000.9400.041
No. 40.9240.9250.9540.0330.9320.9230.9670.0220.9040.8970.9380.042
AP0.9230.9230.9530.0340.9320.9220.9660.0220.9070.9040.9420.041
SD0.000870.001480.000830.000500.002860.004760.002590.001090.002060.004150.003030.00112
Table 3. The ablation experiments of different modules. B = Baseline, RCDA = RGB Compensated Depth Attention Module; HMD = Hierarchical Multiplication Decoder.
ModelsNJU2KNLPRSTERESIP
S α F β E ξ M S α F β E ξ M S α F β E ξ M S α F β E ξ M
B0.9110.9080.9430.0380.9240.9100.9550.0260.8910.8850.9330.0480.8670.8700.9070.062
B + RCDA0.9190.9170.9480.0360.9290.9180.9610.0240.9070.9020.9440.0410.8810.8870.9200.054
B + HMD0.9200.9190.9500.0360.9300.9210.9660.0230.8950.8860.9330.0470.8780.8840.9190.055
B + RCDA + HMD0.9200.9220.9500.0350.9310.9210.9620.0240.9070.9010.9420.0410.8840.8890.9240.052
Table 4. The ablation experiments of different RCDA strategies. ‘RCDA’ denotes our method and ‘RCDA + MaxPooling’ denotes that maximum pooling is included in our RCDA module.
ModelsNJU2KNLPRSTEREFLOPs (G)
S α F β E ξ M S α F β E ξ M S α F β E ξ M
RCDA0.9220.9230.9530.0340.9370.9290.9690.0200.9090.9060.9460.03943.14
RCDA + MaxPooling0.9220.9240.9530.0340.9300.9170.9600.0240.9060.9020.9430.04043.15
Disclaimer/Publisher’s Note: The statements, opinions and data contained in all publications are solely those of the individual author(s) and contributor(s) and not of MDPI and/or the editor(s). MDPI and/or the editor(s) disclaim responsibility for any injury to people or property resulting from any ideas, methods, instructions or products referred to in the content.

