4.1. Single-Source High-Resolution Remote Sensing Images Building Change Detection
Based on multiple dataset combinations in the MS-HS BCD dataset, this paper first performs change detection of single-source high-resolution remote sensing images, with the data source being the three-band GF-1 RGB images (
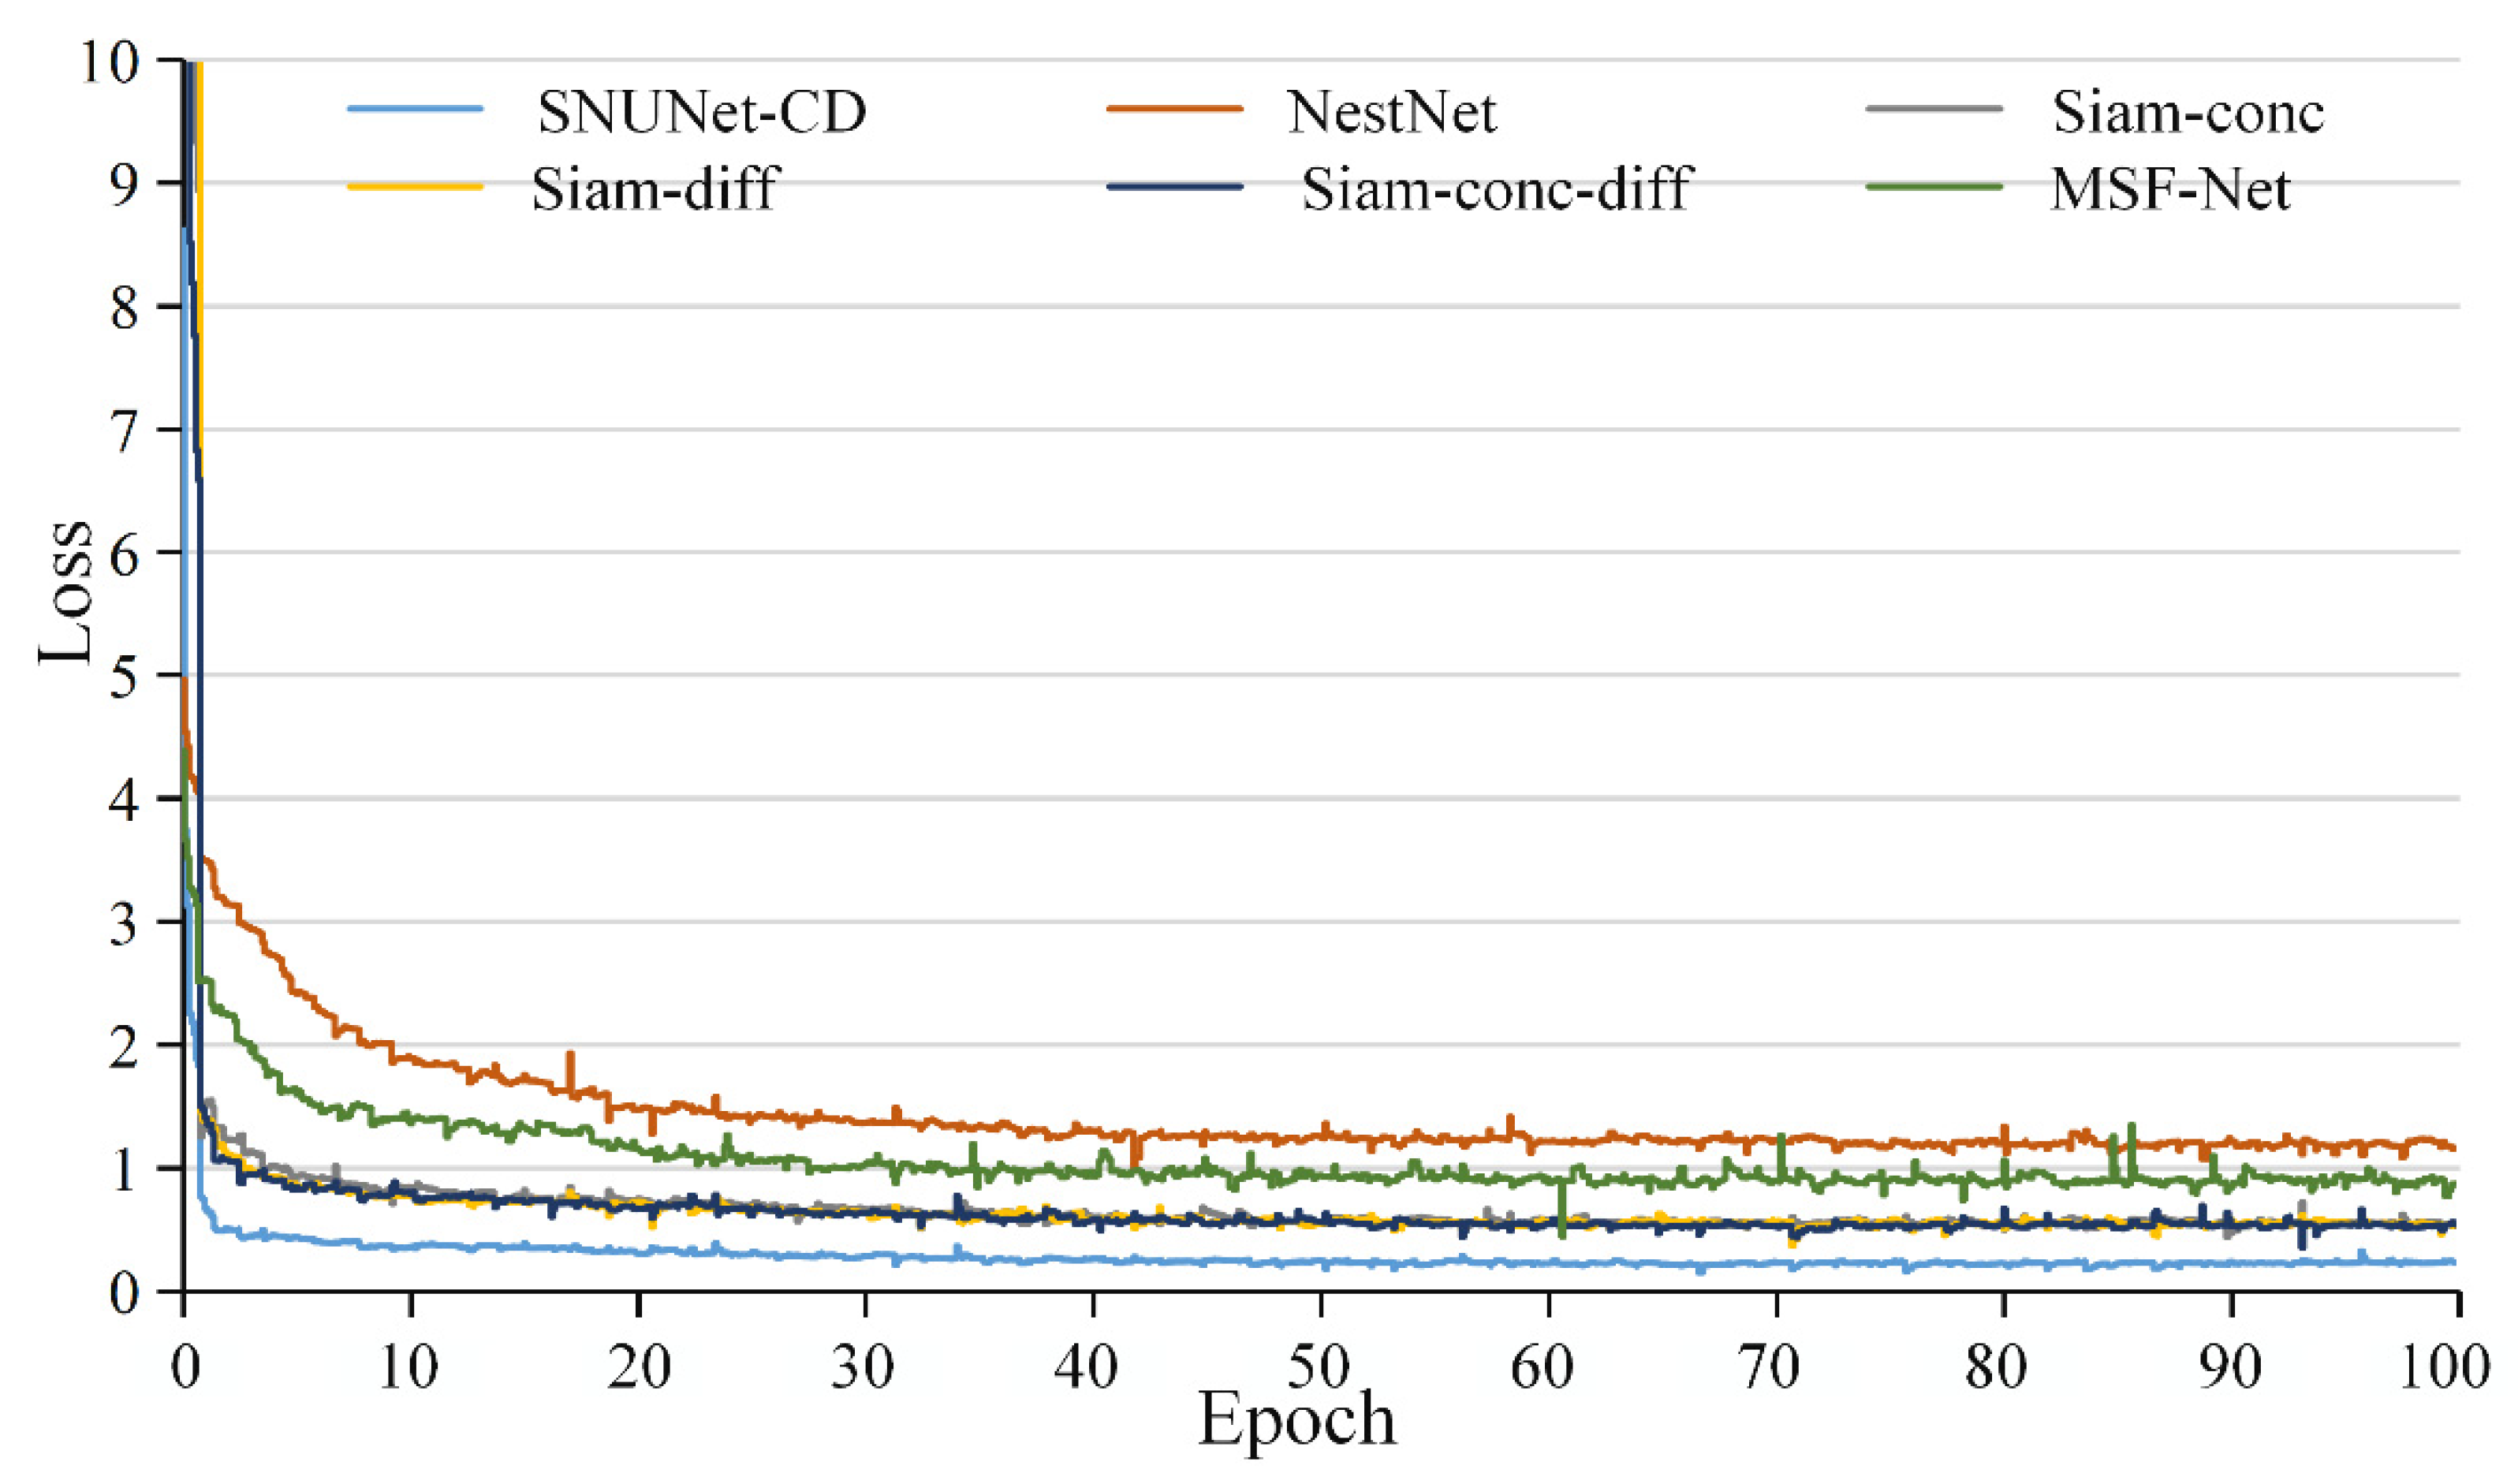
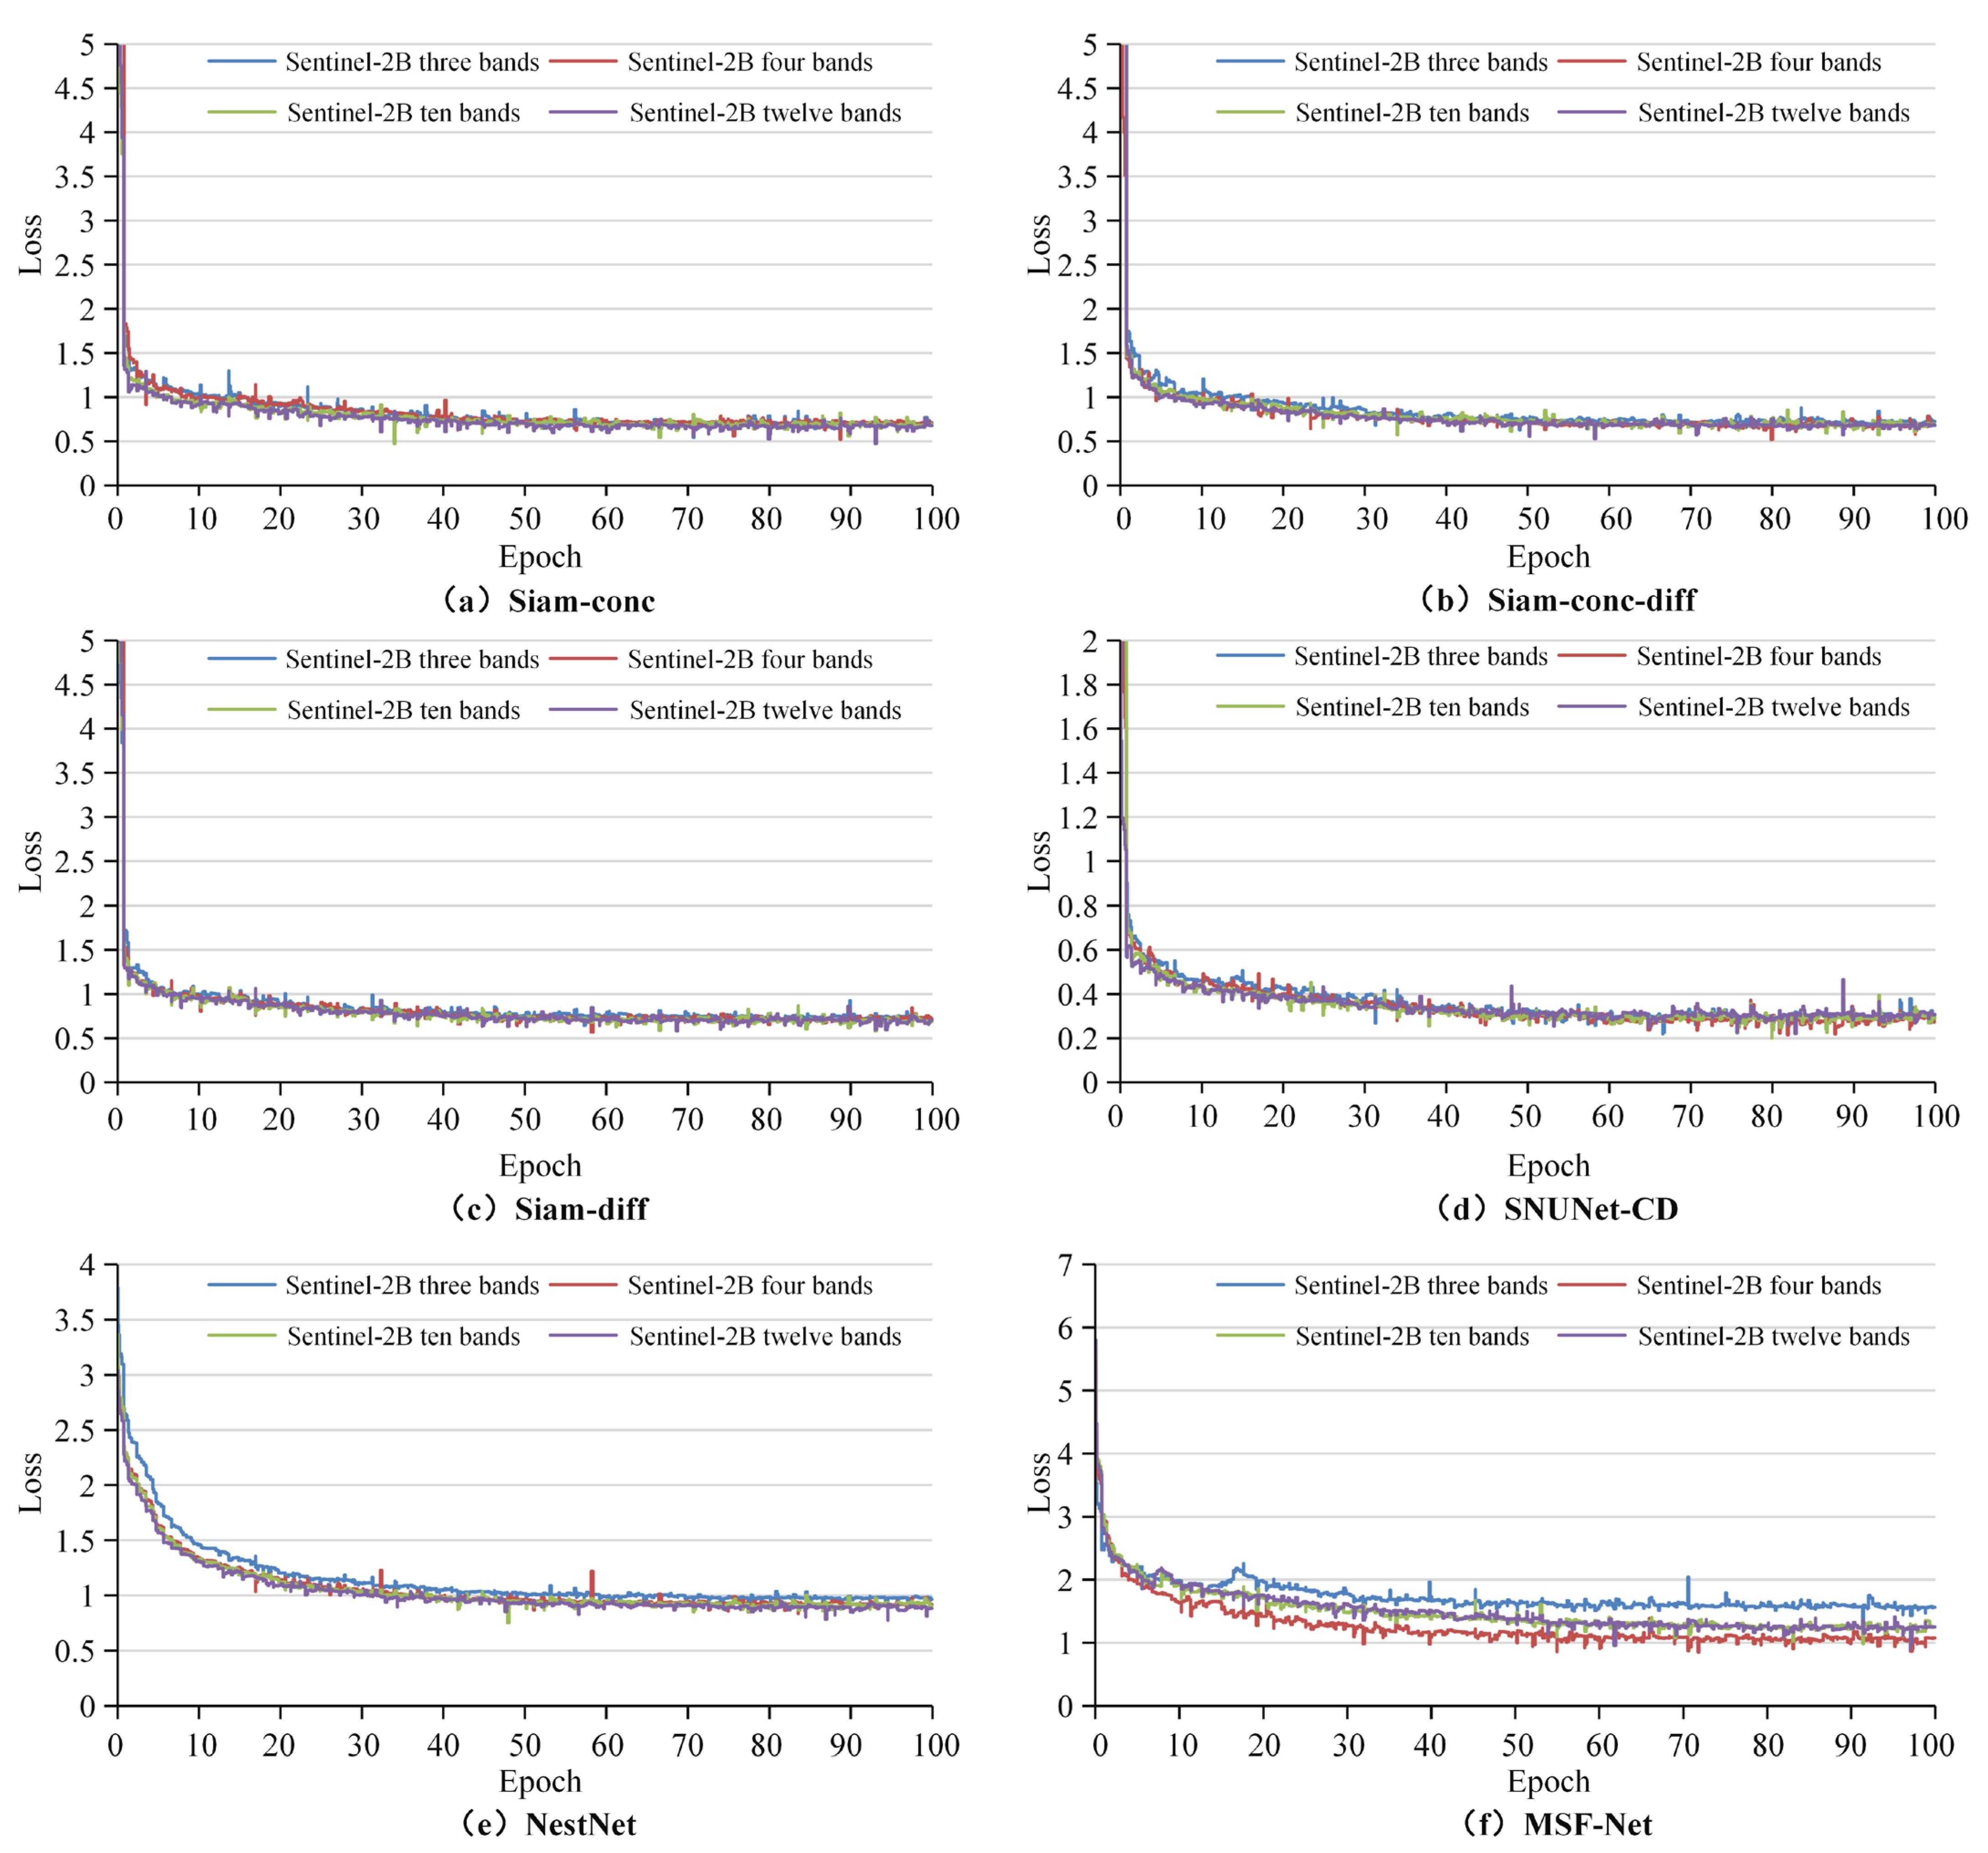
Table 3). The training loss curves for the six network structures are shown in
Figure 7; the losses of the six network models remained flat after epoch50, with NestNet having the highest loss and SNUNet-CD having the lowest loss. The detection results of the six network models are shown in
Table 12 and
Figure 8.
From
Table 12, the experimental results show that the MSF-Net algorithm performs the best, with the four metrics of precision, recall, F1-score, and IOU reaching 61.1%, 65.02%, 58.55%, and 43.31%, respectively. These results are 11.03%, 10.25%, 10.53%, and 8.24%, respectively, higher than those of the Siam-diff algorithm, which performs the best among the other advanced model algorithms. The worst performing algorithm is NestNet, with an F1-score and IOU of only 43.84% and 30.96%, respectively, but its recall index improves significantly compared with other network models, reaching 60.46%.
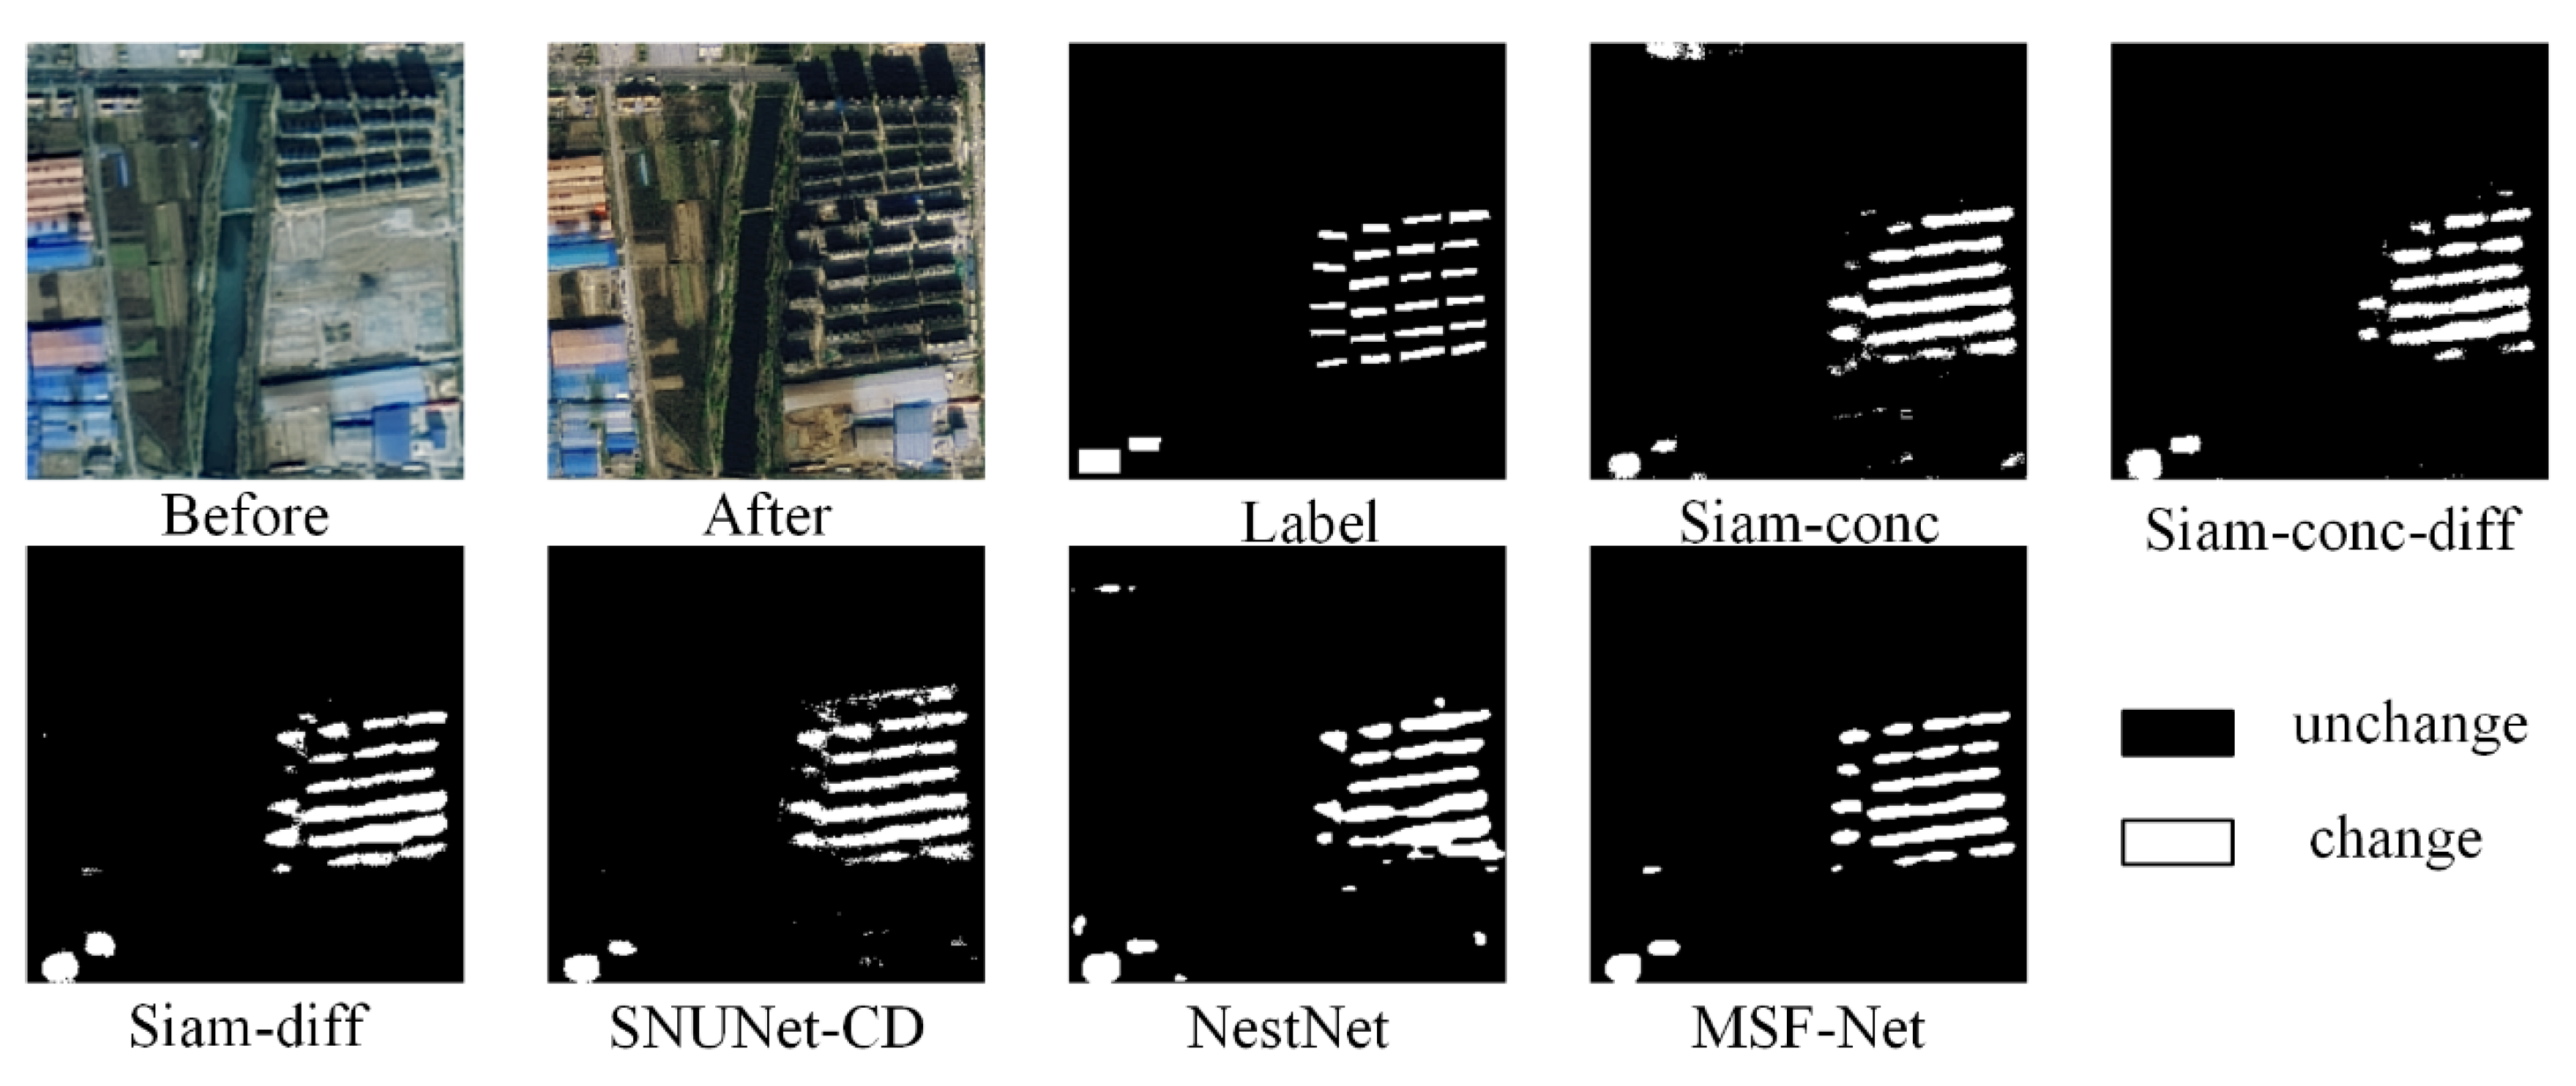
Figure 8.
Building change detection results of single-source high-resolution images.
Figure 8.
Building change detection results of single-source high-resolution images.
Figure 8 shows that the Siam-conc and SNUNet-CD algorithms have more false detection areas, and the detected change buildings are unclear with more broken edges. The changed buildings detected by Siam-conc-diff and NestNet are not complete enough, and the information extraction ability of changed buildings is not enough. The detection results of Siam-diff are slightly better than those of the remaining four advanced algorithms, but the detected building boundaries are still incomplete and blurred. It can be seen that MSF-Net improves compared with other models, the false detection phenomenon is lower, the detected changed buildings are more complete, and the boundaries are clearer.
4.2. Single-Source Multispectral Remote Sensing Images Building Change Detection
Using the annotated MS-HS BCD dataset, building change detection of single-source multispectral images are investigated and experiments are conducted using six network models based on the four multispectral band combinations designed (
Table 4,
Table 5,
Table 6 and
Table 7). The training loss curves for the six network structures are shown in
Figure 9; NestNet and MSF-Net remained flat after epoch60 and the other models remained flat after epoch50. The detection results are shown in
Table 13,
Table 14,
Table 15,
Table 16,
Table 17 and
Table 18.
Table 13 shows the experimental results of the Siam-conc network under four multispectral image data combinations; it works best when the input data are in three bands, with the F1-score and IOU reaching 47.79% and 33.98%, respectively. The network becomes less effective after adding spectral features in multiple bands, indicating that this network cannot utilize more spectral features well, and the addition of low-resolution spectral features reduces the network effectiveness.
Table 14.
Siam-conc-diff building change detection results of multispectral images.
Table 14.
Siam-conc-diff building change detection results of multispectral images.
| Band | Precision | Recall | F1-Score | IOU |
|---|
| Sentinel-2B three bands (Table 4) | 49.82% | 52.36% | 47.89% | 34.46% |
| Sentinel-2B four bands (Table 5) | 43.33% | 59.42% | 45.48% | 32.25% |
| Sentinel-2B ten bands (Table 6) | 45.43% | 55.34% | 45.79% | 32.37% |
| Sentinel-2B twelve bands (Table 7) | 44.17% | 63.17% | 45.24% | 31.64% |
Table 14 shows the experimental results of the Siam-conc-diff network under four multispectral image data combinations; it can be concluded that the Siam-conc-diff model similarly achieves the best results for three-band input data, with the F1-score and IOU reaching 47.89% and 34.46%, respectively, and the low-resolution spectral features reduce the network detection when the spectral bands of the input data increase.
Table 15.
Siam-diff building change detection results of multispectral images.
Table 15.
Siam-diff building change detection results of multispectral images.
| Band | Precision | Recall | F1-Score | IOU |
|---|
| Sentinel-2B three bands (Table 4) | 44.76% | 58.24% | 46.64% | 33.81% |
| Sentinel-2B four bands (Table 5) | 44.55% | 57.73% | 44.16% | 31.22% |
| Sentinel-2B ten bands (Table 6) | 48.09% | 59.65% | 49.51% | 35.15% |
| Sentinel-2B twelve bands (Table 7) | 43.17% | 56.22% | 42.56% | 29.64% |
Table 15 shows the experimental results of the Siam-diff network under four multispectral image data combinations; the Siam-diff network performs best when the number of input bands is ten and the precision, recall, F1-score, and IOU are all the highest, reaching 48.09%, 59.65%, 49.51%, and 35.15%, respectively. This indicates that after increasing the spectral bands, Siam-diff learns more spectral features and improves the network detection effectiveness, but the network effectiveness decreases after continuing to increase the 60 m/pixel resolution band, indicating that the too low-resolution affects the network detection effect.
Table 16.
SNUNet-CD building change detection results of multispectral images.
Table 16.
SNUNet-CD building change detection results of multispectral images.
| Band | Precision | Recall | F1-Score | IOU |
|---|
| Sentinel-2B three bands (Table 4) | 49.53% | 55.27% | 48.41% | 34.95% |
| Sentinel-2B four bands (Table 5) | 47.44% | 62.95% | 48.77% | 34.88% |
| Sentinel-2B ten bands (Table 6) | 51.14% | 52.24% | 44.8% | 30.95% |
| Sentinel-2B twelve bands (Table 7) | 50.82% | 58.91% | 50.08% | 36.19% |
Table 16 shows the experimental results of the SNUNet-CD network under four multispectral image data combinations; SNUNet-CD achieves optimal results when the input data are twelve bands, with the F1-score and IOU reaching 50.08% and 36.19%, respectively. This indicates that the attention mechanism designed at the output side can acquire building change characteristics at different scales and improve the detection effectiveness after inputting data from multiple resolution bands.
Table 17.
NestNet building change detection results of multispectral images.
Table 17.
NestNet building change detection results of multispectral images.
| Band | Precision | Recall | F1-Score | IOU |
|---|
| Sentinel-2B three bands (Table 4) | 49.37% | 58.92% | 49.73% | 35.84% |
| Sentinel-2B four bands (Table 5) | 45.02% | 56.99% | 45.63% | 32.75% |
| Sentinel-2B ten bands (Table 6) | 43.83% | 56.76% | 42.8% | 30.13% |
| Sentinel-2B twelve bands (Table 7) | 47.29% | 60.22% | 44.79% | 31.74% |
Table 17 shows the experimental results of the NestNet network under four multispectral image data combinations; NestNet achieves the best results with only three bands, with the F1-score and IOU reaching 49.73% and 35.84%, respectively. Adding more data bands, the network became less effective, indicating that this network is not capable of handling more data bands.
Table 18.
MSF-Net building change detection results of multispectral images.
Table 18.
MSF-Net building change detection results of multispectral images.
| Band | Precision | Recall | F1-Score | IOU |
|---|
| Sentinel-2B three bands (Table 4) | 51.78% | 55.6% | 48.75% | 35.43% |
| Sentinel-2B four bands (Table 5) | 53.76% | 58.4% | 51.65% | 38.19% |
| Sentinel-2B ten bands (Table 6) | 51.85% | 59.32% | 50.13% | 36.37% |
| Sentinel-2B twelve bands (Table 7) | 40.16% | 61.81% | 43.69% | 30.62% |
Table 18 shows the experimental results of the MSF-Net network under four multispectral image data combinations; MSF-Net works best at four bands, with the F1-score and IOU reaching 51.65% and 38.19%, respectively. The detection becomes less effective after continuing to include band data with resolutions of 20 m/pixel and 60 m/pixel, indicating that the MSF-Net algorithm can utilize more spectral features with higher resolutions and is less capable of processing spectral information with lower resolutions.
The performance of the six deep neural networks on the single-source multispectral remote sensing image building change detection dataset shows that Siam-conc, Siam-conc-diff, and NestNet achieve optimal results when the number of input bands is three, while Siam-diff, SNUNet-CD, and MSF-Net achieve optimal results when the number of input bands is 10, 12, and 4, respectively. This reflects the different learning abilities of different networks for different data bands. Among the six algorithms, MSF-Net has the best detection effect when using four-band multispectral image data as the input and improves the F1-score by 1.57% and the IOU by 2% compared with SNUNet-CD, which has the best performance among the remaining algorithms using 12 bands as the data input.
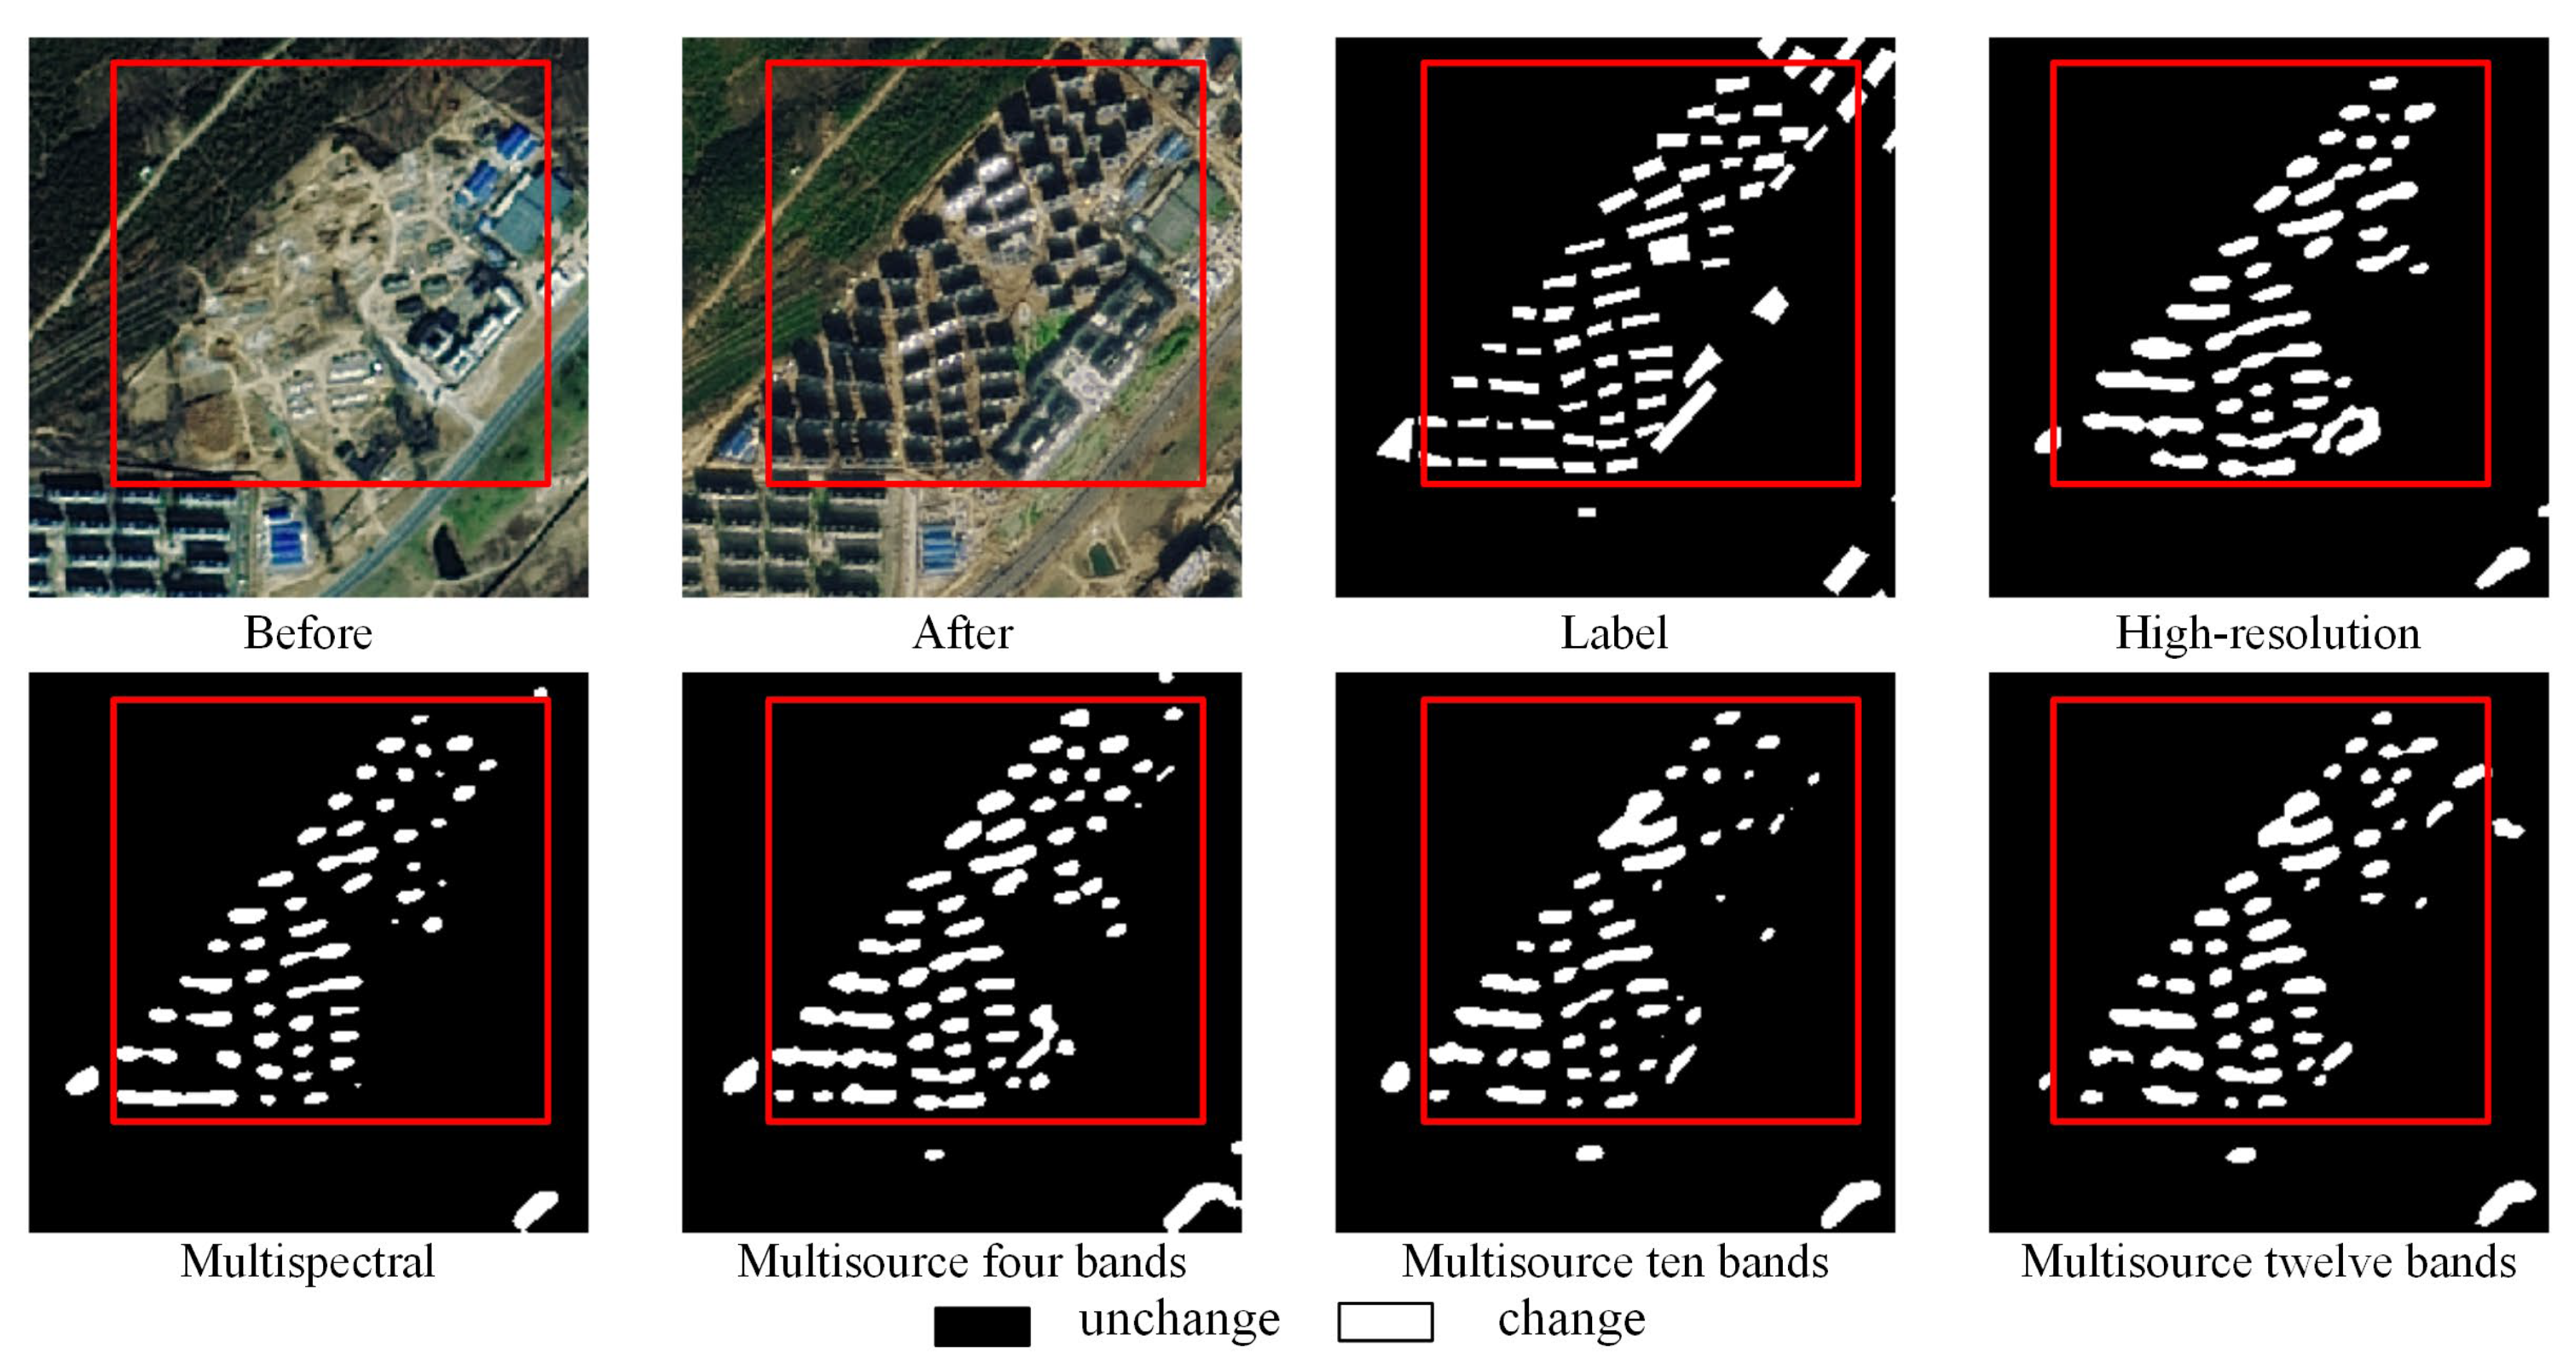
4.3. Multisource Spectral and Texture Feature Building Change Detection
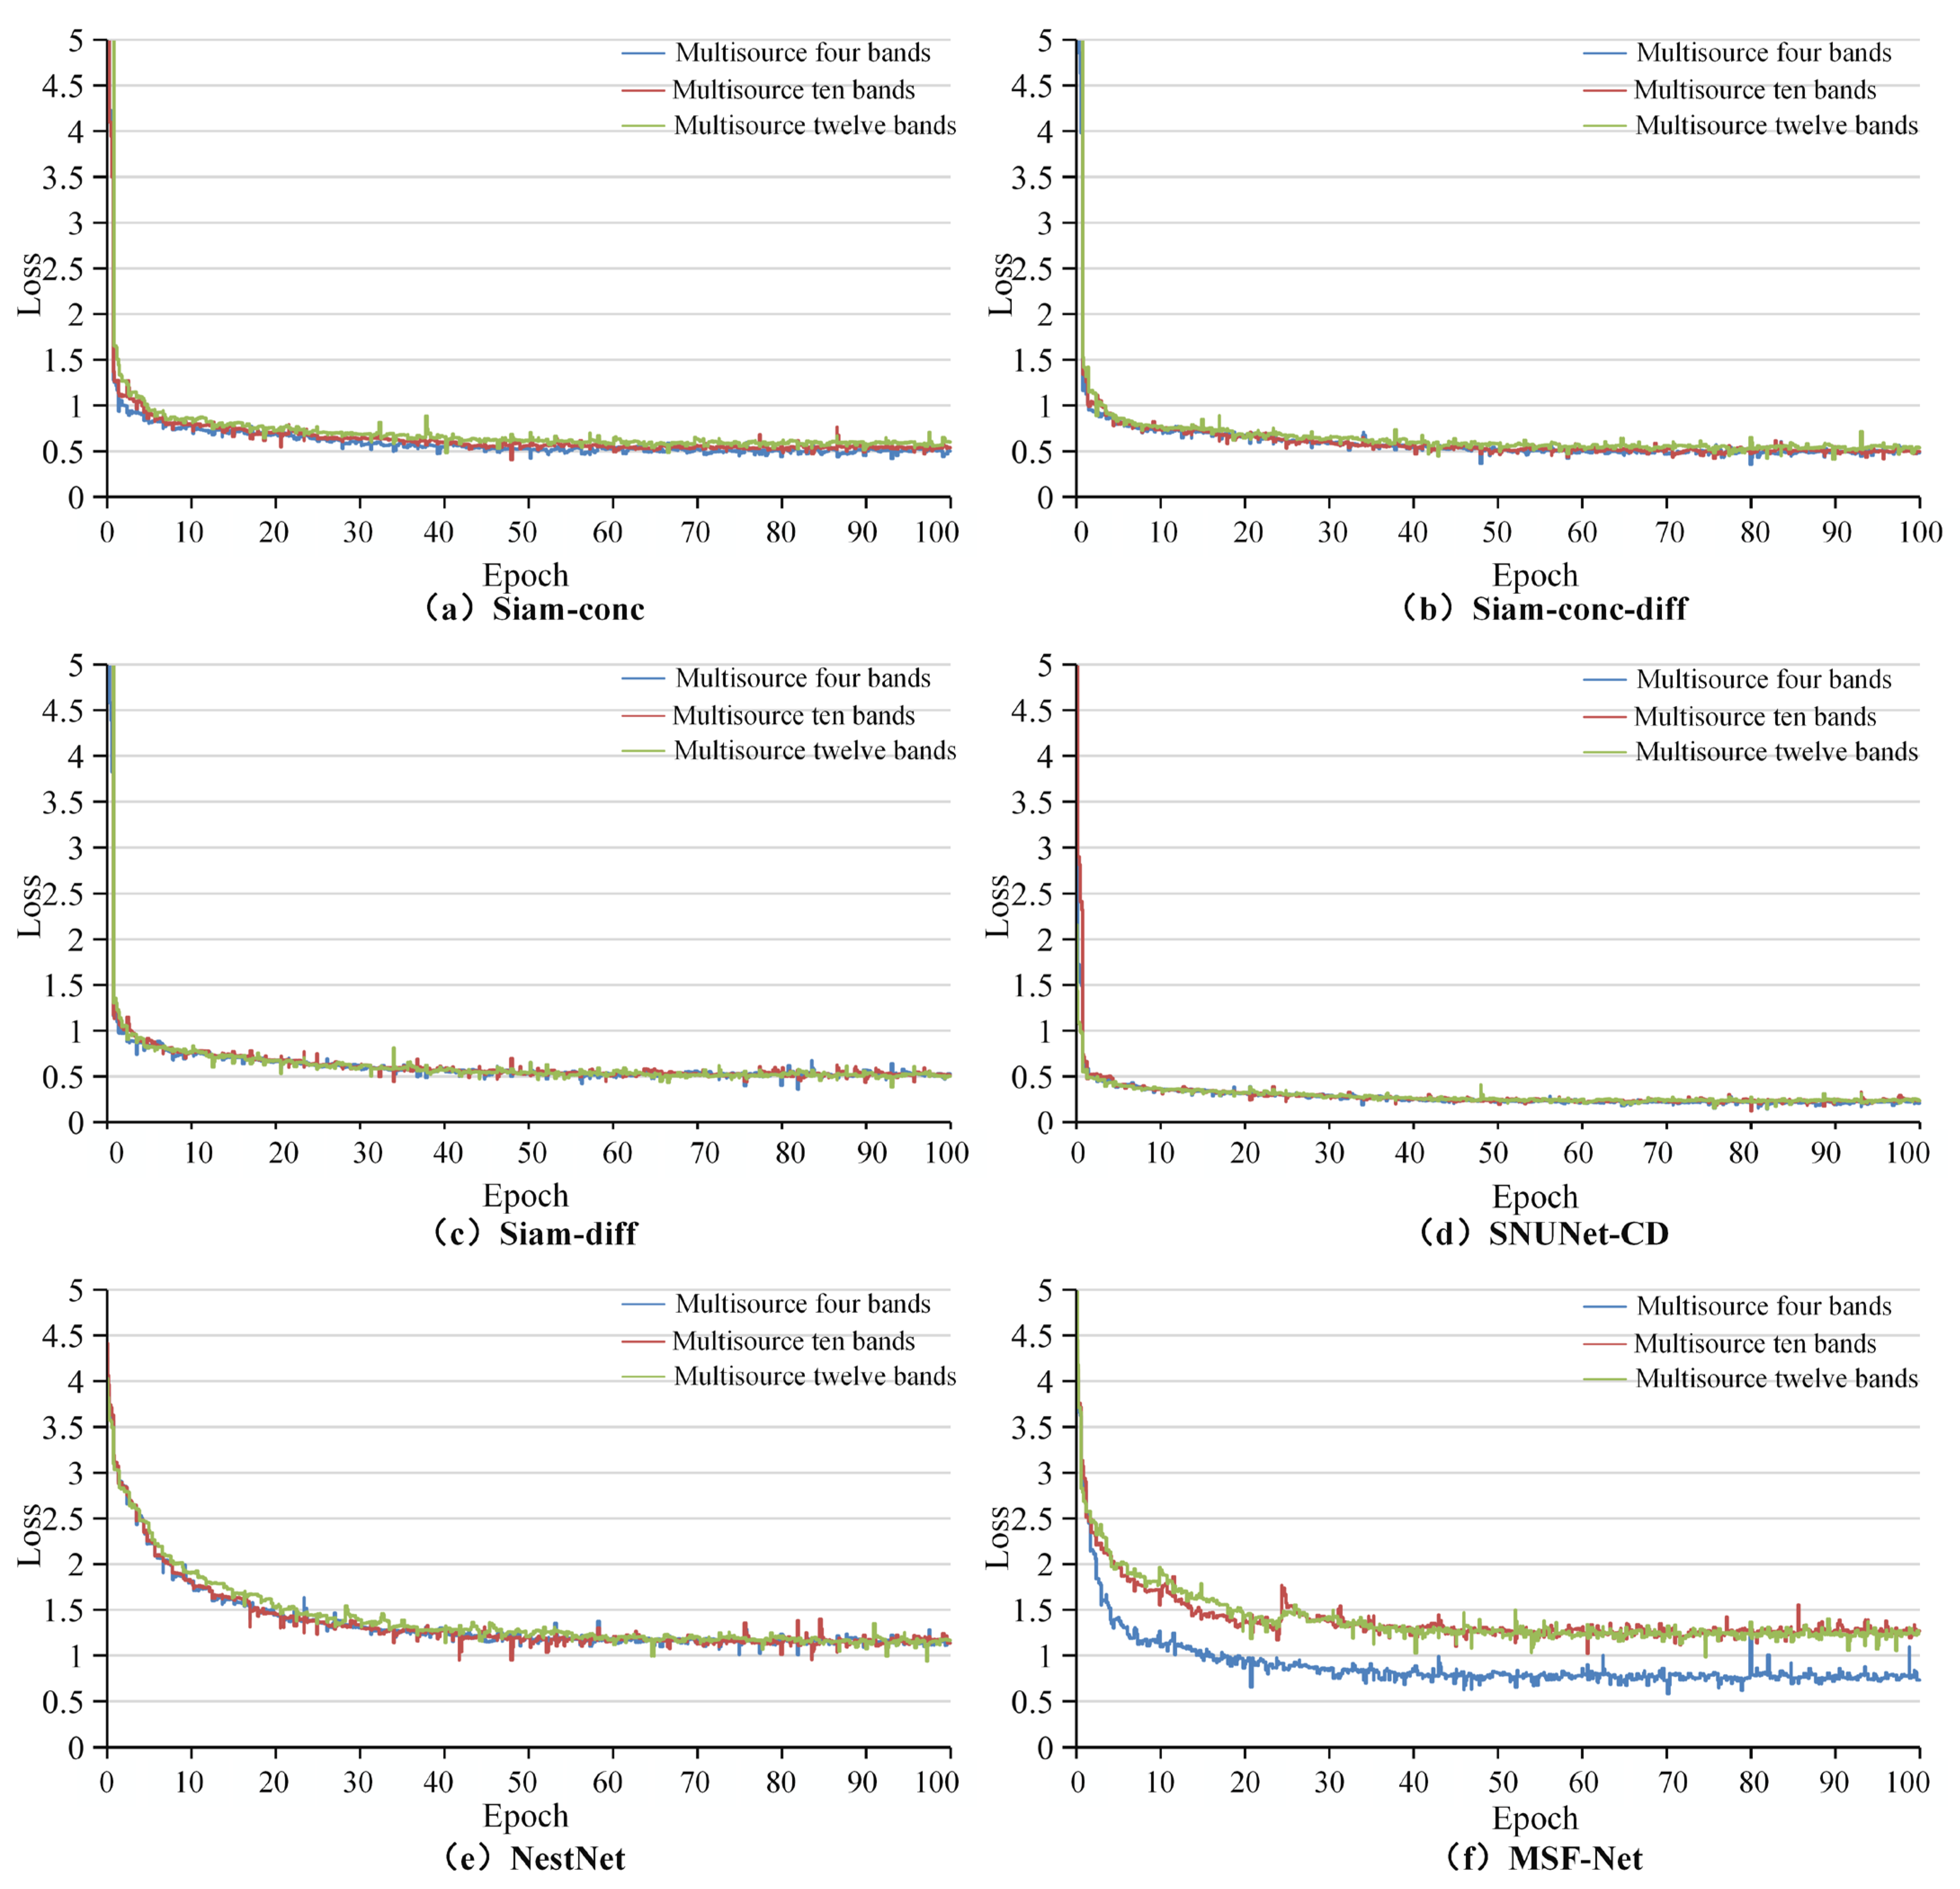
Using six network models based on the MS-HS BCD dataset, experiments on building change detection in multisource spectral and texture features are conducted based on three different band combinations of high-resolution and multispectral images. We compared the experimental results of the three combined multisource data, the single-source high-resolution images experimental results, and the results for the single-source multispectral images. It is important to note that, among the results for single-source multispectral data, the Siam-conc, Siam-conc-diff, Siam-diff, SNUNet-CD, NestNet, and MSF-Net networks achieve the best results at three, three, ten, twelve, three, and four bands, respectively, so only these data combinations are used for the comparison of multisource data. The losses of the six network models on the three multisource data combinations are shown in
Figure 10; the losses of the six network models remained flat after epoch50, the multisource data combination method had a greater impact on the MSF-Net, and the loss is significantly reduced at the four bands combination. The quantitative comparison results of each network model are shown in
Table 19,
Table 20,
Table 21,
Table 22,
Table 23 and
Table 24, and the results of building change detection at different data combinations are shown in
Figure 11,
Figure 12,
Figure 13,
Figure 14,
Figure 15 and
Figure 16.
Table 19 shows the experimental results of the Siam-conc network under multisource spectral and texture data combinations. The Siam-conc algorithm achieves the best detection results when the four-band multisource data are combined; the precision reaches 52.53%, the F1-score reaches 48.97%, and the IOU reaches 35.54%, which are 4.1%, 3.67%, and 4.05% higher than the high-resolution images and 3.77%, 1.18%, and 1.56% higher than the multispectral images, respectively. Recall is optimal for the ten-band combination of multisource data, which indicates that the detection effectiveness of the Siam-conc algorithm can be improved by adding multisource spectral information with higher resolution. Continuing to add multisource spectral information, the detection effect decreases when the band combination is 10 and 12, indicating that adding too much low-resolution multisource data for this network model has a negative effect and reduces the model detection effectiveness. In
Figure 11, when the four-band multisource data were combined, Siam-conc detected changed buildings more completely and clearly.
Table 20.
Siam-conc-diff building change detection results of multisource spectral and texture features.
Table 20.
Siam-conc-diff building change detection results of multisource spectral and texture features.
| Data Source | Precision | Recall | F1-Score | IOU |
|---|
| High-resolution (Table 3) | 54.12% | 53.25% | 47.06% | 33.99% |
| Multispectral three bands (Table 4) | 49.82% | 52.36% | 47.89% | 34.46% |
| Multisource four bands (Table 8) | 55.37% | 58.32% | 51.85% | 37.54% |
| Multisource ten bands (Table 9) | 54.35% | 62.22% | 55.02% | 40.09% |
| Multisource twelve bands (Table 10) | 50.88% | 58.78% | 51.24% | 36.99% |
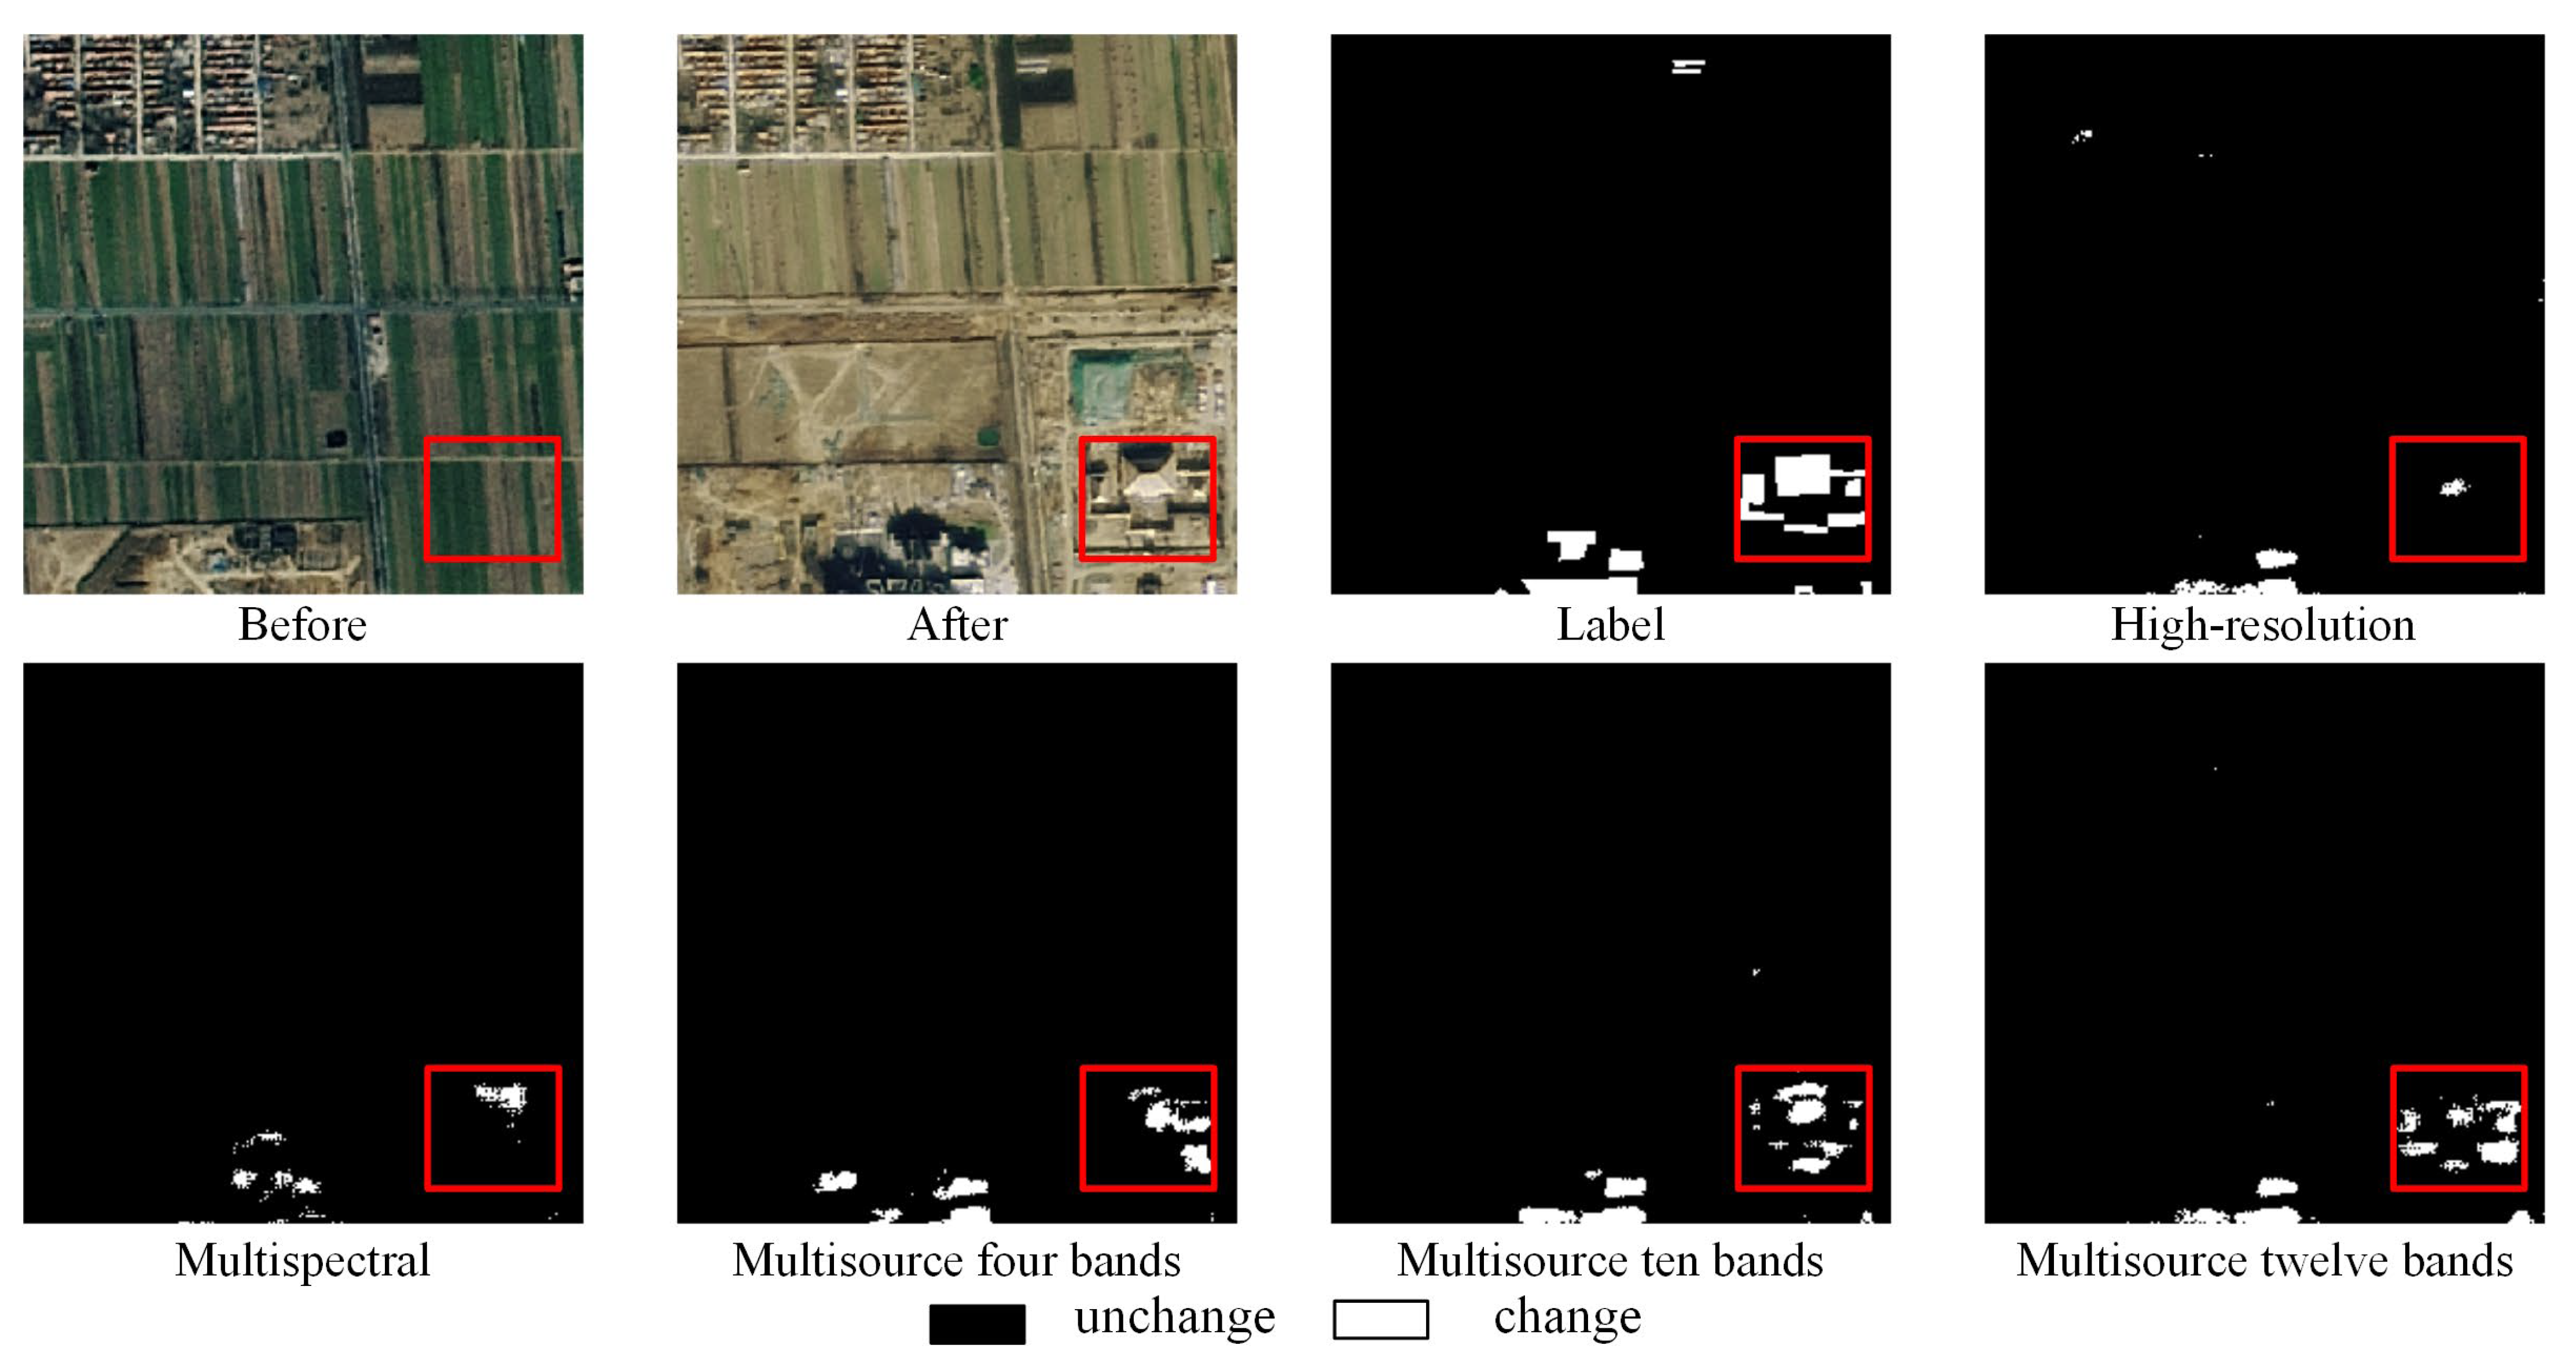
Figure 12.
The multisource spectral and texture feature detection results of Siam-conc-diff.
Figure 12.
The multisource spectral and texture feature detection results of Siam-conc-diff.
Table 20 shows the experimental results of the Siam-conc-diff network under multisource spectral and texture data combinations. The Siam-conc-diff algorithm achieves the best detection at the ten-band combination, with recall reaching 62.22%, F1-score reaching 55.02%, and IOU reaching 40.09%, improving by 8.97%, 7.96%, and 6.1%, respectively, compared to the high-resolution images, and 9.86%, 7.13%, and 5.63%, respectively, compared to multispectral images. Precision reached the highest at 55.37% for the four-band combination. This indicates that the algorithm can better utilize more spectral information to improve detection precision after merging the dual-temporal image features and their differential features. The detection results of twelve-band data decreased significantly compared with those of ten-band data, indicating that adding low-resolution band data has a greater negative impact on the Siam-conc-diff network.
Figure 12 shows that when ten multisource spectral bands are combined, Siam-conc-diff can detect changed buildings more precisely.
Table 21.
Siam-diff building change detection results of multisource spectral and texture features.
Table 21.
Siam-diff building change detection results of multisource spectral and texture features.
| Data Source | Precision | Recall | F1-Score | IOU |
|---|
| High-resolution (Table 3) | 50.08% | 54.77% | 48.02% | 35.07% |
| Multispectral ten bands (Table 6) | 48.09% | 59.65% | 49.51% | 35.15% |
| Multisource four bands (Table 8) | 62.76% | 52.19% | 52.64% | 38.28% |
| Multisource ten bands (Table 9) | 52.98% | 54.51% | 50.22% | 36.93% |
| Multisource twelve bands (Table 10) | 54.88% | 51.19% | 49.48% | 35.49% |
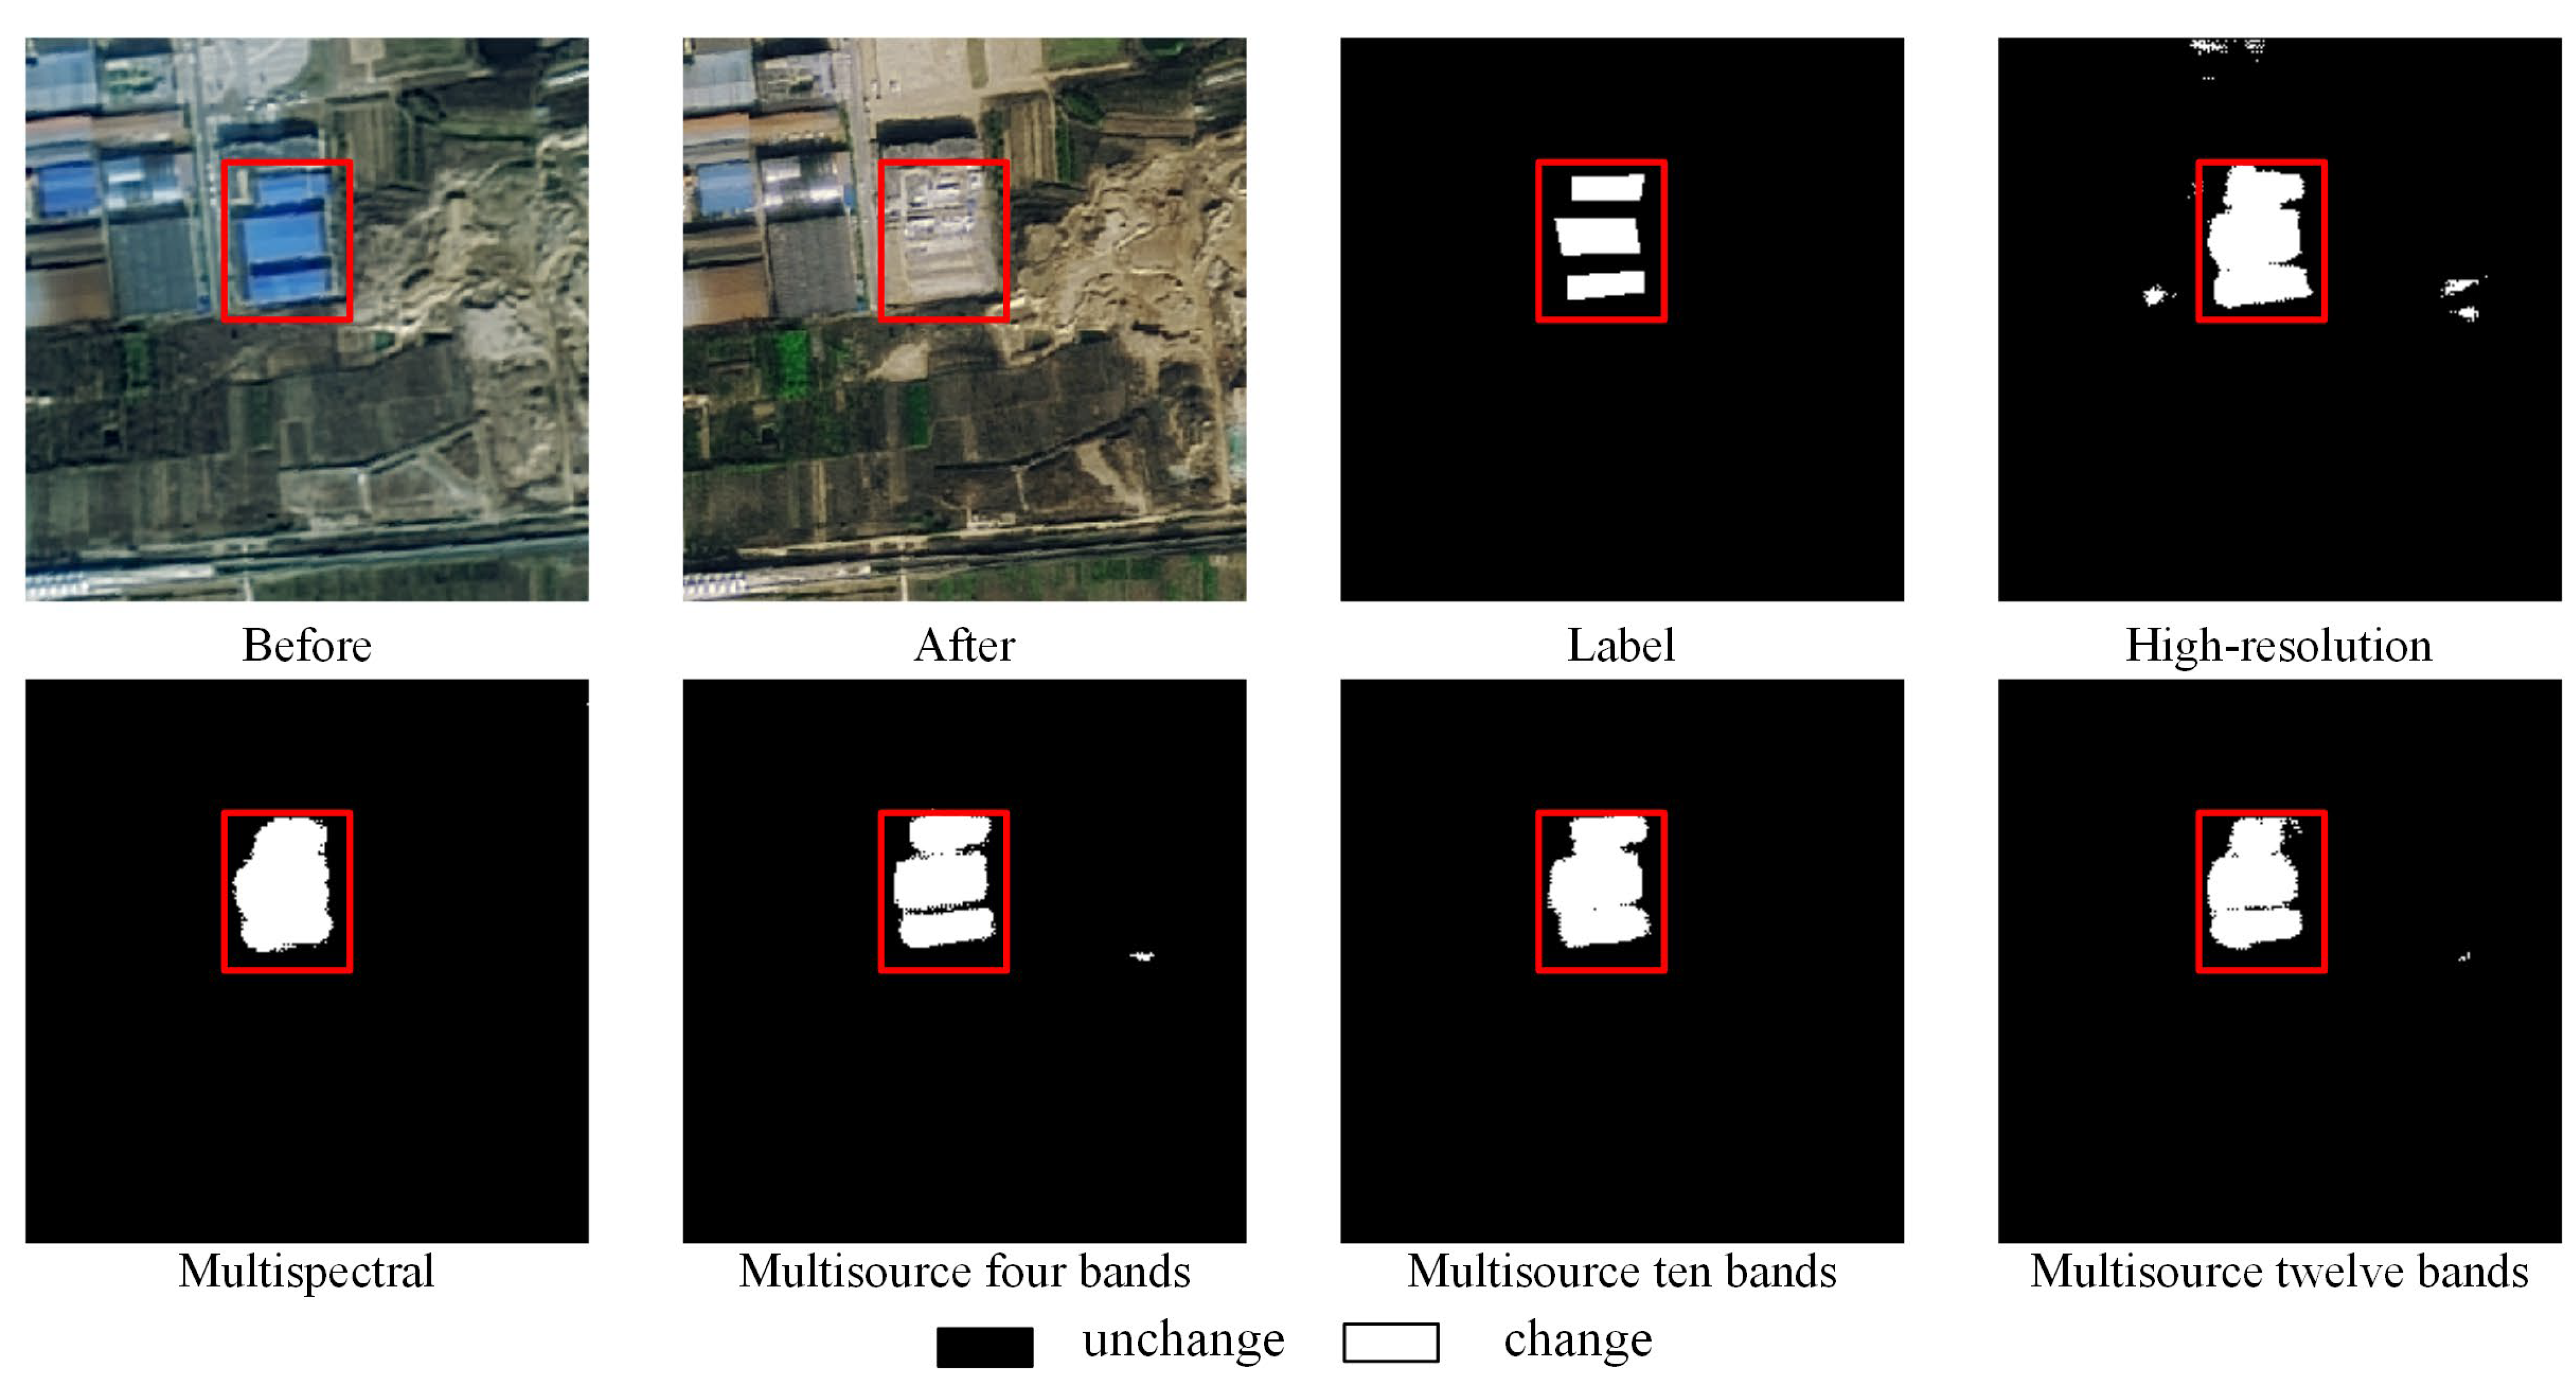
Figure 13.
The multisource spectral and texture feature detection results of Siam-diff.
Figure 13.
The multisource spectral and texture feature detection results of Siam-diff.
Table 21 shows the experimental results of the Siam-diff network under multisource spectral and texture data combinations. The Siam-diff algorithm has the best detection effect in the four-band combination; although the recall decreases, the precision reaches 62.76%, the F1-score reaches 52.64%, and the IOU reaches 38.28%. The F1-score improves by 4.62% and 3.13% compared with the high-resolution image and multispectral image, respectively, and the IOU improves by 3.21% and 3.13%, respectively. The F1-score and IOU of the model continue to decrease as we continue to add multisource spectral information, indicating that the Siam-diff network can use higher resolution multisource image data to improve the detection precision but cannot handle more low-resolution spectral data.
Figure 13 shows that when four multisource spectral bands are combined, Siam-diff can detect clearer building boundaries.
Table 22.
SNUNet-CD building change detection results of multisource spectral and texture features.
Table 22.
SNUNet-CD building change detection results of multisource spectral and texture features.
| Data Source | Precision | Recall | F1-Score | IOU |
|---|
| High-resolution (Table 3) | 43.42% | 55.22% | 44.68% | 31.83% |
| Multispectral twelve bands (Table 7) | 50.82% | 58.91% | 50.08% | 36.19% |
| Multisource four bands (Table 8) | 52.26% | 56.64% | 50.43% | 36.41% |
| Multisource ten bands (Table 9) | 48.59% | 54.41% | 46.4% | 33.09% |
| Multisource twelve bands (Table 10) | 53.72% | 55.48% | 47.68% | 33.75% |
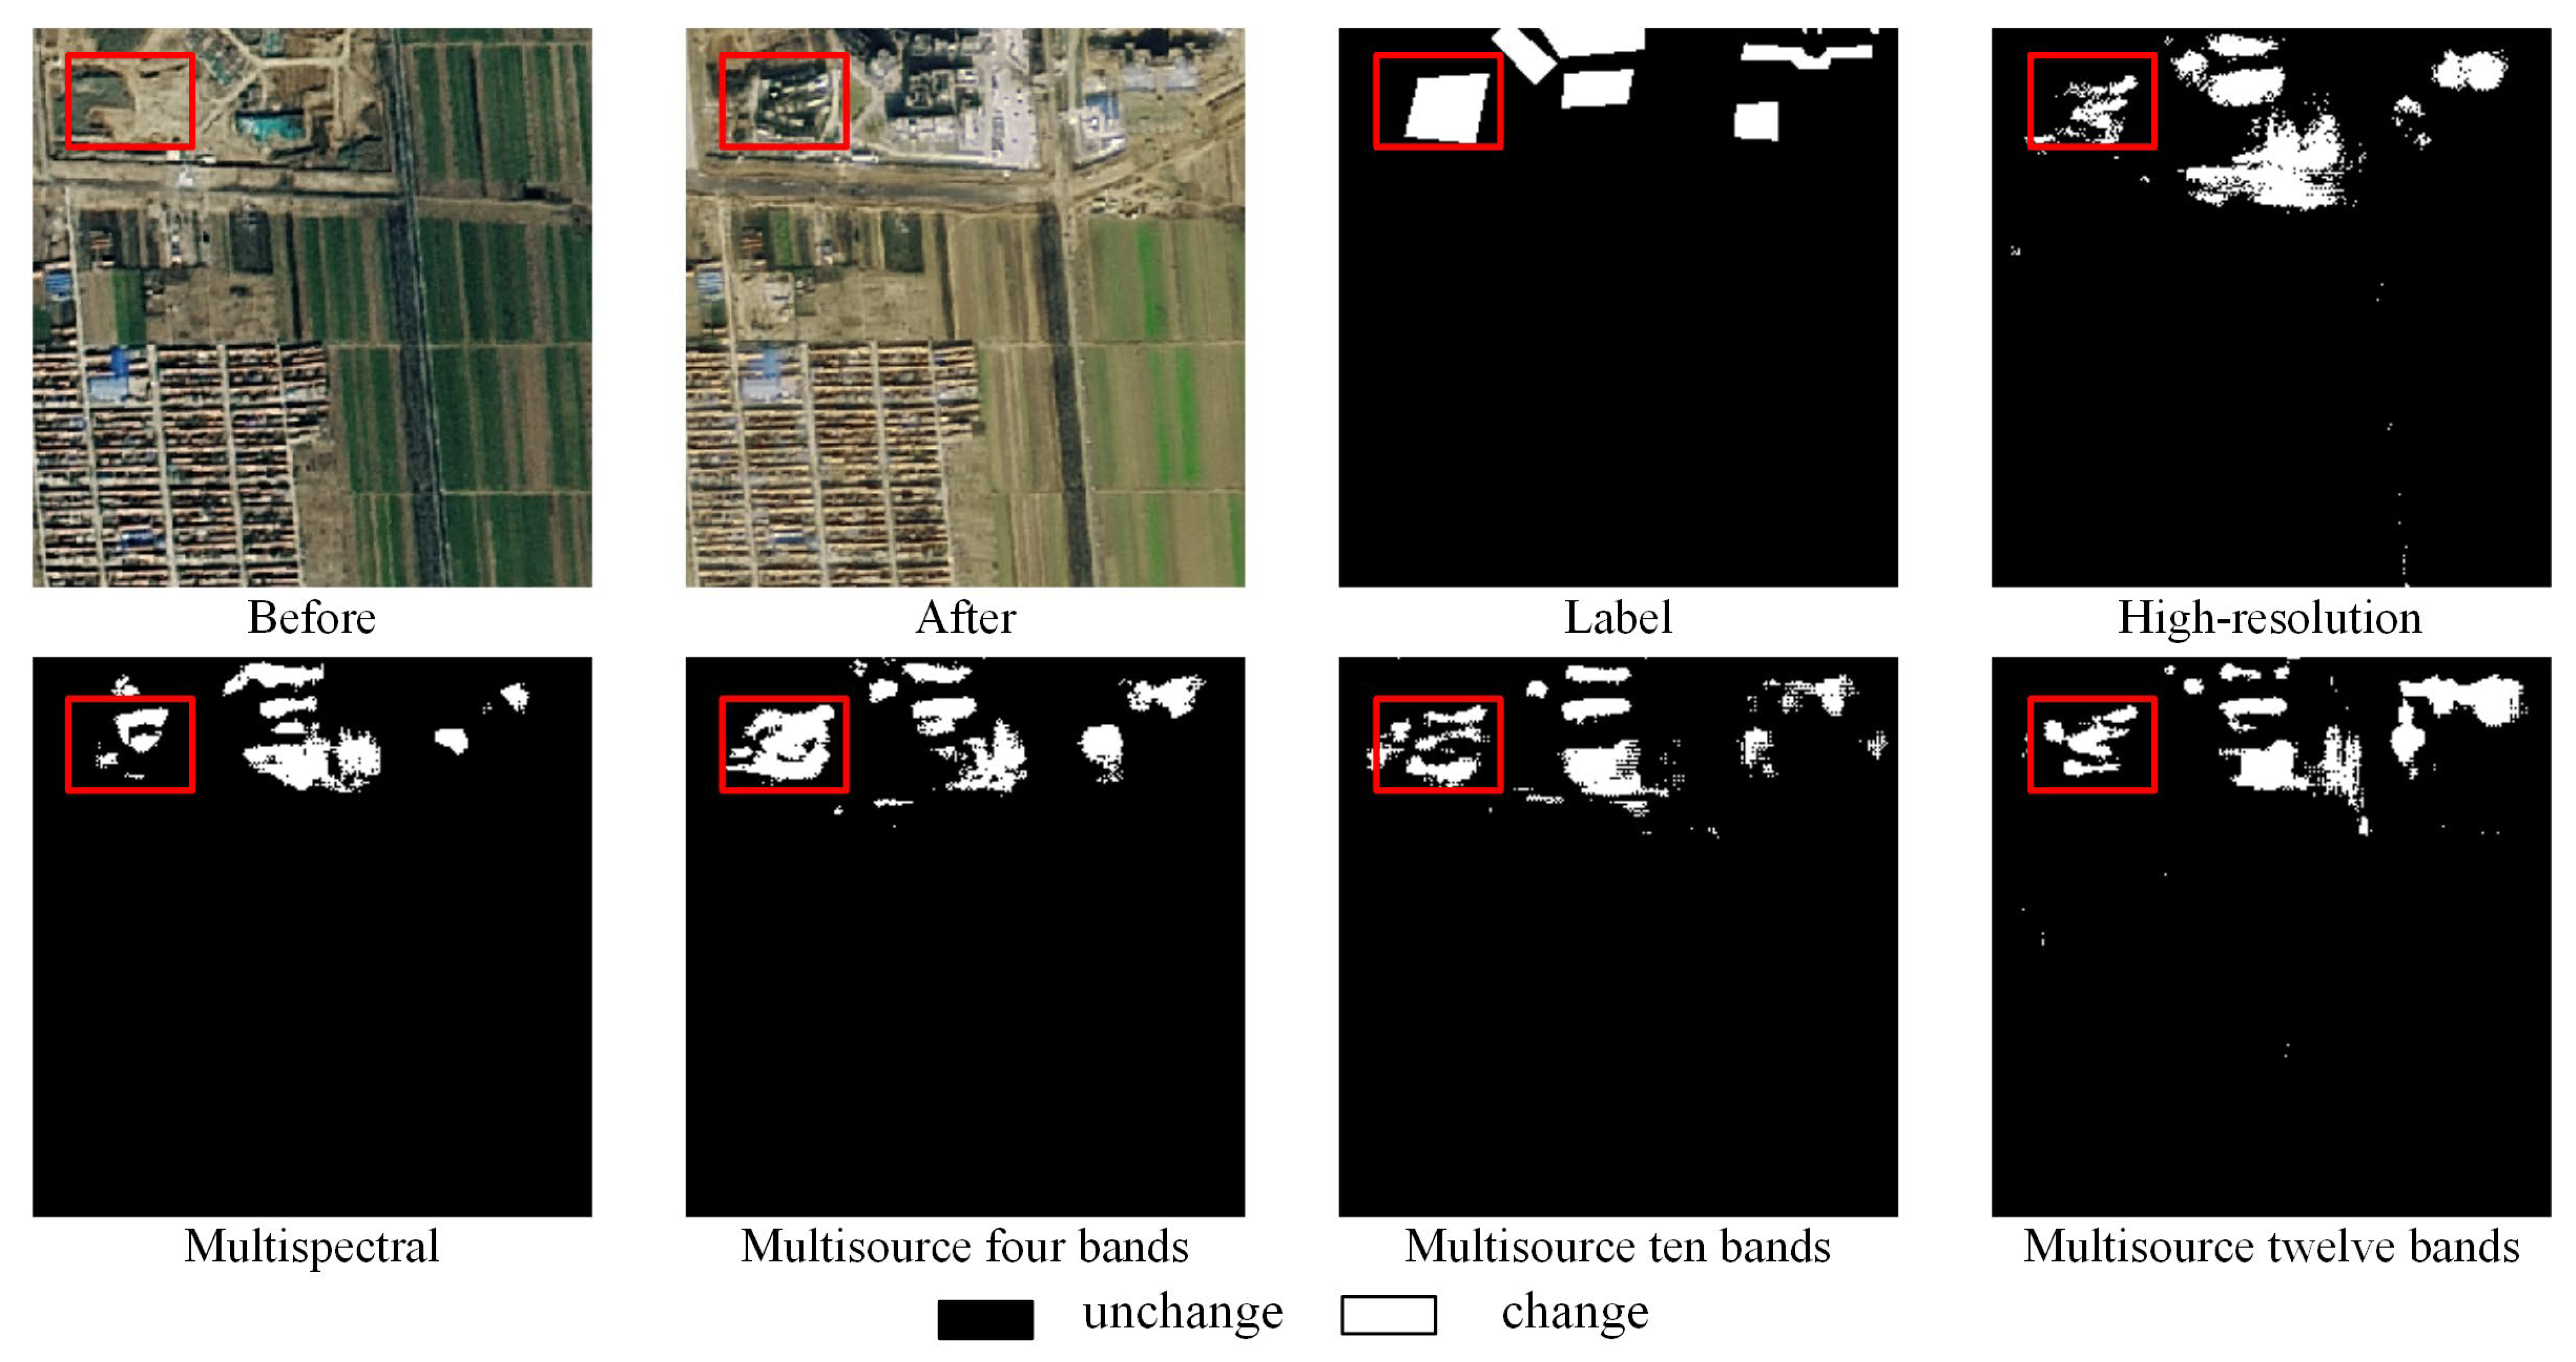
Figure 14.
The multisource spectral and texture features detection results of SNUNet-CD.
Figure 14.
The multisource spectral and texture features detection results of SNUNet-CD.
Table 22 shows the experimental results of the SNUNet-CD network under multisource spectral and texture data combinations. From the two important metrics, F1-score and IOU, the SNUNet-CD algorithm works best in the four-band combination of multisource data, with the F1-score and IOU reaching 50.43% and 36.41%, respectively. However, the network is weak in extracting information from multisource image data, and although the two metrics, the F1-score and IOU, improve by 5.75% and 4.58%, respectively, compared with high-resolution images, they only improve by 0.35% and 0.22% compared with single-source multispectral images. These results indicate that the SNUNet-CD network achieves better results in extracting multispectral image features. Adding more multisource data information does not significantly, improve its effect and the effect of the network becomes worse when adding more low-resolution multisource spectral features. In
Figure 14, when four multisource spectral bands are combined, SNUNet-CD can detect changed buildings more completely.
Table 23.
NestNet building change detection results of multisource spectral and texture features.
Table 23.
NestNet building change detection results of multisource spectral and texture features.
| Data Source | Precision | Recall | F1-Score | IOU |
|---|
| High-resolution (Table 3) | 41.48% | 60.46% | 43.84% | 30.96% |
| Multispectral three bands (Table 4) | 49.37% | 58.92% | 49.73% | 35.84% |
| Multisource four bands (Table 8) | 53.8% | 57.85% | 50.72% | 36.45% |
| Multisource ten bands (Table 9) | 47.34% | 61.23% | 50.03% | 35.99% |
| Multisource twelve bands (Table 10) | 51.62% | 58.72% | 50.92% | 36.78% |
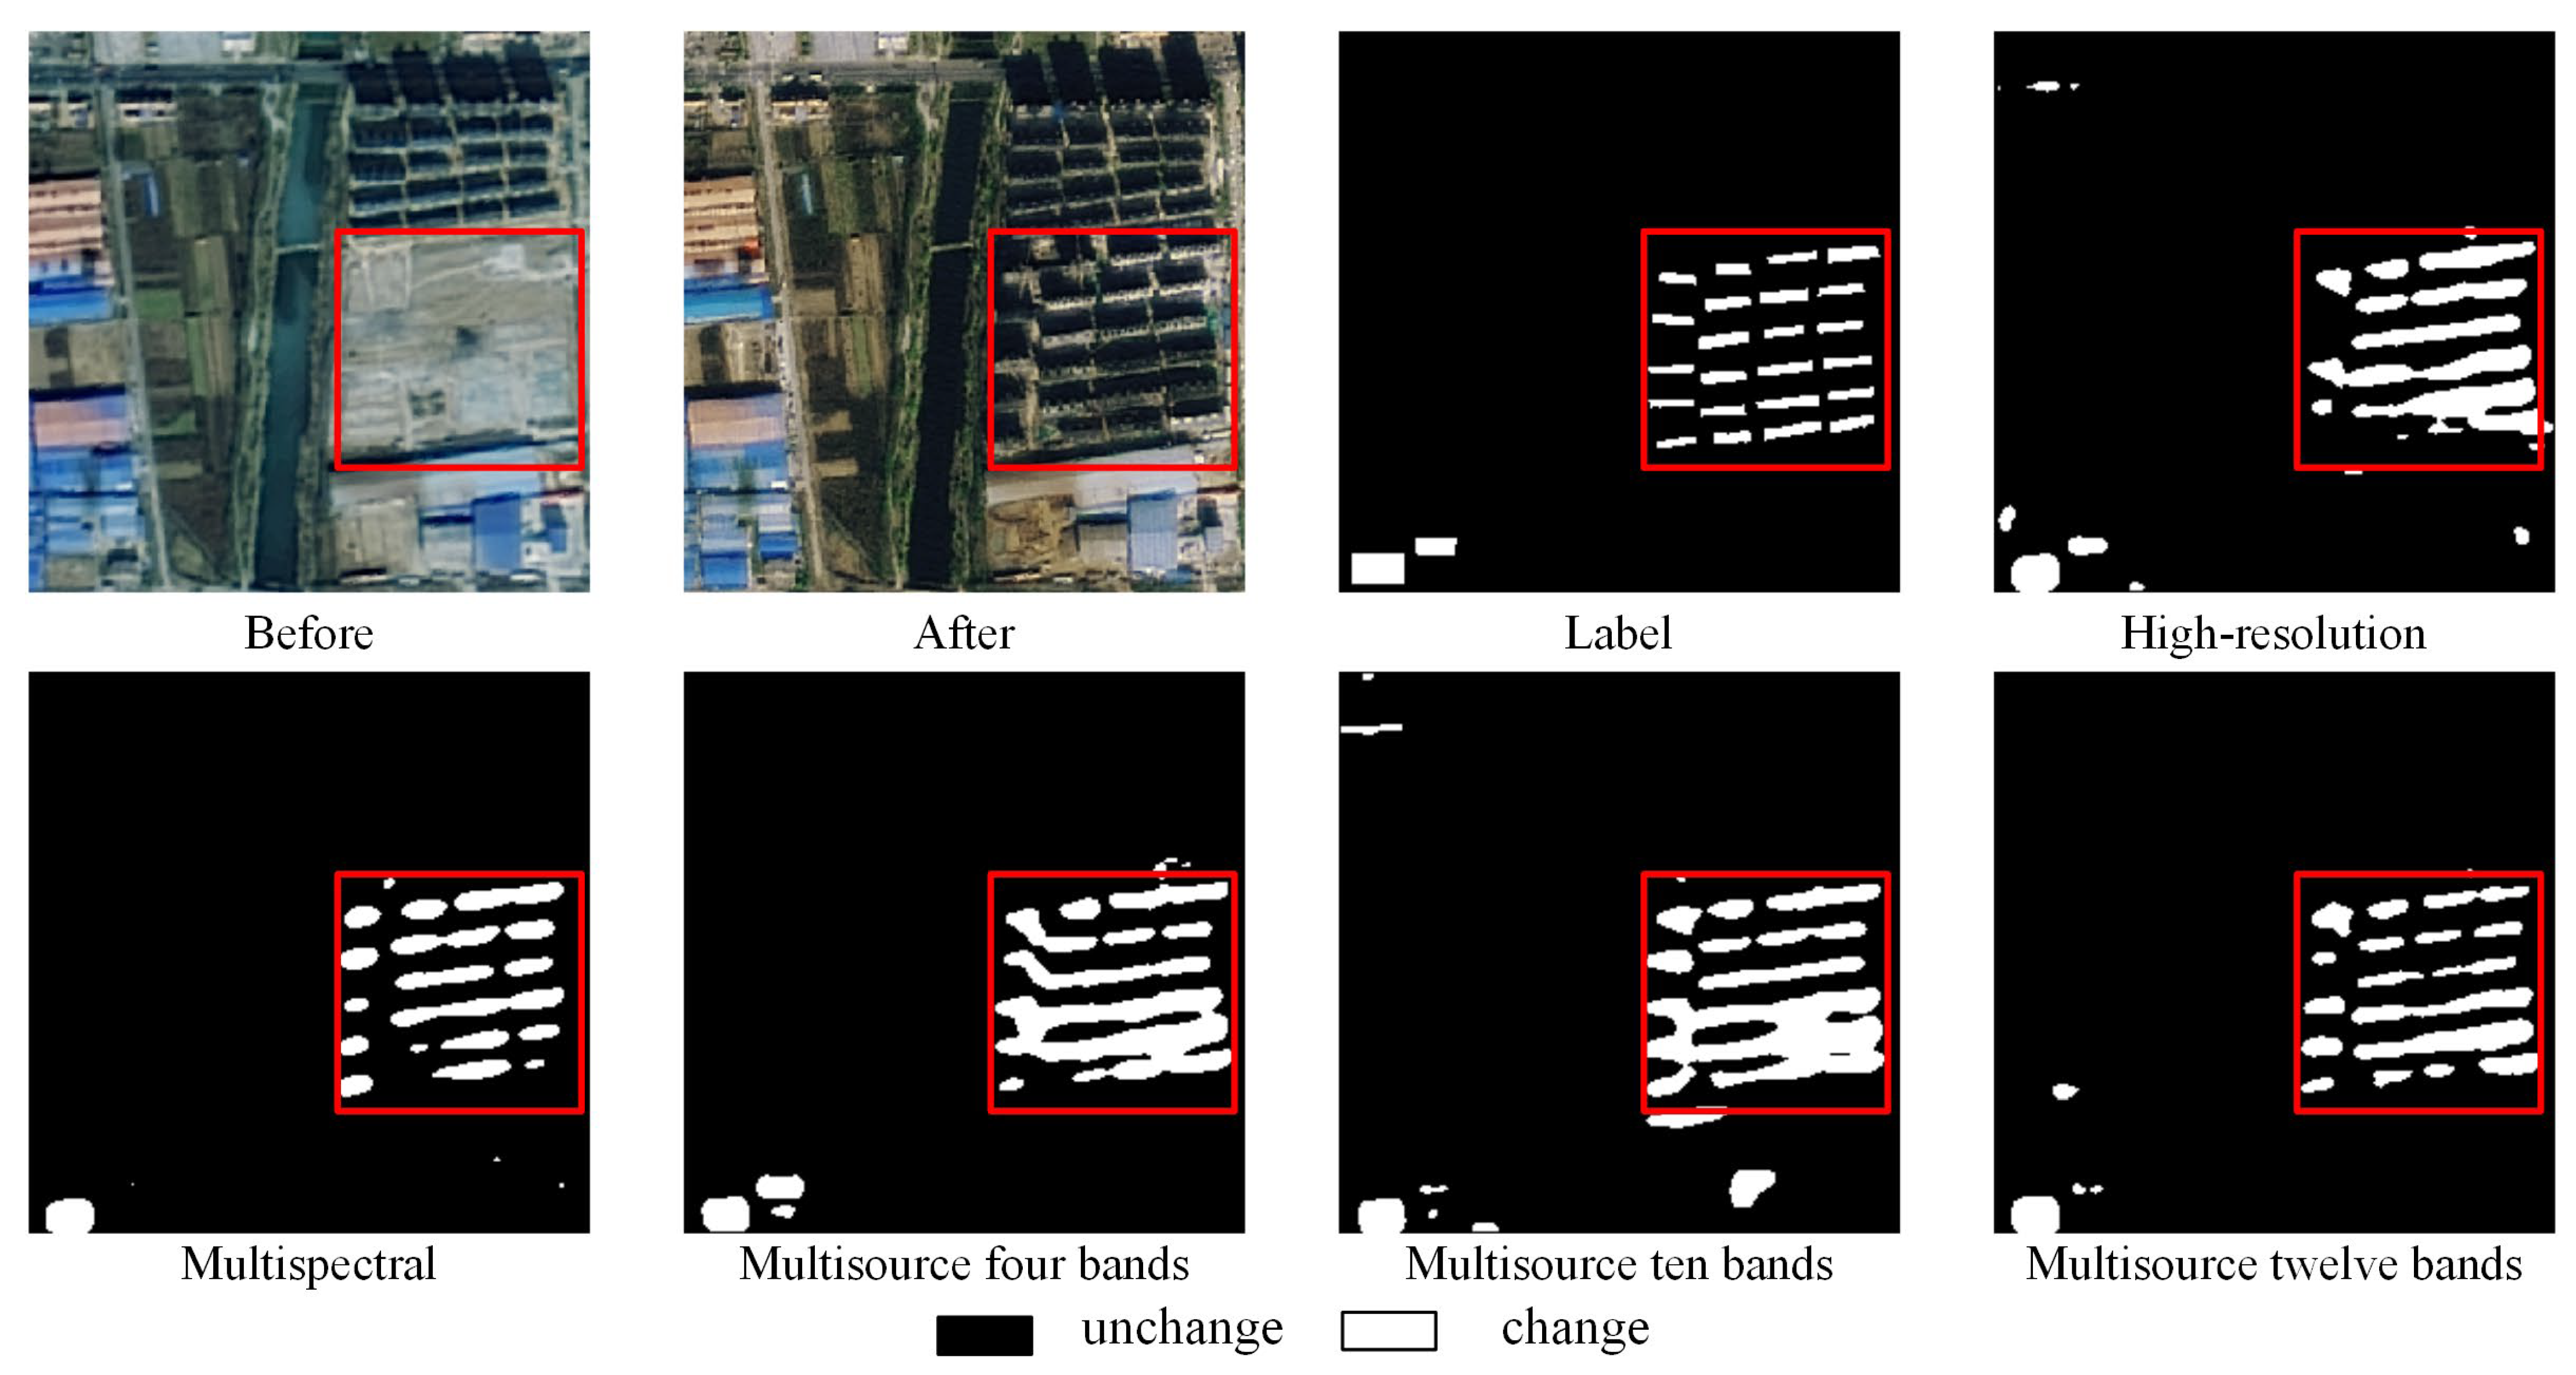
Figure 15.
The multisource spectral and texture feature detection results of NestNet.
Figure 15.
The multisource spectral and texture feature detection results of NestNet.
Table 23 shows the experimental results of the NestNet network under multisource spectral and texture data combinations. The F1-score and IOU, two important metrics of NestNet, achieved the best results when the twelve-band multisource image data were combined, reaching 50.92% and 36.78%, respectively. Precision was the highest at 53.8% for the four-band combination. Recall was the highest at 61.23% for the ten-band combination. The four evaluation indicators showed a significant increase compared with single-source images. Thanks to the improved UNet++ dense skip connection module, the NestNet algorithm can use more multisource spectral data to effectively improve the building change detection effect compared with single-source remote sensing image data. In
Figure 15, it can be seen that NestNet works best when twelve multisource spectral bands are combined and the boundaries of the changing buildings are clearer.
Table 24.
MSF-Net building change detection results of multisource spectral and texture features.
Table 24.
MSF-Net building change detection results of multisource spectral and texture features.
| Data Source | Precision | Recall | F1-Score | IOU |
|---|
| High-resolution (Table 3) | 61.1% | 65.02% | 58.55% | 43.31% |
| Multispectral four bands (Table 5) | 53.76% | 58.4% | 51.65% | 38.19% |
| Multisource four bands (Table 8) | 61.63% | 64.41% | 59.22% | 44.4% |
| Multisource ten bands (Table 9) | 54.07% | 52.53% | 48.98% | 36.41% |
| Multisource twelve bands (Table 10) | 52.25% | 58.9% | 50.67% | 36.54% |
Figure 16.
The multisource spectral and texture feature detection results of MSF-Net.
Figure 16.
The multisource spectral and texture feature detection results of MSF-Net.
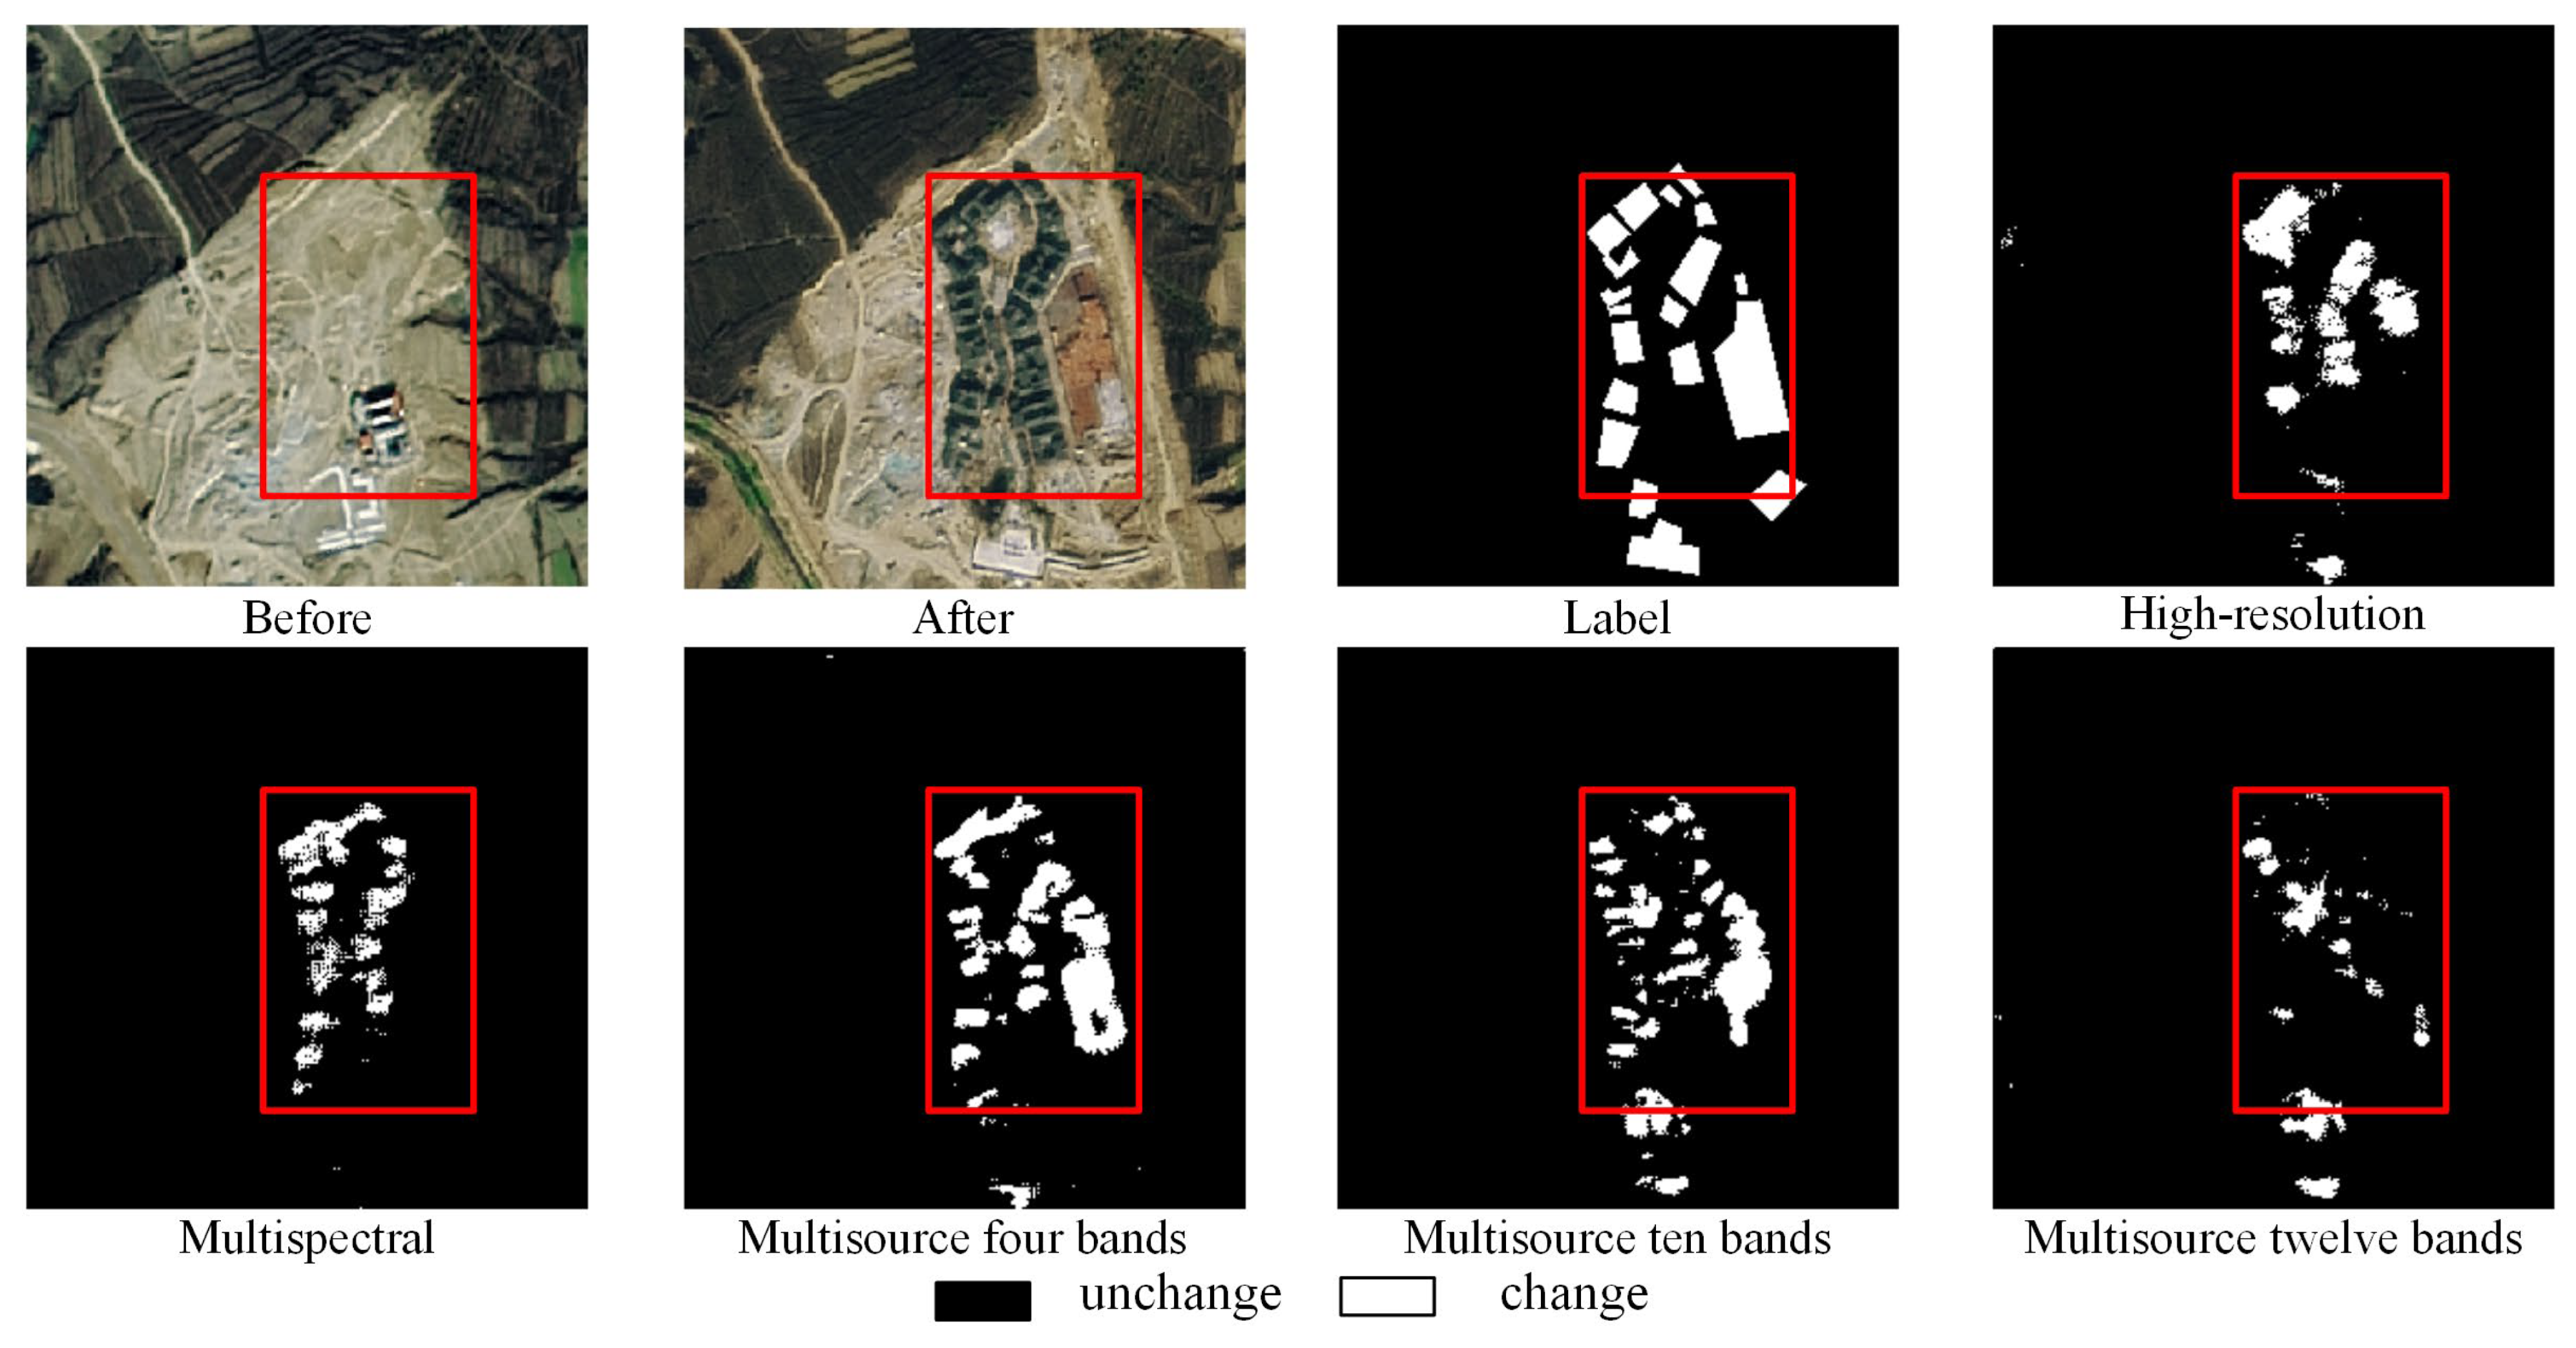
Table 24 shows the experimental results of the MSF-Net network under multisource spectral and texture data combinations. MSF-Net works best with the combination of four-band multisource data. Although recall decreases by 0.61% compared with single-source high-resolution images, the precision, F1-score, and IOU improve by 61.63%, 59.22%, and 44.4%, respectively. This indicates that adding multisource spectral information with higher resolution data can make MSF-Net learn more building features and improve the detection effectiveness, and the model detection becomes less effective when continuing to add multisource spectral information, indicating that the addition of too much low-resolution data affects the algorithm performance.
Figure 16 shows the building change detection results under different band combinations. When the four-band multisource data were combined, the changing buildings were detected more completely and with clearer boundaries. This indicates that MSF-Net can use more spectral features and texture information to improve the effect of building change detection.
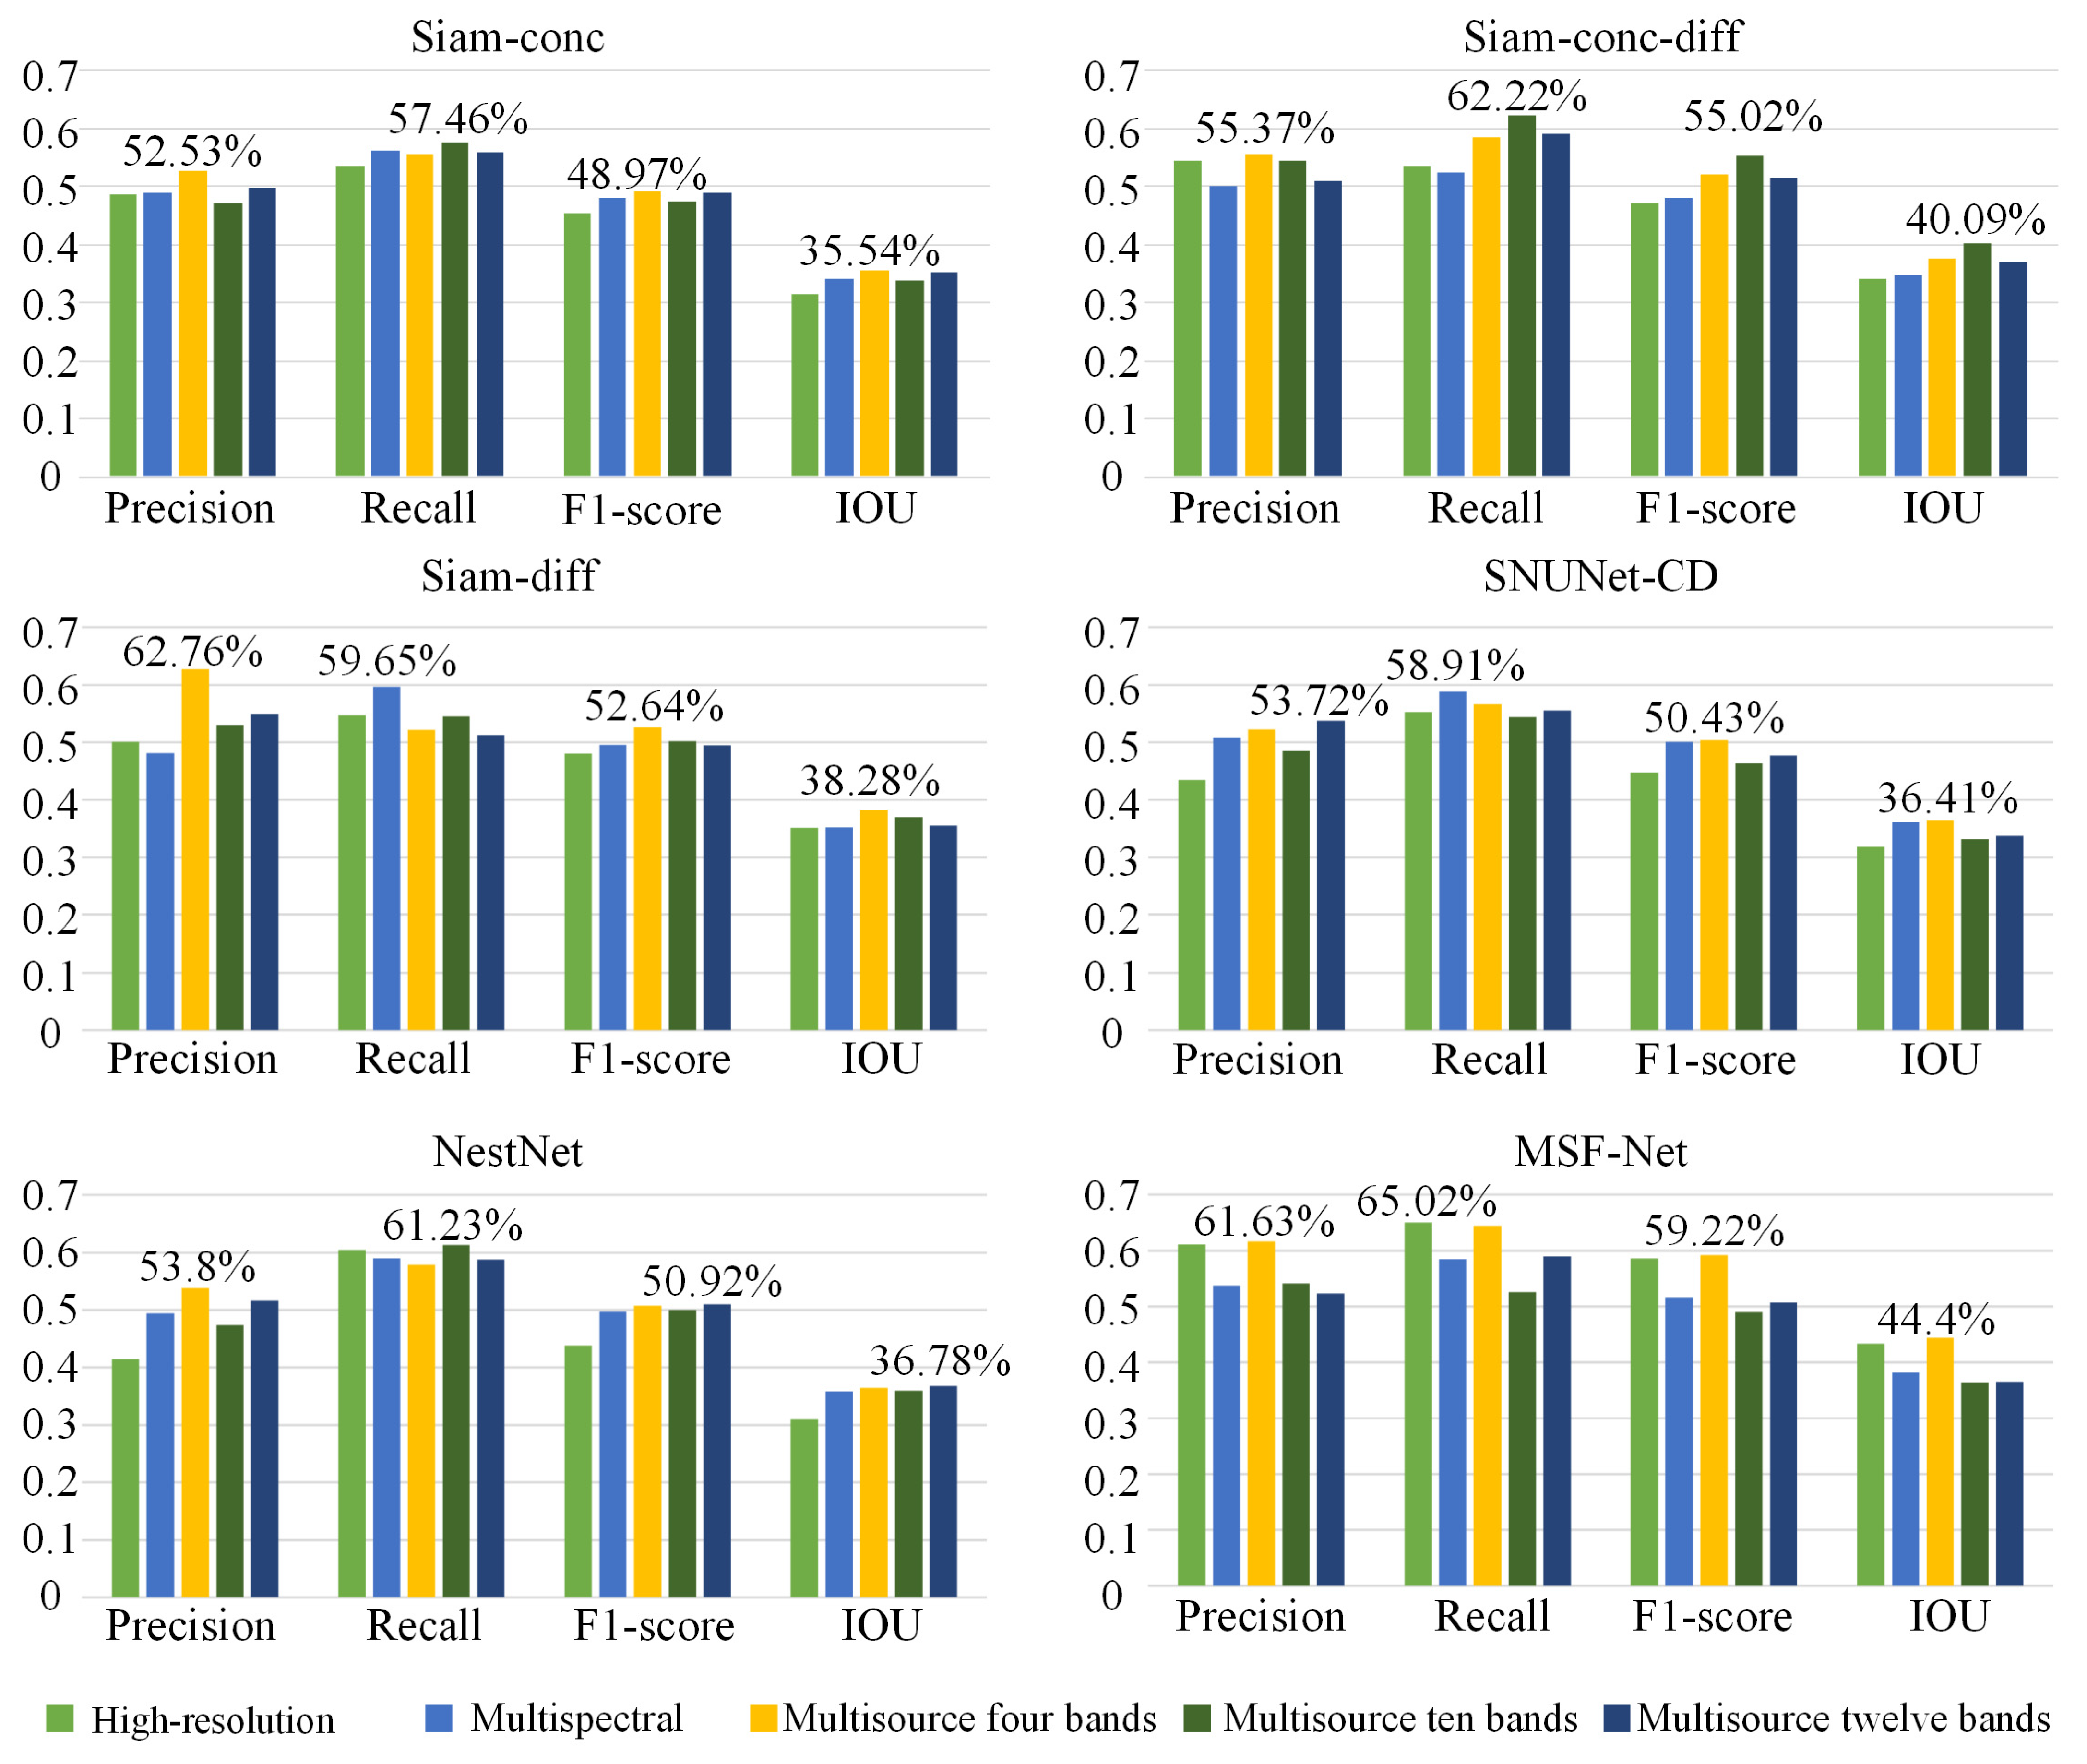
In order to more significantly represent the variation in each model evaluation metric with data source, we organized the results of the
Table 19,
Table 20,
Table 21,
Table 22,
Table 23 and
Table 24 into a bar chart, as shown in
Figure 17. It is important to note that the multispectral combinations in the Siam-conc, Siam-conc-diff, Siam-diff, SNUNet-CD, NestNet, and MSF-Net are three-, three-, ten-, twelve-, three-, and four-bands combination, respectively. The data combinations of high-resolution, multisource four bands, multisource ten bands, multisource twelve bands are shown in
Table 3,
Table 8,
Table 9 and
Table 10. It can be concluded that building the change detection based on multisource spectral and texture feature data can effectively improve the detection effect of the algorithm model. Except for the decrease in recall of the Siam-diff, SNUNet-CD. and MSF-Net algorithms, all of the other indices increase to different degrees.


