Article

Variation in Vegetation Quality of Terrestrial Ecosystems in China: Coupling Analysis Based on Remote Sensing and Typical Stations Monitoring Data

1
Institute of Geographic Sciences and Natural Resources Research, Chinese Academy of Sciences, Beijing 100101, China
2
University of Chinese Academy of Sciences, Beijing 100049, China
*
Author to whom correspondence should be addressed.
Remote Sens. 2023, 15(9), 2276; https://doi.org/10.3390/rs15092276
Submission received: 20 February 2023 / Revised: 15 April 2023 / Accepted: 23 April 2023 / Published: 25 April 2023
(This article belongs to the Special Issue Remote Sensing for Land Use and Vegetation Mapping)

Abstract

:
Vegetation is the most important component of the terrestrial ecosystem. Scientific and quantitative analysis of changes in vegetation quality is of great significance to the realization of ecosystem sustainability. Based on data of remote sensing and typical station monitoring, we examined dynamic NDVI (Normalized Difference Vegetation Index) changes in typical ecosystems from 1998 to 2020. We found that about 1/3 of China’s regions had significantly improved vegetation quality in the past 22 years, and 10% of the region had decreased, which indicated that China’s ecological situation is continuously improving. There is a large spatial heterogeneity in the trend of NDVI changes. The NDVI of agricultural and forest stations in the north of China rose relatively slowly. The NDVI of desert stations has a significant upward trend. The large-scale implementation of ecological restoration projects had improved vegetation conditions. The NDVI of forest stations and agricultural stations in the south of China still showed growth, which already has better vegetation conditions. This research can provide theoretical support for the long-term monitoring of different ecosystem types and ecological protection in China.

1. Introduction

The most crucial element of the terrestrial ecosystem is vegetation, which also serves as the foundation for preserving ecological quality [1,2,3]. As an important linker of ecological elements such as atmosphere, soil, and water and an important participant in the energy cycle of the ecosystem [4], vegetation supports the sustainable development of the natural ecosystem and human society. The good growth of surface vegetation can not only conserve water and soil, and prevent wind and sand, but also regulate the microclimate and beautify the urban environment [5]. On the contrary, poor vegetation will cause regional ecosystem degradation and even cause adverse effects on large-scale ecological conditions [6]. At present, the research on the relationship between vegetation change and the ecosystem is constantly deepening and improving and has become a hot field of global ecosystem change research. With the intensification of climate change and human disturbance, the dynamic changes in vegetation among different ecosystems in China have spatio-temporal differences. Therefore, scientific and quantitative analysis of changes in vegetation quality is of great significance to the realization of regional ecosystem sustainability.
Under the condition that ground monitoring cannot quickly grasp the macroscopic pattern and situation, remote sensing technology has gradually become an important research tool for vegetation change. Remote sensing technology has the characteristics of a wide detection range, strong real-time dynamic, and comprehensive information. At present, it has been widely applied to large-scale ecological resources monitoring and investigation and urban area research [7]. At present, many scholars have discussed the trend of regional vegetation dynamic change [8], such as the dynamic change in vegetation at different scales [9,10], the integration of different remote sensing data products [11,12,13], dynamic changes in vegetation in different typical areas [14,15]. At the same time, some scholars have also carried out research on the influencing factors of vegetation dynamic change [16,17]. In terms of climate change, many studies focus on the factors and specific coupling relationships that dominate the fluctuation of vegetation change [18,19]. In terms of human activities, some studies have explored the positive impact of afforestation on NDVI [20] and the negative impact of human activities on vegetation change, such as the change in land use type caused by human activities [21,22]. In terms of the analysis method of the driving mechanism, many studies simulate the trend change in NDVI by quantifying the impact of human activity factors and residual analysis [23]. There are also some studies that distinguish the contribution of natural factors and human factors to the impact of vegetation change [1,24,25,26].
The dynamic change in vegetation has spatial differences and periodicity, and there are significant differences in different times, different ecosystems, and different geographical locations [27]. Therefore, it is necessary to put the change in NDVI in different ecosystem types for unified research, so as to fully understand the overall situation and regional differences of the change in NDVI in different ecosystems. The Chinese Ecosystem Research Network (CERN) was established by the Chinese Academy of Sciences in 1988. Its purpose is to study the structure, function, and change rules of China’s ecosystem and improve the level of research on China’s ecology and related disciplines [28,29]. Combining this huge monitoring data network and exploring the dynamic changes in vegetation at various typical terrestrial ecosystem stations in CERN will help to grasp the ecological change characteristics of the study area in real time [28,30].
The focus of our study is as follows: First, we have tried to reveal the spatio-temporal changes in vegetation quality in China in the past 22 years. Second, we have tried to reveal the changes in vegetation quality in different ecosystem types based on typical stations. The research results are conducive to exploring and summarizing the ecological construction plans of typical ecosystems, providing theoretical support for long-term monitoring and evaluation of different ecosystem types in China, coping with climate change and ecological protection.

2. Materials and Methods

2.1. Materials

Normalized difference vegetation index (NDVI) can accurately reflect the quality of surface vegetation. At present, NDVI time series data based on MODIS satellite remote sensing images have been widely used in the research of vegetation dynamic change monitoring at various scales. We use the MOD13Q1 data on the GEE platform to extract the annual maximum values of the surface and each station from 1998 to 2020. The dataset is from NASA LP DAAC, with a spatial resolution of 250 m. The data ID in the GEE platform is (ee.ImageCollection (MODIS/061/MOD13Q1)).
The types of terrestrial ecosystems in China are based on the classification of China’s land use data in 2020 and are mainly divided into seven types of ecosystems: (1) farmland ecosystems include paddy fields and dry lands; (2) the forest ecosystem includes woodland, shrub, sparse woodland and other woodlands; (3) the grassland ecosystem includes high coverage grassland, medium coverage grassland, and low coverage grassland; (4) the water ecosystem includes marshes, canals, lakes, reservoirs, glaciers, permanent snow cover and beaches; (5) desert ecosystem includes sandy land, Gobi, saline–alkali land, and alpine desert; (6) urban ecosystem includes towns, rural residential areas, and industrial and mining areas; (7) other ecosystems include bare land and bare gravel land. The data are from Resource and Environment Science Data Center of Chinese Academy of Sciences (https://www.resdc.cn/DOI/DOI.aspx?DOIID=54, accessed on 1 February 2023), and the spatial resolution is 1 km.
China’s ecological region data comes from China’s Ecosystem Assessment and Ecological Security Database. The data are divided from top to bottom according to the hierarchical system of ecological function zoning by means of spatial overlay and correlation analysis, expert integration (https://www.ecosystem.csdb.cn/ecoass/ecoplanning.jsp, accessed on 1 February 2023). CERN location data are from China Ecosystem Research Network (http://www.cern.ac.cn/0index/index.asp, accessed on 1 February 2023).

2.2. Methods

2.2.1. Ecological Division in China

China can be divided into three ecological regions, namely, the Eastern Monsoon Region, the Western Arid Region, and the Qinghai–Tibet Alpine Region, according to the natural conditions such as the landform, the characteristics of water, and heat combination (Figure 1). The Eastern Monsoon Region is located in the vast area to the east of the Great Khingan Mountains, the south of the Inner Mongolia Plateau, and the east of the eastern edge of the Qinghai–Tibet Plateau. The Eastern Monsoon Region is facing the sea and the plateau. It is significantly affected by the ocean monsoon in summer and is generally hot and rainy. Affected by the cold air flow in the north in winter, most areas are cold and dry, and the wind direction and precipitation have obvious changes with the seasons. There are 33 ecological regions in the Eastern Monsoon Region, mainly involving urban ecological regions, forest ecological regions, and agricultural ecological regions. The Western Arid Region is located in the non-monsoon region west of the Great Khingan–Helan Mountains and north of the Qilian–Kunlun Mountains. The climate in the Western Arid Region belongs to the temperate continental climate. The daily and annual temperature ranges are large. The annual precipitation is 50–400 mm and climate is dry. There are 8 ecological regions in the Western Arid Region, mainly involving desert ecological regions and grassland ecological regions. The Qinghai–Tibet Plateau is located in the Qinghai–Tibet Plateau area west of the Hengduan Mountains, north of the Himalayas, and south of the Kunlun–Algin Mountains. The Qinghai–Tibet Plateau is characterized by high altitude, low temperature, low precipitation, and large regional differences. There are 9 ecological regions in the Qinghai–Tibet Plateau, mainly involving alpine grassland and alpine desert ecological regions.
One of the goals of CERN is to monitor the land cover and land use status of China’s main farmland, forest, grassland, desert, and other ecosystems, as well as the areas around the ecological stations. The setting and distribution of stations are based on the ecological region of China, so CERN can comprehensively reflect the vegetation quality of the area around CERN at the station level (Table 1).

2.2.2. Coupling Analysis Based on Typical Stations and Remote Sensing Retrieval Data

(1)
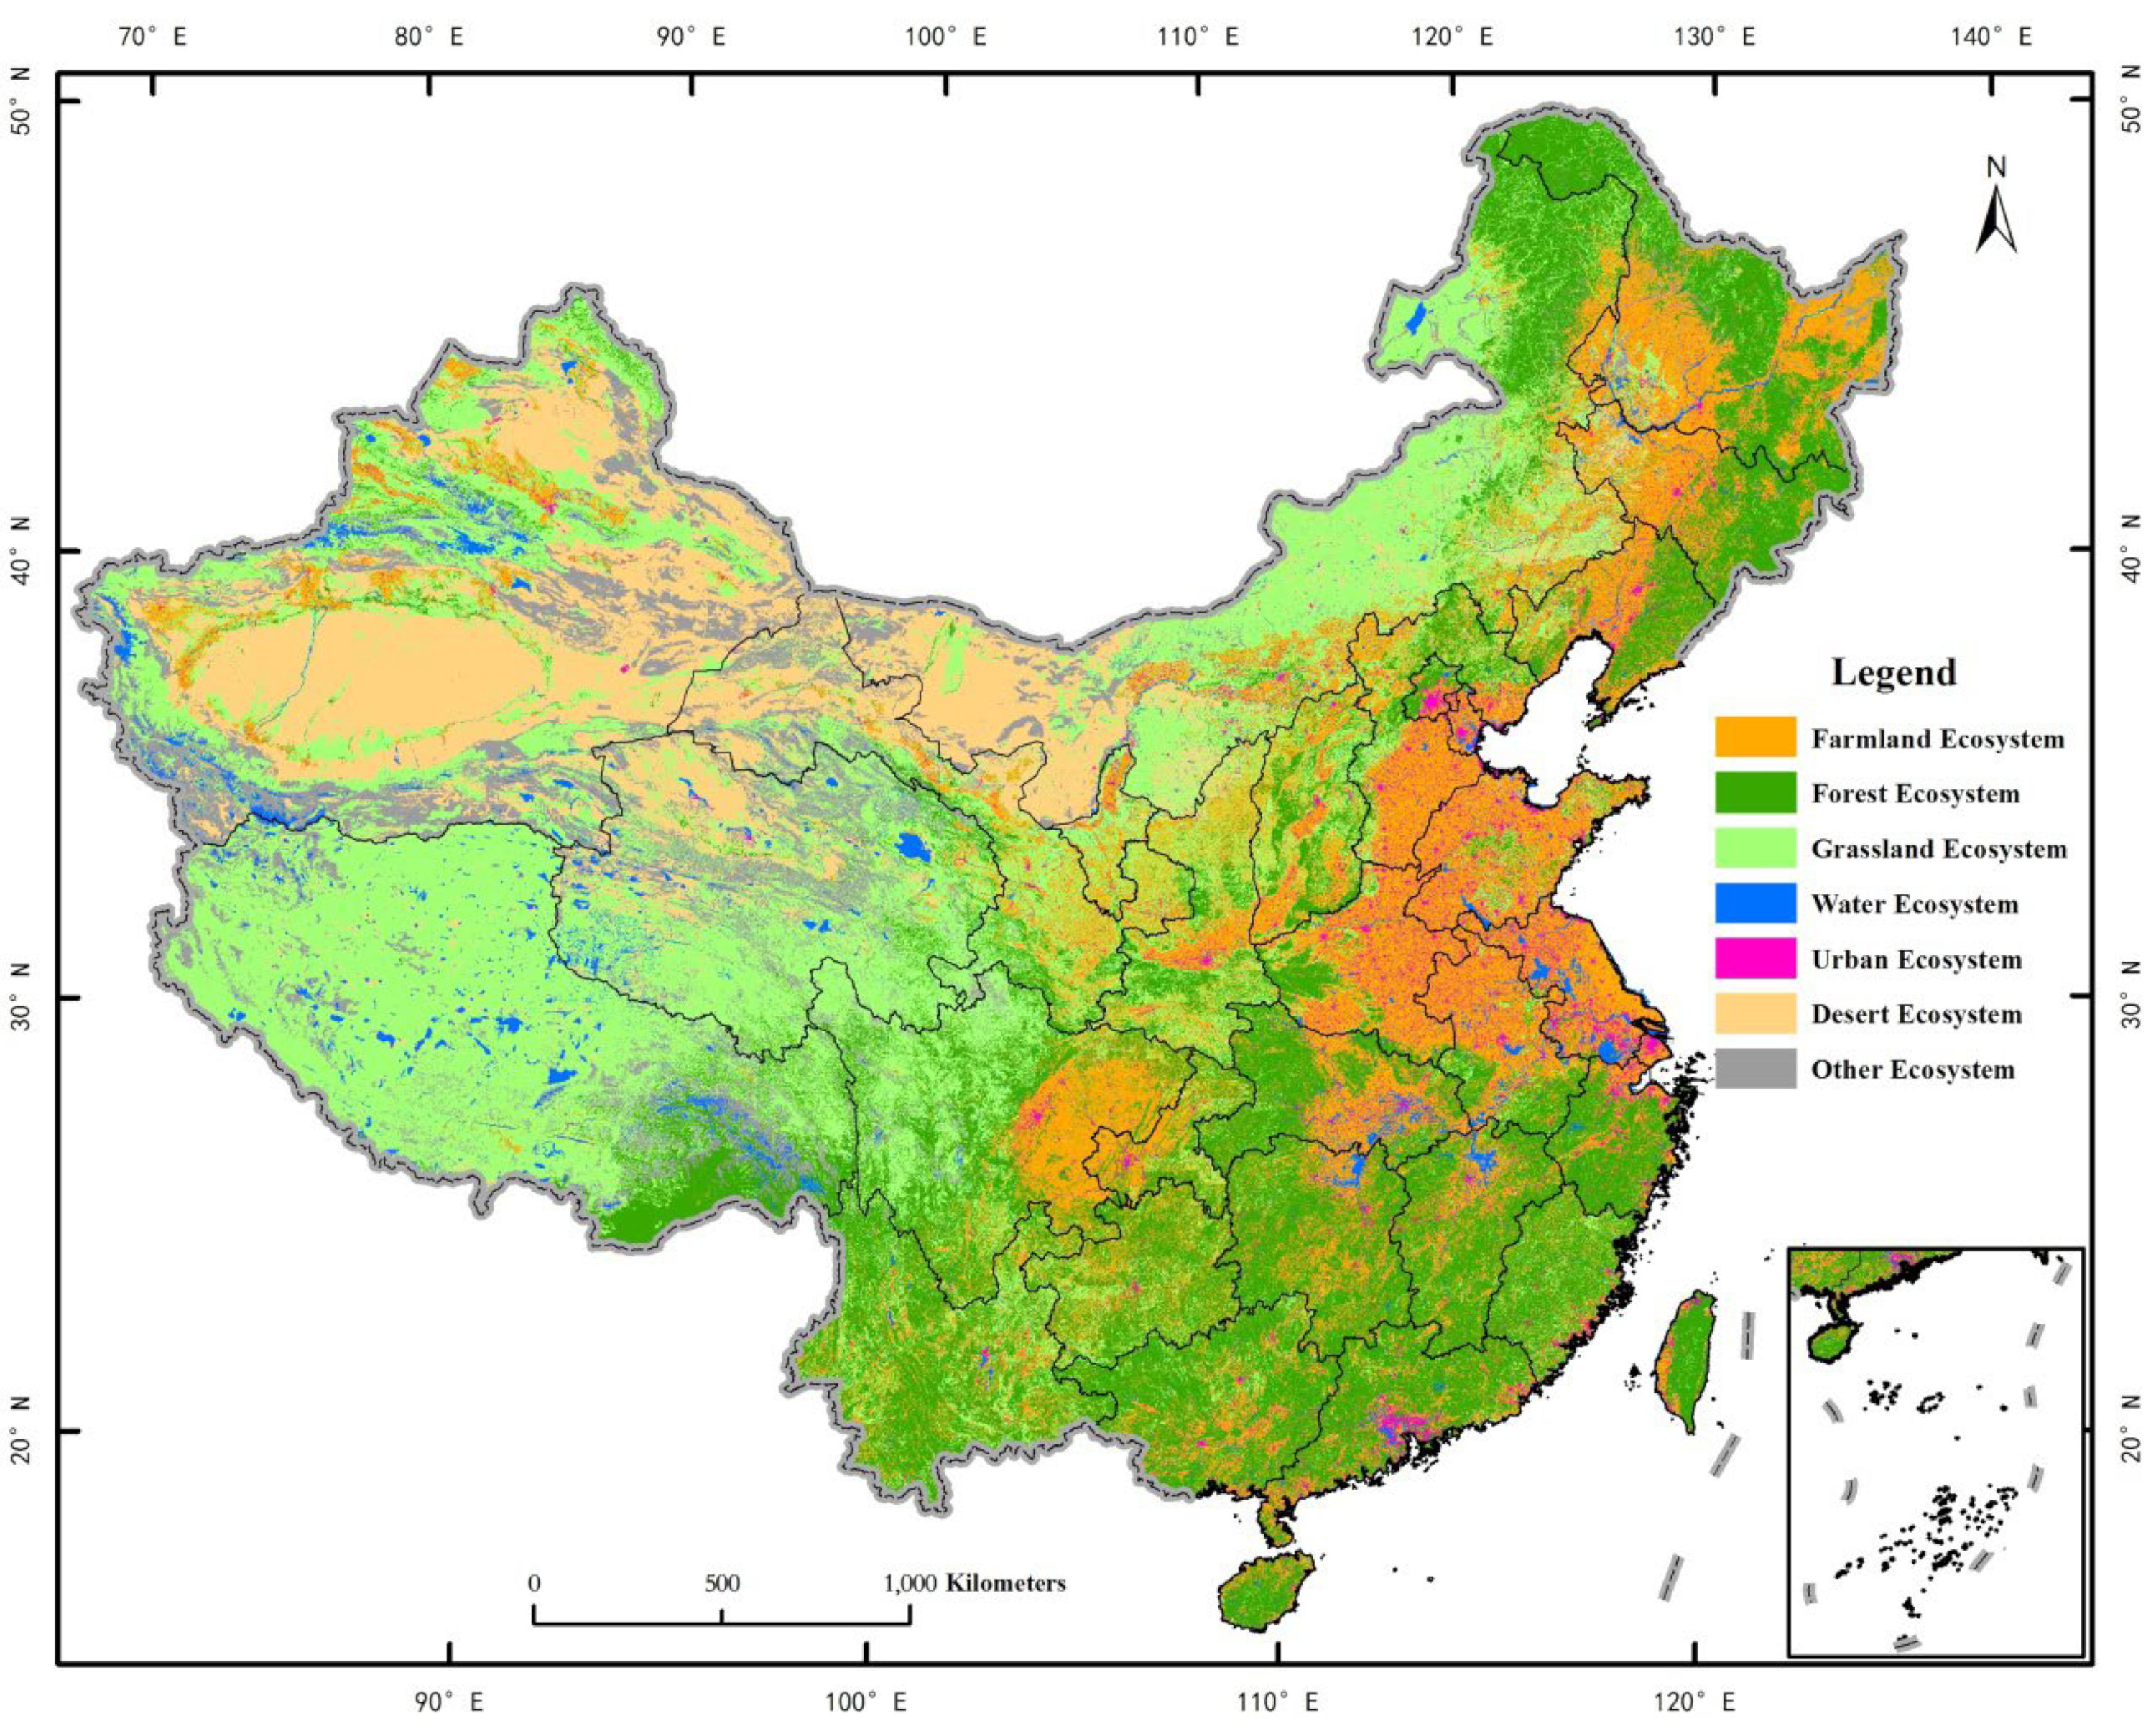
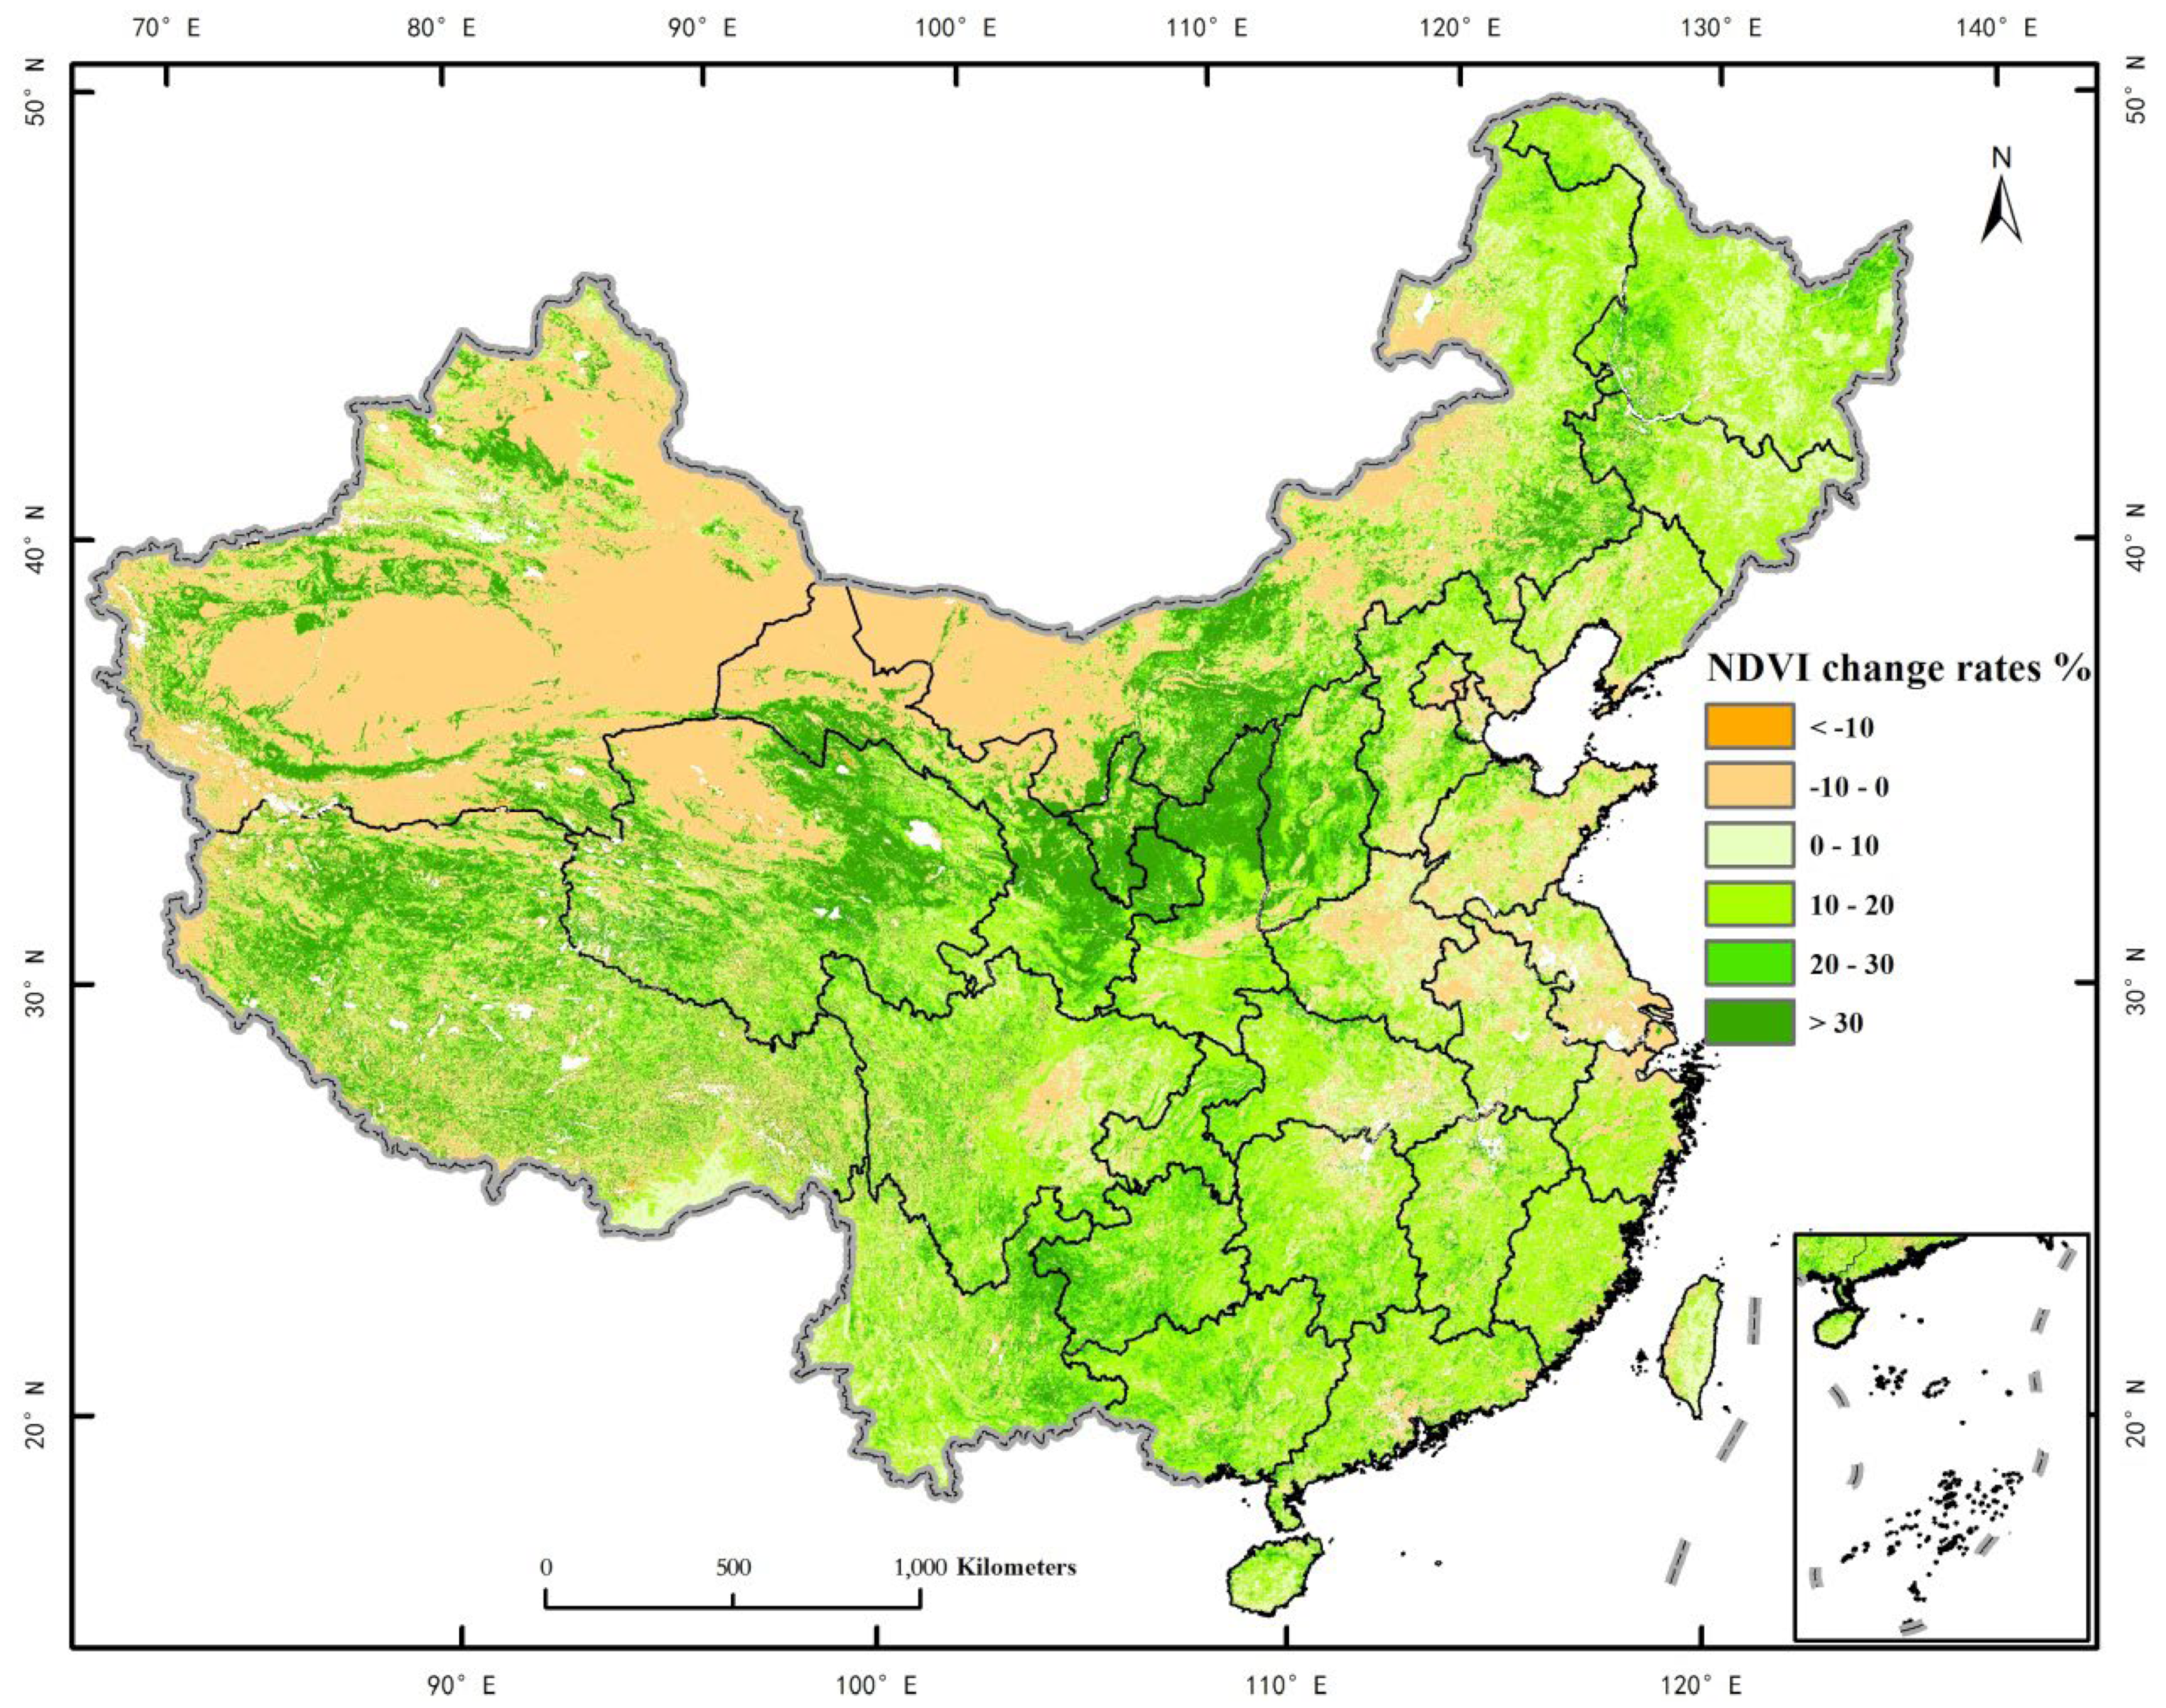
Analysis of spatio-temporal change in NDVI based on remote sensing retrieval data. ArcGIS 10.2 is used to calculate the area of various ecosystem types and analyze the spatial distribution characteristics of different ecosystems in China through regional statistics and spatial overlay. Through spatial overlay and spatial statistics, the spatio-temporal variation characteristics of NDVI were analyzed.
(2)
Analysis of vegetation change based on typical stations. We conduct dynamic analysis on NDVI of 1 km2 buffer zone around CERN station from 1998 to 2020. Firstly, we use point data to create a 1 km buffer. Secondly, we extract the average value of the grid within 1 km2 buffer. Thirdly, we use average values from 1998 to 2020 to analyze the changes in every station. China Ecosystem Research Network is an ecological network system composed of 42 ecological stations, 5 discipline sub-centers, and 1 comprehensive research center. Among the 42 ecological stations, there are 14 agricultural ecological stations, 11 forest ecological stations, 2 grassland ecological stations, 5 desert ecological stations, 7 water ecological stations, 1 wetland ecological station, 1 urban ecological station, and 1 karst ecological station (Table 1) [29].

2.2.3. Theil–Sen Median Trend Analysis and Mann–Kendall Significance Test

We used Theil–Sen Median trend analysis and Mann–Kendall significance test to analyze the spatio-temporal evolution characteristics and significance of NDVI changes in vegetation in the 1 km2 buffer zone around the ecosystem stations from 1998 to 2020. Theil–Sen Median trend analysis is a non-parametric statistical trend analysis method, which can effectively remove the impact of discrete values and outliers on the trend results and is often used to explore the change trend of long time series data. Mann–Kendall significance test is a robust non-parametric statistical method to avoid the influence of outliers on the analysis results to a certain extent. We use Mann–Kendall significance test to judge the significance of NDVI time series change trend of vegetation.
According to the Z value of the test statistic of Mann–Kendall significance test, the NDVI change trend is divided into five grades: highly significant decrease, significant decrease, stable, significant increase, and highly significant increase (Table 2).

3. Results

3.1. Spatial Pattern of Terrestrial Ecosystem in China

China’s terrestrial ecosystems mainly include forest ecosystems, grassland ecosystems, desert ecosystems, water ecosystems, farmland ecosystems, and urban ecosystems. Figure 2 shows the spatial distribution pattern of China’s ecosystem in 2020. The urban ecosystem is mainly distributed in the humid and semi-humid areas in the central and eastern regions, with a total area of 2.22 × 10⁵ km2 in 2020, accounting for 2.34% of China’s land area. The farmland ecosystem is mainly distributed in Northeast, North China, the middle and lower reaches of the Yangtze River Plain, the Sichuan Basin, the Guanzhong Basin, and the northwest arid oasis area, with flat terrain and concentrated and contiguous cultivated land. In 2020, the total area of the farmland ecosystem is 1.786 million km2, accounting for 18.80% of China’s land area. The forest ecosystem is mainly distributed in the middle and high mountains in the middle and east and concentrated in the Greater Khingan Range and Changbai Mountains in the northeast, the subtropical mountains in the southeast, and the Hengduan Mountains in the southwest. In 2020, the total area of forest ecosystem is 2.24 million km2, accounting for 23.58% of China’s land area. The water ecosystem is scattered, with a large distribution area on the Qinghai–Tibet Plateau. In 2020, the total area is 35.82 × 10⁴ km2, accounting for 3.77% of China’s land area. The grassland ecosystem is mainly distributed in the arid and semi-arid areas in the northwest and the alpine region in the southwest, with a total area of 2.99 million km2 in 2020, accounting for 31.48% of China’s land area. The desert ecosystem is mainly distributed in the northwest inland area, with flat terrain and sparse precipitation. The total area in 2020 is 1.18 million km2, accounting for 12.46% of China’s land area.

3.2. Spatio-Temporal Changes in Vegetation Quality in China in the Last 20 Years

From 1998 to 2020, about 1/3 of China’s regions (3.04 × 10⁶ km2) had an increase in NDVI (the average NDVI increased by more than 0.1), indicating that China’s ecological situation was continuously improving (Figure 3). NDVI is decreasing in 10% of the area (3.54 × 10⁵ km2) (the average NDVI is decreasing by more than 0.1). The area with significant decline is mainly divided into two parts: one is the urban built-up area, mainly due to the degradation of vegetation quality caused by urbanization; the second is desert and grassland, which are mainly caused by poor natural conditions. The areas with significant improvement in vegetation quality are mainly concentrated in three major areas: the Loess Plateau, Yunnan–Guizhou Plateau, and the semi-arid region. Among them, the average value of NDVI in the Loess Plateau increased by 0.13; the average of NDVI in Yunnan–Guizhou Plateau increased by 0.11; due to its large scope, the northern arid region has the largest area of NDVI increase (6.29 × 10⁵ km2), although the overall average NDVI increase is small. NDVI increased significantly in some areas around the Tarim Basin.

3.3. Change in Vegetation Quality at Typical Stations

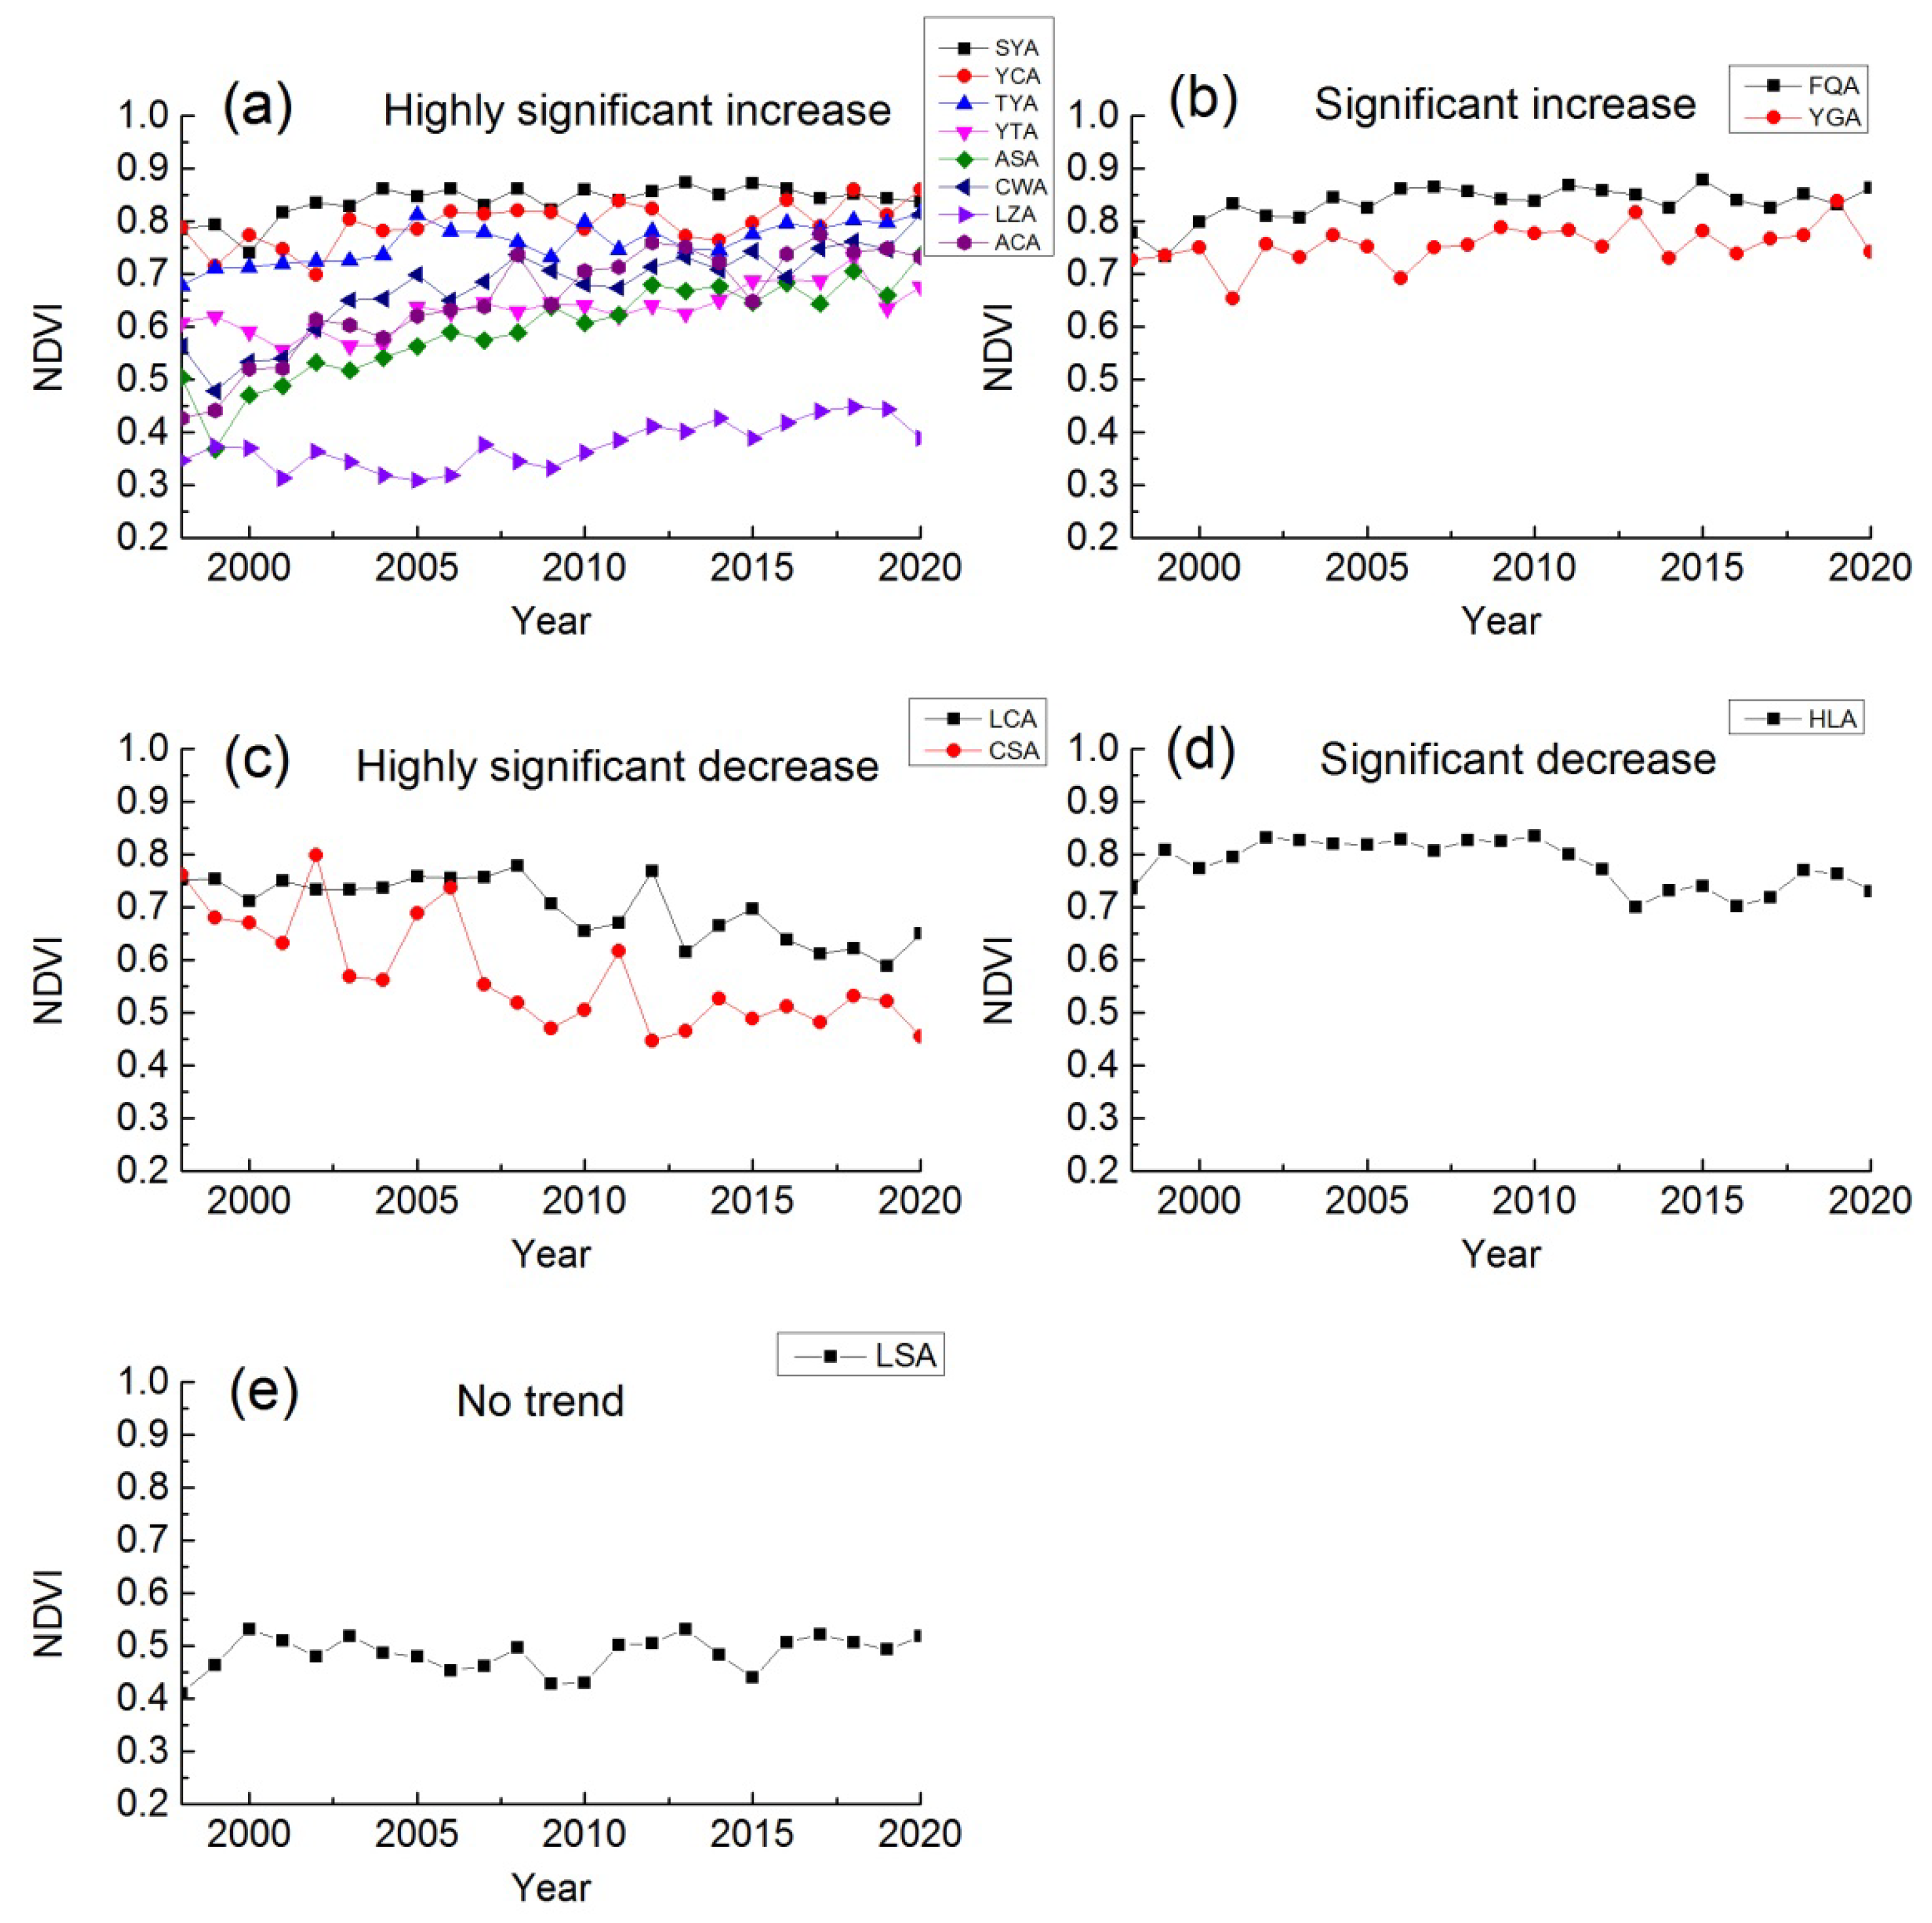
3.3.1. Agricultural Ecosystem Stations

Among the fourteen stations belonging to the agricultural ecosystem, only three stations of NDVI show a downward trend, of which LCA and CSA showed a very significant downward trend (slope = −5.68 × 10⁻³ and slope = −1.04 × 10⁻², p < 0.01), HLA showed a significant downward trend (slope = −3.81 × 10⁻³, p < 0.05) (Figure 4). Among the other eleven stations, eight stations (ACA, ASA, LZA, TTA, YGA, YTA, YCA, and CWA) showed a very significant upward trend, with a slope range of −5.68 × 10⁻³ < slope < −1.05 × 10⁻², p < 0.01. The slope of NDVI in FQA and YTA is 2.48 × 10⁻³ and 4.49 × 10⁻³, p < 0.05. However, LSA did not pass the significance level test of 0.05, and there was no obvious change trend (Table 3).
In terms of specific NDVI value changes, ACA increased from 0.43 to 0.73, with a growth rate of 71.64%, ASA increased from 0.47 to 0.73, with a growth rate of 46.21%, and CWA increased from 0.53 to 0.81, with a growth rate of 44.39%. The NDVI of SYA, YCA, FQA, TYA, YTA, YGA, and LZA all showed an increase in varying degrees, with a growth rate of between 5% and 20%. LSA has no obvious change trend. HLA decreased from 0.74 to 0.66, with a growth rate of −0.74%, LCA from 0.75 to 0.59, with a growth rate of—13.43%, CSA from 0.76 to 0.42, with a growth rate of—40.25%.

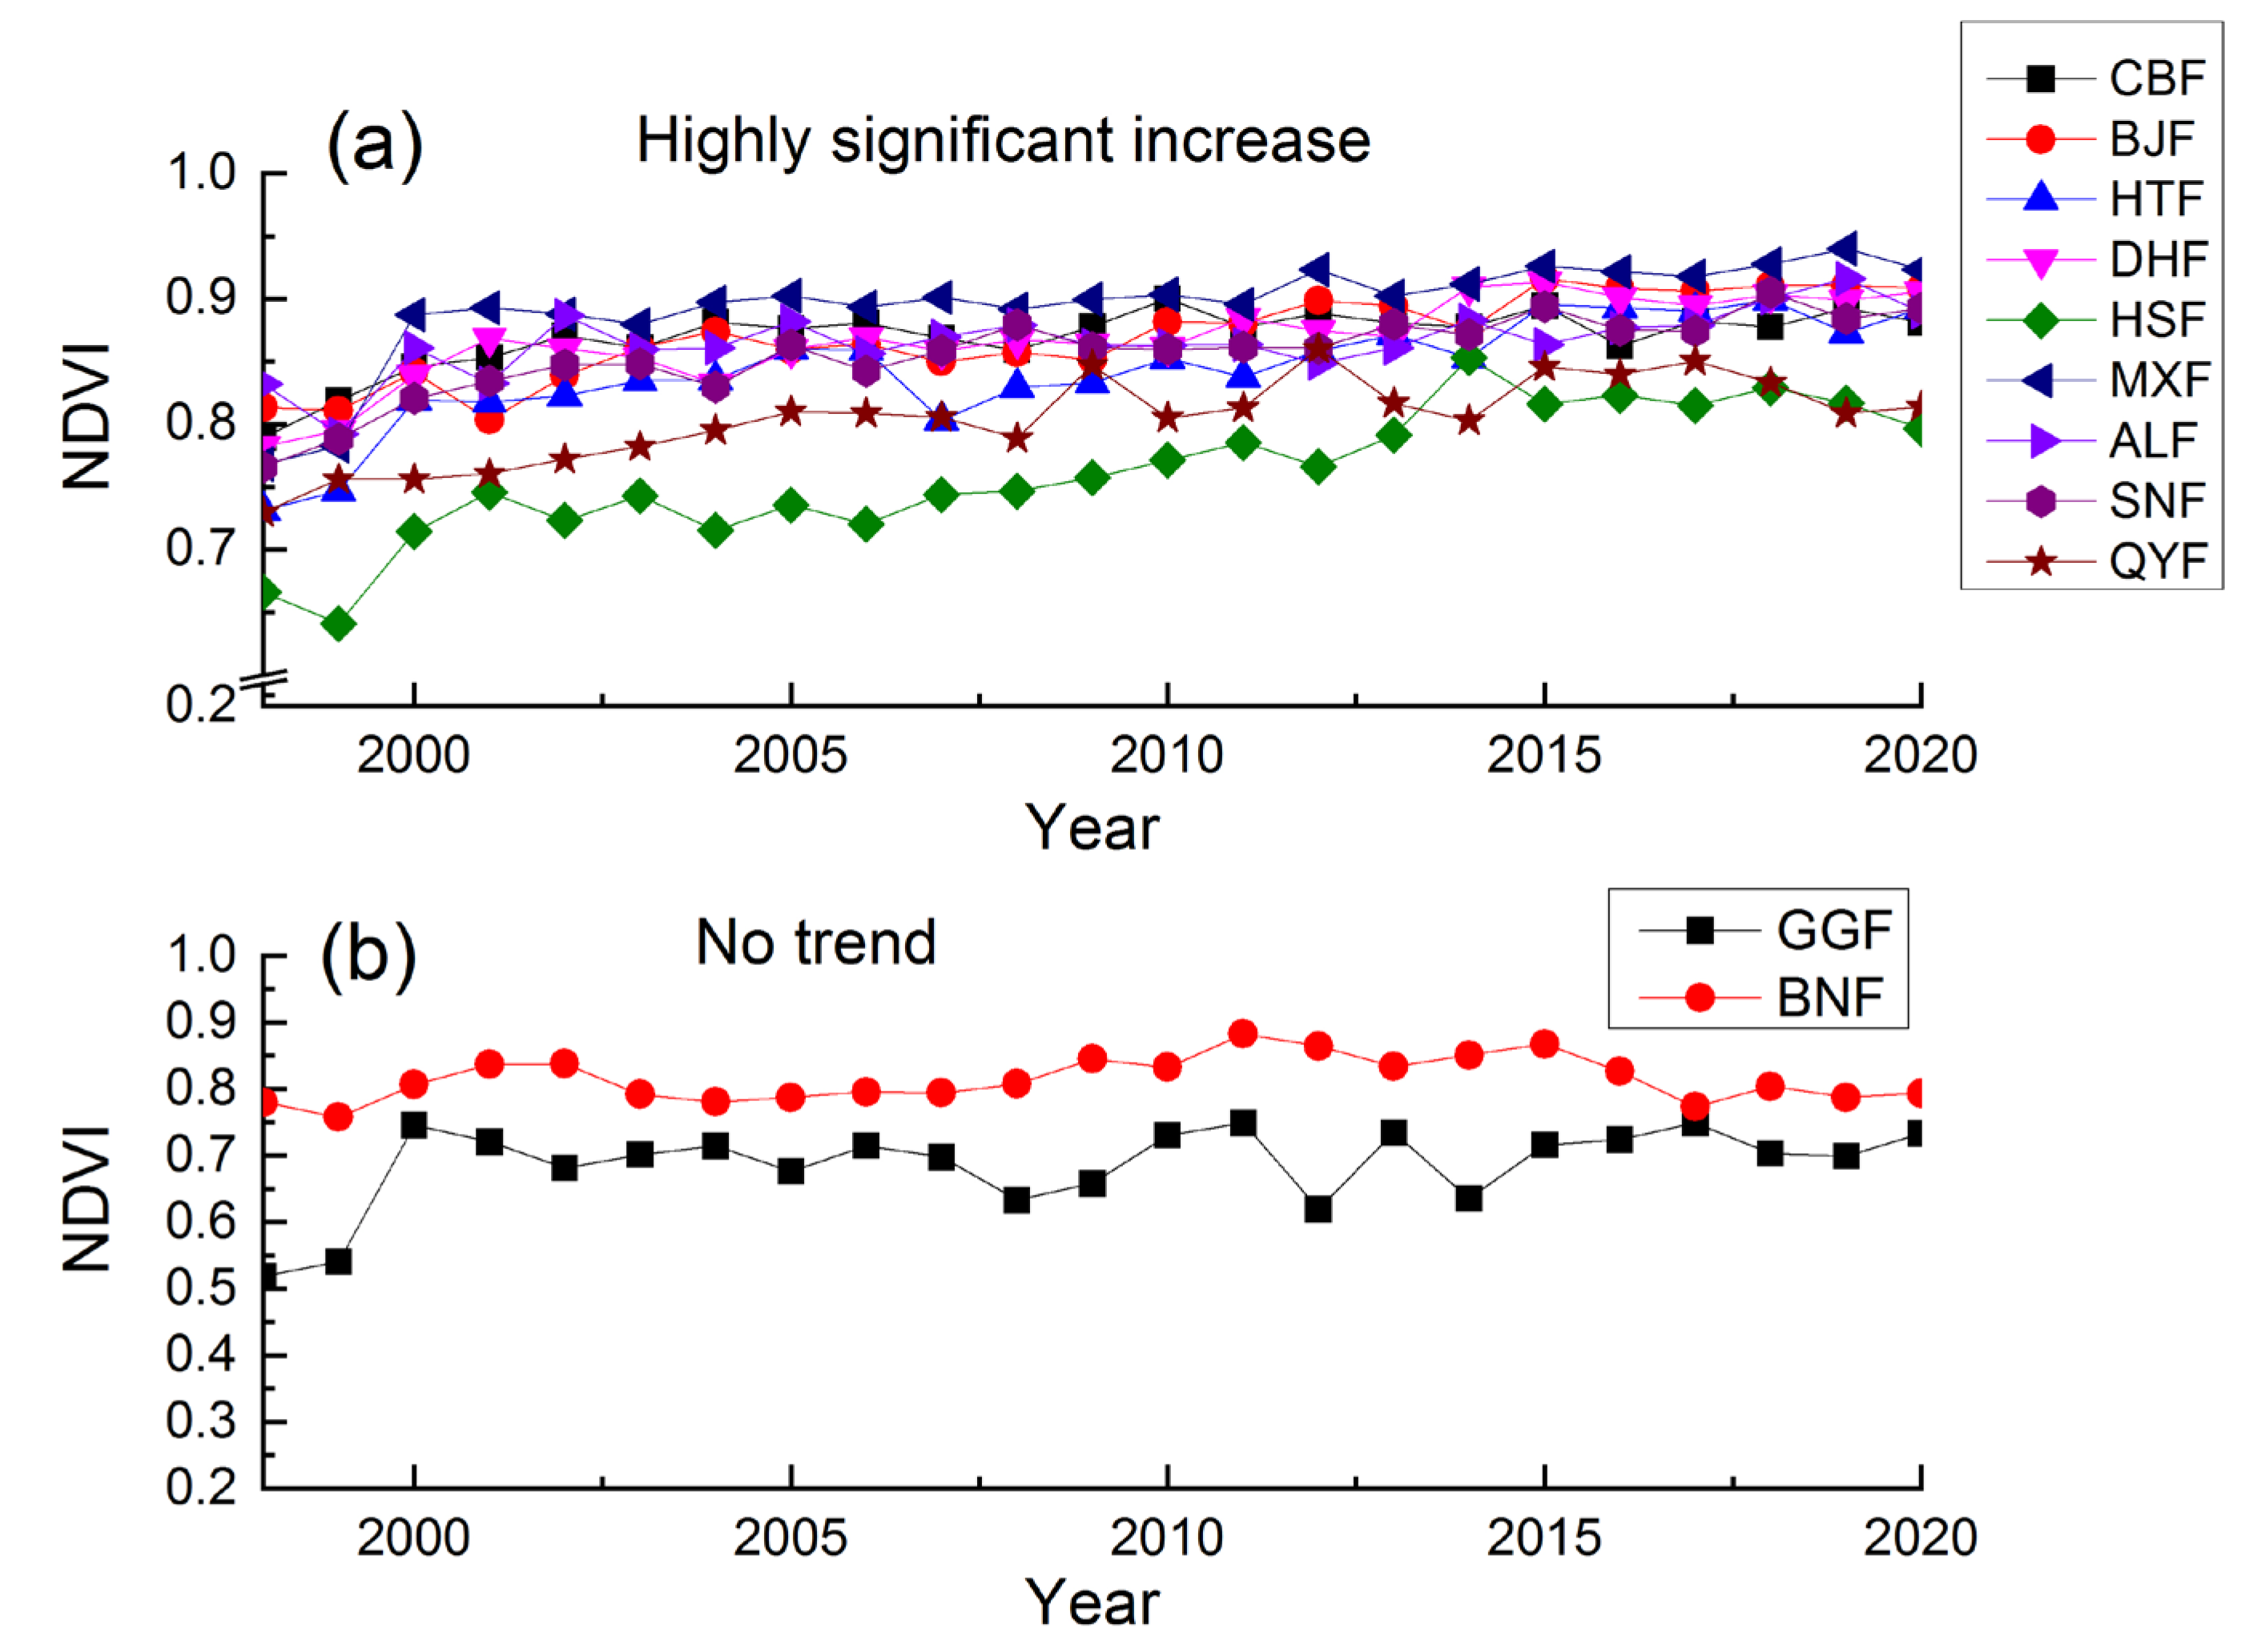
3.3.2. Forest Ecosystem Stations

Among the eleven stations belonging to the forest ecosystem, the NDVI of nine stations in CBF, BJF, SNF, HSF, DHF, ALF, MXF, HTF, and QYF showed a very significant upward trend, with a slope of 1.88 × 10⁻³–6.62 × 10⁻³, p < 0.01 (Figure 5). The slope of HSF is the largest, showing a very significant increase trend (6.62 × 10⁻³, p < 0.01). The slope of CBF is the smallest (1.88 × 10⁻³, p < 0.01). However, GGF and BNF did not pass the significance level test (p > 0.05) but showed a slight upward trend.
Specifically, the NDVI of BNF increased the least, with a growth rate of only 1.76%. The NDVI growth rates of the rest stations are distributed between 5% and 20%. The growth rates of CBF, BJF, HTF, DHF, HSF, MXF, ALF, SNF, and QYF are 11.63%, 11.71%, 22.05%, 15.83%, 19.60%, 20.22%, 6.89%, 16.50%, and 11.60%, respectively. The NDVI of GGS does not change significantly.

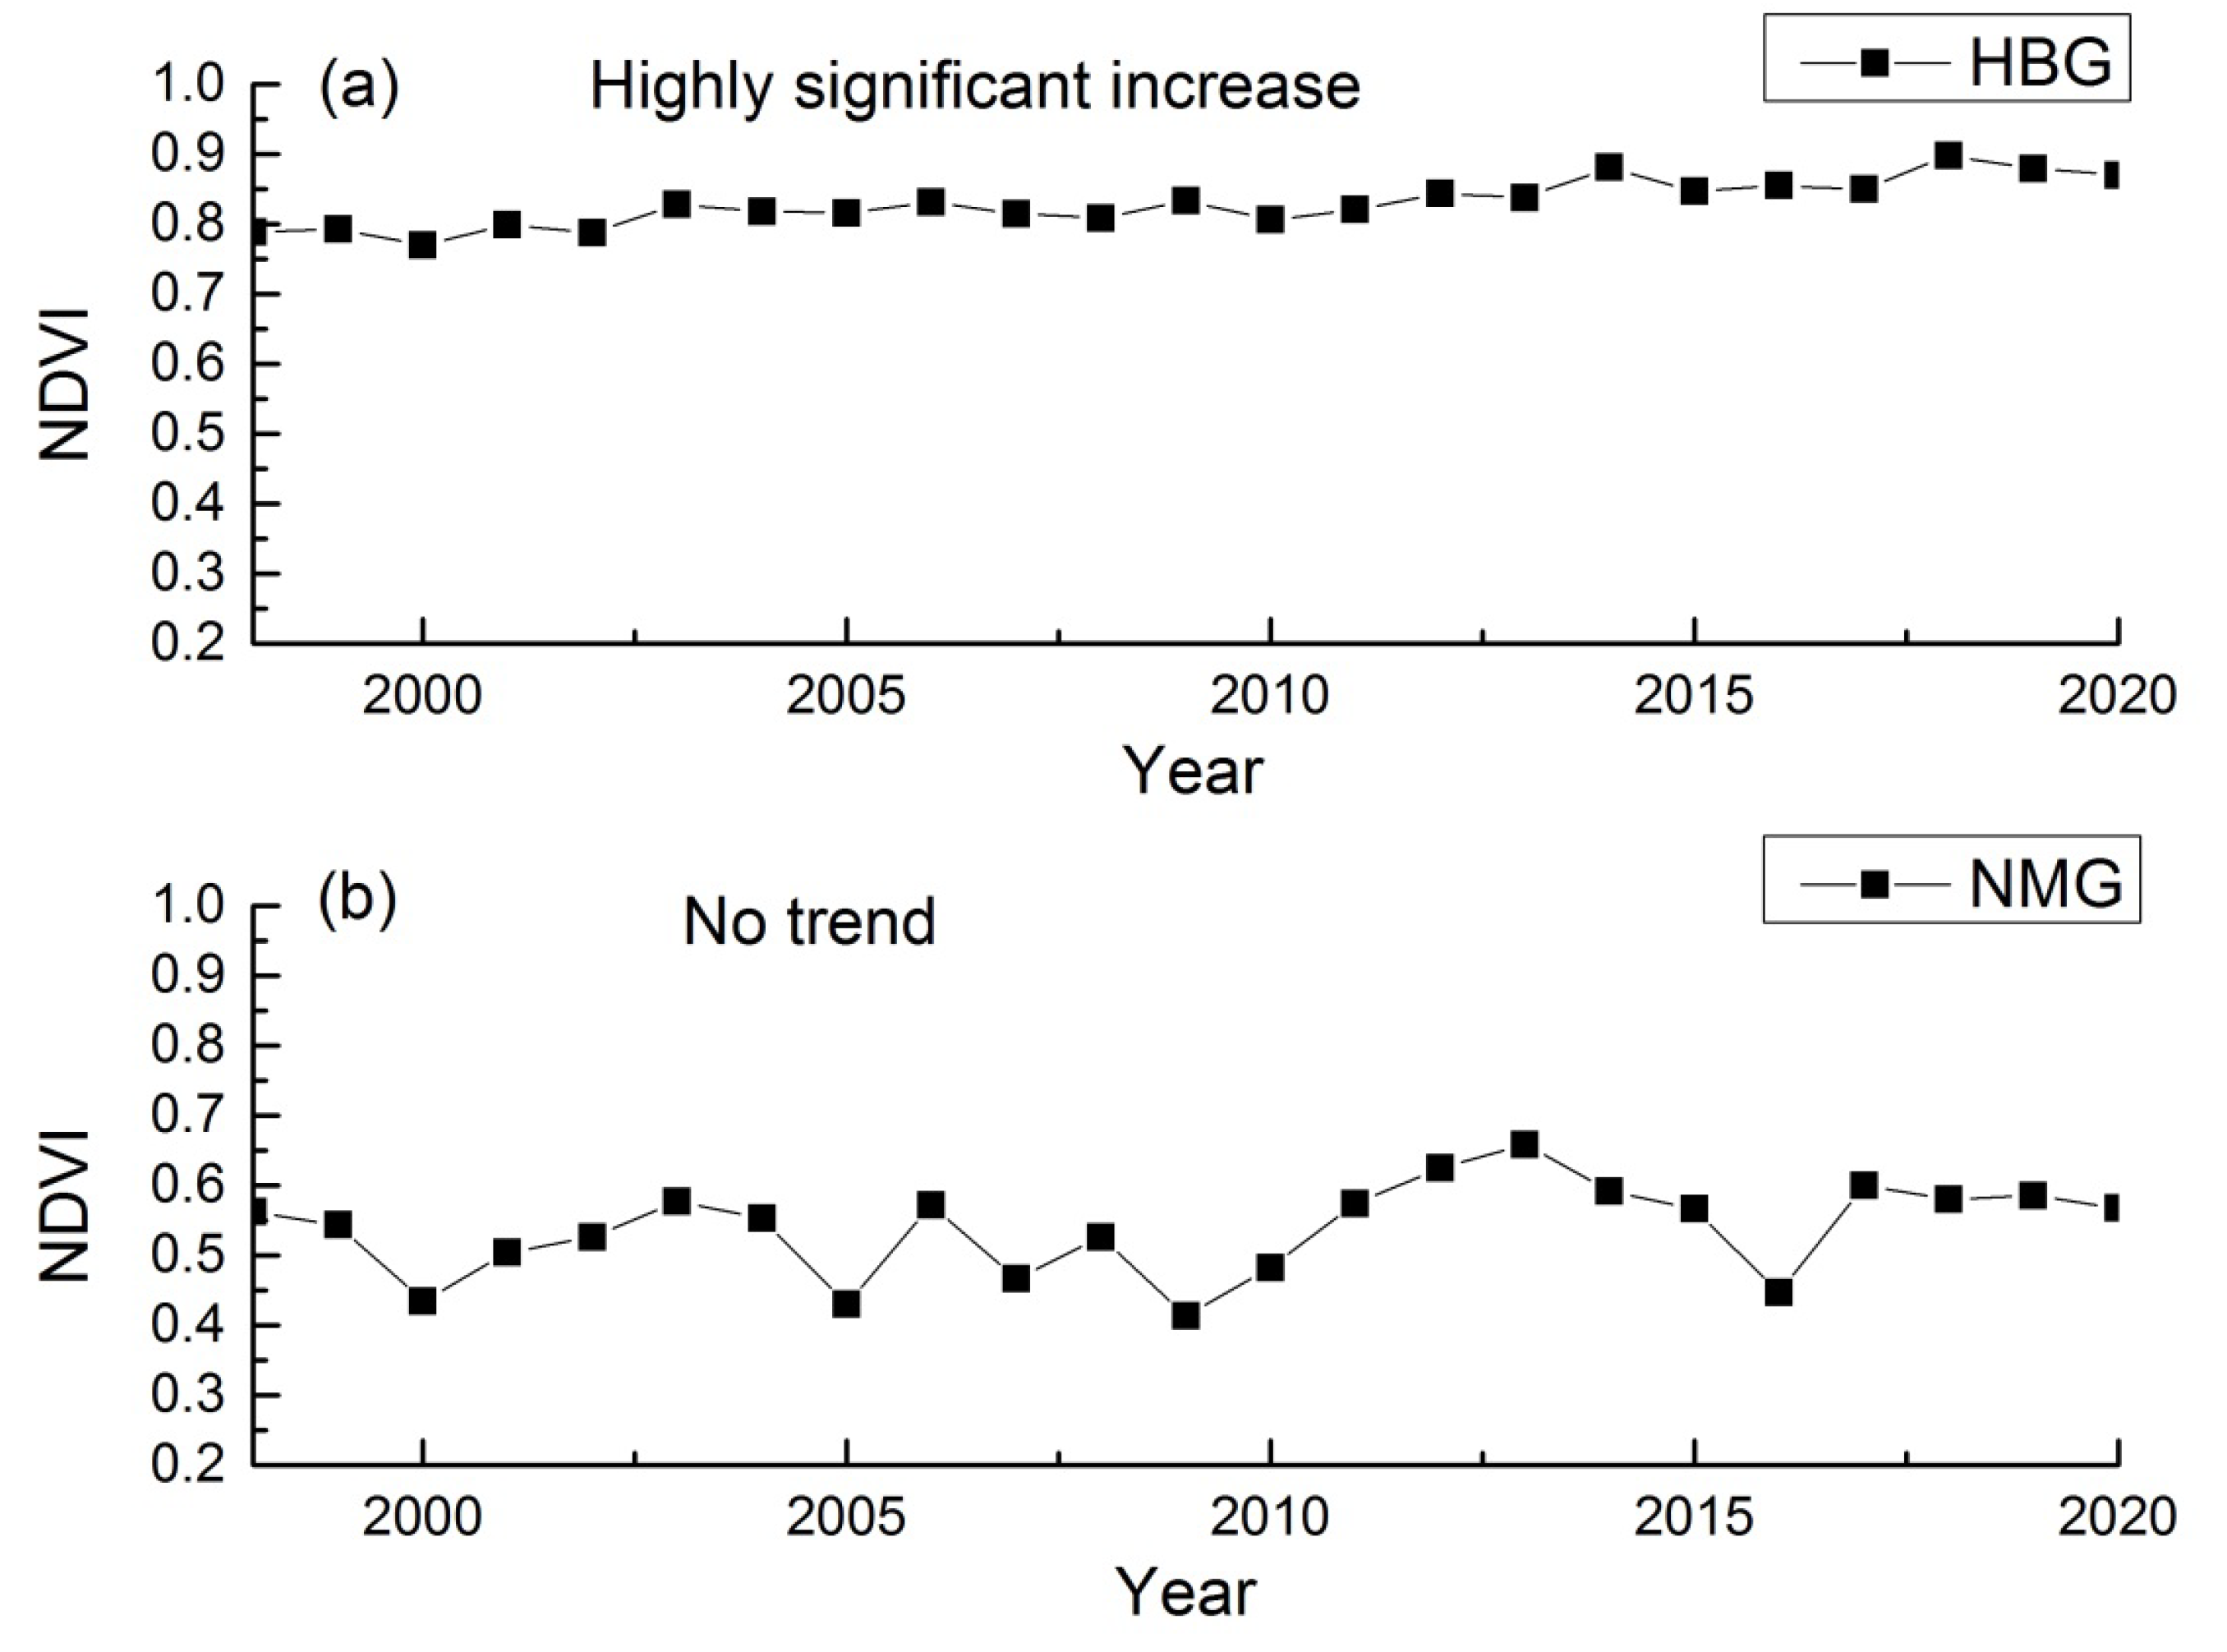
3.3.3. Grassland Ecosystem Stations

Among the two stations belonging to the grassland ecosystem, the NDVI of HBG shows a very significant upward trend (Figure 6). The slope of NDVI change is slope = 2.45 × 10⁻³, p < 0.01, the low-value year appeared in 2000, and the high-value year appeared in 2018. The NMG did not pass the significance test (p > 0.1). From the specific value, HBG increased from 0.79 to 0.86, with a growth rate of 6.09%. Although the NDVI of NMG fluctuated, there was no significant change.

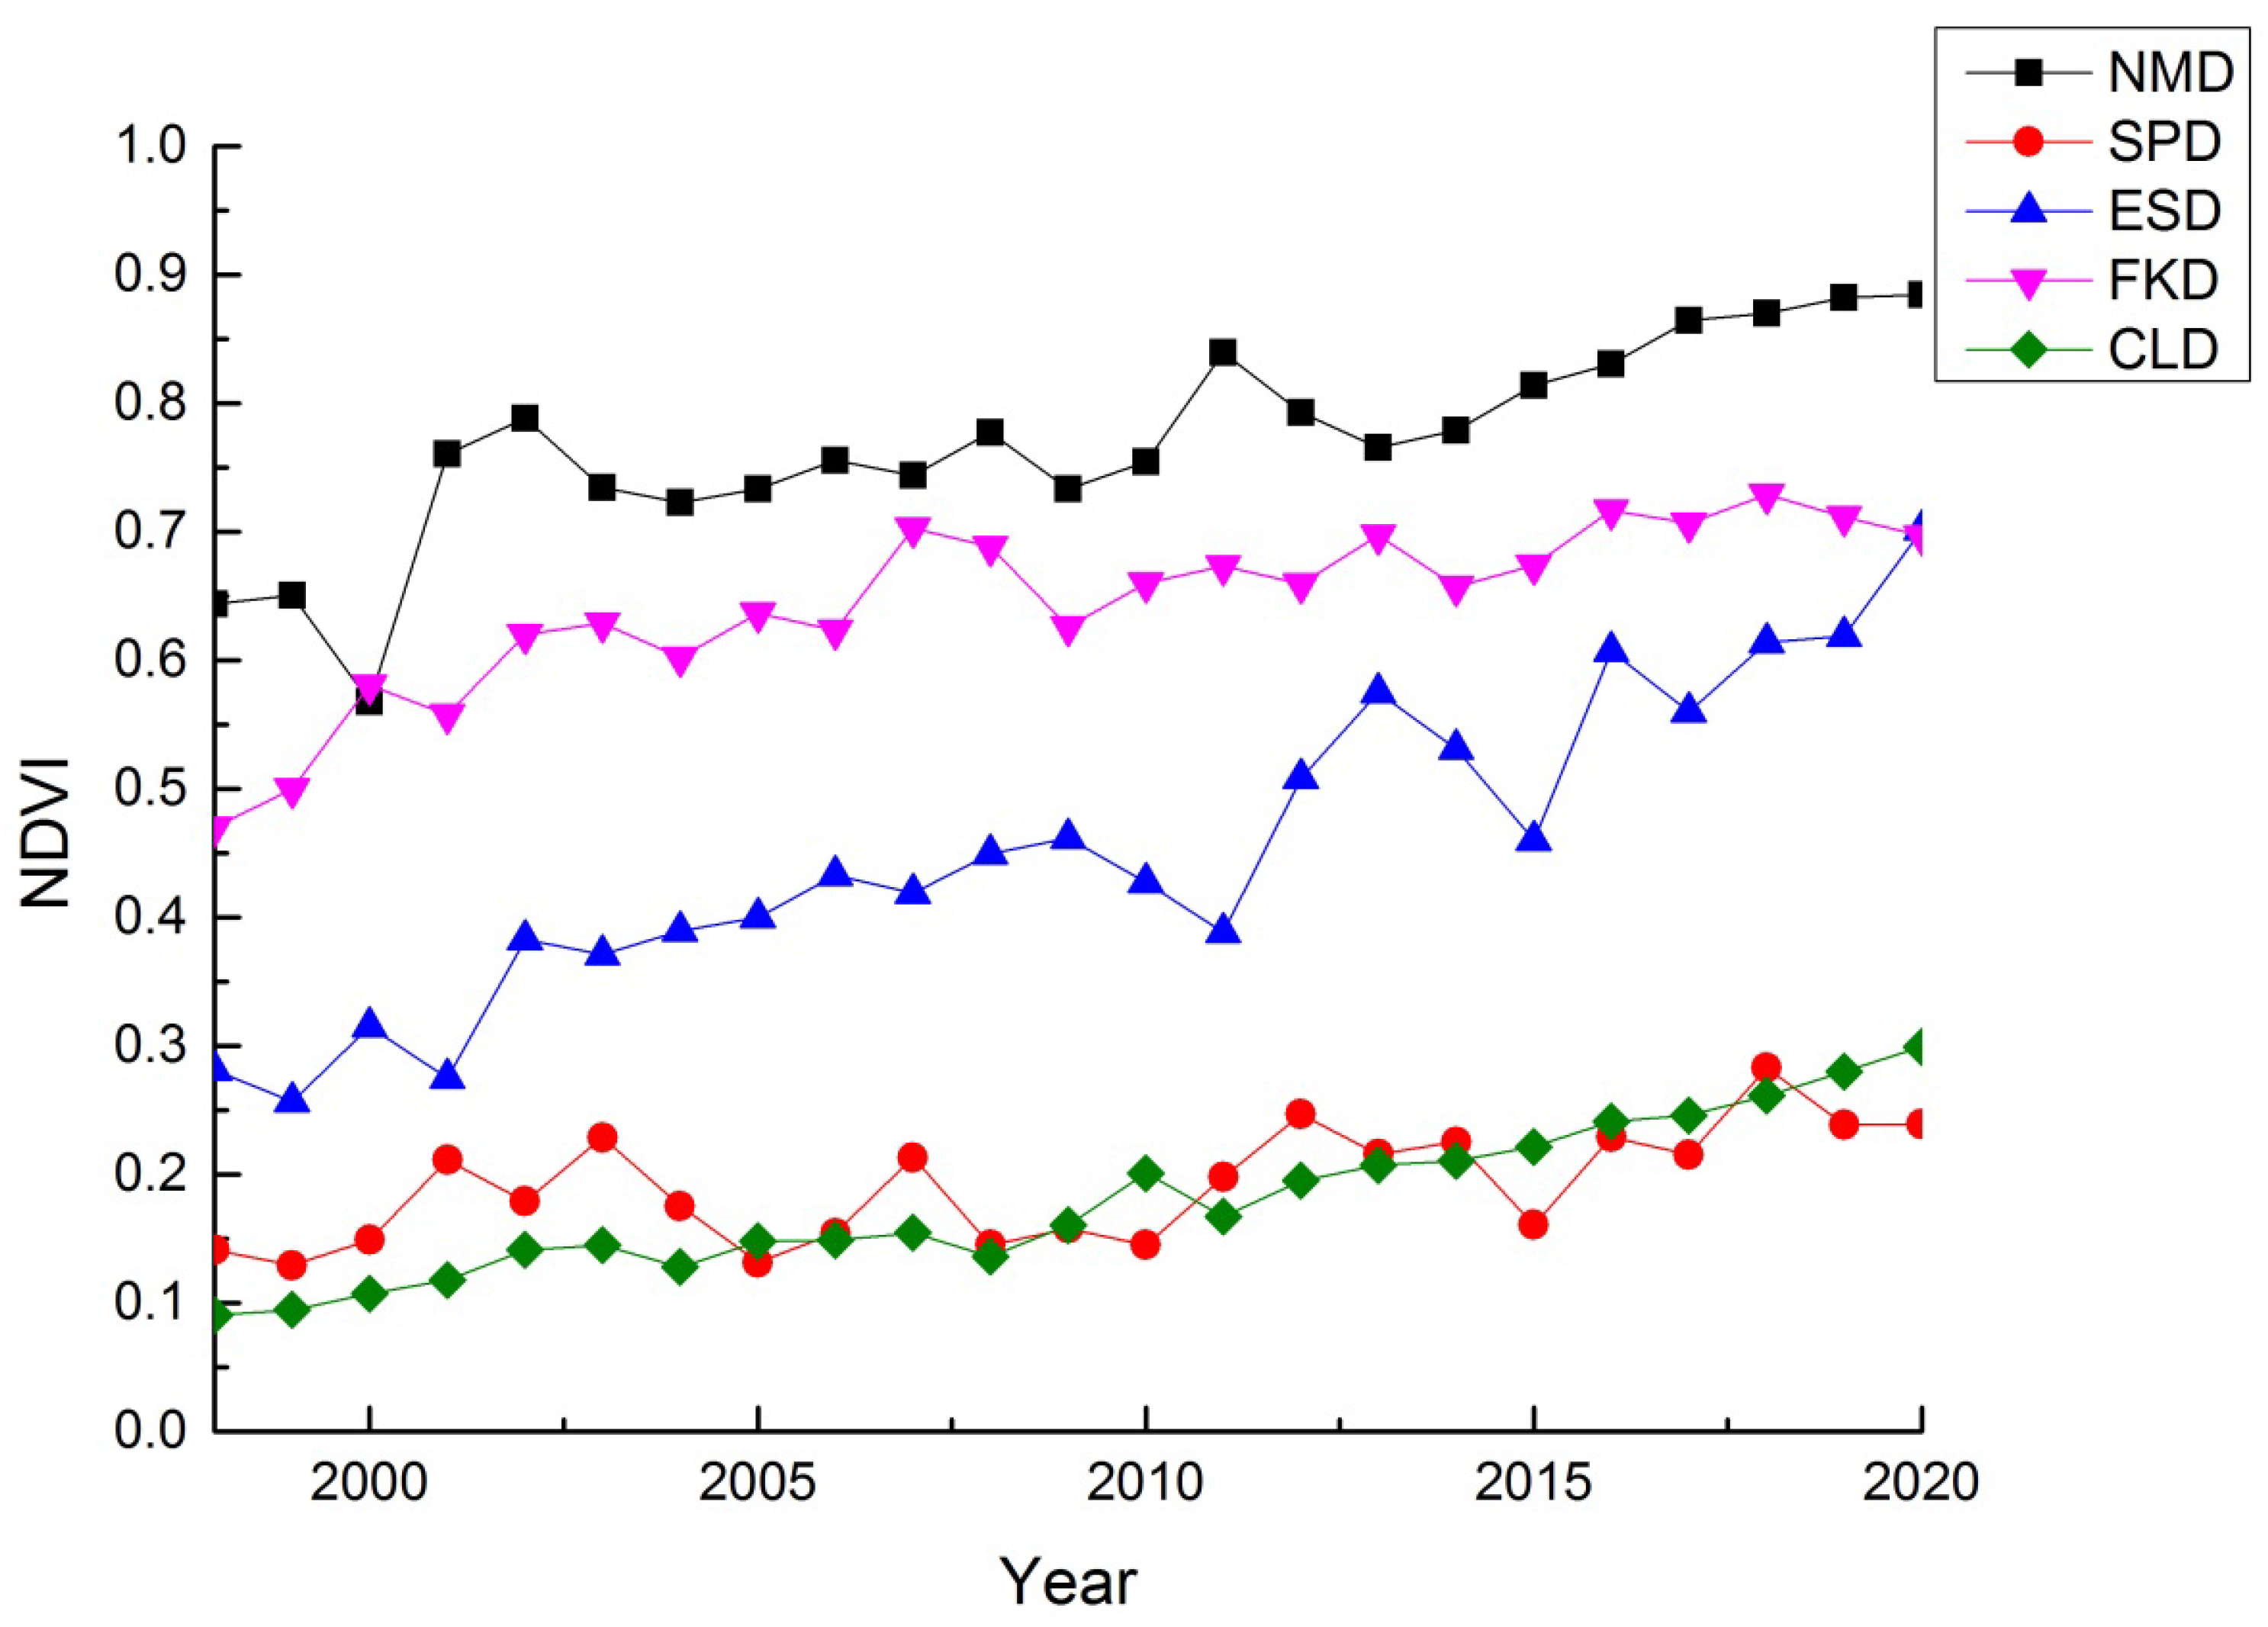
3.3.4. Desert Ecosystem Stations

The five stations belonging to the desert ecosystem showed a very significant increase trend, and all passed the significance level test of 0.01. The growth rate of NDVI at SPD is the slowest (slope = 4.29 × 10⁻³, p < 0.01), the low value is in 2005, and the high value is in 2018. The NDVI of OSD has the fastest growth rate (slope = 1.59 × 10⁻², p < 0.01), the low value is in 1999, and the high value is in 2020. The slope range of NDVI change at NMD, FKD, and CLD is 6.97 × 10⁻³–9.63 × 10⁻³, p < 0.01 (Figure 7).
From the specific value, the NDVI of NMD increased from 0.64 to 0.88, with a growth rate of 37.34%; the NDVI of SPD increased from 0.14 to 0.24, with a growth rate of 69.21%; the NDVI of ESD increased from 0.28 to 0.70, with a growth rate of 149.73%; the NDVI of FKD increased from 0.47 to 0.70, with a growth rate of 48.26%; the NDVI of CLD increased from 0.09 to 0.30, with a growth rate of 230.25%.

4. Discussion

A large number of achievements have pointed out that climate change and human activities have a significant impact on vegetation change, and there are differences in ecosystem types [31,32,33]. In terms of time scale, ESD, ACA, ASA, and CWA are the four stations with the fastest increase in NDVI, and the annual average NDVI trend rate is in the range of 1.05 × 10⁻²–1.59 × 10⁻². At the same time, the two stations with the fastest decline in NDVI are LCA and CSA, which are located in Shijiazhuang City, Hebei Province, and Changshu City, Jiangsu Province, respectively. It is very likely that the difference in NDVI is caused by differences in agricultural farming behavior and crop types.
In terms of space, the NDVI change trend has a large spatial heterogeneity [34]. The stations with rapid rise are the types of agricultural and forest ecosystems distributed in the middle and lower reaches of the Yangtze River and the Yellow River, and the desert stations and agricultural stations in the west and north [35]. This is consistent with the research results of Song Changchun’s team [36]. The NDVI in the north of China rose relatively slowly, such as HLA, CBF, NMG, and SPD, while the NDVI in NMD and CLD rose significantly, far higher than other stations. Since 1998, the national and local governments have carried out a series of large-scale implementation of ecological construction projects to improve the desertification process in the region [37,38]. This is consistent with the research results of Fu Bojie’s team [39,40]. The NDVI in the west of China tends to increase or decrease slowly, but the NDVI in ACA is increasing significantly, which may be related to the development of oasis agriculture in Aksu [41]. The NDVI change trend of LSA is not obvious. The center and south of China is dominated by forests and agricultural stations, which are distributed in the middle and lower reaches of the Yangtze River and the Yellow River. Compared with other regions, NDVI of central and south of China increases faster, which may be related to the age of forests and the main crops planted in different regions [42]. This is consistent with the research results of Zhou Guoyi’s team [43]. CSA is located in the central and eastern regions, so the NDVI for many years shows a downward trend.
Remote sensing, as the most effective means of monitoring vegetation, is widely used in the study of terrestrial ecological changes, but there are also uncertainties. For example, the saturation effect of NDVI on high-cover vegetation can have a certain impact on its sensitivity when monitoring vegetation changes. In addition, using a buffer to extract NDVI makes it difficult to ensure the uniformity of ground objects within the pixel, and the problem of mixed pixels has also had a certain impact on the research. The vegetation type is regarded as invariant, which inevitably has a certain impact on the research.

5. Conclusions

We analyzed the dynamic change in NDVI based on remote sensing retrieval data and typical stations. We found that China’s terrestrial ecosystems mainly include forest ecosystems, grassland ecosystems, desert ecosystems, and farmland ecosystems. In 2020, the total area of four types of ecosystems accounted for 18.80%, 23.58%, 12.46%, and 31.48% of China’s land area, respectively. In the last 22 years, about 1/3 of China’s regions (3.04 × 10⁶ km2) had significantly improved vegetation quality, and 10% of the region (3.54 × 10⁵ km2) had decreased, which indicated that China’s ecological situation is continuously improving. The area with significant decline is mainly divided into two parts: one is the urban built-up area in the eastern region, and the other is the desert and grassland areas with poor natural conditions. For CERN stations, there is a large spatial heterogeneity in the NDVI change trend in the last 22 years. The NDVI of agricultural and forest stations in the north of China rose relatively slowly, such as HLA (slope = −3.81 × 10⁻³, p < 0.05) and CBF (slope = 1.88 × 10⁻³, p < 0.01), which is mainly limited by the natural climatic conditions and farming conditions. The NDVI of desert stations NMD and CLD has a significant upward trend (growth rates of 37.34% and 48.26%). The large-scale implementation of ecological restoration projects has reversed the process of desertification in the region. Most of the NDVI in the west of China showed a slow rise or slow decline trend, but the NDVI change trend of ACA increased significantly (growth rate of 71.64%), which may be related to the development of oasis agriculture in Aksu. Center and south of China is mostly dominated by forests and agricultural stations, which are distributed in the middle and lower reaches of the Yangtze River and the Yellow River. Compared with other regions, the NDVI of center and south of China rises faster, which is related to the better vegetation condition in the southern region. The NDVI in the east has shown a downward trend for many years.

Author Contributions

Conceptualization, L.J.; methodology, L.J. and Y.L.; formal analysis, L.J.; resources, L.J., Y.L. and H.X.; data curation, L.J., Y.L. and H.X.; writing of original draft, L.J. and Y.L.; writing—review and editing, L.J.; supervision, L.J. and Y.L.; project administration, L.J.; funding acquisition, L.J. All authors have read and agreed to the published version of the manuscript.

Funding

This research was funded by the National Natural Science Foundation of China, grant number 42071253.

Data Availability Statement

We use the MOD13Q1 data on the GEE platform to extract the annual maximum NDVI values of the surface and each station from 1998 to 2020. The dataset is from NASA LP DAAC, with a spatial resolution of 250m. The data ID in the GEE platform are (ee.ImageCollection (MODIS/061/MOD13Q1)). The types of terrestrial ecosystems in China are based on the classification of China’s land use data in 2020. The data are from Resource and Environment science Data Center of Chinese Academy of Sciences (https://www.resdc.cn/DOI/DOI.aspx?DOIID=54, accessed on 1 February 2023), the spatial resolution is 1 km. China’s ecological region data comes from China’s Ecosystem Assessment and Ecological Security Database (https://www.ecosystem.csdb.cn/ecoass/ecoplanning.jsp, accessed on 1 February 2023). CERN location data are from China Ecosystem Research Network (http://www.cern.ac.cn/0index/index.asp, accessed on 1 February 2023).

Acknowledgments

The authors are grateful to the reviewers for their comments and suggestions.

Conflicts of Interest

The authors declare no conflict of interest.

References

  1. Jiang, M.; He, Y.; Song, C.; Pan, Y.; Qiu, T.; Tian, S. Disaggregating climatic and anthropogenic influences on vegetation changes in Beijing-Tianjin-Hebei region of China. Sci. Total Environ. 2021, 786, 147574. [Google Scholar] [CrossRef]
  2. Gong, X.; Li, Y.; Wang, X.; Zhang, Z.; Lian, J.; Ma, L.; Chen, Y.; Li, M.; Si, H.; Cao, W. Quantitative assessment of the contributions of climate change and human activities on vegetation degradation and restoration in typical ecologically fragile areas of China. Ecol. Indic. 2022, 144, 109536. [Google Scholar] [CrossRef]
  3. Yang, S.; Song, S.; Li, F.; Yu, M.; Yu, G.; Zhang, Q.; Cui, H.; Wang, R.; Wu, Y. Vegetation coverage changes driven by a combination of climate change and human activities in Ethiopia, 2003–2018. Ecol. Inform. 2022, 71, 101776. [Google Scholar] [CrossRef]
  4. Jackson, R.B.; Randerson, J.T.; Canadell, J.G.; Anderson, R.G.; Avissar, R.; Baldocchi, D.D.; Bonan, G.B.; Caldeira, K.; Diffenbaugh, N.S.; Field, C.B.; et al. Protecting climate with forests. Environ. Res. Lett. 2008, 3, 044006. [Google Scholar] [CrossRef]
  5. Liu, C.; Zhang, X.; Wang, T.; Chen, G.; Zhu, K.; Wang, Q.; Wang, J. Detection of vegetation coverage changes in the Yellow River Basin from 2003 to 2020. Ecol. Indic. 2022, 138, 108818. [Google Scholar] [CrossRef]
  6. Li, S.; Wang, J.; Zhang, M.; Tang, Q. Characterizing and attributing the vegetation coverage changes in North Shanxi coal base of China from 1987 to 2020. Resour. Policy 2021, 74, 102331. [Google Scholar] [CrossRef]
  7. Chen, J.; Shao, Z.; Huang, X.; Zhuang, Q.; Dang, C.; Cai, B.; Zheng, X.; Ding, Q. Assessing the impact of drought-land cover change on global vegetation greenness and productivity. Sci. Total Environ. 2022, 852, 158499. [Google Scholar] [CrossRef]
  8. Zhang, X.; Wang, G.; Xue, B.; A, Y. Changes in vegetation cover and its influencing factors in the Inner Mongolia reach of the yellow river basin from 2001 to 2018. Environ. Res. 2022, 215, 114253. [Google Scholar] [CrossRef]
  9. Beale, J.; Grabowski, R.C.; Lokidor, P.L.O.; Vercruysse, K.; Simms, D.M. Vegetation cover dynamics along two Himalayan rivers: Drivers and implications of change. Sci. Total Environ. 2022, 849, 157826. [Google Scholar] [CrossRef]
  10. Miller, D.L.; Wetherley, E.B.; Roberts, D.A.; Tague, C.L.; McFadden, J.P. Vegetation cover change during a multi-year drought in Los Angeles. Urban Clim. 2022, 43, 101157. [Google Scholar] [CrossRef]
  11. Bai, Y.; Li, S.; Liu, M.; Guo, Q. Assessment of vegetation change on the Mongolian Plateau over three decades using different remote sensing products. J. Environ. Manag. 2022, 317, 115509. [Google Scholar] [CrossRef] [PubMed]
  12. Du, H.; Wang, M.; Liu, Y.; Guo, M.; Peng, C.; Li, P. Responses of autumn vegetation phenology to climate change and urbanization at northern middle and high latitudes. Int. J. Appl. Earth Obs. Geo-Inf. 2022, 115, 103086. [Google Scholar] [CrossRef]
  13. Geng, X.; Wang, X.; Fang, H.; Ye, J.; Han, L.; Gong, Y.; Cai, D. Vegetation coverage of desert ecosystems in the Qinghai-Tibet Plateau is underestimated. Ecol. Indic. 2022, 137, 108780. [Google Scholar] [CrossRef]
  14. Zhang, P.; Cai, Y.; He, Y.; Xie, Y.; Zhang, X.; Li, Z. Changes of vegetational cover and the induced impacts on hydrological processes under climate change for a high-diversity watershed of south China. J. Environ. Manag. 2022, 322, 115963. [Google Scholar] [CrossRef] [PubMed]
  15. Gu, F.; Xu, G.; Wang, B.; Jia, L.; Xu, M. Vegetation cover change and restoration potential in the Ziwuling Forest Region, China. Ecol. Eng. 2023, 187, 106877. [Google Scholar] [CrossRef]
  16. Ni, Y.; Yu, Z.; Lv, X.; Ma, L.; Zhang, Q.; Wang, J. Response of runoff to vegetation change in typical basin of the Loess Plateau. Ecol. Eng. 2022, 182, 106704. [Google Scholar] [CrossRef]
  17. Yang, S.; Zhou, B.; Lou, H.; Wu, Z.; Wang, S.; Zhang, Y.; Pan, Z.; Li, C. Remote sensing hydrological indication: Responses of hydrological processes to vegetation cover change in mid-latitude mountainous regions. Sci. Total Environ. 2022, 851, 158170. [Google Scholar] [CrossRef]
  18. Sun, G.; Li, L.; Li, J.; Liu, C.; Wu, Y.; Gao, S.; Wang, Z.; Feng, G. Impacts of climate change on vegetation pattern: Mathematical modeling and data analysis. Phys. Life Rev. 2022, 43, 239–270. [Google Scholar] [CrossRef]
  19. Shen, F.; Yang, L.; Zhang, L.; Guo, M.; Huang, H.; Zhou, C. Quantifying the direct effects of long-term dynamic land use intensity on vegetation change and its interacted effects with economic development and climate change in jiangsu, China. J. Environ. Manag. 2023, 325, 116562. [Google Scholar] [CrossRef]
  20. Cai, Y.; Zhang, F.; Duan, P.; Chi, Y.J.; Ngai, W.C.; Shi, J.; Liu, C.; Wang, J.; Bahtebay, J.; Ma, X. Vegetation cover changes in China induced by ecological restoration-protection projects and land-use changes from 2000 to 2020. Catena 2022, 217, 106530. [Google Scholar] [CrossRef]
  21. Li, D.; Lu, D.; Zhao, Y.; Zhou, M.; Chen, G. Spatial patterns of vegetation coverage change in giant panda habitat based on MODIS time-series observations and local indicators of spatial association. Ecol. Indic. 2021, 124, 107418. [Google Scholar] [CrossRef]
  22. Wang, Y.; Chen, X.; Gao, M.; Dong, J. The use of random forest to identify climate and human interference on vegetation coverage changes in southwest China. Ecol. Indic. 2022, 144, 109463. [Google Scholar] [CrossRef]
  23. Ma, M.; Wang, Q.; Liu, R.; Zhao, Y.; Zhang, D. Effects of climate change and human activities on vegetation coverage change in northern China considering extreme climate and time-lag and -accumulation effects. Sci. Total Environ. 2022, 860, 160527. [Google Scholar] [CrossRef]
  24. Zheng, K.; Tan, L.; Sun, Y.; Wu, Y.; Duan, Z.; Xu, Y.; Gao, C. Impacts of climate change and anthropogenic activities on vegetation change: Evidence from typical areas in China. Ecol. Indic. 2021, 126, 107648. [Google Scholar] [CrossRef]
  25. Lin, M.; Hou, L.; Qi, Z.; Wan, L. Impacts of climate change and human activities on vegetation NDVI in China’s Mu Us Sandy Land during 2000–2019. Ecol. Indic. 2022, 142, 109164. [Google Scholar] [CrossRef]
  26. Yang, S.; Liu, J.; Wang, C.; Zhang, T.; Dong, X.; Liu, Y. Vegetation dynamics influenced by climate change and human activities in the Hanjiang River Basin, central China. Ecol. Indic. 2022, 145, 109586. [Google Scholar] [CrossRef]
  27. Sun, L.; Zhao, D.; Zhang, G.; Wu, X.; Yang, Y.; Wang, Z. Using SPOT/VEGETATION for analyzing dynamic changes and influencing factors on vegetation restoration in the Three-River Headwaters Region in the last 20 years (2000–2019), China. Ecol. Eng. 2022, 183, 106742. [Google Scholar] [CrossRef]
  28. Fu, B.; Li, S.; Yu, X.; Yang, P.; Yu, G.; Feng, R.; Zhuang, X. Chinese ecosystem research network: Progress and perspectives. Ecol. Complex. 2010, 7, 225–233. [Google Scholar] [CrossRef]
  29. Zhao, W.; Yu, X.; Xu, C. Social-ecological system management in drylands: Experiences from Chinese Ecosystem Research Network. Curr. Opin. Environ. Sustain. 2021, 48, 93–102. [Google Scholar] [CrossRef]
  30. Xiaojing, W.; Honglin, H.; Zhang, L.; Feng, L.; Ren, X.; Liu, W.; Zou, C.; Lin, N. Spatial sampling design optimization of monitoring network for terrestrial ecosystem in China. Sci. Total Environ. 2022, 847, 157397. [Google Scholar] [CrossRef] [PubMed]
  31. Feng, H.; Xiong, J.; Ye, S.; Zou, B.; Wang, W. Vegetation change enhanced the positive global surface radiation budget. Adv. Space Res. 2022, 70, 324–335. [Google Scholar] [CrossRef]
  32. Fu, B.; Lan, F.; Xie, S.; Liu, M.; He, H.; Li, Y.; Liu, L.; Huang, L.; Fan, D.; Gao, E.; et al. Spatio-temporal coupling coordination analysis between marsh vegetation and hydrology change from 1985 to 2019 using LandTrendr algorithm and Google Earth Engine. Ecol. Indic. 2022, 137, 108763. [Google Scholar] [CrossRef]
  33. Zhang, H.; Zhan, C.; Xia, J.; Yeh, P.J.F. Responses of vegetation to changes in terrestrial water storage and temperature in global mountainous regions. Sci. Total Environ. 2022, 851, 158416. [Google Scholar] [CrossRef] [PubMed]
  34. Yang, C.; Li, G.; Yan, L.; Wu, J.; Li, J.; Liu, S.; Lu, Y. Effects of different vegetation types on ecosystem respiration in semiarid Loess Hilly Region, Central Gansu Province, China. Ecol. Indic. 2022, 145, 109683. [Google Scholar] [CrossRef]
  35. Bai, X.; Fu, J.; Li, Y.; Li, Z. Attributing vegetation change in an arid and cold watershed with complex ecosystems in northwest China. Ecol. Indic. 2022, 138, 108835. [Google Scholar] [CrossRef]
  36. Chen, N.; Song, C.; Xu, X.; Wang, X.; Cong, N.; Jiang, P.; Zu, J.; Sun, L.; Song, Y.; Zuo, Y.; et al. Divergent impacts of atmospheric water demand on gross primary productivity in three typical ecosystems in China. Agric. For. Meteorol. 2021, 307, 108527. [Google Scholar] [CrossRef]
  37. Tang, X.; Xiao, J.; Ma, M.; Yang, H.; Li, X.; Ding, Z.; Yu, P.; Zhang, Y.; Wu, C.; Huang, J.; et al. Satellite evidence for China’s leading role in restoring vegetation productivity over global karst ecosystems. For. Ecol. Manag. 2022, 507, 120000. [Google Scholar] [CrossRef]
  38. Yu, Q.; Lu, H.; Yao, T.; Xue, Y.; Feng, W. Enhancing sustainability of vegetation ecosystems through ecological engineering: A case study in the Qinghai-Tibet Plateau. J. Environ. Manag. 2023, 325, 116576. [Google Scholar] [CrossRef]
  39. Leng, X.; Feng, X.; Fu, B. Driving forces of agricultural expansion and land degradation indicated by Vegetation Continuous Fields (VCF) data in drylands from 2000 to 2015. Glob. Ecol. Conserv. 2020, 23, e01087. [Google Scholar] [CrossRef]
  40. Wu, X.; Wang, S.; Fu, B.; Liu, J. Spatial variation and influencing factors of the effectiveness of afforestation in China’s Loess Plateau. Sci. Total Environ. 2021, 771, 144904. [Google Scholar] [CrossRef]
  41. Gao, W.; Zheng, C.; Liu, X.; Lu, Y.; Chen, Y.; Wei, Y.; Ma, Y. NDVI-based vegetation dynamics and their responses to climate change and human activities from 1982 to 2020: A case study in the Mu Us Sandy Land, China. Ecol. Indic. 2022, 137, 108745. [Google Scholar] [CrossRef]
  42. Ma, S.; Qiao, Y.; Wang, L.; Zhang, J. Terrain gradient variations in ecosystem services of different vegetation types in mountainous regions: Vegetation resource conservation and sustainable development. For. Ecol. Manag. 2021, 482, 118856. [Google Scholar] [CrossRef]
  43. Yu, Z.; Zhou, G.; Liu, S.; Sun, P.; Agathokleous, E. Impacts of forest management intensity on carbon accumulation of China’s forest plantations. For. Ecol. Manag. 2020, 472, 118252. [Google Scholar] [CrossRef]
Figure 1. Ecological region and spatial distribution of typical stations in China.
Remotesensing 15 02276 g001
Figure 2. Distribution pattern of terrestrial ecosystems in China in 2020.
Remotesensing 15 02276 g002
Figure 3. Spatial distribution of NDVI change rate of ecosystem in China from 1998 to 2020.
Remotesensing 15 02276 g003
Figure 4. NDVI change trend of agricultural ecosystem stations: (a) highly significant increase; (b) significant increase; (c) highly significant decrease; (d) significant decrease; (e) no trend.
Remotesensing 15 02276 g004
Figure 5. NDVI change trend of forest ecosystem stations: (a) highly significant increase; (b) no trend.
Remotesensing 15 02276 g005
Figure 6. NDVI change trend of grassland ecosystem stations: (a) highly significant increase; (b) no trend.
Remotesensing 15 02276 g006
Figure 7. NDVI change trend of desert ecosystem stations.
Remotesensing 15 02276 g007
Table 1. List of agricultural, forest, desert, grassland, and urban ecosystem stations.
Agricultural Ecosystems: 14Forest Ecosystems: 11Desert Ecosystems: 5Grass Ecosystems: 2
ACAAkesuBJFBeijingFCLDCeleHBGHaibei
LSALasaMXFMaoxianESDErdosNMGNeimenggu
HLAHailunGGFGonggashanFKDFukang
YCAYuchengALFAilaoshanNMDNaiman
ASAAnsaiBNFBannaSPDShapotou
CWAChangwuHSFHeshan
YTAYingtanDHFDinghushan
CSAChangshuSNFShennongjia
TYATaoyuanHTFHuitong
FQAFengqiuCBFChangbaishan
YGAYantingQYFQianyanzhou
LCALuancheng
SYAShenyang
LZALinze
Table 2. NDVI change trend and significance test.
SNDVIZpNDVI Change Trend
S > 0|Z| > 2.58p < 0.01Highly significant increase
S > 0|Z| > 1.96p < 0.05Significant increase
|Z| < 1.96p > 0.05No trend (stable)
S < 0|Z| > 1.96p < 0.05Significant decrease
S < 0|Z| > 2.58p < 0.01Highly significant decrease
Table 3. NDVI change trend and significance test statistics of ecosystem stations.
NameTrendhpzSlope 10−2
1HLASignificant decreasingTRUEp < 0.05−2.41−0.38
2SYAHighly significant increasingTRUEp < 0.012.700.24
3YCAHighly significant increasingTRUEp < 0.012.650.32
4FQASignificant increasingTRUEp < 0.052.550.25
5LCAHighly significant decreasingTRUEp < 0.01−2.85−0.57
6CSAHighly significant decreasingTRUEp < 0.01−3.70−1.04
7TYAHighly significant increasingTRUEp < 0.014.490.48
8YTAHighly significant increasingTRUEp < 0.014.190.45
9YGASignificant increasingTRUEp < 0.052.260.21
10ASAHighly significant increasingTRUEp < 0.015.631.16
11CWAHighly significant increasingTRUEp < 0.015.281.05
12LZAHighly significant increasingTRUEp < 0.013.840.49
13LSANo trendFALSE0.35870.920.13
14ACAHighly significant increasingTRUEp < 0.015.281.24
15CBFHighly significant increasingTRUEp < 0.013.700.19
16BJFHighly significant increasingTRUEp < 0.015.040.43
17HTFHighly significant increasingTRUEp < 0.014.340.43
18DHFHighly significant increasingTRUEp < 0.014.940.38
19HSFHighly significant increasingTRUEp < 0.015.180.66
20MXFHighly significant increasingTRUEp < 0.015.230.26
21GGFNo trendFALSE0.08701.710.21
22ALFHighly significant increasingTRUEp < 0.013.350.20
23BNFNo trendFALSE0.15741.410.13
24SNFHighly significant increasingTRUEp < 0.015.230.36
25QYFHighly significant increasingTRUEp < 0.013.990.39
26NMGNo trendFALSE0.17251.360.24
27HBGHighly significant increasingTRUEp < 0.014.240.24
28NMDHighly significant increasingTRUEp < 0.014.89−0.04
29SPDHighly significant increasingTRUEp < 0.013.600.96
30ESDHighly significant increasingTRUEp < 0.015.430.43
31FKDHighly significant increasingTRUEp < 0.014.391.59
32CLDHighly significant increasingTRUEp < 0.016.370.70
Disclaimer/Publisher’s Note: The statements, opinions and data contained in all publications are solely those of the individual author(s) and contributor(s) and not of MDPI and/or the editor(s). MDPI and/or the editor(s) disclaim responsibility for any injury to people or property resulting from any ideas, methods, instructions or products referred to in the content.

