Article

Multilevel Data and Decision Fusion Using Heterogeneous Sensory Data for Autonomous Vehicles

by
Henry Alexander Ignatious
1,
Hesham El-Sayed
1,2,* and
Parag Kulkarni
1
1
College of Information Technology, United Arab Emirates University, Al Ain P.O. Box 15551, United Arab Emirates
2
Emirates Center for Mobility Research, United Arab Emirates University, Al Ain P.O. Box 15551, United Arab Emirates
*
Author to whom correspondence should be addressed.
Remote Sens. 2023, 15(9), 2256; https://doi.org/10.3390/rs15092256
Submission received: 21 February 2023 / Revised: 13 March 2023 / Accepted: 14 March 2023 / Published: 24 April 2023
(This article belongs to the Special Issue Data Fusion for Urban Applications)

Abstract

:
Autonomous vehicles (AVs) are predicted to change transportation; however, it is still difficult to maintain robust situation awareness in a variety of driving situations. To enhance AV perception, methods to integrate sensor data from the camera, radar, and LiDAR sensors have been proposed. However, due to rigidity in their fusion implementations, current techniques are not sufficiently robust in challenging driving scenarios (such as inclement weather, poor light, and sensor obstruction). These techniques can be divided into two main groups: (i) early fusion, which is ineffective when sensor data are distorted or noisy, and (ii) late fusion, which is unable to take advantage of characteristics from numerous sensors and hence yields sub-optimal estimates. In this paper, we suggest a flexible selective sensor fusion framework that learns to recognize the present driving environment and fuses the optimum sensor combinations to enhance robustness without sacrificing efficiency to overcome the above-mentioned limitations. The proposed framework dynamically simulates early fusion, late fusion, and mixtures of both, allowing for a quick decision on the best fusion approach. The framework includes versatile modules for pre-processing heterogeneous data such as numeric, alphanumeric, image, and audio data, selecting appropriate features, and efficiently fusing the selected features. Further, versatile object detection and classification models are proposed to detect and categorize objects accurately. Advanced ensembling, gating, and filtering techniques are introduced to select the optimal object detection and classification model. Further, innovative methodologies are proposed to create an accurate context and decision rules. Widely used datasets like KITTI, nuScenes, and RADIATE are used in experimental analysis to evaluate the proposed models. The proposed model performed well in both data-level and decision-level fusion activities and also outperformed other fusion models in terms of accuracy and efficiency.

1. Introduction

Autonomous vehicles (AVs) function in complex, dynamic situations with a wide variety of actors. To ensure safety in all driving environments, an AV needs to be able to swiftly and reliably interpret the environment. To deal with the uncertainties prevalent in difficult driving situations, the majority of contemporary AVs are outfitted with efficient and intelligent sensors and employ sensor fusion algorithms. Even with these techniques, AD is a very challenging undertaking, and accurate perception requires powerful deep-learning systems. Manufacturing-standard AV perception systems continue to frequently fail in challenging circumstances, despite recent advancements [1]. Increasing the size and complexity of AV algorithms and adding more sensors to them in order to cover as many driving circumstances as possible is a naive approach to the issue [2]. But since AVs are energy-constrained entities, using larger algorithms results in a shorter driving distance, higher costs, and higher power and thermal demands on the vehicle. Additionally, in some situations, combining additional sensors can actually produce less accurate results. Thus, algorithms that can adjust to dynamically changing driving contexts as they arise without increasing processing demands are necessary for robust and accurate AV perception. In deep convolutional neural networks (CNNs), which are commonly used in AV perception systems, sensor readings are processed through a number of convolutional layers to form spatial features. The detection of items in various areas of the visual scene is then accomplished using these attributes. Weather, lighting, and physical obstructions are just a few examples of variables that might affect sensor performance. Algorithms for sensor fusion try to integrate the advantages of each sensor to provide a more precise result. However, in dynamic environments, the scene’s context is frequently ignored or completely disregarded by the fusion method. Most of the current fusion models perform the fusion function only once during their life cycle, whether it is early fusion using the raw sensory data or late fusion after the object detection and feature extraction process are completed. Additionally, the majority of works employ static fusion techniques, which are independent of the operating environment of the AV. Numerous Cyber Physical System (CPS) applications have found success using context-aware sensing techniques. Humans naturally adapt their decisions and concentration when driving based on contextual information about the driving situation (such as the weather, lighting, type of road, and high-level visual elements). In complex driving scenarios, contextual information can also influence AV perception and enable more reliable fusion. The focus of this paper is on three main research issues: (i) developing a sensor fusion strategy that is robust in the face of a variety of scene contexts, noise sources, and sensor error types; (ii) leveraging scene context to enhance sensor fusion performance; and (iii) developing an effective multi-sensor fusion strategy for energy-constrained AV edge devices.
In this research, we offer an innovative fusion model which is a context-aware sensor fusion method that actively recognizes the driving environment and makes use of it to fuse particular sensor data from various modalities at various model depths. The proposed fusion model can increase the robustness of AV perception while reducing the computing demands on the energy-constrained AV edge platform by employing a selective sensor fusion strategy. Our research is the first to examine a context-aware selective sensor fusion method that can dynamically adapt the vehicle’s perception and use the fusion model accordingly. The key contributions of this research are as follows:
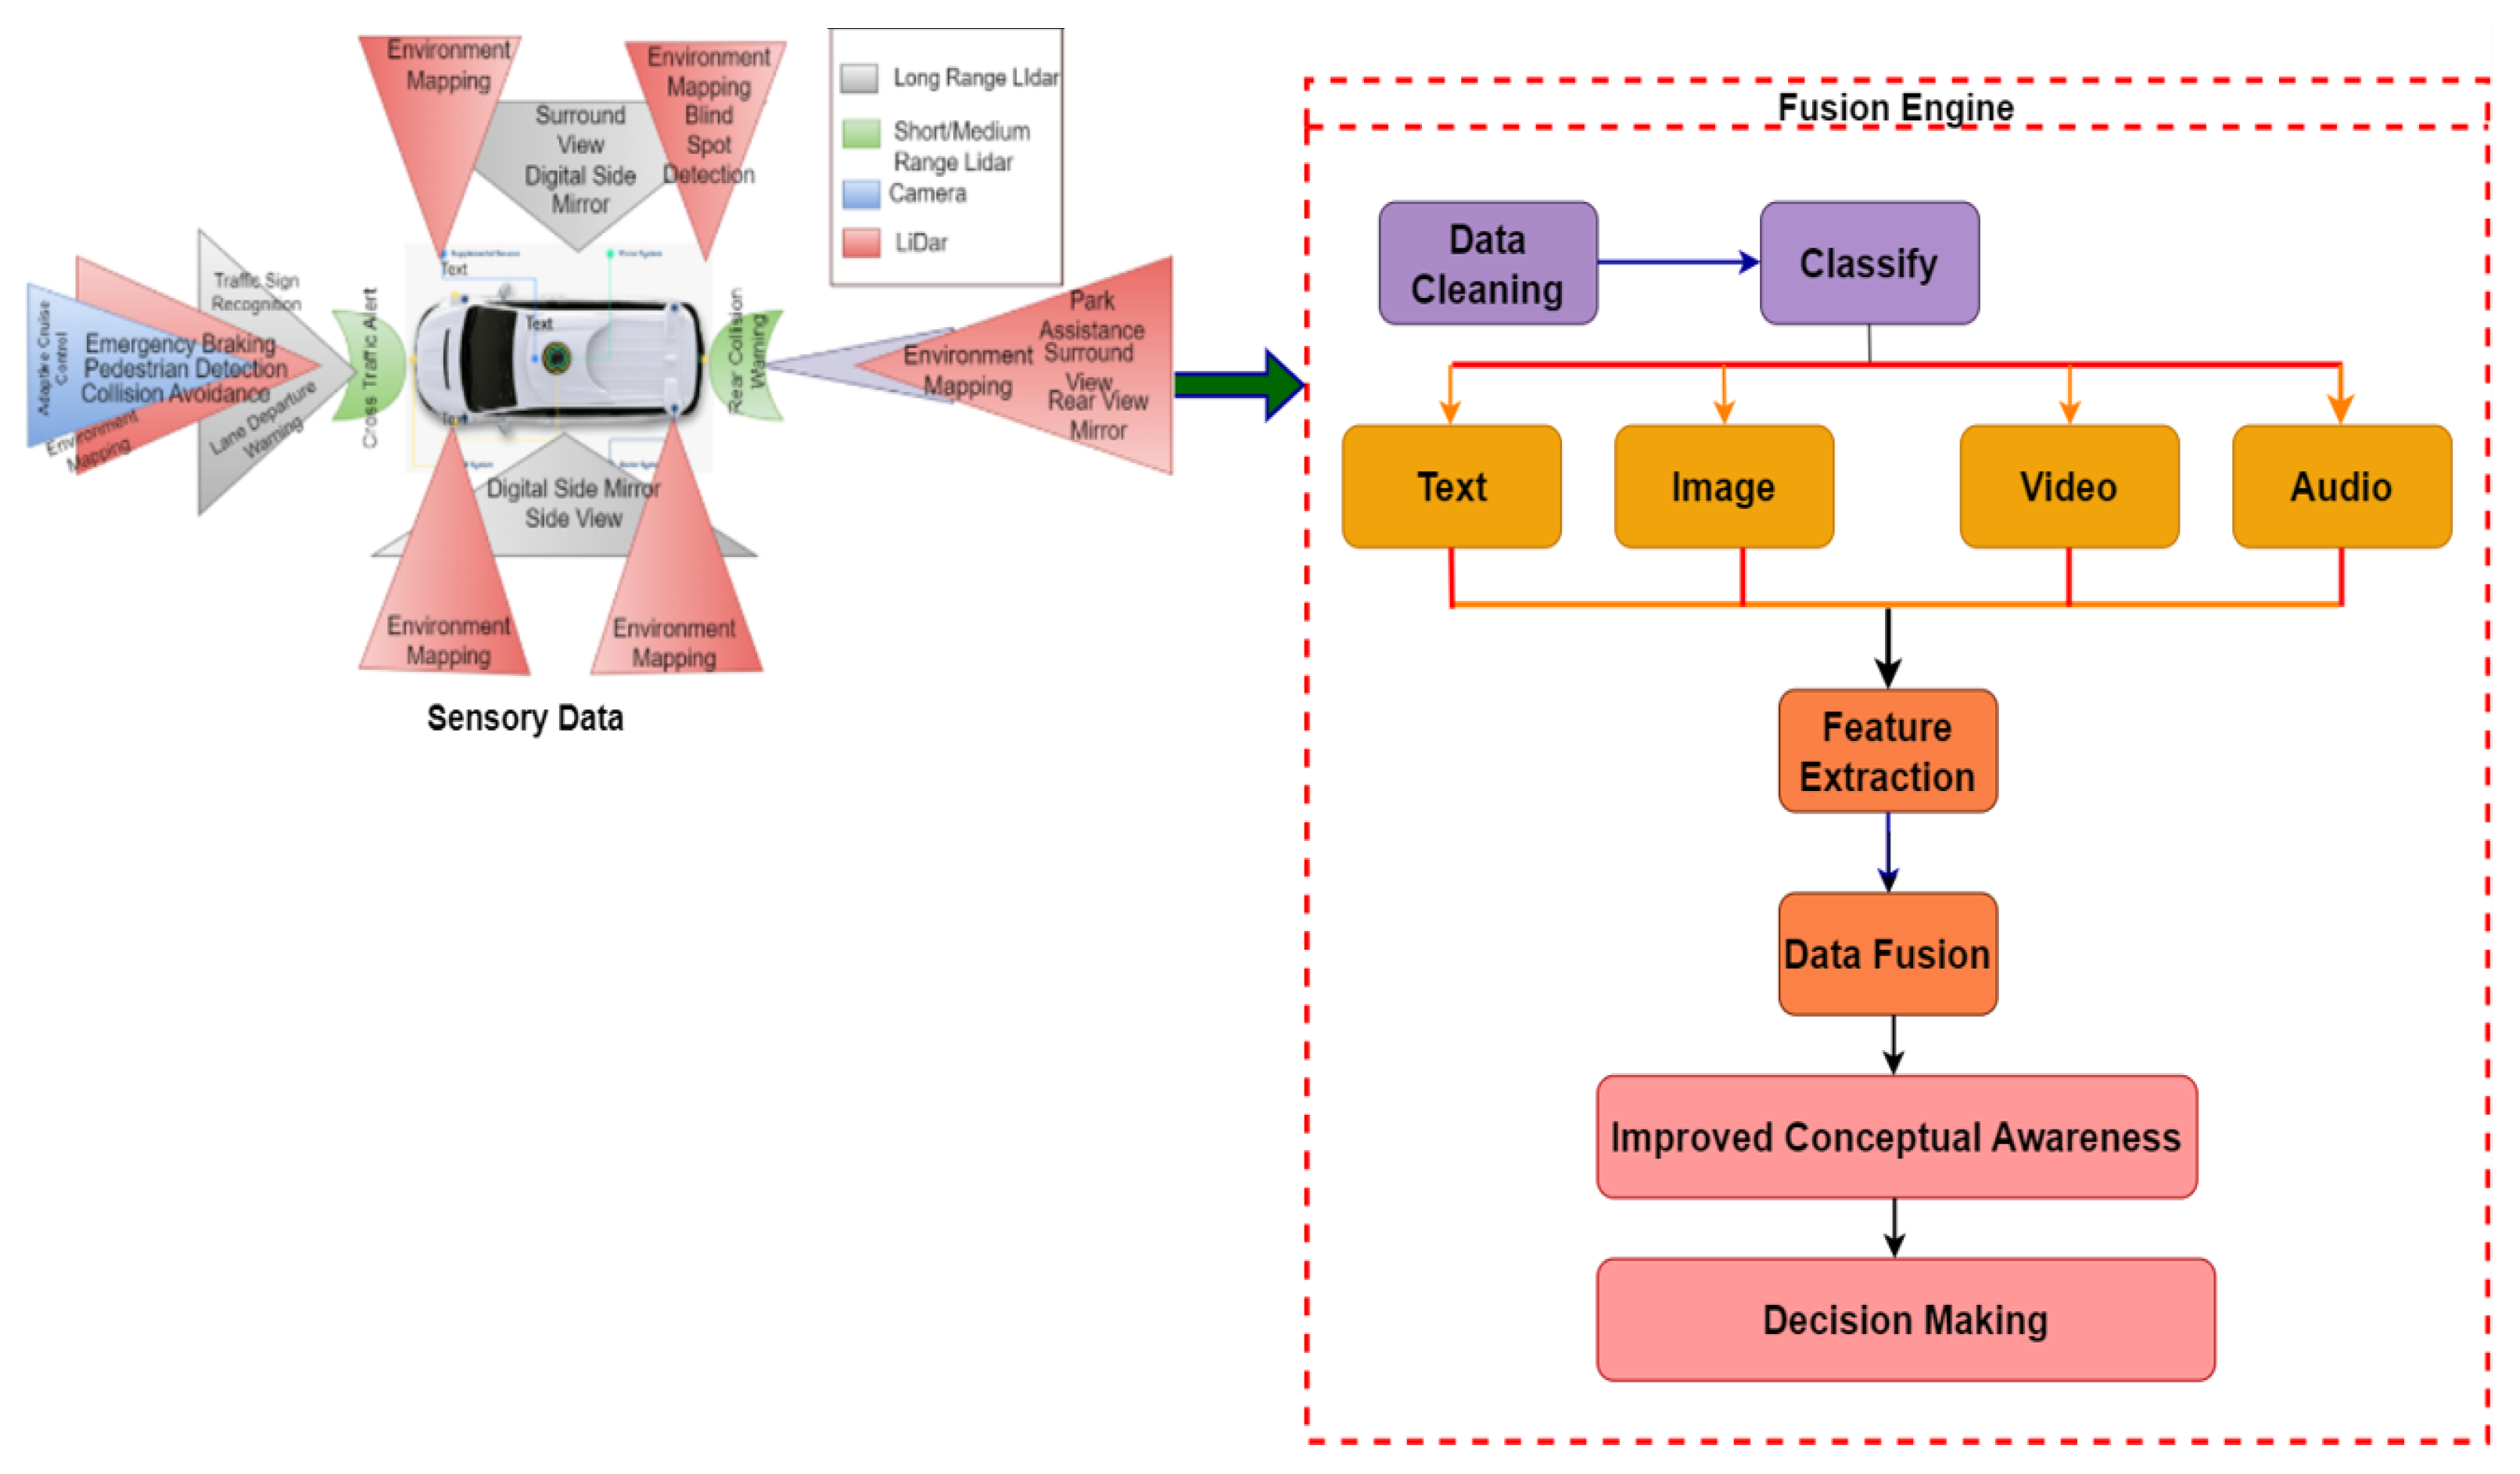
  • We propose a versatile fusion architecture that performs an early and late fusion of heterogeneous sensory data.
  • We provide intelligent, context-sensitive gating tactics that boost resilience by dynamically deciding which fusion mechanism to use based on the situation at hand.
  • We show that our methodology trumps existing methods on a demanding real-world dataset with a variety of driving scenarios, including adverse climatic conditions, poor lighting, and different location types.
  • We use an industry-standard AV hardware platform to implement our strategy, and we develop applications using Python. This ensures that our strategy can be practically implemented in a real AV with comparable energy consumption, latency, and memory usage to cutting-edge approaches.
The rest of the paper is organized as follows: Section 2 provides a detailed background theory and the motivational aspects related to the proposed models. Section 3 summarises the existing literature pertaining to various fusion models and strategies. Section 4 briefs the overall proposed approaches followed by Section 5, which illustrates the experimental setup used to implement the proposed model and a detailed analysis of the proposed fusion models. Finally, Section 6 summarises the contributions, overall analysis, and future directions related to this study.

2. Background and Motivation

We describe the theoretical background used to design the proposed fusion model. This research fuses the data based on three cases listed below:
  • Datasets having similar structure (identical columns with similar data types)
  • Datasets having different columns
  • Datasets that have dissimilar structures (columns having different data types)
Based on the above three cases, an appropriate mathematical approach must be identified to organize the data from different datasets. Upon analyzing, we identified that maximum likelihood concepts can be used to find the similarity between the data from different datasets. Maximum likelihood estimation (MLE) is a technique used in statistics to estimate the parameters of a statistical model for the given observations. This is done by identifying the parameter values that maximize the likelihood that the observations will be made given the parameters.
x = Z y + e
The basic equation used to estimate the measurement to be fused is estimated using Equation (1), where y R n y , x R n x and Z R ( n x × n y ) is a measurement matrix which provides a mapping between the state of the system and the estimated measurements. The first approach is to find the difference between the measurement to be fused and the actual parameter for which the likelihood is to be estimated. The difference must be minimum in order to obtain maximum accuracy.
m i n y x Z y 2
The difference is calculated using Equation (2).
y ^ = ( Z T Z ) 1 Z T x
From the above calculations, the partial derivative with respect to y is obtained and the value is set to zero from which the least square solution is obtained using Equation (3).
y ^ = ( Z T R 1 Z 1 ) Z T R 1 x i
But if we represent the error, e, in a way that makes it zero mean, E ( e ) = 0 with E ( e e ) = R , where R represents the error covariance, the result produces a weighted least-squares matrix based on the noise covariance matrix and can be calculated using Equation (4).
y ^ n = [ i = 1 n Z i T R i Z i ] 1 . i = 1 n Z i T R i x i
We now take into account the scenario of fusing sensor information. In a batch process, the following can be used to derive the lowest variance, unbiased estimator as listed in Equation (5). Generally speaking, fusion filters work better the more data they have. This reasoning, among other sources of estimation mistakes, falls apart in situations when there are inconsistencies in the measurement models. These circumstances frequently exist in autonomous driving (AD) [3] and can impair the accuracy of sensor data. Inaccurate R values in Equation (5) can result in model convergence and/or filter discrepancies, both of which are known issues. Think about a camera sensor on an AV that has rain covering the lens, for instance. In that instance, it can produce overly optimistic predictions in which the R-value does not accurately represent the level of observed noise. In this research, we demonstrate that fusing all available sensor readings in some circumstances is not ideal and may even lower prediction performance. The results reveal some distinct patterns: (i) cameras forecast fewer false positives but find it hard in extreme weather conditions, as demonstrated by the images taken in the rain and snow where the camera lens is obscured (ii) radars can struggle in scenes with many objects blocking or deflecting measured data, as demonstrated in the urban setting, but remain robust in inclement weather such as rain and snow; and (iii) LiDAR can encounter high noise levels in a densely packed scene and can skip items.
Table 1 provides a summary of the qualitative performance of each modality for different situations.

Theory behind Data and Decision Level Fusion

The theory behind data fusion is discussed in this section. The raw sensory data collected from different sensors possess multimodal characteristics, which undergo preprocessing tasks like data cleaning, data level, and decision level fusion to create an accurate context for effective decision-making in the AVs. At regular intervals of time, the data collected from sensors are denoted as O b j i d .
I d o b j = π ( I f r )
From the samples collected, we have to detect the objects of our interest, which is estimated using Equation (6), where I f r represents the object collected from the sensors and π represents a function that helps to identify the acquired objects. In Equation (6) π refers to a machine learning model (ML) and d refers to the number of objects detected from the sensor. In our study, we use two types of ML models one for classification and the other for regression. The study plans to use fast R-CNN models embedded with the ResNet-18 backbone. Detailed discussion regarding the implementation of the models is covered in the experimental analysis section.
I d o b j = I d o b j ( c l a s s ) , I d o b j ( r e g ) = { 1 . . d }
I d o b j i ( c l a s s ) ϵ { 1 , 2 , . . . . . . k }
Two types of operations are performed over the collected frames. One is classification and the other is prediction. Normally data from other sensors namely thermal and GPS must be integrated with the identified and classified objects from the image frames obtained from advanced LiDAR or Velodyne sensors [4,5]. The operations are illustrated in Equations (7) and (8). From Equation (7), the objects classified from the input sensor I f r are represented using Equation (8), where k represents the number of classes considered in the problem. The numbers in the set represent a predefined object (e.g., 1:car, 2:truck, 3:van, etc.).
I d o b j i ( r e g ) = { u 1 , v 1 , u 2 , v 2 } ϵ R 2
Similarly, the regression parameter in Equation (7) represents the location of the objects in the image frame as demonstrated in Equation (9), where u 1 , v 1 , u 2 , v 2 denotes the dimension of the boundary boxes of the RPN model which detect and locate the objects. We introduce two stages of fusion types namely early and late data fusion. In early fusion, the data are fused before passing them to the mapping function. It is a clustering function where the objects are grouped based on their similarity. The clustering module segments the objects and groups them. In late fusion, the grouped objects are further classified and their corresponding location is identified.
I d o b j * = π ( γ ( I d f r 1 , I d f r 2 . . . . . . . . . I d f r s ) )
The features obtained from different sensors are fused at an earlier stage before moving them for late fusion. The mechanism is represented in Equation (10).
I d o b j 1 , I d o b j 2 , I d o b j 3 = π 1 ( I d f r 1 ) , π 2 ( I d f r 2 ) . . . π s ( I d f r s )
This mechanism creates individual data segments, which are further fused using the mapping function π . The late fusion method is illustrated in Equation (11).
The AVs context varies dynamically due to the quality of the images acquired by the sensors. The sensor’s image quality is affected by bad weather conditions, different lighting conditions, and different road geometry. Hence, the mapping function π must adapt according to the prevailing environmental conditions of the AVs. To satisfy the above-mentioned statement, an appropriate object detection model must serve as the mapping function π . This mapping function serves as an ensembling function to select the optimal object detection model from the subset of the obtained object detection models. Here, π represents the ensemble object detection models and π * represents the best subset among the ensemble object detection models for a given input X.
γ = δ ( I d f r )
The representation of the contextual information from the collected data is illustrated in the Equation (12), where γ represents the contextual identification model.
π * = ρ ( γ )
Again, we need a mechanism ρ for selecting π * from the identified contextual model γ , which is illustrated in Equation (13).
I d o b j = π * ( I d f r )
Now the subset of the ensembled object detection models can be obtained from Equation (14). The goal of δ and ρ is to select the subset of the object identification models from the branches of π * for creating the context γ to maximize the object detection process for the given input I d f r .

3. Related Work

We now review the existing literature to find the actual problems associated with heterogeneous sensory data fusion. More sensors can aid in improving outcomes of conventional sensor fusion techniques with established dynamics, noise, and measurement models [6]. By boosting trust or offering readings over a larger observation area to expand levels of success, fusion across several homogeneous sensors can help in reducing uncertainties.

3.1. Sensor Fusion

By delivering data from a variety of feature sets for the same job, fusing heterogeneous sensors can help lower sensing uncertainty. Even with extremely nonlinear and dynamic systems like AV perception systems, the integration of all sensors does not always result in higher estimations. Many recent research articles prove that meaningful information is extracted from the fused data. To provide resilience against data corruption, a graphical odometry system is given as a selective sensor fusion strategy in [7]. Utilizing data-driven models that take measurement accuracy and vehicle-environment dynamics into account, the authors conduct feature selection. In [8], this approach is expanded to a generalized model for deep pose estimation with selective sensor fusion. These efforts, however, only use late fusion over the results of sensor-oriented Deep Learning (DL) models, which restricts their effectiveness. Authors in [9] have proposed an efficient algorithm to enhance the inefficient power supply of traditional LiDAR sensory systems. The authors established a correlation between the speed of the vehicles and the power consumption of the LiDARS, to alter the power of the sensors dynamically based on the speed. Similarly, ref. [10] proposes an innovative strategy for the sensors fixed in the robots. Their model adjusts the sensory frequency dynamically based on the current perception of the robots. These methods are mostly concerned with increasing sensor effectiveness. Our method is the first to advocate selective fusion for AVs with a dynamic gating component, in contrast to prior similar works. Our method maximizes resilience by deciding on numerous modalities and fusion locations, as well as the actual reason and the period when fusion occurs in the model. Similar to this, a number of studies have examined the use of environmental semantics inside a data fusion framework. Authors in [11] have completed an extensive survey on the role of contextual awareness towards the state variables associated with the environment and traditional fusion approaches. Studies conducted in [12,13] depict that the robustness of their fusion models increases by using the AVs fitted with context-aided sensors. In contrast to prior research, our proposed strategy achieves more reliable results by using DL models to increase the perception awareness of the observed scenes rather than static fusion rules. In [14], authors use sophisticated pattern mining within a CNN for object detection in extremely high-resolution pictures to retrieve the perceived data. Our method extracts the context of a scene using a variety of heterogeneous sensory inputs, in contrast to their approach, which focuses on extracting the perception information from the selected salient scenes in photographs. Yet another interesting empirical analysis conducted by [15], guided us through the key factors to be considered before developing decision models for AVs.The author’s ideas helped to organize the fused data before creating the context and decision rules. Gathering heterogeneous data and further analyzing them for further processing is a mandatory task of this study. As an initiative, an exclusive survey is carried out on various issues related to various factors that influence the creation of contextual awareness in AVs. The survey covers three major areas and various issues related to data fusion, contextual awareness, and decision-making in AVs [16].
This paragraph highlights various factors related to spatial data collected from different sensors. LiDAR and Velodyne sensor data are represented as 3D point cloud data. Hence, advanced spatial computing technologies are required to capture, process, and interact with the 3D data for effective decision-making in AD. Again data fusion plays an important role in the preprocessing stage to improve the accuracy of the 3D data. An exclusive survey completed by [17] highlights the importance of emerging concepts like multi-object detection, tracking tools, big geospatial data analytics, and cloud and edge computing technologies that contribute towards implementing versatile AD perception algorithms for effective decision-making. Ref. [18] have proposed an algorithm to calibrate the parameters related to the data collected from thermal and LiDAR sensors. Since thermal cameras and LiDAR vary in the type of information they gather, adequate data transformation is essential to ensure the reliability of recognition and further processing. The author’s fusion model converts and transforms the acquired data collected from different sources of spatiotemporal coordinate frame. Similarly, ref. [19] have proposed a novel spatial calibration system to translate the data collected from different sensors to spatial coordinates. Further, the authors have also proposed a multi-spectral fusion algorithm to fuse heterogeneous data collected from different sources such as thermal cameras, cameras, advanced sensors, and an object tracking model to locate the objects. The author’s fusion model used LitDAR data for the target location, radar for target velocity, and target type from the camera. In yet another interesting study [20] have proposed a fusion model to fuse LiDAR and camera data. The author’s fusion model can convert three-dimensional space data to a two-dimensional plane using space and time synchronization techniques. Further, the authors have customized the YOLO model and have proposed clustering algorithms for object detection and tracking. They have also used their fused data in regression models to predict roadside events like congestion, accidents, etc. Exclusive surveys made by [1,2] cover the key challenges related to the calibration of spatial and temporal data acquired from different sources before fusing them. Ref. [21] have proposed a 6G envisioned blockchain-based scheme for the cellular vehicle-to-everything (CV2X) systems. Their approach effectively optimizes and uses the existing edge services provided for 5G CV2X through network virtualization. The authors aggregate the data collected from 6G sensors and place them in the data plane. From the data plane through the edge servers data is propagated to the autonomous vehicles. The authors have proposed innovative strategies to preprocess the 3D spatial data and also to translate the other 2D data acquired from different sources to 3D data format.

3.2. Fusion in Object Detection

In conventional object detection techniques, spatial characteristics are extracted from the inputs of the CNNs to locate the objects present in the scene [22]. Since the environment’s physical characteristics have an impact on performance, object tracking in AVs is more difficult. Both [3,23] investigate object identification in AVs, with [3] concentrating on probabilistic techniques while [23] explores 3D detection techniques. In both articles, modeling sensor uncertainty is found to have gaps. Sensor fusion techniques, as described in the preceding subsection, can aid in reducing some measurement errors.
The two basic types of fusion techniques used in object detection are feature-level (or early) fusion and decision-level (or late) fusion. Early fusion techniques are capable of extracting a large number of multi-modal features from the input, but they can be vulnerable to sensor noise and outliers, which reduces their robustness [24,25]. Although late fusion techniques are more resistant to sensor noise, they are limited in their ability to merge intermediate data from different sensors [26]. Combining early and late fusion methods is still unique to the proposed fusion model. The proposed fusion model is a unique strategy that uses a multilayer approach to identify the different objects in the AVs contextual systems. Similarly, the work in [27] uses branching CNN models, which takes more time for training and generating new tasks. Using branches created to estimate attributes on visually comparable classes, the authors of [28] examine effective strategies for single-image classification. The authors use an adaptive form of dropout during training whereby entire branches are eliminated when they are not selected by the gating function. Ref. [28] proposes a single image classification model, where the author uses a branching CNN model approach to extract the features from visually similar classes. The authors use an adaptive form of dropout during training, whereby entire branches are discarded when they are not selected by the gating function. A network called TridentNet [29] also deals with the issue of scale variation in identifying the objects. This architecture has three branches, which share attributes and topology along the branches to speed up training and interpretation. Their approach also enforces identical actions over feature maps further calling for branches with similar structural characteristics; the proposed fusion model dynamically fuses the heterogeneous data collected from multiple sensors for reliable object detection using a multi-branch approach. It also incorporates the perception created into a versatile branching process. Our method is particularly distinctive since it allows branches to be specialized to certain sensors or groupings of sensors to increase robustness in a variety of driving circumstances [30,31].
The proposed research uses an advanced multilayered CNN model to identify multiple objects efficiently. It uses a gated architecture that uses a pipeline mechanism to identify the halting pipelines which branch the multiple objects organized in each pipe layer. This mechanism efficiently minimizes the time in classifying the objects. Few related studies supporting this mechanism are analyzed, to further enhance the suggested mechanism. Authors in [32] have proposed an image categorization model using CNN model approaches. Each branch in their CNN model produces changes only if a subset of objects is selected for training. This lacks the concepts of gating.
From the analyzed literature most of the fusion models use limited heterogeneous sensor modalities as their input for their models, which diminishes the expected accuracy in data fusion and context creation. Further, the models proposed in the literature are either more complex or consume more time in object detection, classification, and  context creation tasks. Further, many authors’ approach is not generic and their proposed models perform well for a specific dataset. The efficiency of the fusion models in terms of training is not discussed in many studies [33,34,35]. Since most of the sensory data are image-based, which uses more resources, the optimal data size for which the authors proposed model’s performance attains the maxima is not revealed in many studies. In order to overcome these pitfalls, this study has proposed a generic fusion framework to fuse individual data formats collected from different sources. Further, a multifaceted framework is proposed to create an accurate context for instant decision-making. The framework performs various tasks like object detection, classification, and data fusion to create an accurate context. A customized Region Proposal Network (RPN) and CNN model are used to detect and classify the objects acquired from multiple sources. New ensembling techniques are proposed to select the optimal object detection and classification model. Advanced gating and filtering concepts are used to organize the proposed models. Advanced CNN model along with 18-layer RSNet architects are used to implement the proposed framework. The CNN model acts as a backbone in which the eighteen layers of the ResNet are branched. Every layer of the ResNet has an RPN model attached. This approach increases the execution time of the framework. Since an image frame contains multiple objects, every layer of ResNet will associate itself with an identified object from the RPN model. Hence, at a single point of execution, eighteen different objects will be classified minimizing the overall object identification and classification time. This study also proposes and illustrates a novel mechanism for context-creation and decision-making strategies in AVs.

4. Proposed Study

Figure 1 illustrates the structure of our proposed architect.
Initially, raw data are collected from multiple sensors. The raw sensory data are pre-processed to improve their accuracy. Further, they are classified based on their appropriate formats. After differentiation, different formats of data-corresponding features related to each format of data are extracted. Finally, using the extracted features, the heterogeneous data is fused for further processing. In our previous study, we proposed an innovative hybrid fusion model to fuse image data only. In this study, we have further extended our strategies to fuse all formats of related sensory data. The previous hybrid image fusion model is further enhanced by adding deep learning model concepts and branching methods. A unique gateway mechanism is proposed to effectively improve the efficiency of the object detection mechanism. Further, the study has proposed a versatile multifaceted framework for decision-level fusion. The framework comprises an object detection model and customized CNN models to effectively detect and classify multiple objects captured from the AVs surrounding environment. The object detection model inherits the concepts of the RPN model. Innovative mapping functions and gateway approaches are integrated with our framework to enhance the data level fusion activities. The implementation of these strategies is covered in the sections that follow. Further, the framework contains appropriate modules for creating an accurate context associated with the AVs surrounding environment. The study also proposes a novel mechanism to frame simple rules from the created context for effective decision-making. The following sections explain how this research fuses heterogeneous data based on the three cases.

4.1. Problem Formulation

Figure 1 illustrates the overall flow of our data level fusion, whereas Figure 2 illustrates the enhanced fusion model, which elaborates on the processing of various tasks depicted in Figure 1. The first stage of Figure 2 represents various sensors available in the market for acquiring data to create the context for the AVs. The new architect uses an advanced CNN model which acts as a stem for every individual sensor. The CNN model representing every sensor is initially trained with its spatial features. The accumulated features collected from different stems are stored in a shared stem. In real-time scenarios, different modalities collected from different sensors are passed to a new layer of the CNN model which acts as the gateway to the shared stem.
ψ = i = 1 N C i S ( a l p h a n u m e r i c , n u m e r i c , i m a g e , v i d e o )
The shared stem identifies the sensor modality obtained from the gateway and maps the data to an appropriate fusion model using the proposed mapping function depicted in Equation (15). For image data, the objects of interest are first identified using the proposed RPN model and further fused for accuracy using the proposed hybrid image fusion model.

4.2. Proposed Fusion Models

4.2.1. Proposed Data Level Text Fusion Model

Figure 3 illustrates the flow of the proposed data-level text fusion model. This model preprocesses the data and helps to fuse alphanumeric and numeric data obtained from different sensors, particularly from thermal and GPS sensors. Algorithm 1 explains the procedure used to fuse the text data after successful preprocessing.
Algorithm 1: Proposed text fusion algorithm
 1 EOL: end of line
 2 A: First record
 3 B: Alternate record
 4 Begin
 5 Input
 6 The data record from the GPS and move to an Excel file
 7 Compare alternate records
 8 Count the number of columns of A and B
 9 If the column count is the same
10 Repeat while EOL
11 Compare the ASCII value of each column of alternate records A and B
12 If the ASCII values are the same then
13 If the data is numeric (or) alphanumeric then
14 Tokenize the data
15 Remove punctuation marks
16 Eliminate commonly occurring words
17 Reduce each word to a stem
18 Index the data
19 Check for similarity
20 If the columns are the same fuse the records by taking union A B
21 Else
22 Considering the records are dissimilar move to the next record
23 Repeat the same procedure for the rest of the columns
24 End repeat
25 End

4.2.2. Proposed Object Detection and Classification Models

Though there are several frequently used object detection models such as Fast CNN, RPN, YOLO, SSD, etc., there are certain drawbacks that affect the performance of the models. Frequently occurring problems are viewpoint variation, deformation, occlusion, cluttered background, slow and complex training conditions, difficulty to process longer sequences, etc. In order to overcome these drawbacks this study has proposed an efficient object detection model, which inherits the functionalities of an RPN model. Algorithm 2 depicts the flow of the proposed object detection model. The study uses the edge detection algorithm proposed in our previous study [36] to check whether there exists an edge in the image frame. Using the edge information the proposed object detection model identifies the objects and draws a box over the circumference of the object. The identified objects along with their coordinate information are stored in a file.
  • function get_image_info(image)
  • return (coordinates, image_info)
c a t e g o r y = ( i m g [ i ] , w )
The study has developed a function using Python, which takes the image frame as its input and returns the identified objects along with their coordinate information as the output. The identified objects and their associated weights (randomly assigned values between 0 and 1) are used to frame the proposed kernel function represented in Equation (16). One layer of the CNN model is mapped with this kernel function. The CNN model identifies the object type and helps in framing the decision rules.
Algorithm 2: Proposed object detection algorithm
 1 eol: end of a line
 2 eoa: end of the array
 3 Begin
 4 Input the image frame
 5 Do
 6 Read pixel information from each line
 7 Check whether the pixel is an edge of the image
 8 If yes mark the coordinate position of the edge
 9 While ≠ eol
10 From the edge_list identify the minimum and maximum coordinate values
11 The information gained forms the boundary of the image ( u 1 v 1 , u 2 v 2 )
12 Create a box over the identified coordinates
13 Any information within the box is the identified object
14 Store the identified object in an image array
15 Do
16 Read the image information from the array
17 Pass to a CNN model
18 Obtain the category of the classified object
19 While ≠ eoa
In this study, we have proposed and implemented a customized RPN model to detect the objects related to context building for the AVs. The objects are first located using the boxes, which are created by the proposed RPN model during the training phase. The boundary of the boxes u 1 , v 1 , u 2 , v 2 along with its object information is stored in a database. During the testing phase, the RPN model again creates boxes to identify the objects; now, the intersection area between the training and the testing boxes is estimated along with their union information. The ratio between the intersection area and the union area gives the Intersection Over Union (IoU) value. If the difference is low, then the likelihood of the detected object is high; otherwise, the likelihood is minimum. Then we select the box with the maximum likelihood using the proposed (IoU) algorithm.
I o U = A r e a o f I n t e r s e c t i o n o f b o x e s A r e a o f U n i o n o f b o x e s
Likewise, the (IoU) is estimated for all the detected objects and accordingly classified using the CNN model. (IoU) is calculated using Equation (17).
Figure 4 depicts the object detection outcomes for various scenarios from RADIATE datasets to demonstrate the implementation of the proposed (IoU) mechanism. In three distinct driving settings, statistics from three sensor modalities, namely camera, radar, and lidar, are displayed from left to right as follows: (a) sunny, (b) rainy, and (c) snowy day. The solid yellow boxes in the scenes represent real-world things. The detections for each sensor input were produced using a deep-learning-based object detection pipeline that used FasterR-CNN with a ResNet-18 backbone. The usual method for fusing detections from all sensors is represented by the fusion method, which is depicted in purple in the final column for each scene. We also display our Proposed fusion approach in the same column, which selectively fuses sensors based on the context extracted from the data. We can investigate fusion across the three different scenes using the final column of Figure 4. The fusion strategy outperforms a single sensing modality for the majority of items. There are certain limitations to this strategy, though. A field-of-view (FOV) mismatch occurs when combining detections from multiple modalities in (a). Additionally, the projections from the other sensors significantly shifted the main camera observations for the central object to the right. The fusion method clearly forecasts more anomalies in (c), which diverge from the truth. The proposed fusion model which uses a subset of sensory data results in a more accurate approximation across all the images acquired from different sensors and cameras. The necessity for a specific sensor fusion strategy that can instantly adapt to various settings is motivated by this conclusion.

4.2.3. Proposed Hybrid Image Fusion Model

The objects identified are fused using hybrid image fusion, proposed in our previous study [36]. Since data acquired from advanced sensors are 3D point cloud data and those from thermal and image cameras are in 2D format, advanced transformations are essential to convert 2D images coordinated to 3D spatial coordinates. The following paragraphs elaborate on the key mechanism behind the proposed image fusion model. Figure 5 illustrates the functioning of the proposed hybrid image fusion model. Our early study extracted four features namely the edge, height, width, and color intensity using the proposed feature extraction model to fuse the data.. Initially, the 2D sentinel model that is acquired is normalized using the weight mean filter method. This process converts the 2D pixel to 3D pixel information. In the next stage, advanced vector projections and matrix transformations are required to convert 2D image coordinate systems to 3D spatial coordinate systems. Finally, to acquire the original 3D image, the research has used the QR() decomposition method to obtain the inverse matrix information of the fused 3D image.
Before processing the fusion process initially, the intensity of each wavelength is subtracted from both the values of 2D sentinel and 3D images. The mean intensity wavelength for both the 2D and the 3D images is calculated using the weighted mean filter method. In terms of mathematics, the weighted mean filter (WMF) is equivalent to global optimization. It can successfully filter images without causing significant edge blur. Within a local window, it is an operator that replaces the current pixel with the weighted median of nearby pixels.
The proposed image fusion model uses three important preprocessing steps before reaching the final fused image (i) projection (ii) transformation and (iii) retaining color intensity. This study just highlights the important equation derived to perform the above-mentioned tasks. The detailed derivation is discussed in our previous study [36].
P v = u . v u . u u
The projection task helps to convert the 2D images to 3D format. In the general projection of a vector v on vector, u is performed using the Equation (18).
P B k ( E ) = B k T . B B k T B k B k .
Applying Equation (18) in our image data leads to the expected 3D transformation as illustrated in Equation (19), Where B k is a column of vector B.
The third and final step is retaining the original color intensity of the fused image. Though the multispectral fused image obtained from the proposed fusion method helps to improve the accuracy of the acquired 2D images, it lacks in producing the actual color intensity. In order to improve the RGB color intensities of the fused 3D image, the pixel values of the fused images are integrated with the Brovey fusion model, which computes the mean of individual Red, Green, and Blue intensity values. The obtained mean value is multiplied by the PAN (Panchromatic matrix values).
F ^ = R n e w = R R + G + B X P A N ( 1 ) X P B k ( E ) G n e w = G R + G + B X P A N ( 2 ) X P B k ( E ) B n e w = B R + G + B X P A N ( 3 ) X P B k ( E )
The results obtained are finally multiplied with the Equation (20) to get the full-fledged 3D fused image with the actual RGB color intensities. Algorithm 3 explains the flow of the proposed hybrid image fusion model.
Algorithm 3: Proposed Hybrid image fusion Algorithm
 1 Input 2D image
 2 B:3D GF-3 image
 3 Assign Variables
 4 A: No of wavelength of 2D image
 5 B: No of wavelength of 3D image
 6 N A : No of pixels in 2D image
 7 N B : No of pixels in 3D image
 8 N F : No of pixels in fused 3D image
 9 ( w i - weights, E - normalized pixel values, S - image matrix after transformation)
10 Projection of 2D to 3D
11 for i = 1.. N A do
12 Compute w i for 2D image matrix
13 Compute projection of A on B using equation P B k ( E )
14 end for
15 Transformation to vector
16 For j = 1.. N B
17 Compute E using equation
18 Compute B using equation
19 Compute S using σ and E with
20 for i = 1.. N A do
21 Compute B using Equation (19)
22 end for
23 for k = 1.. N F
24 Compute RGB intensities for the fused panchromatic
25 image projected on a 3D image using Brovey fusion Equation (20)
26 Output
27 B = Fused Image

4.2.4. Proposed Audio Fusion Model

In current scenarios, audio data play a vital role in many applications which are executed using the decibel signals of audio waves. Similar to other data formats, there are ample ways to generate audio signals. Related to the context of AV, there are some operations in AD that can be controlled by voice messages. Due to technical problems, there are possibilities of distracted audio waves or irrelevant audio information which might force the AVs to take inaccurate decisions. To overcome this challenge, this study has proposed a versatile audio fusion model. Figure 6 illustrates the flow of the functionality of the audio fusion model. Three important audio features, energy, Mel Frequency Cepstral Coefficient (MFCC), and frequency, are extracted using PyWavelets, an advanced Python library.
C w ( a , b ) = x ( t ) Ψ a , b * d t = 1 / a Ψ * ( t b / a ) d t
In the first step, the audio waves are transformed into a set of spectrograms using the proposed Equation (21). Spectrograms enhance the visual representation of the audio waves, where we can exactly identify the strength of the audio waves. Uniform histograms denote steady signal strength whereas variable histograms depict the uncertainty in the audio signals, where Cw(a,b) is a function of parameters (a and b). The (a) parameter is the dilation of the wavelet (scale) and b defines a translation of the wavelet and indicates the time localization., ( Ψ a , b * d t ) is the complex conjugate of the analyzing mother wavelet ( Ψ ( t ) ).
x ( t ) = 1 / K Ψ α = 0 + ( i n t b = + C w ( a , b ) Ψ a , b ( t ) d b / a 2 ) d a = 1 / K Ψ 0 b + D ( α , t ) d a
The coefficient ( 1 / a ) is an energy-normalized factor. In the next step, the spectrograms are converted into digitized audio data using enhanced inverse Fourier transformation, which is depicted in Equation (22), where D ( α , t ) = i n t b = + C w ( a , b ) Ψ a , b ( t ) d b .
C a , b = 1 / 2 π + x ( ω ) Ψ a , b * ( ω ) d ω
Now after fusing the digitized audio data, adequate reverse transformation is performed to convert the digitized data back to the original audio data using enhanced Fourier transformation, illustrated in Equation (23).

4.2.5. Decision Level Fusion

Figure 7 illustrates the mechanism behind the decision-level fusion. In the initial step, data from sensors from different sensors are collected and stored in the appropriate database. Using the proposed fusion models salient features are extracted from different sensory data and stored as individual modalities represented as u 1 , u 2 u M . The study frames two hypotheses based on the threshold values obtained from different modalities. If the hypothesis is satisfied the fusion manager fuses the data; otherwise, the model rejects the input data. In our study, numeric data collected from thermal cameras take first place, alphanumeric data collected from GPS takes second and image data collected from LiDAR sensors and audio data from ultrasonic sensors take third and fourth places, respectively.
f ( u i ) = 1 if hypothesis is satisfied 0 otherwise
Equation (24) illustrates the theory behind the functioning of the fusion manager, where f ( u i ) is the function that represents the functionality of the fusion.
H y p o t h e s i s 1 : I f ( u 1 u 2 . . . . . . . u M ) > t h r e s h o l d ( O R ) I f ( u 1 u 2 . . . . . . . u M ) > t h r e s h o l d
H y p o t h e s i s 2 : I f ( u 1 u 2 . . . . . . . u M ) < t h r e s h o l d ( O R ) I f ( u 1 u 2 . . . . . . . u M ) < t h r e s h o l d
Logical AND and OR operators are used in constructing the two hypotheses listed below in Equations (25) and (26), respectively.
T h r e s h o l d = i = 1 M j = 1 k ( x i , j ) A S C I I v a l u e s o f v a r i o u s d a t a f o r m a t s .
The threshold value is calculated using the Equation (27), where (M) is the number of classes representing different modalities, ( x i , j ) represents every individual vector of a corresponding class. Both hypotheses have two options, for the first hypothesis, either all individual modalities must have their ASCII values greater than or equal to their threshold values. The hypothesis is also valid if any one of the modality’s ASCII values is greater than or equal to its threshold value. The second hypothesis is true if either of the first hypotheses is false. Figure 8 illustrates the flow of the logic behind the decision-level fusion.
Figure 9 illustrates the organizing of data collected from different sensors before the actual fusion happens to create the AV context. In the first segment of Figure 9a knowledge base is constructed from the data collected from thermal cameras, which give the climatic conditions prevailing in the AVs environment. The next segment is the GPS, which collects the location of the AVs. The data collected from the GPS are in textual format. Both the numeric and alphanumeric data collected from the thermal cameras and GPS devices are preprocessed using our proposed data-cleaning model [37]. To fuse the textual data, the study has proposed an innovative fusion model, which is illustrated in Algorithm 1. After fusing, the data are trained and tested using an advanced CNN model. The outcome of the second segment is accurate location information. The third segment discusses the image data collected from the LiDARs. Mandatory features are extracted using our proposed feature extraction models [36]. After extracting the appropriate image features the actual objects are detected using the proposed advanced RPN model. An ensemble of models is performed to select the optimal model for object detection. The outcome of the third segment is the actual object detected. The object detected using the RPN model is again fed into a customized CNN model to classify the object detected. Later information collected from all the sensors is fused into a unique format to create an accurate perception.

4.2.6. Proposed Context Creation Mechanism

Figure 10 illustrates the architect of the proposed context creation mechanism. This study uses two approaches to create context from the fused data. In the first approach, a predefined context is created using the nuScenes dataset. Normally, the context consists of vital information such as city, latitude, longitude, motorway, area, weather condition, and identified object using RPM model. Using the proposed fusion function, different sensory data are fused according to Hypothesis 1. The conceptual information obtained from the fused data is compared with the predefined conceptual information obtained from the nuScenes dataset. The top three records which have the similarity index equivalent to the predefined conceptual data are considered for framing. To further improve the accuracy of the obtained conceptual information, the study proposes a gating system that compares the contextual feature map with the features used to construct the map.
The sequence of operations performed in decision-level data fusion is as follows. The thermal camera gives the climatic information. The GPS sensors give the location of the objects. The RPN model identifies the objects and the CNN model classifies them. Based on the location information and the object classification information the study can easily frame the context information for every individual vehicle in the frame [38].
  • Data from thermal cameras: T 1
  • Data from GPS: G 1
  • Data from PCN (Objects Identified): O b j 1
  • Classified data from CNN: C 1
F i n a l F u s i o n = T 1 G 1 O b j 1 C 1
Figure 11 illustrates the mechanism behind the decision-level fusion and Equation (28) depicts the formulation of decision level fusion.

5. Experimental Analysis

In this section, we discuss the detailed experimental analysis performed on the proposed fusion models. Table 2 depicts the tools and the experimental setup details related to the study.

5.1. Dataset Details

The Velodyne HDL-32e LiDAR, the ZED stereo camera, and the Navtech CTS350-X radar all contributed labeled data to the RADIATE collection. The proposed study used this dataset to train and test our object detection models using supervised learning. The RADIATE dataset includes data for a variety of driving conditions, including driving in the city, rain, snow, night, and highway. In rare circumstances, fog, rain, or snow visually obscures many sensors. The following annotated object classes are included in the dataset: “vehicle, van, truck, bus, motorbike, bicycle, pedestrian, group of pedestrians”. This dataset offers a difficult standard for assessing the resilience of object identification models in a variety of driving conditions. Next, the nuScenes is a public dataset created by a team working for Motional concern. The company releases a subset of its data to the research community, to perform advanced research related to AD to ensure safe and reliable driving. The team collected 1000 driving scenes from 415 cities, including Boston and Singapore, which have dense and challenging driving scenarios [39]. Scenes of a 20-s duration were painstakingly chosen to display a variety of amusing driving techniques, traffic conditions, and unanticipated actions. The nuScenes’ vast complexity will spur the creation of techniques that allow safe driving in cities with numerous things in each scene. The researchers can explore the applicability of computer vision algorithms across various locales, weather conditions, vehicle kinds, vegetation, road markers, and left versus right traffic by collecting data in various contexts. Finally, the KITTI (Karlsruhe Institute of Technology and Toyota Technological Institute) contains suitable vision tasks built using an AD environment [40]. This dataset is widely used to evaluate the performance of the models developed for mobile robotics and AD platforms. It consists of detailed vehicular information recorded using advanced sensors, high-resolution RGB, greyscale stereo cameras, and 3D scanners. The drawback associated with the dataset is it does not contain the segmented information of the images, rather the researchers have to develop customized segmentation algorithms to effectively use this dataset for their analysis. To overcome this issue, we have integrated advanced image segmentation procedures in our proposed object detection models and fusion models.

5.2. Model Implementation

To implement the proposed fusion architecture, we are using Fast-CNN embedded with ResNet-18 architecture and RPN models. ResNet-18 serves as the backbone of the RPN model. This study uses the R-CNN model as a stem and RPN model as its branches. An RPN model is implemented in every layer of the ResNet to identify the objects from every individual scene collected from the LiDARs. The R-CNN model which acts as a stem classifies the objects identified by the RPN model. Finally using Equation (28), different modalities of data collected from different sensors and cameras are fused to obtain the actual context related to different autonomous vehicles.

5.3. Overall Analysis

The upcoming sections provide the results obtained from the detailed analysis of the proposed models. Table 3 illustrates the performance of different proposed fusion strategies for different levels of configuration. A sample of 1000 images from the RADIATE dataset is used for the evaluation. From the results obtained, it is evident that there is a proportionate increase in energy consumption, latency time, and memory occupied for different configurations. This proves that the proposed approach is stable and robust.
m A P = 1 / N i 1 N A P i
In order to determine the efficiency of object detection by the proposed object detection models, the study uses the mean average precision (mAP) score. The mAP is the ratio between the average precision for each class over the total number of classes as depicted in Equation (29). Table 4 and Figure 12 illustrate the mean average precision scores of different stages of proposed fusion approaches. Again, the proportional increase in the scores highlights that the proposed fusion approach is well-organized, stable, and reliable.

5.3.1. Comparison with Other Related Studies

The proposed fusion model was compared with [41]. In the proposed and referred approaches, a thousand sample scenes from the RADIATE dataset were used to evaluate their models. Two types of comparisons were performed to evaluate the proposed and referred approaches. In the first comparison, the models were compared using the key metrics of energy, latency, and memory. Table 5 portrays the observed results. In the second comparison, in order to estimate the efficiency and accuracy of object detection, the mean average precision (mAP) scores were estimated using the proposed and referred object detection strategies. Table 6 illustrates the results obtained. In both comparisons, the proposed approach performed better than the other approach.
We also compared the accuracy of the proposed object detection model with other popular object detection models. Sensitivity and average precision rate metrics were used to estimate the accuracy of the object detection models. High-level applications were developed using Python to accomplish these tasks. Nesterian Accelerated Gradient (NAG) optimizer is used to calibrate the behavior of different models. We used the KITTI dataset and from Figure 13, it is evident that the proposed object detection model’s sensory values decrease when the number of false positives per frame increases during the testing phase. In another comparison, the mAP of the proposed object detection model decreases appreciably over increased (IoU) values compared to the other object detection models, as illustrated in Figure 14. These inferences prove that the proposed object detection model is more accurate than the other object detection model.

5.3.2. Performance of Hybrid Image Fusion Model

This section exclusively discusses the performance of the proposed hybrid image fusion model. Various metrics were used to evaluate the image fusion model. Since, in the field of AV, a major portion of the data acquired and processed is in image format, various evaluations are performed to examine the performance of the model. Images from nuScenes and RADIATE datasets were used to evaluate the model. Table 7 depicts various metrics used to estimate the performance of the hybrid image fusion model. Apart from our proposed Hybrid image fusion model, extensive applications were developed using Python to implement popular image fusion models like Intensity Hue Saturation (HIS), Subtractive, and Gram–Schmidt(GS) transformation-based fusion models. Table 8 depicts the performance of the specified image fusion models along with the proposed Hybrid image fusion model for different metrics portrayed in Table 7. Further, Figure 15 illustrates the outcome of the performance of different image fusion models for multiple images collected from nuScenes and RADIATE datasets. From the inferences, it can be seen that the proposed Hybrid image fusion model outperforms other popular image fusion models.

5.3.3. Sample Rule Framing Mechanism

Figure 16 illustrates the proposed rule framing mechanism. Different data formats representing temperature, location, identified objects, and their classified types are organized in randomly generated Mongo database tables. From Figure 16 the circled three cars namely car1, car2, and car3 violate the common traffic rules. Car1 violates the lane crossing event while car3 is not moving, which causes congestion to car2. From the information provided in the table, the rules for lane crossing and congestion are framed as follows.
  • Rule 1: If the location of object1 > the estimated threshold value of the lane
For lane crossing, the actual boundaries of the lane are estimated from the actual positions of the moving objects using the proposed RPN model. The obtained boundary information of the lanes is kept as the threshold values. Any vehicle which exceeds the threshold value violates lane crossing.
  • Rule 2: If the location of object1 = location of object2
Similarly, if the location of two objects is almost identical it means the objects are static. From Figure 16, the locations of car2 and car3 are almost similar, indicating car3, which is not moving, causes congestion to car2.

6. Conclusions

This study proposed a multifaceted fusion framework. In this study, we have proposed a versatile fusion framework to effectively fuse heterogeneous data in two stages, namely early and late fusion to further improve the accuracy of the data for effective decision-making in the AVs. This study has developed conversant models and kernel functions for object detection, classification, and fusion. This study has proposed innovative models for extracting features and fusing them for different data formats such as text, numeric, image, and audio. Furthermore, this study proposed a novel mechanism and versatile models for performing decision-level fusion in order to frame the accurate context of the AVs perceived environment. High-level ensembling and gating techniques were proposed to select the optimal object detection and classification model to perform the accomplished tasks. Additionally, a rule-framing mechanism is suggested to frame effective decision rules from the created context. Three widely used datasets, namely RADIATE, nuScenes, and KITTI, were used to evaluate the proposed models. The proposed approach was compared with other works and found to outperform them. The proposed method works well with the existing environmental setup. The performance of the framework must be further evaluated when additional sensors producing different data formats are added to the existing experimental setup. We intend to convert this approach to a more generalized framework in the future. More work is needed to fine-tune the models and optimize the key parameters used in the proposed models. In addition, we intend to set up a real-time environment to evaluate the performance of the proposed models. One such example is depicted in Figure 17. This setup will be deployed as a real-time roadside unit in a densely populated area to collect real-time data for assessing the performance of our proposed models.

Author Contributions

H.A.I.: Conceptualization, methodology, experimental analysis, original draft preparation, writing, review, editing, and proofreading. H.E.-S.: Conceptualization, supervision, fund acquisition, and proofreading. P.K.: Conceptualization, supervision, review, editing and proofreading. All authors have read and agreed to the published version of the manuscript.

Funding

This paper was supported by the Emirates Center for Mobility Research of the United Arab Emirates University (grant 31R271) and ASPIRE Award for Research Excellence, Project Reference AARE20-368.

Data Availability Statement

This research exclusively uses existing datasets like nuScenes, RADIATE, and KITTI. No new dataset has been created.

Conflicts of Interest

The authors declare no conflict of interest. The funders had no role in the design of the study; in the collection, analyses, or interpretation of data; in the writing of the manuscript; or in the decision to publish the results.

References

  1. Rosique, F.; Navarro, P.J.; Fernández, C.; Padilla, A. A systematic review of perception system and simulators for autonomous vehicles research. Sensors 2019, 19, 648. [Google Scholar] [CrossRef] [PubMed] [Green Version]
  2. Pendleton, S.D.; Andersen, H.; Du, X.; Shen, X.; Meghjani, M.; Eng, Y.H.; Rus, D.; Ang Jr, M.H. Perception, planning, control, and coordination for autonomous vehicles. Machines 2017, 5, 6. [Google Scholar] [CrossRef] [Green Version]
  3. Feng, D.; Harakeh, A.; Waslander, S.L.; Dietmayer, K. A review and comparative study on probabilistic object detection in autonomous driving. IEEE Trans. Intell. Transp. Syst. 2021, 23, 9961–9980. [Google Scholar] [CrossRef]
  4. Nakrani, N.M.; Joshi, M.M. A human-like decision intelligence for obstacle avoidance in autonomous vehicle parking. Appl. Intell. 2022, 52, 3728–3747. [Google Scholar] [CrossRef]
  5. Gupta, S.; Snigdh, I. Multi-sensor fusion in autonomous heavy vehicles. In Autonomous and Connected Heavy Vehicle Technology; Elsevier: Amsterdam, The Netherlands, 2022; pp. 375–389. [Google Scholar]
  6. Bar-Shalom, Y.; Li, X.R.; Kirubarajan, T. Estimation with Applications to Tracking and Navigation: Theory Algorithms and Software; John Wiley & Sons: Hoboken, NJ, USA, 2004. [Google Scholar]
  7. Chen, C.; Rosa, S.; Miao, Y.; Lu, C.X.; Wu, W.; Markham, A.; Trigoni, N. Selective sensor fusion for neural visual-inertial odometry. In Proceedings of the IEEE/CVF Conference on Computer Vision and Pattern Recognition, Long Beach, CA, USA, 15–20 June 2019; pp. 10542–10551. [Google Scholar]
  8. Chen, C.; Rosa, S.; Xiaoxuan Lu, C.; Trigoni, N.; Markham, A. Selectfusion: A generic framework to selectively learn multisensory fusion. arXiv 2019, arXiv:1912.13077. [Google Scholar]
  9. Lee, S.; Lee, D.; Choi, P.; Park, D. Accuracy–power controllable LiDAR sensor system with 3D object recognition for autonomous vehicle. Sensors 2020, 20, 5706. [Google Scholar] [CrossRef]
  10. Gokhale, V.; Barrera, G.M.; Prasad, R.V. FEEL: Fast, energy-efficient localization for autonomous indoor vehicles. In Proceedings of the ICC 2021-IEEE International Conference on Communications, Virtual Event, 14–23 June 2021; pp. 1–6. [Google Scholar]
  11. Snidaro, L.; García, J.; Llinas, J. Context-based information fusion: A survey and discussion. Inf. Fusion 2015, 25, 16–31. [Google Scholar] [CrossRef] [Green Version]
  12. Saeedi, S.; Moussa, A.; El-Sheimy, N. Context-aware personal navigation using embedded sensor fusion in smartphones. Sensors 2014, 14, 5742–5767. [Google Scholar] [CrossRef]
  13. Board, N. Collision between a sport utility vehicle operating with partial driving automation and a crash attenuator mountain view, california. Accessed Oct. 2020, 30. [Google Scholar]
  14. Gong, Y.; Xiao, Z.; Tan, X.; Sui, H.; Xu, C.; Duan, H.; Li, D. Context-aware convolutional neural network for object detection in VHR remote sensing imagery. IEEE Trans. Geosci. Remote Sens. 2019, 58, 34–44. [Google Scholar] [CrossRef]
  15. Taylor, E. Autonomous vehicle decision-making algorithms and data-driven mobilities in networked transport systems. Contemp. Readings Law Soc. Justice 2021, 13, 9–19. [Google Scholar]
  16. Alexander, H.; El-Sayed, H.; Khan, M.A.; Kulkarni, P. Analyzing Factors Influencing Situation Awareness in Autonomous Vehicles—A Survey. Sensors, 2023; Accepted for publication. [Google Scholar]
  17. Kovacova, M.; Oláh, J.; Popp, J.; Nica, E. The Algorithmic Governance of Autonomous Driving Behaviors: Multi-Sensor Data Fusion, Spatial Computing Technologies, and Movement Tracking Tools. Contemp. Readings Law Soc. Justice 2022, 14, 27–45. [Google Scholar]
  18. Choi, J.D.; Kim, M.Y. A sensor fusion system with thermal infrared camera and LiDAR for autonomous vehicles and deep learning based object detection. ICT Express 2022. [Google Scholar] [CrossRef]
  19. Yi, C.; Zhang, K.; Peng, N. A multi-sensor fusion and object tracking algorithm for self-driving vehicles. Proc. Inst. Mech. Eng. Part D J. Automob. Eng. 2019, 233, 2293–2300. [Google Scholar] [CrossRef]
  20. Mei, P.; Karimi, H.R.; Ma, F.; Yang, S.; Huang, C. A Multi-sensor Information Fusion Method for Autonomous Vehicle Perception System. In Proceedings of the Science and Technologies for Smart Cities: 7th EAI International Conference, SmartCity360°, Virtual Event, 2–4 December 2021; pp. 633–646. [Google Scholar]
  21. Bhattacharya, P.; Shukla, A.; Tanwar, S.; Kumar, N.; Sharma, R. 6Blocks: 6G-enabled trust management scheme for decentralized autonomous vehicles. Comput. Commun. 2022, 191, 53–68. [Google Scholar] [CrossRef]
  22. Ren, S.; He, K.; Girshick, R.; Sun, J. Faster R-CNN: Towards real-time object detection with region proposal networks. In Proceedings of the Annual Conference on Neural Information Processing Systems 2015, Montreal, QC, Canada, 7–12 December 2015; Volume 28. [Google Scholar]
  23. Arnold, E.; Al-Jarrah, O.Y.; Dianati, M.; Fallah, S.; Oxtoby, D.; Mouzakitis, A. A survey on 3d object detection methods for autonomous driving applications. IEEE Trans. Intell. Transp. Syst. 2019, 20, 3782–3795. [Google Scholar] [CrossRef] [Green Version]
  24. Nobis, F.; Geisslinger, M.; Weber, M.; Betz, J.; Lienkamp, M. A deep learning-based radar and camera sensor fusion architecture for object detection. In Proceedings of the 2019 Sensor Data Fusion: Trends, Solutions, Applications (SDF), Solutions, Bonn, Germany, 15–17 October 2019; pp. 1–7. [Google Scholar]
  25. Shahian Jahromi, B.; Tulabandhula, T.; Cetin, S. Real-time hybrid multi-sensor fusion framework for perception in autonomous vehicles. Sensors 2019, 19, 4357. [Google Scholar] [CrossRef] [Green Version]
  26. Xu, D.; Anguelov, D.; Jain, A. Pointfusion: Deep sensor fusion for 3d bounding box estimation. In Proceedings of the IEEE Conference on Computer Vision and Pattern Recognition, Salt Lake City, UT, USA, 18–22 June 2018; pp. 244–253. [Google Scholar]
  27. Aljundi, R.; Chakravarty, P.; Tuytelaars, T. Expert gate: Lifelong learning with a network of experts. In Proceedings of the IEEE Conference on Computer Vision and Pattern Recognition, Honolulu, HI, USA, 21–26 July 2017; pp. 3366–3375. [Google Scholar]
  28. Mullapudi, R.T.; Mark, W.R.; Shazeer, N.; Fatahalian, K. Hydranets: Specialized dynamic architectures for efficient inference. In Proceedings of the IEEE Conference on Computer Vision and Pattern Recognition, Salt Lake City, UT, USA, 18–22 June 2018; pp. 8080–8089. [Google Scholar]
  29. Li, Y.; Chen, Y.; Wang, N.; Zhang, Z. Scale-aware trident networks for object detection. In Proceedings of the IEEE/CVF International Conference on Computer Vision, Seoul, Republic of Korea, 27 October–2 November 2019; pp. 6054–6063. [Google Scholar]
  30. Wei, Z.; Zhang, F.; Chang, S.; Liu, Y.; Wu, H.; Feng, Z. MmWave Radar and Vision Fusion for Object Detection in Autonomous Driving: A Review. Sensors 2022, 22, 2542. [Google Scholar] [CrossRef]
  31. Hallyburton, R.S.; Liu, Y.; Cao, Y.; Mao, Z.M.; Pajic, M. Security analysis of camera-lidar fusion against black-box attacks on autonomous vehicles. In Proceedings of the 31st USENIX Security Symposium (USENIX SECURITY), Boston, MA, USA, 10–12 August 2022. [Google Scholar]
  32. Ahmed, K.; Baig, M.H.; Torresani, L. Network of experts for large-scale image categorization. In Proceedings of the European Conference on Computer Vision, Amsterdam, The Netherlands, 11–14 October 2016; pp. 516–532. [Google Scholar]
  33. Ye, E.; Spiegel, P.; Althoff, M. Cooperative raw sensor data fusion for ground truth generation in autonomous driving. In Proceedings of the 2020 IEEE 23rd International Conference on Intelligent Transportation Systems (ITSC), Rhodes, Greece, 20–23 September 2020; pp. 1–7. [Google Scholar]
  34. Ren, M.; He, P.; Zhou, J. Improved Shape-Based Distance Method for Correlation Analysis of Multi-Radar Data Fusion in Self-Driving Vehicle. IEEE Sensors J. 2021, 21, 24771–24781. [Google Scholar] [CrossRef]
  35. Liu, W.; Liu, Y.; Bucknall, R. Filtering based multi-sensor data fusion algorithm for a reliable unmanned surface vehicle navigation. J. Mar. Eng. Technol. 2022, 1–17. [Google Scholar] [CrossRef]
  36. Alexander, H.; El-Sayed, H.; Khan, M.A.; Kulkarni, P. A versatile hybrid image fusion model to fuse multispectral image data. Big Data, 2023; Currently under review. [Google Scholar]
  37. El-Sayed, H.; Alexander, H.; Khan, M.A.; Kulkarni, P.; Bouktif, S. DyReT: A Dynamic Rule Framing Engine Equipped With Trust Management for Vehicular Networks. IEEE Access 2020, 8, 72757–72767. [Google Scholar] [CrossRef]
  38. Butt, F.A.; Chattha, J.N.; Ahmad, J.; Zia, M.U.; Rizwan, M.; Naqvi, I.H. On the Integration of Enabling Wireless Technologies and Sensor Fusion for Next-Generation Connected and Autonomous Vehicles. IEEE Access 2022, 10, 14643–14668. [Google Scholar] [CrossRef]
  39. nuScenes. 2019. Available online: https://www.nuscenes.org/nuscenes (accessed on 19 July 2019).
  40. KITTI. 2019. Available online: https://paperswithcode.com/dataset/kitti (accessed on 19 July 2019).
  41. Malawade, A.V.; Mortlock, T.; Al Faruque, M.A. HydraFusion: Context-aware selective sensor fusion for robust and efficient autonomous vehicle perception. In Proceedings of the 2022 ACM/IEEE 13th International Conference on Cyber-Physical Systems (ICCPS), Virtual, 4–6 May 2022; pp. 68–79. [Google Scholar]
Figure 1. Proposed architecture.
Remotesensing 15 02256 g001
Figure 2. Enhanced data level fusion architecture.
Remotesensing 15 02256 g002
Figure 3. Proposed text fusion model.
Remotesensing 15 02256 g003
Figure 4. Analysis of three contexts’ worth of object detection using several sensors in a qualitative manner.
Remotesensing 15 02256 g004
Figure 5. Proposed Hybrid image fusion model.
Remotesensing 15 02256 g005
Figure 6. Proposed audio fusion.
Remotesensing 15 02256 g006
Figure 7. Mechanism of decision level fusion.
Remotesensing 15 02256 g007
Figure 8. Flow of decision level fusion.
Remotesensing 15 02256 g008
Figure 9. Functionality of data fusion framework.
Remotesensing 15 02256 g009
Figure 10. Final fusion architecture.
Remotesensing 15 02256 g010
Figure 11. Mechanism of decision level data fusion.
Remotesensing 15 02256 g011
Figure 12. Average mAP comparison of different proposed fusion models.
Remotesensing 15 02256 g012
Figure 13. Sensitivity vs. false positive per frame for different object detection models.
Remotesensing 15 02256 g013
Figure 14. Average precision vs. IoU.
Remotesensing 15 02256 g014
Figure 15. Performance comparison of different image fusion models. PCA-Principle Component Analysis, WMFGS-Weighed Mean Filter based Gram–Schmidt transform, GS-Gram–Schmidt transform.
Remotesensing 15 02256 g015
Figure 16. Sample rule framing mechanism. (1. Location of Car1, 2. Location of Car2, 3. Location of Car3).
Remotesensing 15 02256 g016
Figure 17. Real-time data collection.
Remotesensing 15 02256 g017
Table 1. Summary of the quality performance of each modality.
SceneCameraRadarLiDARFusion
Urban×××
Rainy×
Foggy×
Snowy××
Night××
Table 2. Experimental set up.
Hardware
ProcessorProcessor: 2*Intel Xeon Gold 5218 16 core
Memory StorageMemory: 128 GB DDR4-2999 
Storage: 2TB SSD
Graphics CardNvidia quadro 8 GB
Software
Operating SystemMicrosoft Windows 10 Pro 64 for Workstations
ToolsPython (3.10.8), MatLab (2022a (R2022a))
Python Packages·         NumPy
·         SciPy
·         Scikit-learn
·         Theano
·         TensorFlow
·         Keras
·         PyTorch.
·         Pandas. In-demand Machine Learning Skills
DatasetRADIATE, nuScenes, KITTI
Table 3. Overall performance of the proposed models.
Fusion MethodConfigurationEnergy
(J)
Latency
(ms)
Memory
(MB)
NoneRadar or LiDAR
Single Cam
0.935
0.927
21.65
21.67
754
743
Early FusionL/R Cam
L/R Cam + LiDAR
L/R Cam + LiDAR + RADAR
1.194
1.356
1.627
27.23
30.12
34.25
756
743
728
Late FusionL/R Cam
L/R Cam + LiDAR
L/R Cam + LiDAR + RADAR
1.856
2.726
3.649
42.66
61.78
82.25
924
1023
1139
Proposed Fusion3-Branch (ResNet + RCNN)
5-Branch (ResNet + RCNN)
7-Branch (ResNet + RCNN)
3.345
5.006
6.476
72.15
100.26
120.56
1261
1362
1465
Table 4. mAP scores for different fusion models.
Fusion MethodConfigurationmAP
(%)
NoneSingle Camera
Radar
LiDAR
67.21
67.50
67.58
Early FusionL/R Cam
Radar + LiDAR
Camera + LiDAR
69.23
69.45
69.55
Late FusionL/R Cameras
Radar + LiDAR
L/R Cameras + LiDAR
Radar + LiDAR + L/R Cameras
71.25
71.43
71.23
71.00
Proposed Fusion3-Branch (ResNet + RCNN)
5-Branch (ResNet + RCNN)
7-Branch (ResNet + RCNN)
74.32
79.34
82.31
Table 5. First comparison.
Fusion MethodConfiguration(Proposed)(Other Work [31])
Energy
(J)
Latency
(ms)
Memory
(MB)
Energy
(J)
Latency
(ms)
Memory
(MB)
NoneRadar or LiDAR
Single Cam
0.935
0.927
21.65
21.67
754
743
0.954
0.945
21.85
21.57
769
767
Early FusionL/R Cam
L/R Cam + LiDAR
L/R Cam + LiDAR + RADAR
1.194
1.356
1.627
27.23
30.12
34.25
756
643
728
1.192
1.379
1.615
27.36
31.36
36.86
768
694
750
Late FusionL/R Cam
L/R Cam + LiDAR
L/R Cam + LiDAR + RADAR
1.856
2.726
3.649
42.66
61.78
82.25
924
1023
1139
1.959
2.878
3.769
43.99
64.09
84.32
923
1087
1239
Proposed Fusion3-Branch (ResNet + RCNN)3.24572.1510013.31773.841080
Table 6. Second comparison.
Fusion MethodConfigurationProposed Fusion(Other Work [31])
mAP
(%)
mAP
(%)
NoneSingle Camera
Radar
LiDAR
67.41
67.21
67.58
65.33
69.42
61.86
Early FusionL/R Cam
Radar + LiDAR
Camera + LiDAR
69.25
69.45
69.55
65.33
71.63
65.99
Late FusionL/R Cameras
Radar + LiDAR
L/R Cameras + LiDAR
Radar + LiDAR + L/R Cameras
70.25
71.43
71.23
71.00
65.71
65.33
66.20
71.16
Proposed Fusion3-Branch (ResNet + RCNN)
5-Branch (ResNet + RCNN)
7-Branch (ResNet + RCNN)
74.32
79.32
82.31
74.54
78.51
81.31
Table 7. Metrics used to evaluate the performance of proposed Hybrid Image Fusion model.
Metric NamePurpose
Accuracy (Acc)To compare accuracy
Efficiency (Eff)To evaluate the performance of the models
Standard Deviation (SD)To estimate the contrast
Average Gradient (AG)To express small detail contrast and
texture changes, as well as the
sharpness of the image
Spatial Frequency (SF)To measure the overall activity level
of the image
Peak Signal to Noise Ratio (PSNR)To compute the visual error between the
fused image and the reference Image
Correlation Coefficient (CC)To find the similarity between the reference
image and the fused image
Table 8. Performance of image fusion models for different metrics.
ImagesModelSDAGSFPSNRCC
1GS305.33859.444460.037589.67090.6908
HIS363.52079.5403133.869195.52000.7078
Subtractive375.78249.4150133.534494.53250.7107
Proposed380.29810.2148135.638296.28670.9472
2GS289.34989.610578.532990.07810.6040
HIS325.75559.7290177.782993.00750.6077
Subtractive339.946110.4368178.646293.03600.6360
Proposed365.475211.4976180.564394.23350.8235
3GS625.302510.5363131.9687114.05610.7434
HIS646.817110.8526132.641695.56310.7313
Subtractive657.60249.9434120.616195.62240.7344
Proposed370.253911.3145123.621393.250.6543
Disclaimer/Publisher’s Note: The statements, opinions and data contained in all publications are solely those of the individual author(s) and contributor(s) and not of MDPI and/or the editor(s). MDPI and/or the editor(s) disclaim responsibility for any injury to people or property resulting from any ideas, methods, instructions or products referred to in the content.

