Article

Synergistic Integration of Time Series Optical and SAR Satellite Data for Mariculture Extraction

1
State Key Laboratory of Resources and Environmental Information System, Institute of Geographic Sciences and Natural Resources Research, Chinese Academy of Sciences, Beijing 100101, China
2
University of Chinese Academy of Sciences, Beijing 100049, China
3
CAS Engineering Laboratory for Yellow River Delta Modern Agriculture, Institute of Geographic Sciences and Natural Resources Research, Chinese Academy of Sciences, Beijing 100101, China
4
Shandong Dongying Institute of Geographic Sciences, Institute of Geographic Sciences and Natural Resources Research, Chinese Academy of Sciences, Dongying 257000, China
*
Author to whom correspondence should be addressed.
These authors contributed equally to this work.
Remote Sens. 2023, 15(9), 2243; https://doi.org/10.3390/rs15092243
Submission received: 11 March 2023 / Revised: 12 April 2023 / Accepted: 19 April 2023 / Published: 23 April 2023
(This article belongs to the Special Issue Advances of Remote Sensing and GIS Technology in Surface Water Bodies)

Abstract

:
Mariculture is an important part of aquaculture, and it is important to address global food security and nutrition issues. However, seawater environmental conditions are complex and variable, which causes large uncertainties in the remote sensing spectral features. At the same time, mariculture types are distinct because of the different types of aquaculture (cage aquaculture and raft aquaculture). These factors bring great challenges for mariculture extraction and mapping using remote sensing. In order to solve these problems, an optical remote sensing aquaculture index named the marine aquaculture index (MAI) is proposed. Based on this spectral index, using time series Sentinel-1 and Sentinel-2 satellite data, a random forest classification scheme is proposed for mapping mariculture by combining spectral, textural, geometric, and synthetic aperture radar (SAR) backscattering. The results revealed that (1) MAI can emphasize the difference between mariculture and seawater; (2) the overall accuracy of mariculture in the Bohai Rim is 94.10%, and the kappa coefficient is 0.91; and (3) the area of cage aquaculture and raft aquaculture in the Bohai Rim is 16.89 km2 and 1206.71 km2, respectively. This study details an effective method for carrying out mariculture monitoring and ensuring the sustainable development of aquaculture.

1. Introduction

Aquaculture is an important traditional industry in coastal areas and the fastest growing food production sector in the world [1]. According to the Food and Agriculture Organization of the United Nations (FAO), total fish production reached 214 million tons in 2020, of which 58% came from aquaculture [2]. Aquaculture is an important supply source that can help to ensure human food security and it plays an important role in reducing dependence on wild-caught fish [3]. China has abundant tidal flat resources and is one of the largest aquaculture-producing countries in the world [4]. Aquaculture includes mariculture and land-based aquaculture. Mariculture has reached 19,956 km2, accounting for 28.36% of the aquaculture area. Although the area of mariculture is less than land-based aquaculture, it is growing at a faster rate. From 2011 to 2020, the growth rate of mariculture production was 37.7%, which is higher than the 25.5% growth rate of land-based aquaculture [5,6]. While mariculture provides a rich source of food and nutrition, its rapid expansion has inevitably brought about some environmental problems. Once the scale of aquaculture exceeds the environmental carrying capacity, it will lead to a series of problems such as mangrove shrinkage, and the eutrophication of water [7], which in turn cause a decrease in biodiversity and the intensification of coastal water nitrogen and phosphorus pollution [8]. Therefore, we need to monitor the scale of mariculture and reasonably arrange the spatial distribution and expansion rate of mariculture. It is important to protect the marine ecological environment and guarantee the sustainable development of aquaculture.
The monitoring of mariculture is usually carried out by using traditional methods such as field surveys or statistical surveys. These traditional survey methods are time intensive, require a high level of manpower, and incur high economic costs [9]. In addition, the accuracy of survey results is also affected by the professional level of the investigators. By contrast, remote sensing is timely, provides a fast update speed, and facilitates repeated observation and large-scale spatial coverage; thus, it is an important tool for aquaculture monitoring today [10]. We can perform high-resolution mapping of mariculture through remote sensing imagery, which is beneficial for obtaining high accuracies in each region [11].
The application of remote sensing in mariculture is developing rapidly and has received increasing attention in recent years [12,13,14]. In general, mariculture mainly includes cage aquaculture, raft aquaculture, and bottom seeding aquaculture. The depth of bottom seeding aquaculture can reach 20 m, so it can be difficult to perform monitoring using remote sensing technology [15]. Therefore, remote sensing monitoring for mariculture is mainly carried out for cage aquaculture and raft aquaculture. Among all remote sensing data sources, optical data are the most widely used as its spatial-temporal resolution constantly improves. Data sources ranged from a medium resolution of Landsat [12,16] to a high resolution of GF-1 [17,18], GF-2 [19,20], RapidEye [21], or Worldview-2 [22]. Due to the wide variety of mariculture types, the mariculture growth and harvest time are also different, so single optical images may not extract all mariculture and will lead to omissions [23,24,25]. Therefore, the full use of time series optical data provides the possibility to obtain mariculture information [26]. However, the frequent cloudy or rainy conditions in coastal areas reduce the availability of optical data [27,28]. In addition, optical data may not be used to extract all kinds of raft aquaculture. According to the culture breed, raft aquaculture is divided into algae raft aquaculture and shellfish raft aquaculture. For the latter type, which grows in deep water, the aquaculture body is located below the water surface, except for in aquaculture facilities (floats) above sea surface. It results in a weak detection signal in the optical data, making it indistinguishable from the seawater background, and causing identification difficulties. In contrast, synthetic aperture radar (SAR) remote sensing can penetrate the atmosphere, is not affected by clouds/rain, and can provide stable time series radar images [29,30,31]. It offers the possibility of extracting shellfish raft aquaculture data when optical data are difficult to obtain or to identify.
The development of mariculture extraction methods has progressed from visual interpretation [32] to pixel-based classification [33,34] and to object-based classification [26,35,36], and from unsupervised classification [37,38,39] to machine learning. Many object-oriented machine learning methods are widely used for mariculture extraction, such as maximum likelihood [40], support vector machine (SVM) [36], and random forest [41]. Among them, random forest [42] is a non-parametric classification regression method that uses a decision tree as the basic classifier. It can process high-dimensional massive data with high accuracy, good robustness, and a fast training speed [43]. Therefore, object-oriented random forest classification works well in mariculture extraction.
However, the extraction difficulty for raft culture and cage aquaculture is different. Cage aquaculture appears as regular bright patches in optical images [12], for which the spectral or backscattering intensity are obviously different from that of seawater [37], which is easier to identify. The method for cage aquaculture detection is relatively mature [12,37,39]. Compared with cage aquaculture, the extraction of raft aquaculture is more difficult, and it is mainly influenced by two categories: (1) Confusion between seawater and raft aquaculture in culture areas. Raft aquaculture grows within culture area seawater. Its spectral reflectivity is the mixing of raft aquaculture and culture area seawater. At the same time, the changes of plankton, salinity, and pigment content caused by raft aquaculture also affect the characteristics of the culture area seawater. These lead to the similar spectral characteristics of culture area seawater and raft aquaculture. (2) Confusion between the heterogeneous seawater in non-culture area and raft aquaculture. The area of non-culture seawater is much larger than that of culture area seawater, and far away from raft aquaculture. There is a significant difference in the spectrum between the most non-culture area seawater and raft aquaculture. However, the spectral reflectivity of seawater is affected by various factors. The heterogeneous seawater formed by currents and waves has a large difference with seawater standard seawater curve. This also poses a challenge for the extraction of raft aquaculture. The current research mainly focuses on raft aquaculture extraction with remote sensing spectral indices, such as normalized difference vegetation index (NDVI) [19,44], normalized difference water index (NDWI) [45], normalized difference build-up index (NDBI) [45], etc. However, these indices may not be able to identify all raft aquaculture from the complex seawater. Therefore, for different raft aquaculture types, some new remote sensing indices or features are needed to distinguish the raft aquaculture from seawater.
Thus, this study proposes a synergistic approach to integrate the time series optical data and SAR data obtained in 2020 using the object-oriented machine learning algorithm to improve the mapping accuracies of mariculture. The objectives of this study are: (1) to propose a new optical spectral index for mariculture; (2) to develop a method by combining the spectral, texture, and SAR backscattering to extract mariculture; (3) to apply our method to investigate the spatial patterns of mariculture in the Bohai Rim. This method may provide a scientific basis for monitoring mariculture.

2. Materials and Methods
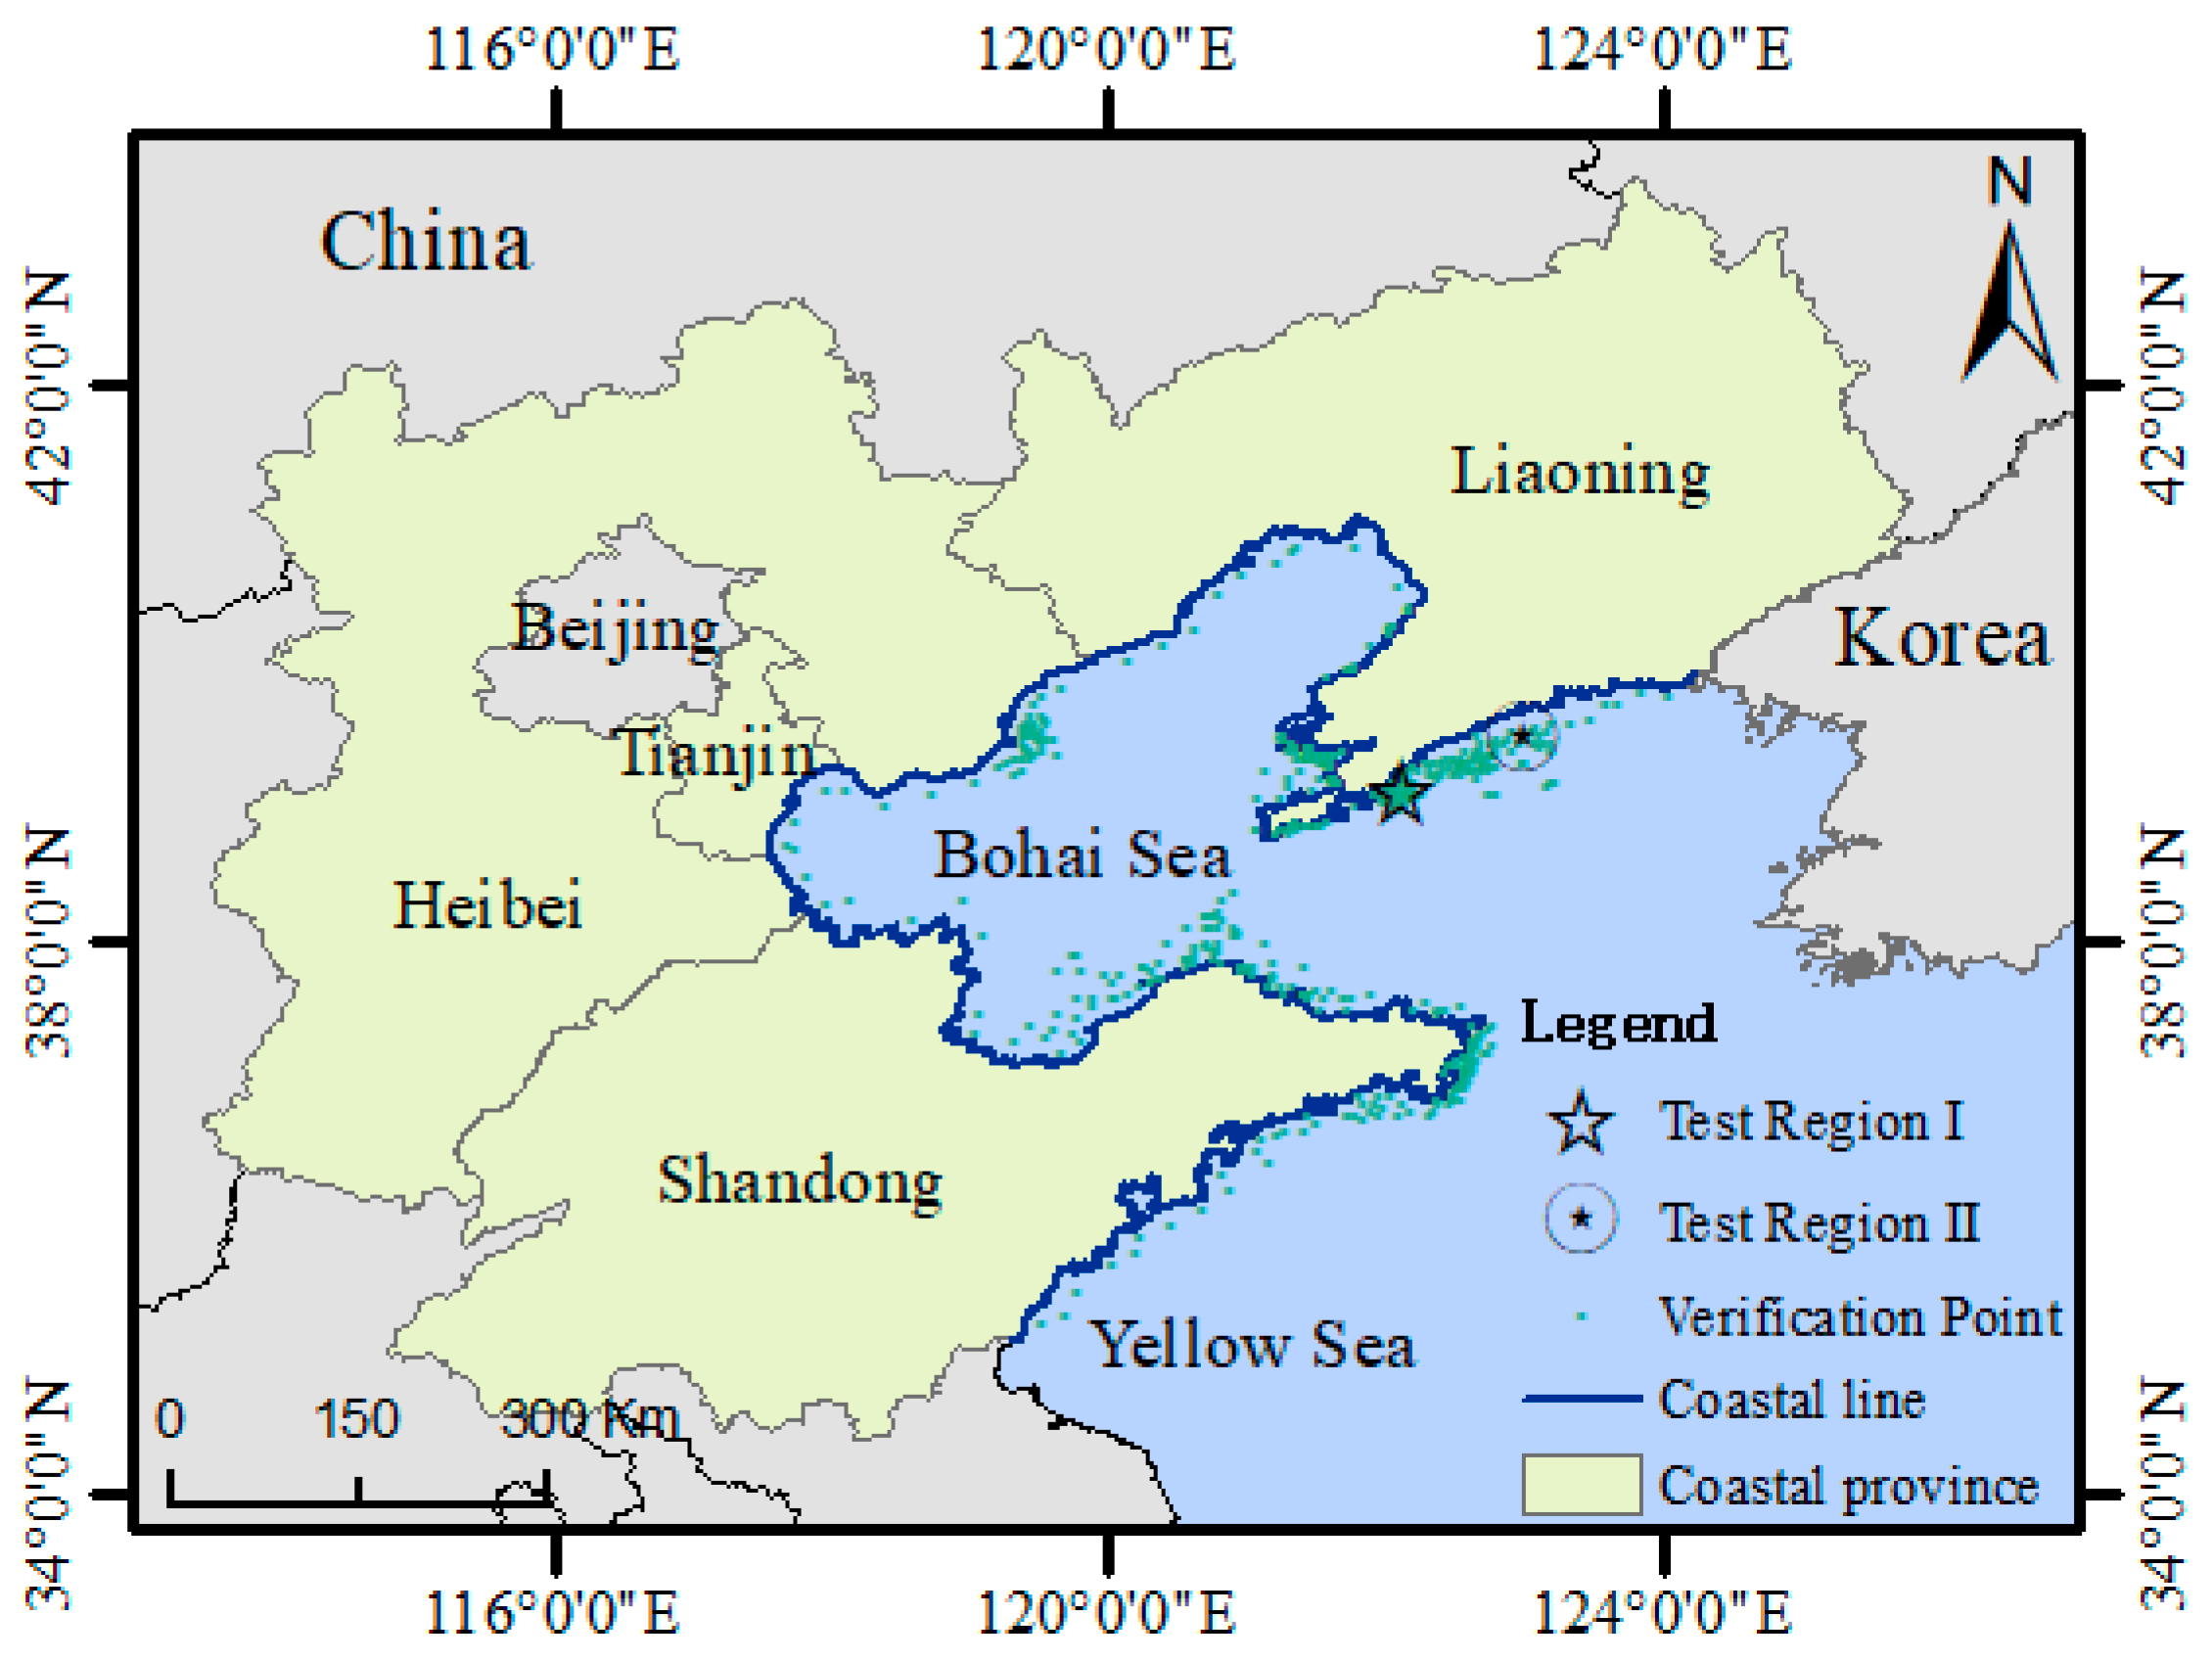
2.1. Study Area

The Bohai Rim is a vast area surrounding the Bohai Sea and part of the Yellow Sea. It is located in the northern part of the eastern coast of China and is adjacent to Korea in the east (Figure 1). It is between 34°22′–43°26′N and 113°27′–125°46′E, which is about 5.05 × 10⁵ km2, and includes the three provinces of Hebei, Liaoning, Shandong, and Tianjin City. The Bohai Rim has a temperate monsoon climate, with an annual average temperature of 14 °C and precipitation of 800 mm. Dominated by plains, it has a 5772 km long coastline, numerous bays, and open tidal flats with a high nutrient content, which are suitable for the growth of offshore aquaculture species such as fish, shrimp, and scallops. It has become one of the major coastal aquaculture areas in China.
In this study, two test regions were selected (Figure 1). Test region I is located in the sea area near Jinzhou District, Dalian City, and Liaoning Province (centered at 38°3′0″E, 122°6′0″), which are dominated by algae raft aquaculture. Region II is located in the sea area near Zhuanghe District, Dalian City, and Liaoning Province (centered at 39°50′10″E, 122°52′30″), where there is a mix of algae and shellfish raft aquaculture.
Along the Bohai Rim, mariculture is mainly distributed in bays, shallow tidal flats, and river banks. Cage aquaculture (Figure 2a) requires floats, sinkers, anchor stones, anchor ropes, net boxes, and net coats. They are mainly in the shape of a regular rectangle, which are predominantly used for fish and shrimp culture, such as abalone. Cage aquaculture fry is divided into spring (casting time is from April to May) and autumn (casting time is from August to September). Conversely, raft aquaculture (Figure 2b) consists of the main valve body, seedling rope, and float. The main valve body has a small area. It is arranged at equal intervals in hundreds and thousands and it is distributed in dense strips. Raft aquaculture is mostly completed in April and its harvesting time varies greatly depending on the cultured species.

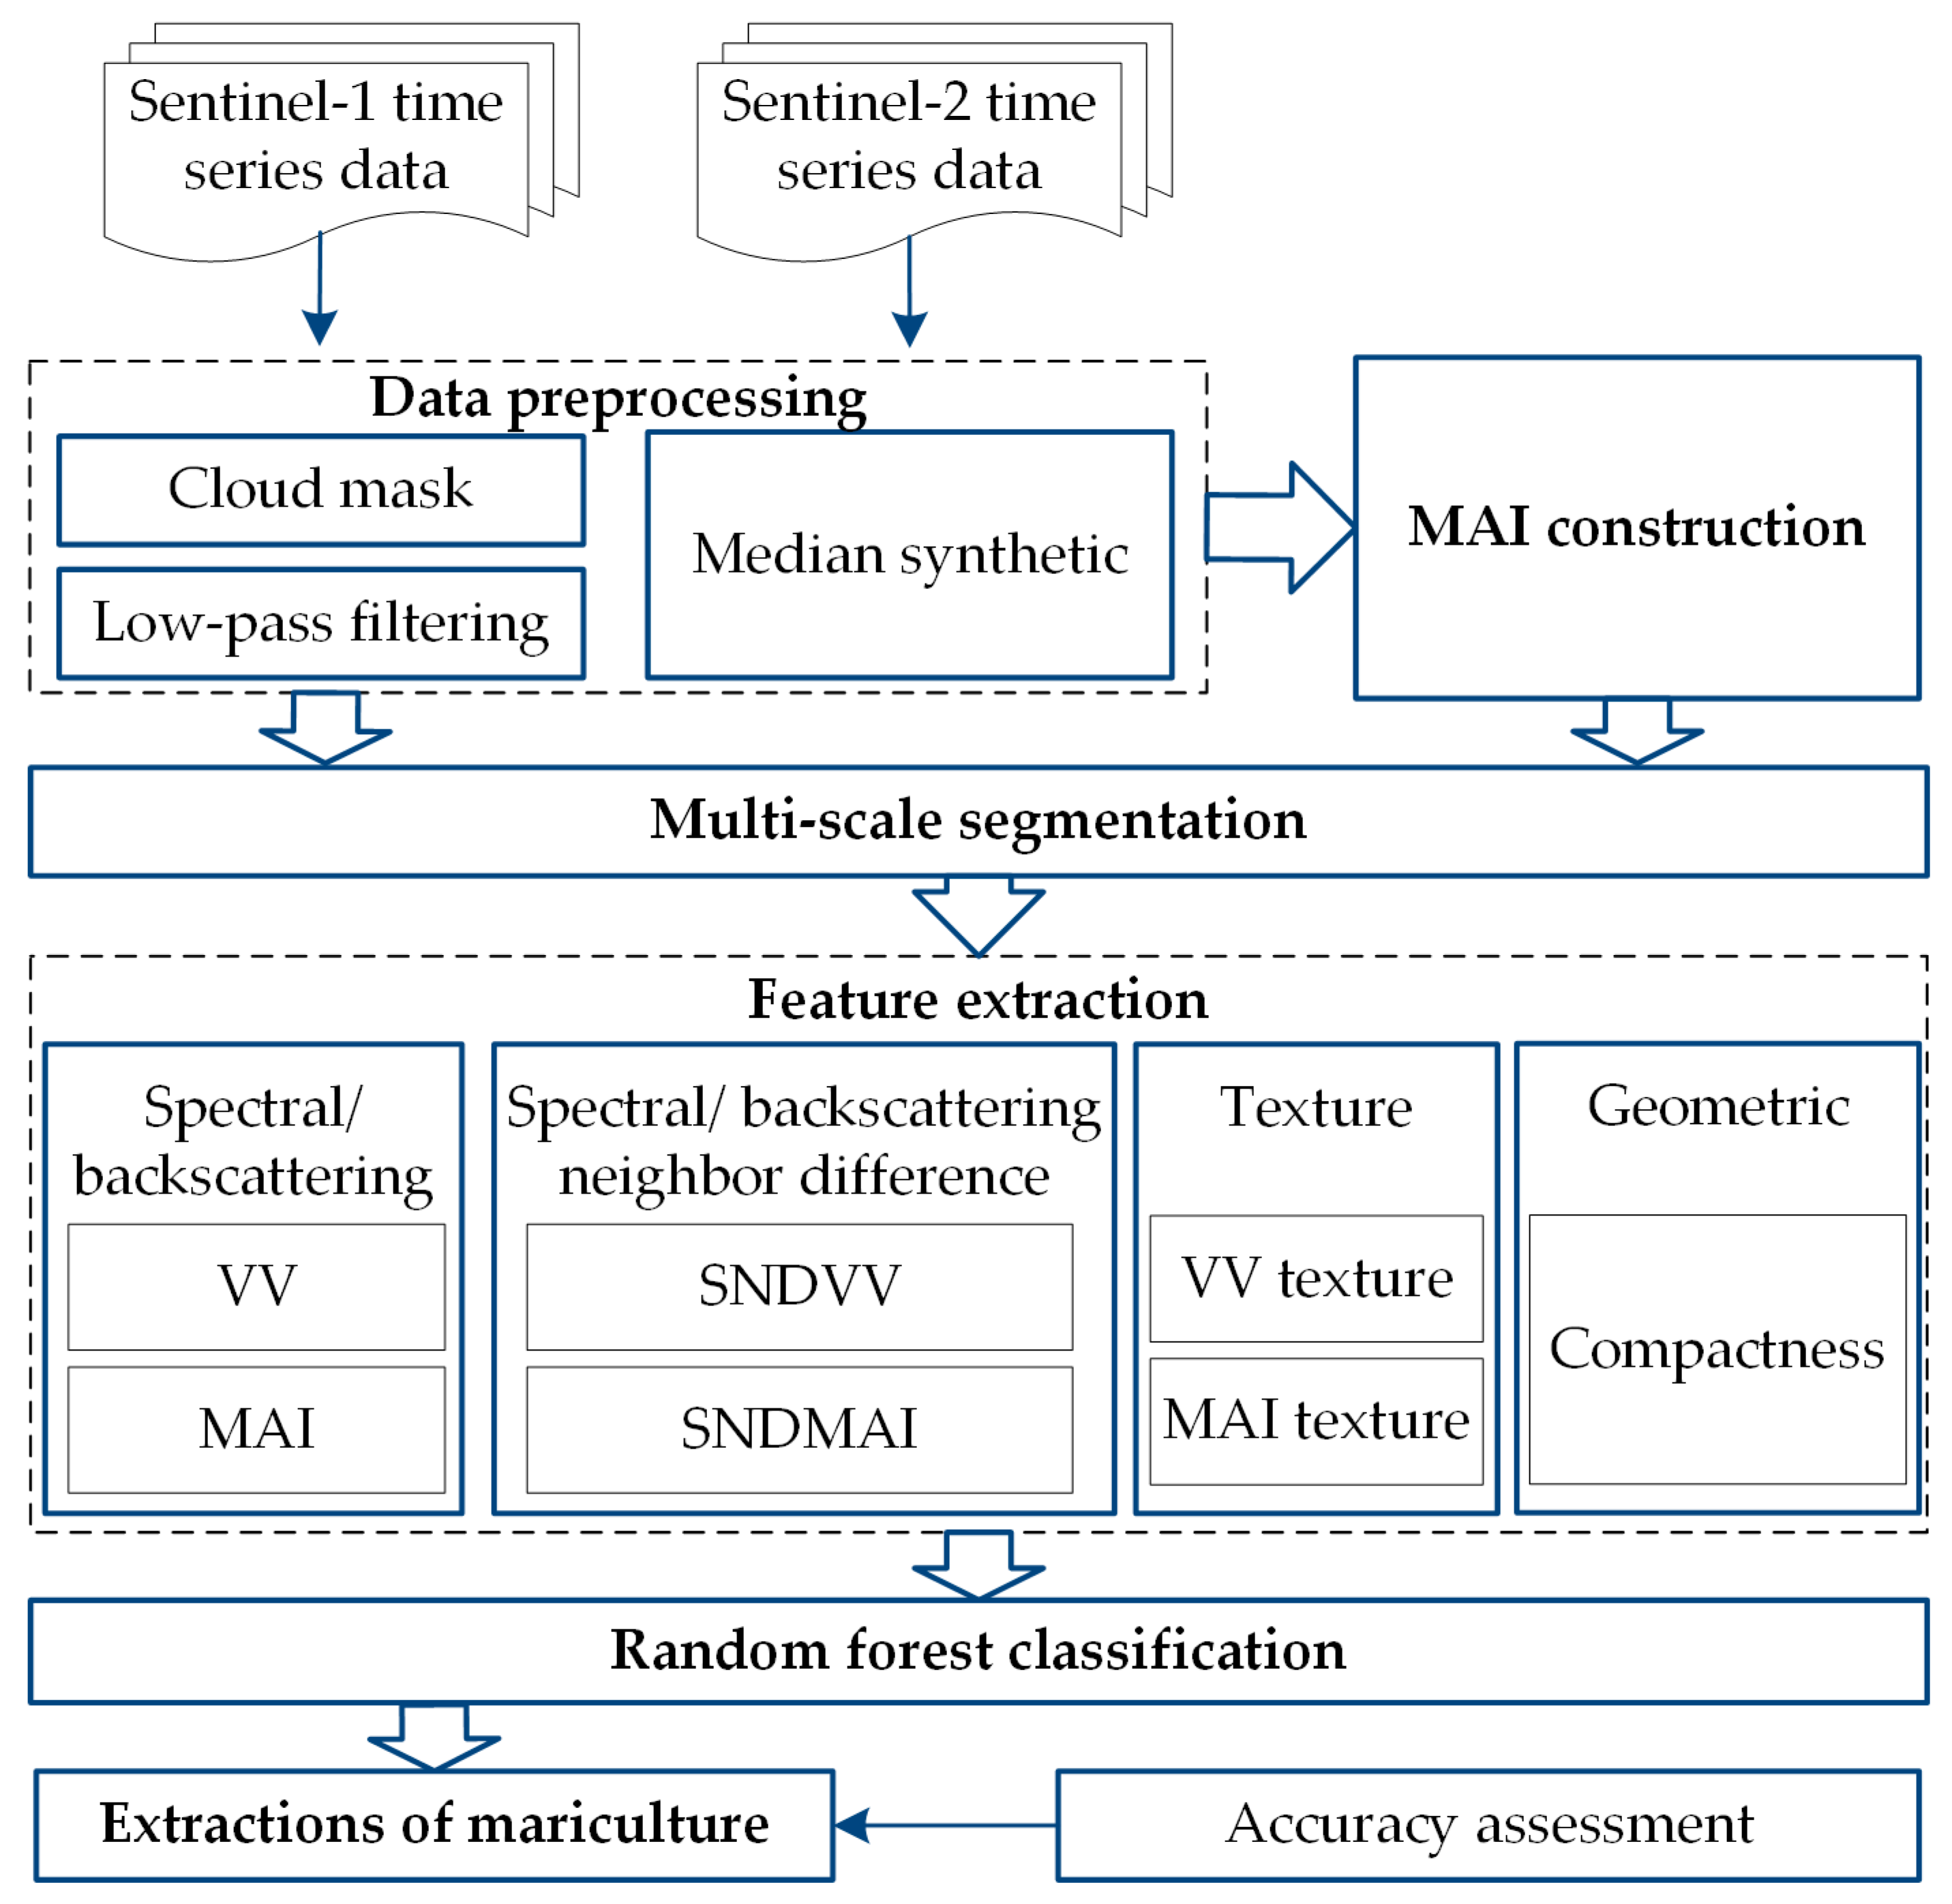
2.2. Data and Preprocessing

2.2.1. Remote Sensing Data

  • Sentinel-2 satellite data
Sentinel-2 is a multi-spectral imaging satellite and part of the European Space Agency Copernicus program [46]. It carries the multispectral imagery (MSI) and contains 13 spectral bands. It consists of two satellites of 2A and 2B, with a phase difference of 180° [47]. Each satellite has a revisit period of 10 days, with a complementary double satellite for a temporal resolution of 5 days. It has 3 spatial resolutions of 60 m, 20 m, and 10 m, and an amplitude of 290 km.
We selected all available L2A-level Sentinel-2 images of the Bohai Rim in 2020 with cloud cover of less than 70% from the Google Earth Engine (GEE) platform [48,49]. The L2A-level images had already undergone atmospheric correction. The quality assessment (QA60) band of Sentinel-2 images provides cloud mask information. We used the C function of mask (CFMask) algorithm [50,51] on the QA60 band, removing the clouds and cirrus clouds to obtain high quality images.
Considering the variable timing of aquaculture harvest and the possible cloud occlusion and other noise effects of single images, a median composite of the Sentinel-2 data available throughout the year was obtained. It was chosen to represent the entire time series rather than the mean because the influence of the mean’s possible extreme outliers is significant [52].
In order to explore the function of the median image, test region I was employed. Since the harvest period in this region is from mid-May to early July, the high quality single image taken in late April (Figure 3a) and the median synthetic image (Figure 3b) were selected. It indicates that the single phase image may miss a considerable amount of mariculture. Because of the uneven surface of the seawater, which is affected by wind and waves, reflection and target loss occur. In addition, the reflectance of different raft aquaculture areas varies greatly and is influenced by harvesting time and culture density, which may not be accurately acquired from a single image. In the median image of Sentinel-2, the spectrum of raft aquaculture becomes homogeneous, which is beneficial during the extraction of all mariculture areas.
  • Sentinel-1 satellite data
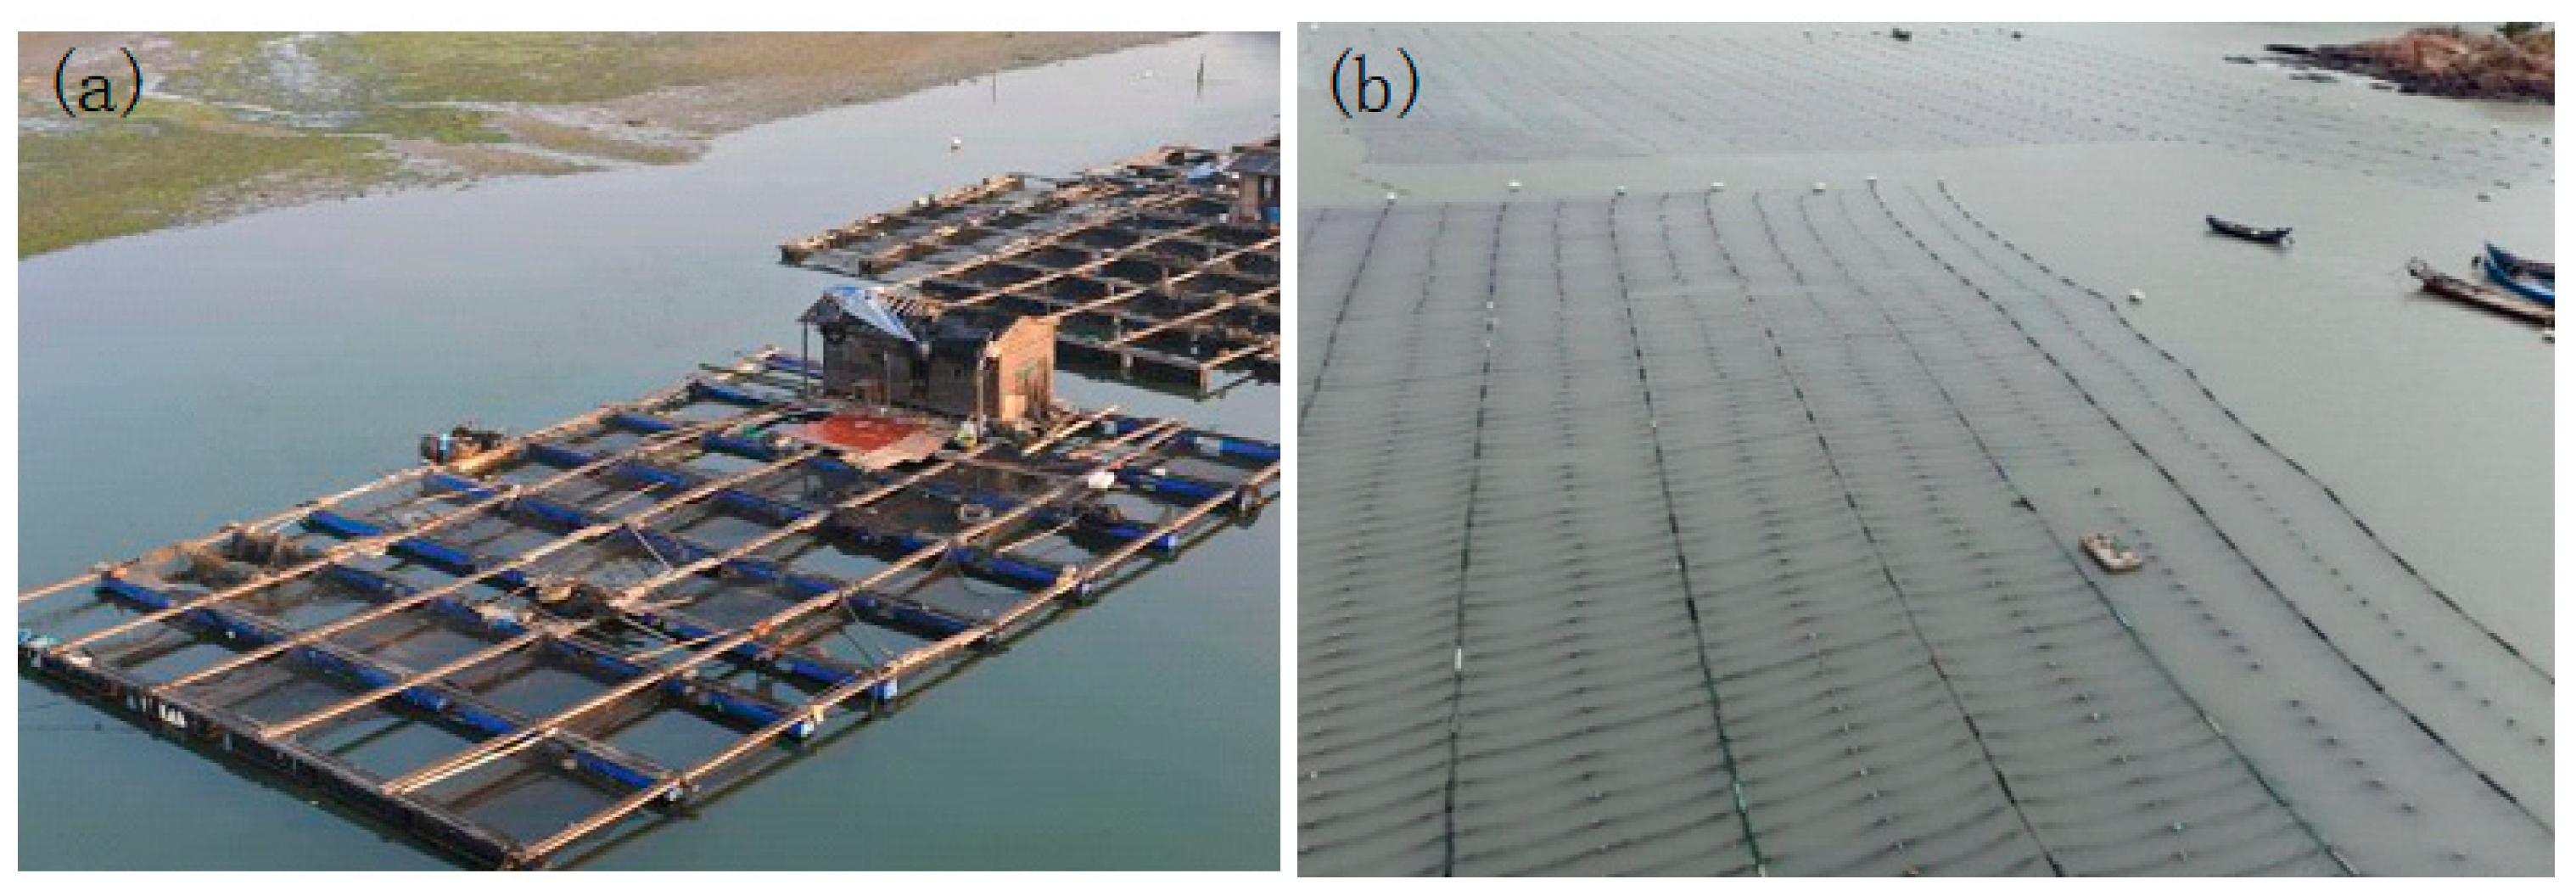
Sentinel-1 is an SAR imaging satellite, and it is part of the European Space Agency Copernicus program [53]. It carries a C-band SAR that obtains data without weather influence. It consists of two polar-orbiting satellites of 1A and 1B, which have a 6-day temporal resolution, a spatial resolution of 5 m × 20 m, and a magnitude of 250 km. The data acquisition mode is interferometric wide swath (IW) and the product type is Level-1 ground range detected (GRD) using the polarization of vertical transmit and vertical receive (VV) and vertical transmit and horizontal receive (VH). VV polarization is a type of polarization that has a better penetration ability than VH polarization [54]. The difference in the VV backscatter coefficient between seawater and raft aquaculture is greater than VH. So, all the single-polarization instances of VV images for 2020 in the study area were acquired from GEE. Sentinel-1 images in GEE were preprocessed to generate calibrated orthorectified products by using the Sentinel-1 toolbox.
Seawater can vary greatly, and waves formed by strong winds or currents can create mirror reflections that produce streak noise on the SAR images. In addition, Sentinel-1 is affected by the imaging principle, which also leads to the images containing a large amount of speckle noise. Using median SAR images can reduce these noises to some extent. After that, a low-pass filtering [37] method is applied to reduce the speckle noise, and enhance the backscattering feature of mariculture.

2.2.2. Sample Data

To understand the difference between seawater and mariculture and select an appropriate threshold, the mariculture sampling site and its surrounding seawater sampling sites were used as pairs of sampling point sets. Based on the high-definition images of Google Earth, we selected 50 pairs of raft aquaculture and neighbor seawater training sample point sets around the Bohai Rim.
Similarly, based on the high-definition images of Google Earth in 2020, we selected 933 samples, including 225 cage aquaculture samples, 325 raft aquaculture samples, 200 culture area seawater samples, and 183 non-culture area seawater samples. When selecting samples, the samples should be evenly distributed in the mariculture area. For sample points, 60% (560) of samples were used for training the machine learning classification model, and the remaining 40% (373) were used for accuracy verification of the mariculture classification results.

2.2.3. Reference Data

In order to avoid the influence of inland water for mariculture extraction, we selected a shoreline dataset provided by the Institute of Geographic Sciences and Natural Resources Research (IGSNRR) [55,56], which covers the entire coastal region of China. We used it to generate a terrestrial mask to exclude inland water from the study area.
The statistical areas of different mariculture sites in several provinces around the Bohai Sea were mainly derived from the 2021 China Fisheries Statistical Yearbook [5]. In addition, the data for China’s offshore raft and cage aquaculture areas in 2018, obtained from Liu [44], were based on Landsat 8 satellite imagery and were also applied as the comparison data.

2.3. Method

The method developed in this study for extracting mariculture on a large-scale basis by using Sentinel-1 and Sentinel-2 images includes 4 steps (Figure 4): (1) according to the spectral characteristics of raft aquaculture and seawater, a new remote sensing spectral index, namely the marine aquaculture index (MAI), was constructed; (2) some features were extracted, including the spectral and backscattering features, spectral and backscattering neighbor difference features, texture feature, and geometric feature; (3) random forest classification was performed; (4) an accuracy assessment based on a confusion matrix was carried out.

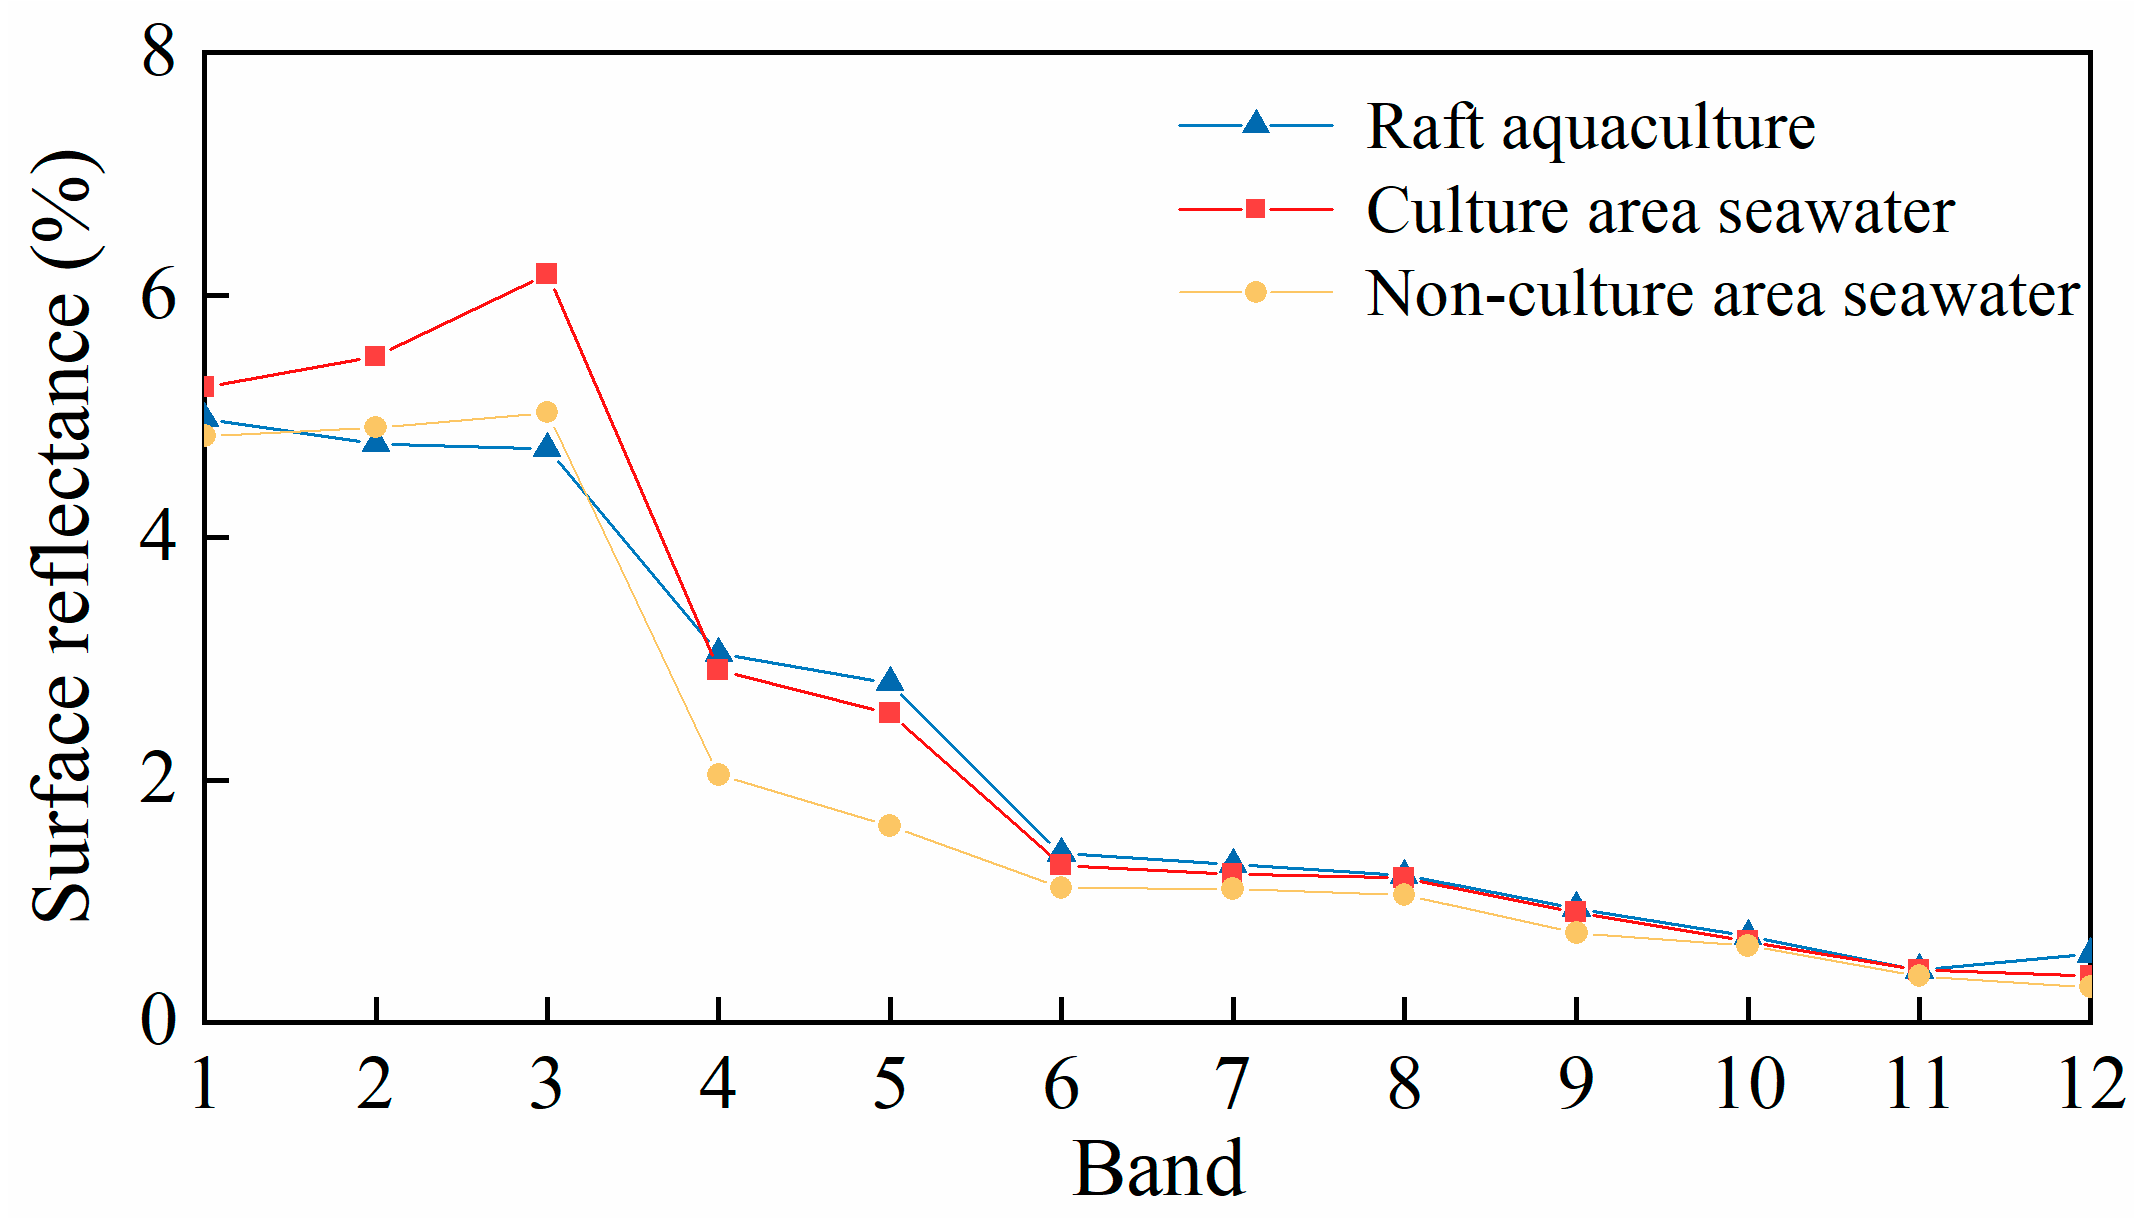
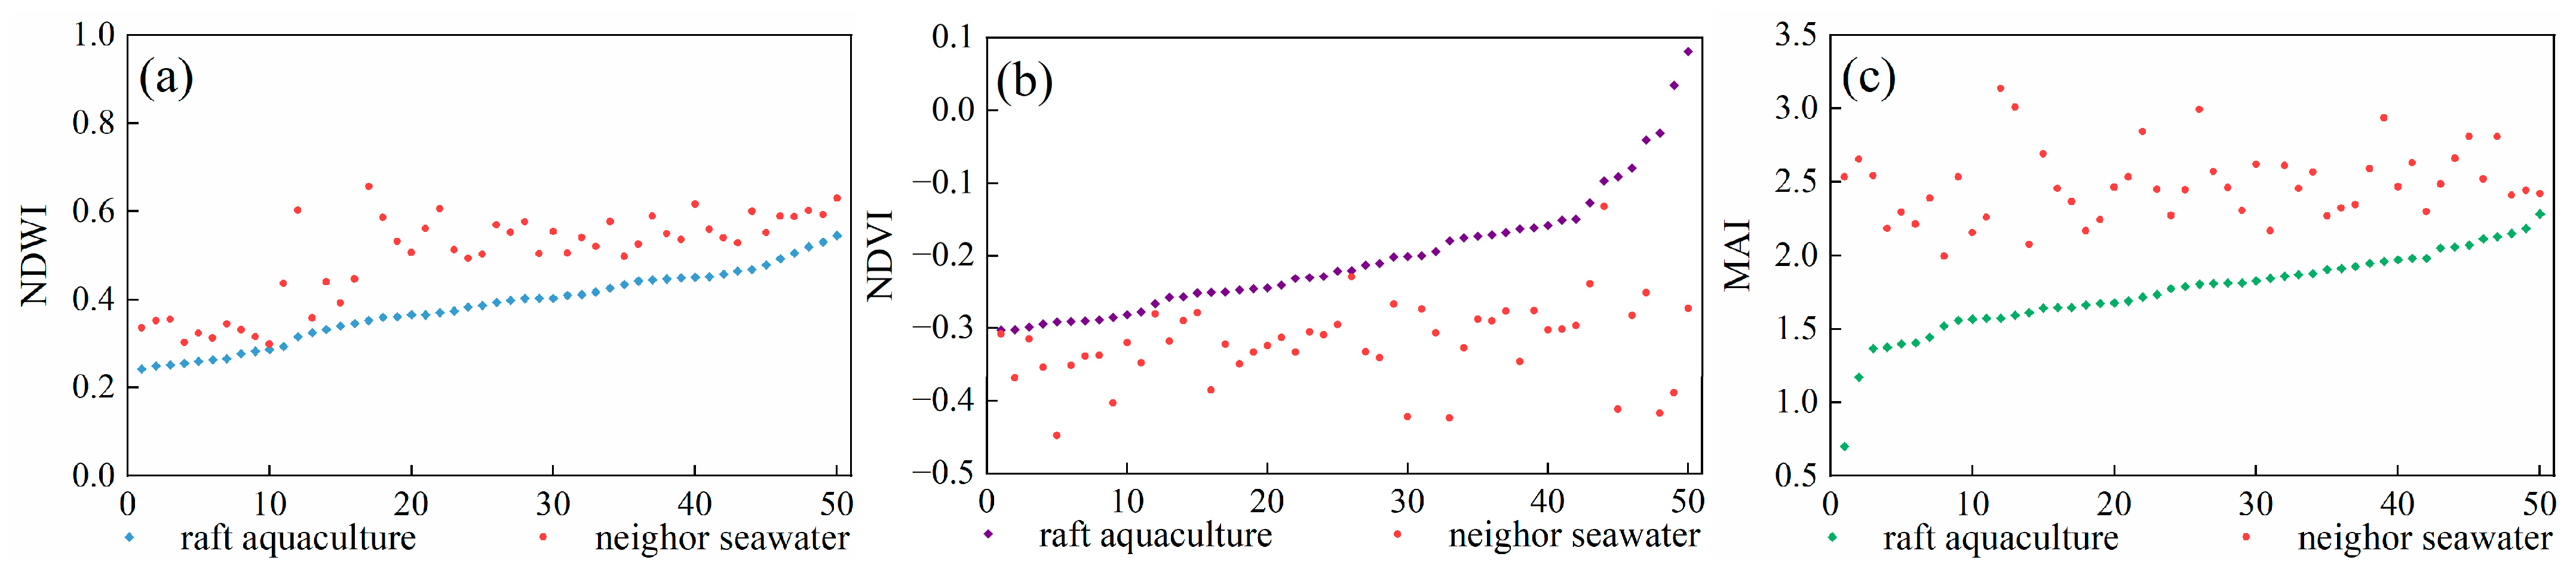
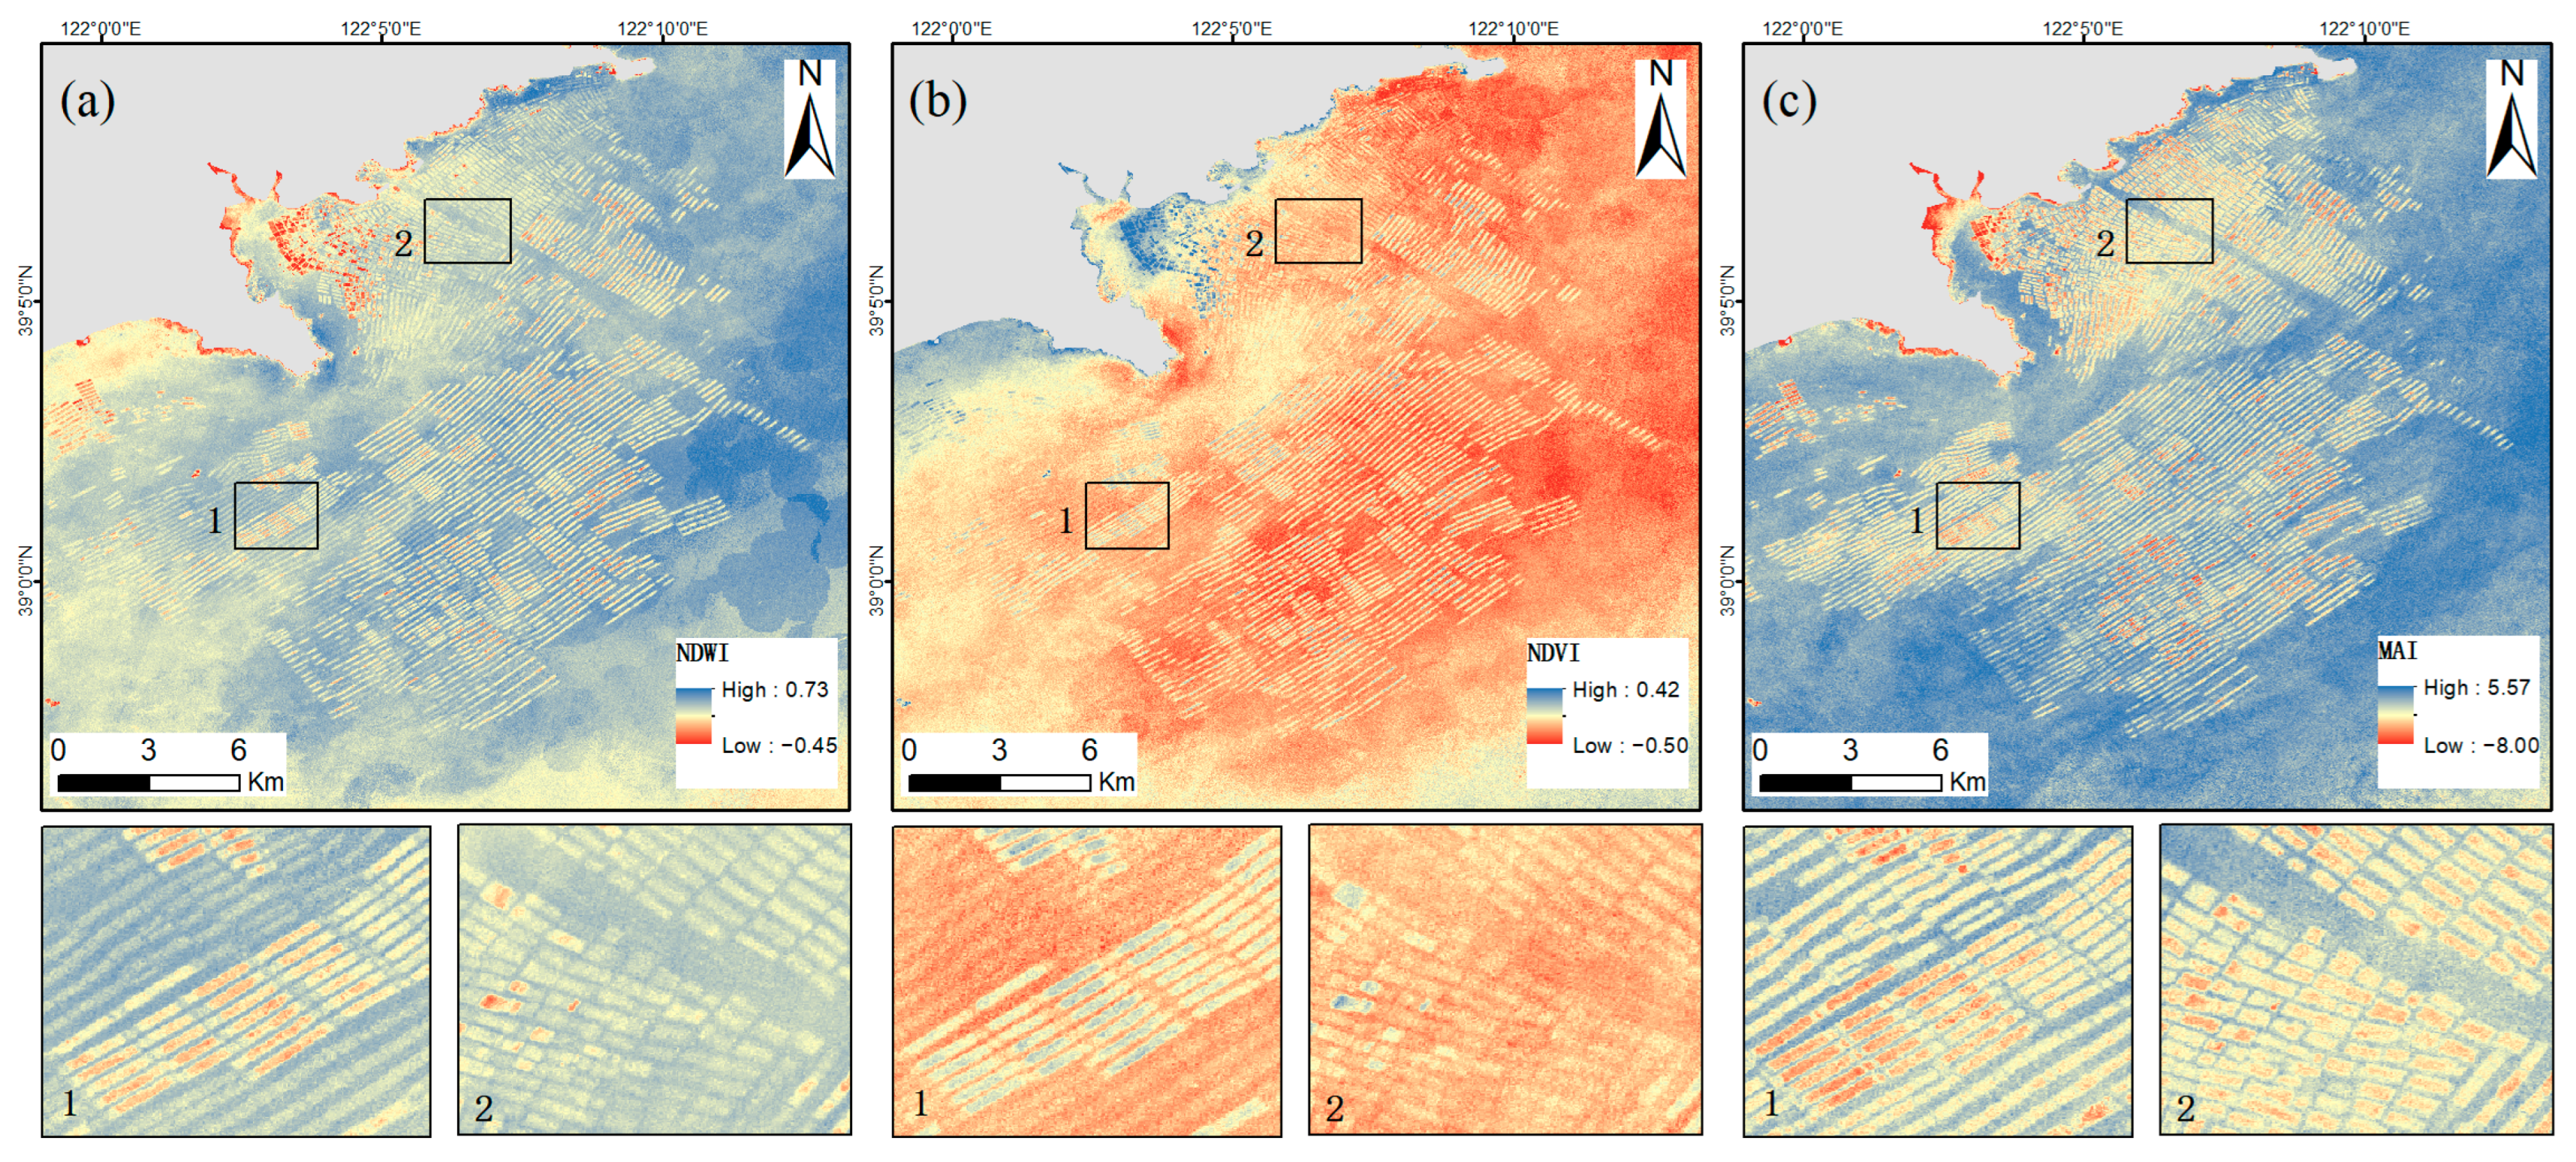
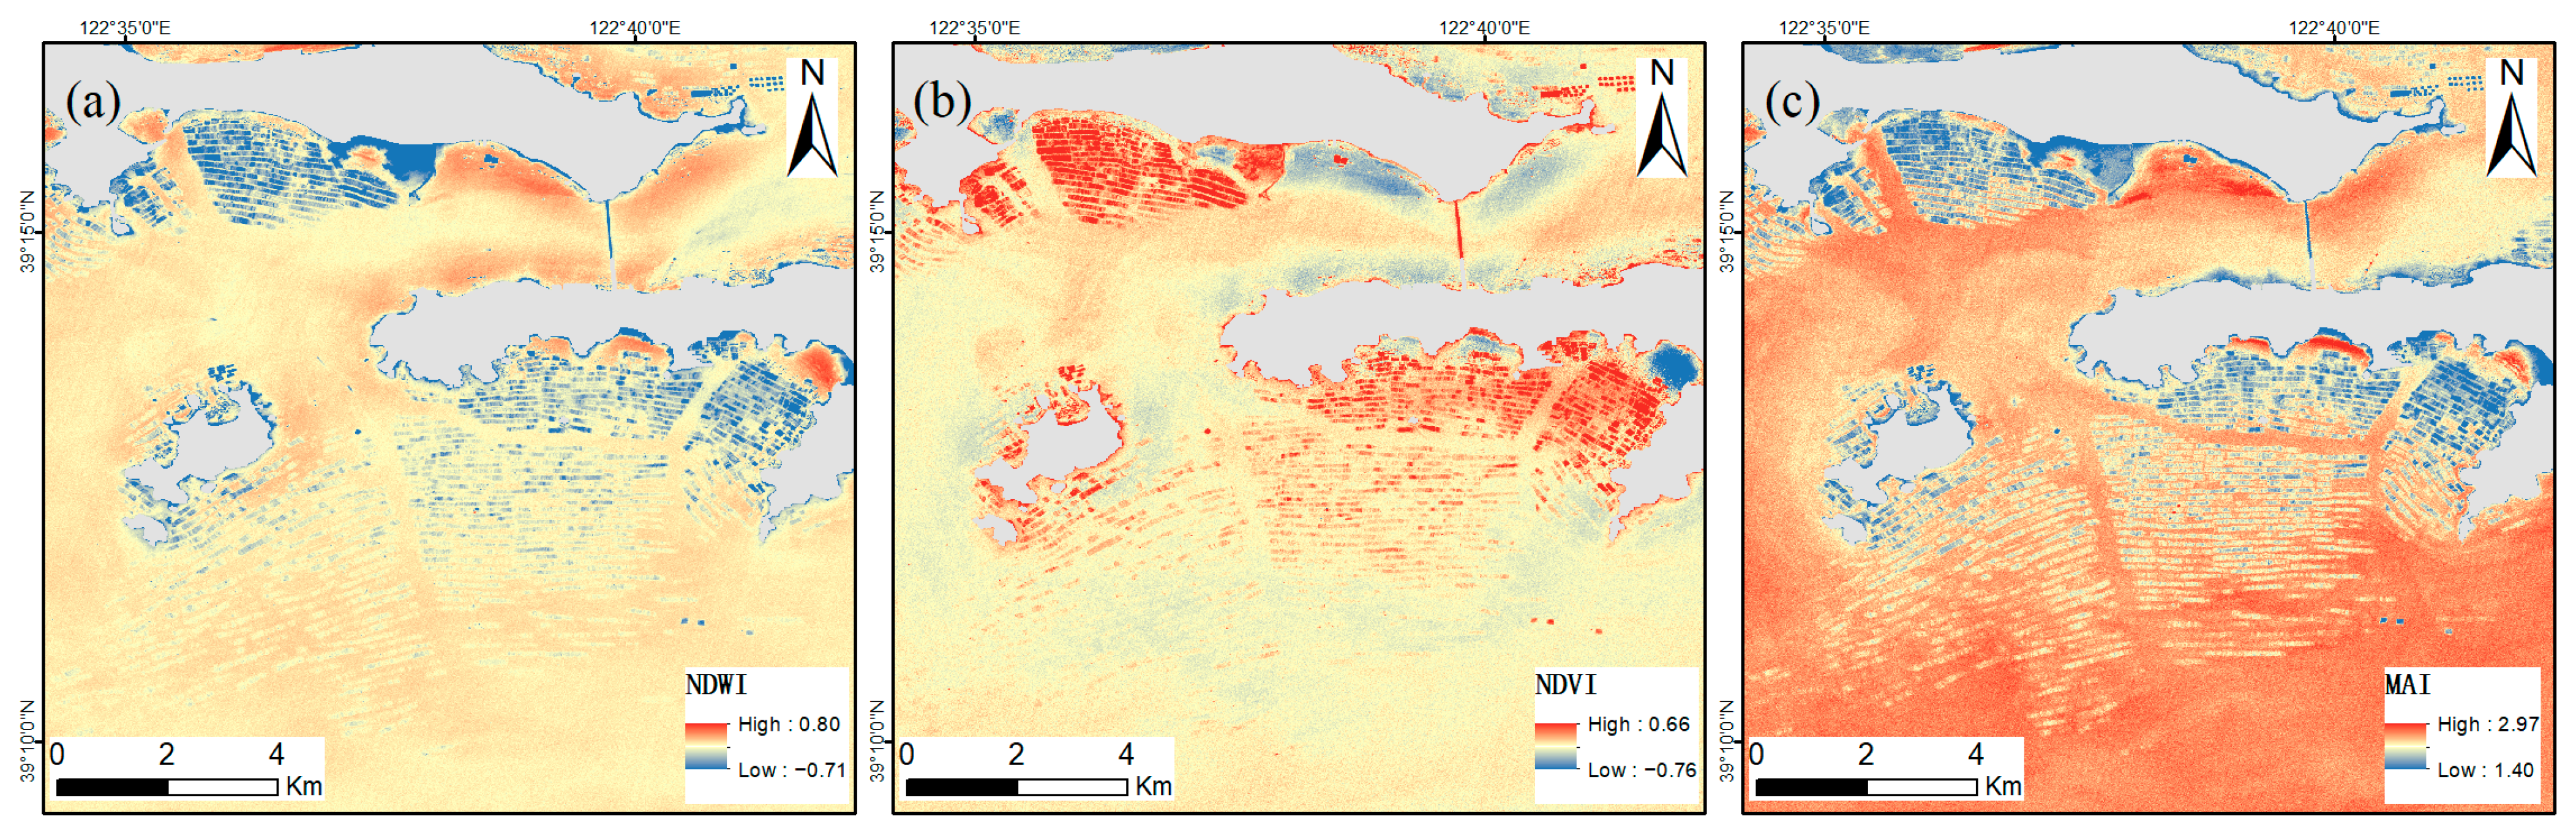
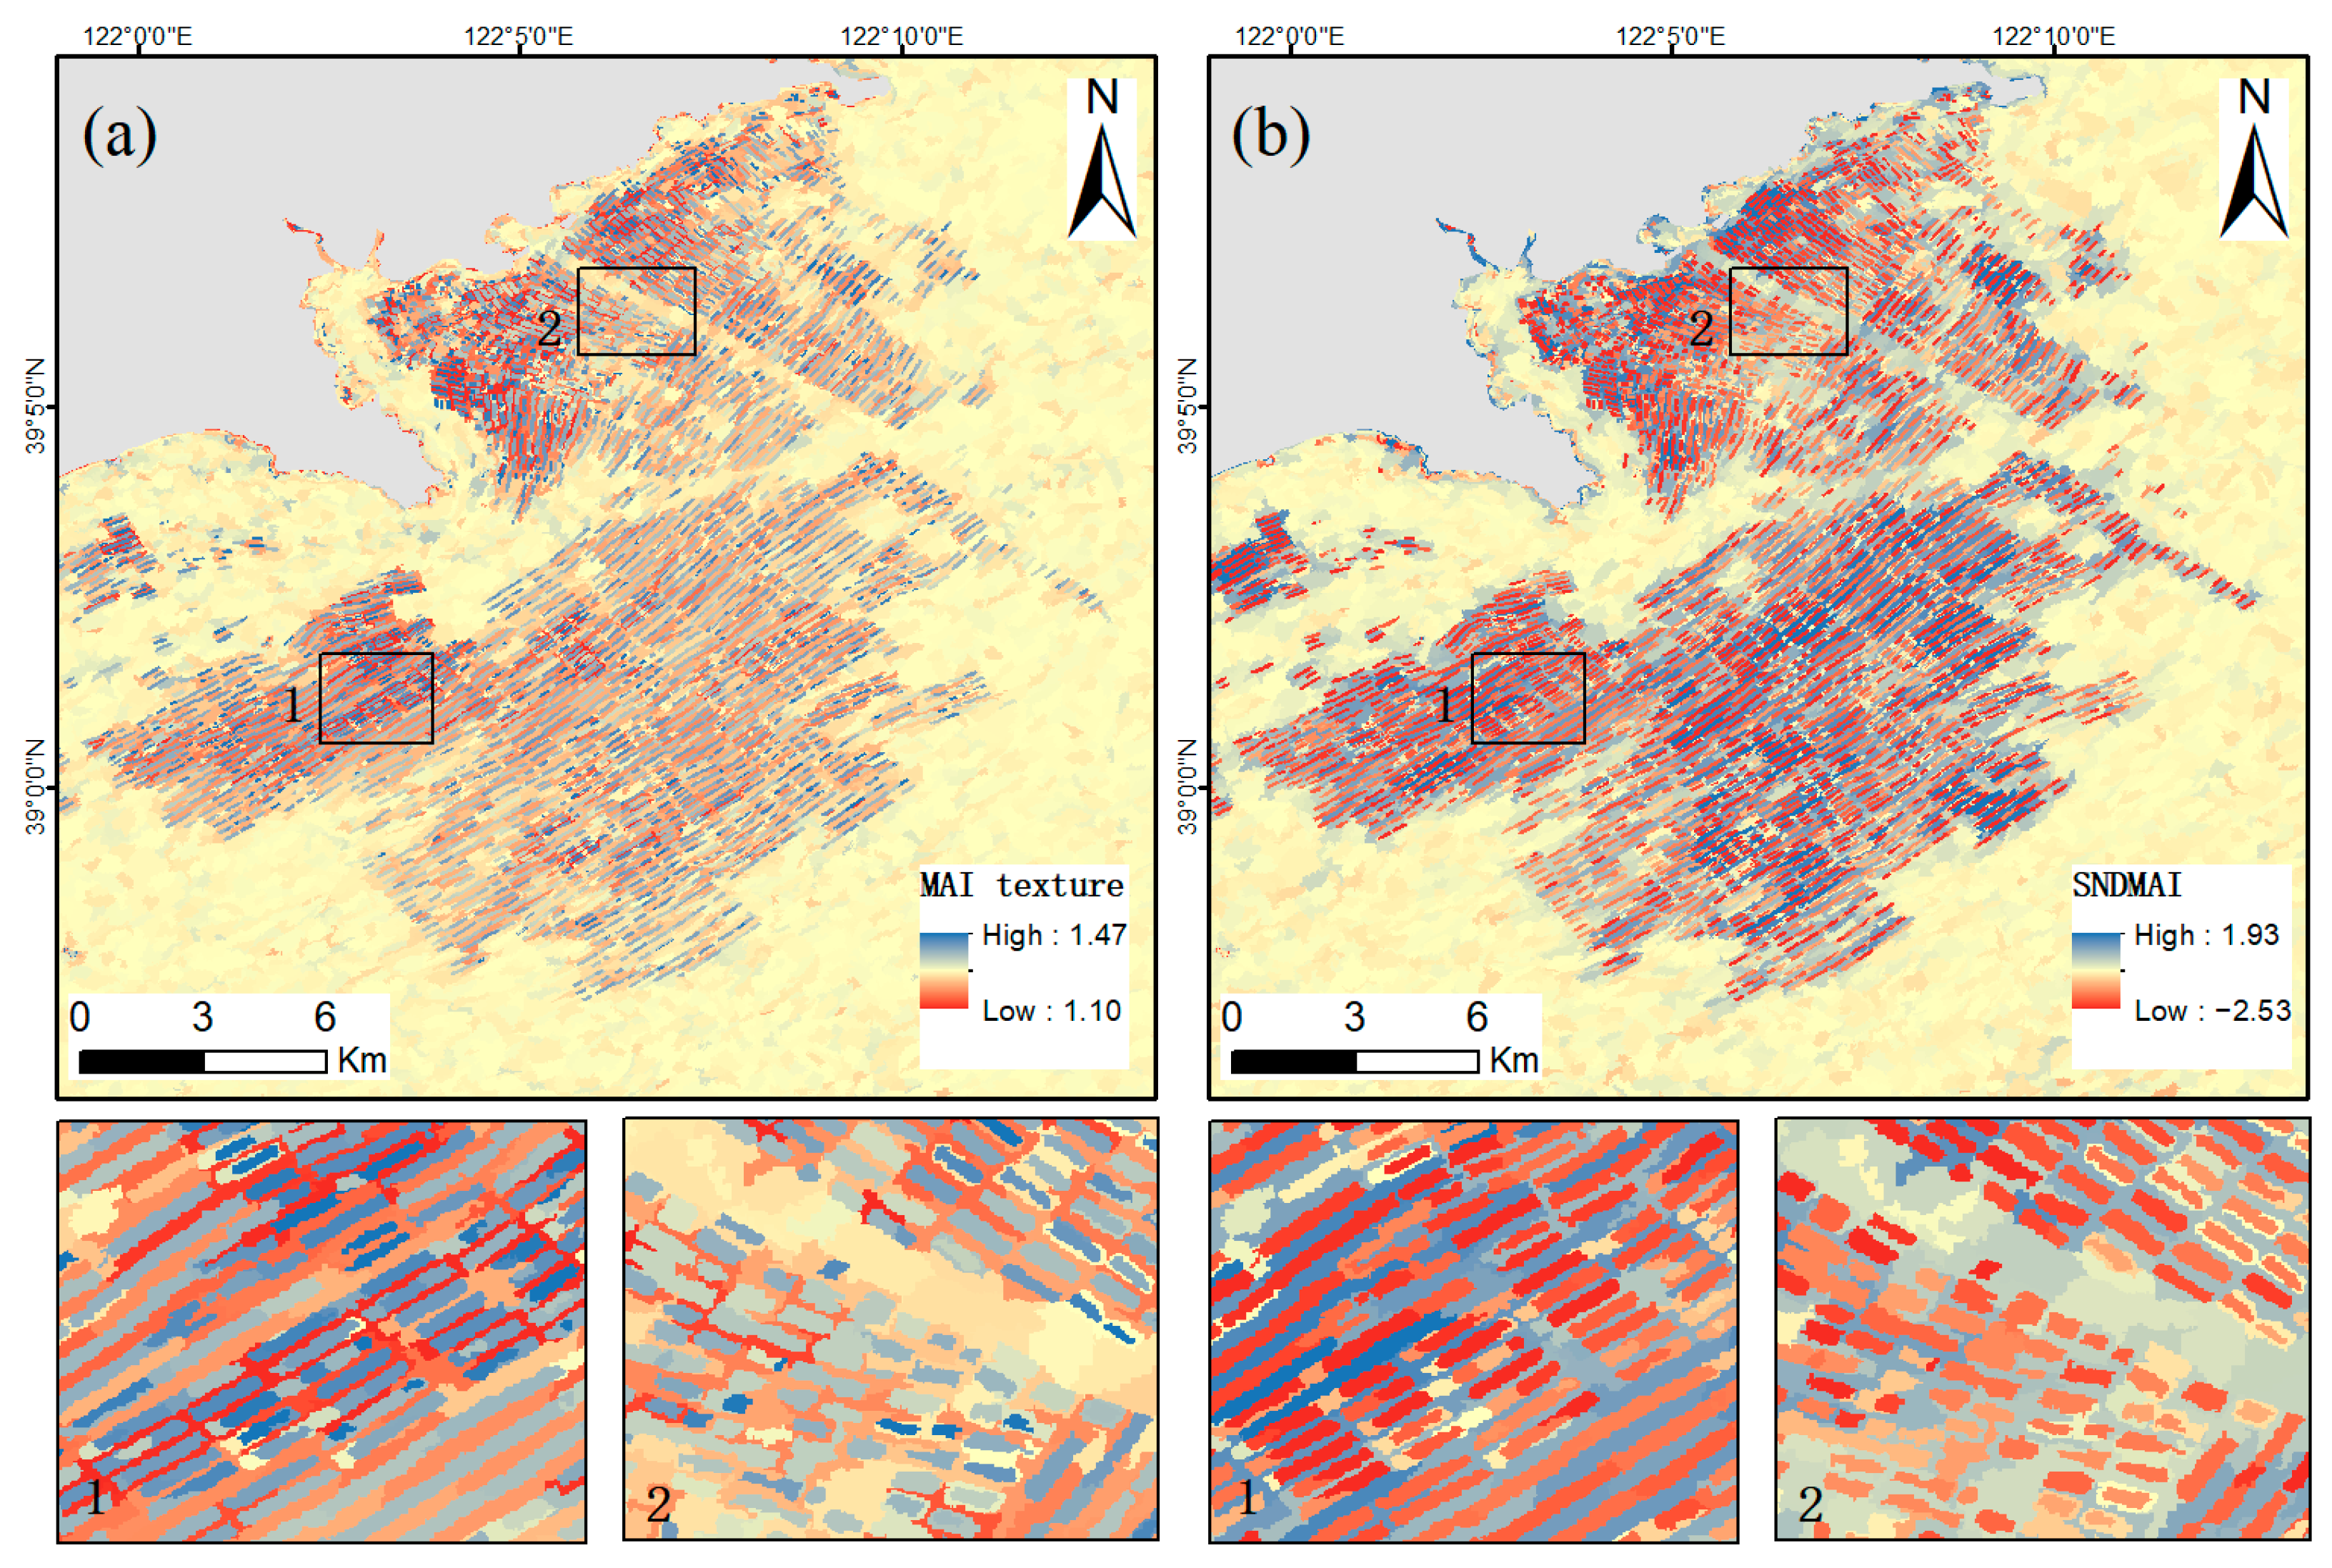
2.3.1. Construction of the Marine Aquaculture Index (MAI)

The complexity of the seawater spectrum is an important factor affecting the accuracy of mariculture extraction. The value of seawater in a single band can easily become very different due to factors such as ocean currents, which is not conducive to differentiation from mariculture. Several seawater and mariculture samples in the remote sensing images were selected, and the standard curves of seawater and algae aquaculture in each band are shown in Figure 5.
In B1–B3, the difference in the surface reflectance of heterogeneous sea and mariculture is small. In B4–B5, the mariculture area and neighboring sea area have a similar surface reflectance. In B6–B12, all three areas have a similar surface reflectance. Consequently, a single band cannot solve the mixing of seawater and raft aquaculture. Heterogeneous seawater and neighbor seawater have a common feature, i.e., the surface reflectance of B4 is much smaller than B2 and B3. The differences between the reflectance of B2/B3 and B4/B5 in culture area seawater and non-aquaculture area seawater are significantly higher than that in raft aquaculture.
Different wavelengths of visible light propagate differently in water. For example, light with shorter wavelengths penetrates better in water than light with longer wavelengths. We finally chose three bands, including blue, green, and red, to build the new index. According to Figure 5, the average of the blue band and green band minus the red band surface reflectance of the culture area seawater and non-culture area seawater is about 2.5%, but that of raft aquaculture is only 1.7%, which accounts for the largest difference. Based on the relative sizes of spectral bands for raft aquaculture and seawater, we constructed the new index. Because the index can identify marine aquaculture, it is named the marine aquaculture index (MAI).
The merit of this MAI is that it achieves a homogeneous background in terms of the sea, and reduces the differences between algal aquaculture. It reflects the amount of algae in seawater and facilitates the distinction between seawater and raft aquaculture. Finally, the formula of MAI is as follows:
M A I = ρ B l u e + ρ G r e e n 2 ρ R e d
where ρBlue, ρGreen, and ρRed are the surface reflectance in the bands of blue (470–505 nm), green (505–588 nm), and red (640–780 nm), respectively.
Based on the formula of MAI, the time series images of MAI were firstly calculated with the Sentinel-2 time series images. Then, the MAI series images were sorted from smallest to largest. Lastly, the median of the MAI image was acquired by calculating the median value of each pixel in the MAI time series images.
Raft aquaculture is mainly distributed in the offshore region and around islands. We compare the results of MAI and traditional indices including NDVI and NDWI in distinguishing mariculture from neighbor seawater, seawater at a distance, and seawater surrounding an island to demonstrate the effectiveness and superiority of MAI in distinguishing mariculture from seawater.
  • Comparison with neighbor seawater
We calculated the NDWI, NDVI, and MAI by selecting 50 pairs of raft aquaculture and adjacent seawater culture sample point sets in the Bohai Rim. The different spectral index statistics of raft aquaculture and adjacent seawater were obtained by ascending sorting (Figure 6). As shown in Figure 6a,b, at least six raft aquaculture and neighbor seawater sample sets have a very similar NDVI or NDWI. The minimum value of the index difference between seawater and raft aquaculture is 0.01. It is impossible to classify raft aquaculture using NDWI or NDVI. The MAI of raft aquaculture and neighbor seawater sample sets always has a significant difference. The minimum value of index difference between seawater and raft aquaculture is 0.12. Then, the data are compared longitudinally, meaning that the same index values in different regions are compared. The range of raft aquaculture NDWI, NDVI, and MAI are 0.24–0.55, −0.30–0.08, and 0.70–2.28, respectively. The range of neighbor seawater NDWI, NDVI, and MAI are 0.30–0.69, −0.46–−0.15, and 2.00–3.14, respectively. In terms of the range overlap between mariculture and neighbor seawater, MAI had the best performance. The range overlap of MAI was only 17.72% which NDWI and NDVI were 80.65% and 39.47%, respectively. In summary, MAI makes the value range of the two classes different greatly and can enlarge the difference of each raft aquaculture and its neighbor seawater.
  • Comparison with seawater at a distance
For non-culture area seawater, which is far from aquaculture, the index feature map was used for further analysis. The maps of NDVI, NDWI, and MAI are shown in Figure 7. Two local graphs were used to compare the raft aquaculture and neighbor culture area seawater in detail. Overall, the NDVI and NDWI of seawater varied greatly (Figure 7a,b). The NDVI of seawater in test region I is much higher than that of the seawater in test region II, while the NDWI is much smaller. The NDVI and NDWI of non-culture area seawater vary greatly in wide sea, and it is difficult to distinguish all the raft aquaculture and non-culture area seawater according to the NDWI or NDVI. The MAI of seawater is relatively uniform, and about 85% of seawater MAI is less than 0.20. The difference in MAI between non-culture area seawater and raft aquaculture is obvious (Figure 7c). The MAI difference of raft aquaculture and culture area seawater is greater than the difference of NDWI or NDVI. MAI is better than NDWI, while NDWI is better than NDVI in identifying raft aquaculture and seawater. It indicates that MAI better identifies seawater in mariculture and aquaculture areas.
  • Comparison with seawater surrounding island
Raft aquaculture is not only grown in coastal areas, but also abundantly distributed around islands farther along the coast. In order to ensure the applicability of MAI across the region, the areas close to islands were then explored. As is shown in Figure 8, it is found that the raft aquaculture far from the island is easily confused with seawater for NDWI and NDVI. However, the MAI of the raft aquaculture far from the island is always smaller than neighboring seawater. Therefore, it can be noted that the MAI provides a unique advantage in raft aquaculture extraction.
However, there is still overlap in the range of MAI values between the raft aquaculture and neighbor seawater. It suggests that raft aquaculture MAI in one area may be the same as the seawater in another area. We cannot use MAI alone to classify raft aquaculture. Therefore, we tried to use other features such as texture and spatial features to solve this problem (Section 2.3.3).

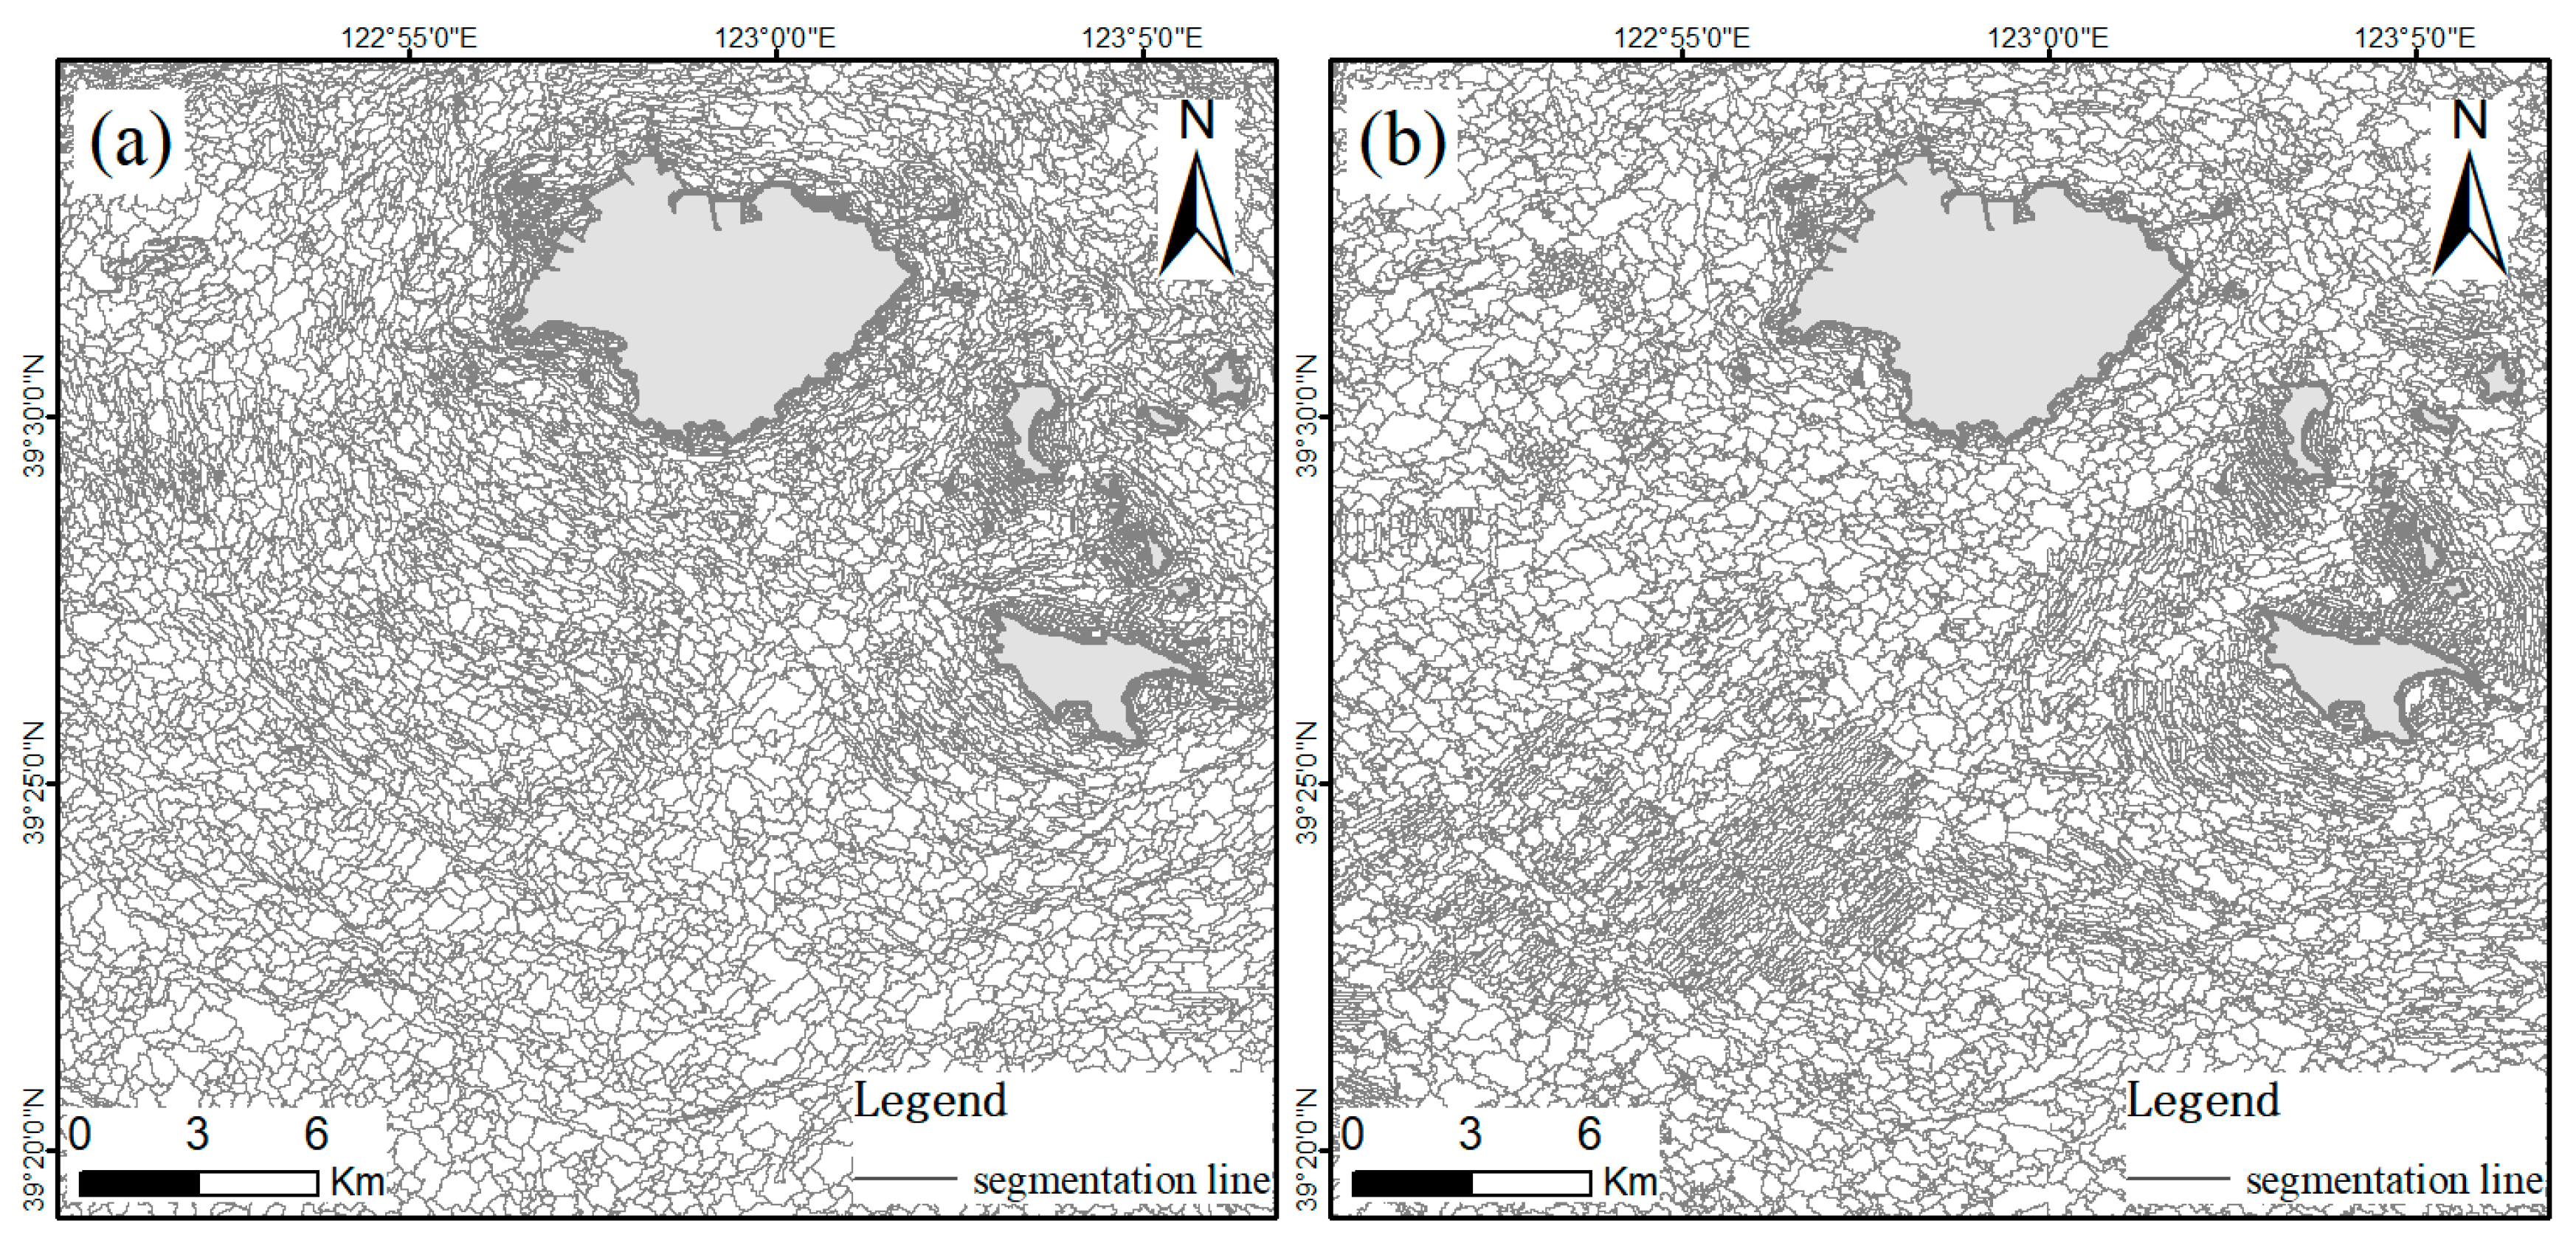
2.3.2. Multi-Scale Segmentation

Segmentation is the first step of object-oriented classification and has an important impact on classification accuracy [57]. Multi-scale segmentation is a common object-oriented segmentation algorithm, following the principle of maximizing heterogeneity among objects after segmentation. Homogeneous objects are obtained based on the following three parameters: segmentation scale, shape factor, and compactness factor.
The multi-scale segmentation is performed based on eCognition software [58]. In order to separate all raft aquaculture and seawater by segmentation, we tried the following two segmentation methods: (1) only use Sentinel-2 median image bands including the bands of red, green, blue, NIR, and Red Edge1; (2) use Sentinel-1 and Sentinel-2 median images including single-polarization VV, and the bands of red, green, blue, NIR, and Red Edge1. Combined with the size of a single raft aquaculture, we set the segmentation scale to 30. The shape factor was set to 0.1 and compactness factor to 0.5.

2.3.3. Feature Extraction

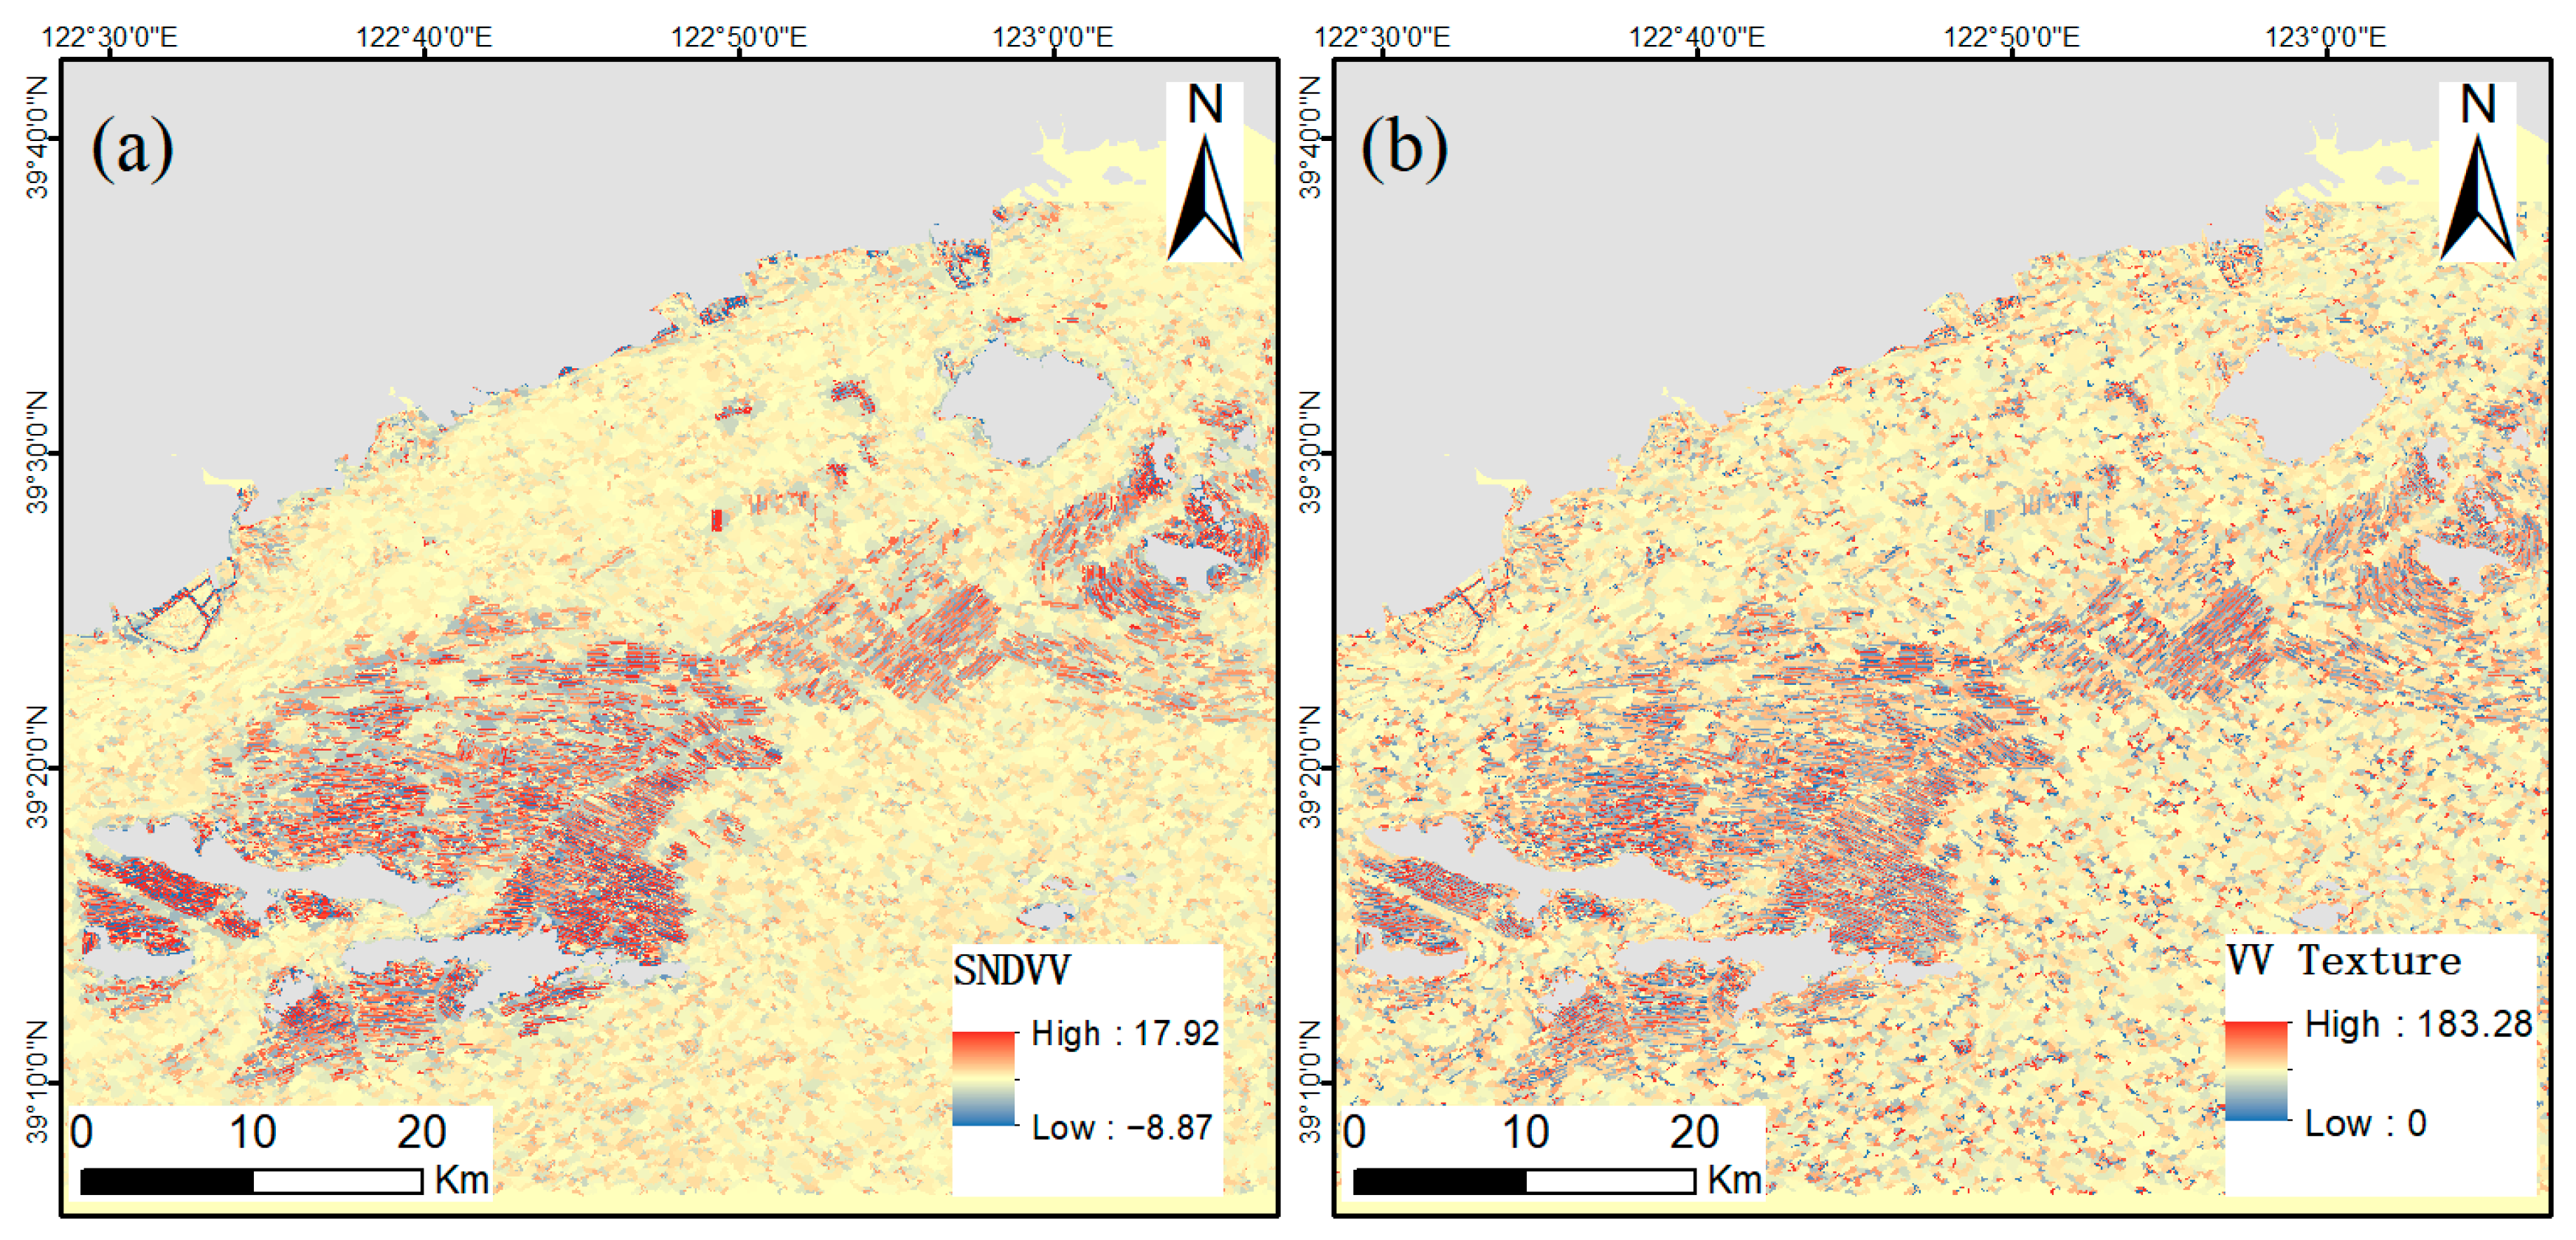
  • Spectral and backscattering neighbor difference feature
Neighborhood analysis combines spectral information with spatial information, and can be used to obtain contextual information about ground objects. The traditional neighborhood analysis method is window analysis, which fails to make full use of the neighborhood relationship between the ground objects. Most ground objects have complex neighborhood relationships. For example, forests may be adjacent to roads farmland, or water. It is difficult to judge the class based on the neighbor relationship of ground object. By comparison, mariculture has a very simple neighborhood relationship. Mariculture floats on the sea and is only adjacent to seawater. From the previous section, we know that the MAI of a mariculture site is always higher than its neighboring seawater area. Due to the limitation of the segmentation scale, the large area of non-culture area seawater will be divided into several small patches of seawater.
The neighborhood neighbor difference feature converts two absolute values into relative values, which could reduce the sea spectral influence due to geographical location. The difference between the MAI of these seawater patches and the MAI of the neighboring seawater is small. Wang [14] also proposed an OBVS-NDVI index to extend the spectral difference between seawater and raft aquaculture. Based on the MAI relative size of these two classes, we propose spectral neighbor difference MAI (SNDMAI).
S N D M A I = 1 L [ i = 1 n L ( P , P i ) × ( P ( M A I ) P i ( M A I ) ) ]
where P is the currently computed patch, Pi is the patch adjacent to computed patch, P(MAI) is the MAI value of P, Pi(MAI) is the MAI value of Pi, L is the length of P, L(P, Pi) is the common edge length of P and adjacent Pi.
For Sentinel-1 images, we calculate the spectral neighbor difference VV (SNDVV) as follows:
S N D V V = 1 L [ i = 1 n L ( P , P i ) × ( P ( V V ) P i ( V V ) ) ]
P(VV) is backscatter coefficient for the VV polarization of P, Pi(VV) is the backscatter coefficient for the VV polarization of Pi.
  • Texture feature
Texture features were used to describe the changes in image gray level. Gray level co-occurrence matrices (GLCMs) are a texture analysis method with a wide range of properties [42,43]. It reflects the information of image direction, interval, and change intensity.
We calculated the GLCM mean of MAI and backscatter coefficient for VV. The window size was set to 3 × 3 and the step size was set to 1. Then, the GLCM average at four angles, namely 0°, 45°, 90°, and 135°, was calculated. The MAI texture reflects the arrangement pattern of auxin, while the backscatter coefficient for the VV texture reflects the arrangement pattern of mariculture. Therefore, we use this neighbor difference feature to distinguish between mariculture and seawater.
  • Geometric feature
Geometric features are widely used in aquaculture extraction [27,52,59]. The shape of raft aquaculture is determined by the floating raft on the water surface. There are industry standards in place for the production of floating rafts; therefore, raft aquaculture has regular geometric features. However, due to the complexity of the ocean, the geometry of seawater patches that are misclassified as potential raft aquaculture has a high degree of uncertainty. We used the compactness feature to describe the compactness of the image object. The tighter the object is, the smaller its borders will be. It is used to distinguish irregular patches of sea. The compactness is calculated by using the following formula:
C o m p a c t n e s s = l e n g t h × w i d t h N p i x e l
where Npixel is the number of pixels of the patch.

2.3.4. Random Forest Classification

Random forest is a machine learning algorithm and is composed of a multitude of decision trees. It is currently one of the most widely used machine learning methods. Due to the proximity of culture area seawater to mariculture, its spectral characteristics are different from that of non-culture seawater. Therefore, the final classification system was developed, which included the following four main categories: raft aquaculture, cage aquaculture, culture area seawater, and seawater in non-culture areas.

2.3.5. Accuracy Assessment

There are 373 verification points in total, accounting for 40% of the total sample points. These samples include 90 cage aquaculture, 130 raft aquaculture, 80 culture area seawater, and 73 non-culture area seawater points. We use the confusion matrix for accuracy assessment. The verification parameters include the producer’s accuracy (PA), user’s accuracy (UA), overall accuracy (OA), and Kappa coefficient, which were calculated to evaluate the effectiveness of our extracted results.

2.3.6. Experiment Design

In this paper, mariculture was extracted using two experiments. (1) Experiment 1 used only Sentinel-2 optical data to test the ability of different optical features in identifying mariculture. (2) Experiment 2 combined Sentinel-2 optical and Sentinel 1 SAR data to test the synergistic effect of both on mariculture extraction. For experiment 1, the feature combination contains MAI, SDNMAI, MAI texture mean, and compactness, while the features combination was added to the VV single-polarized backscatter coefficient, SDNVV, and VV texture mean.
The number of trees for random forest is set to 100, and the classification is based on multi-scale segmentation. Based on the experimental results, the optimal classification scheme was used for extracting the mariculture along the whole Bohai Rim.

3. Results

3.1. Experiment Results

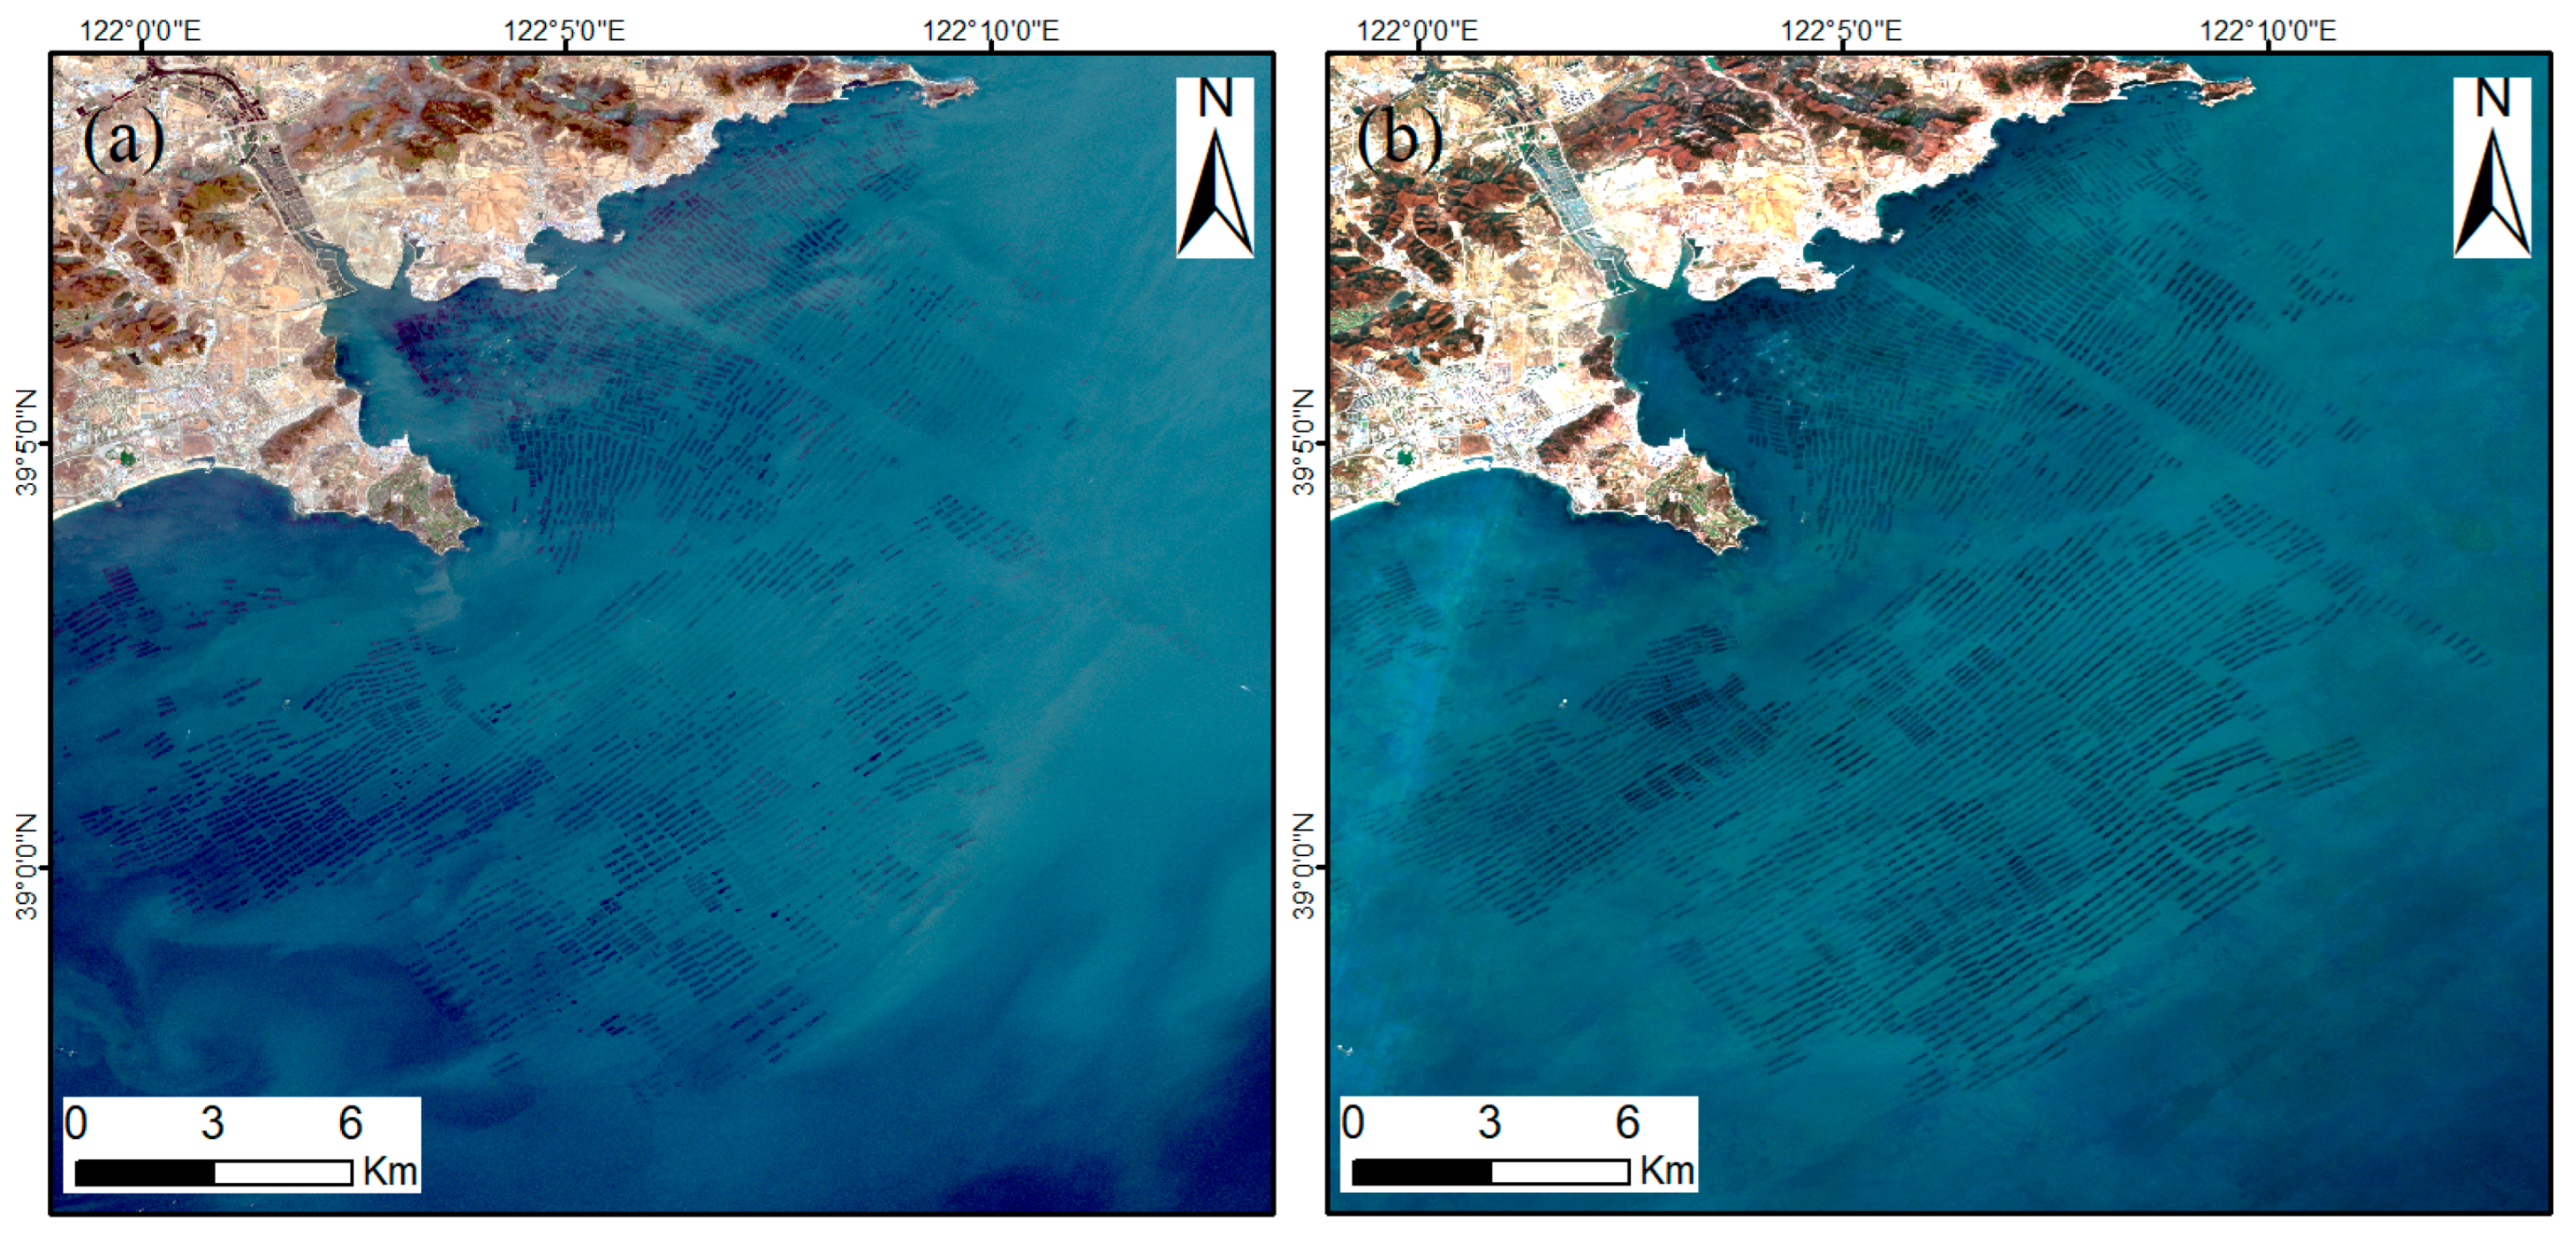
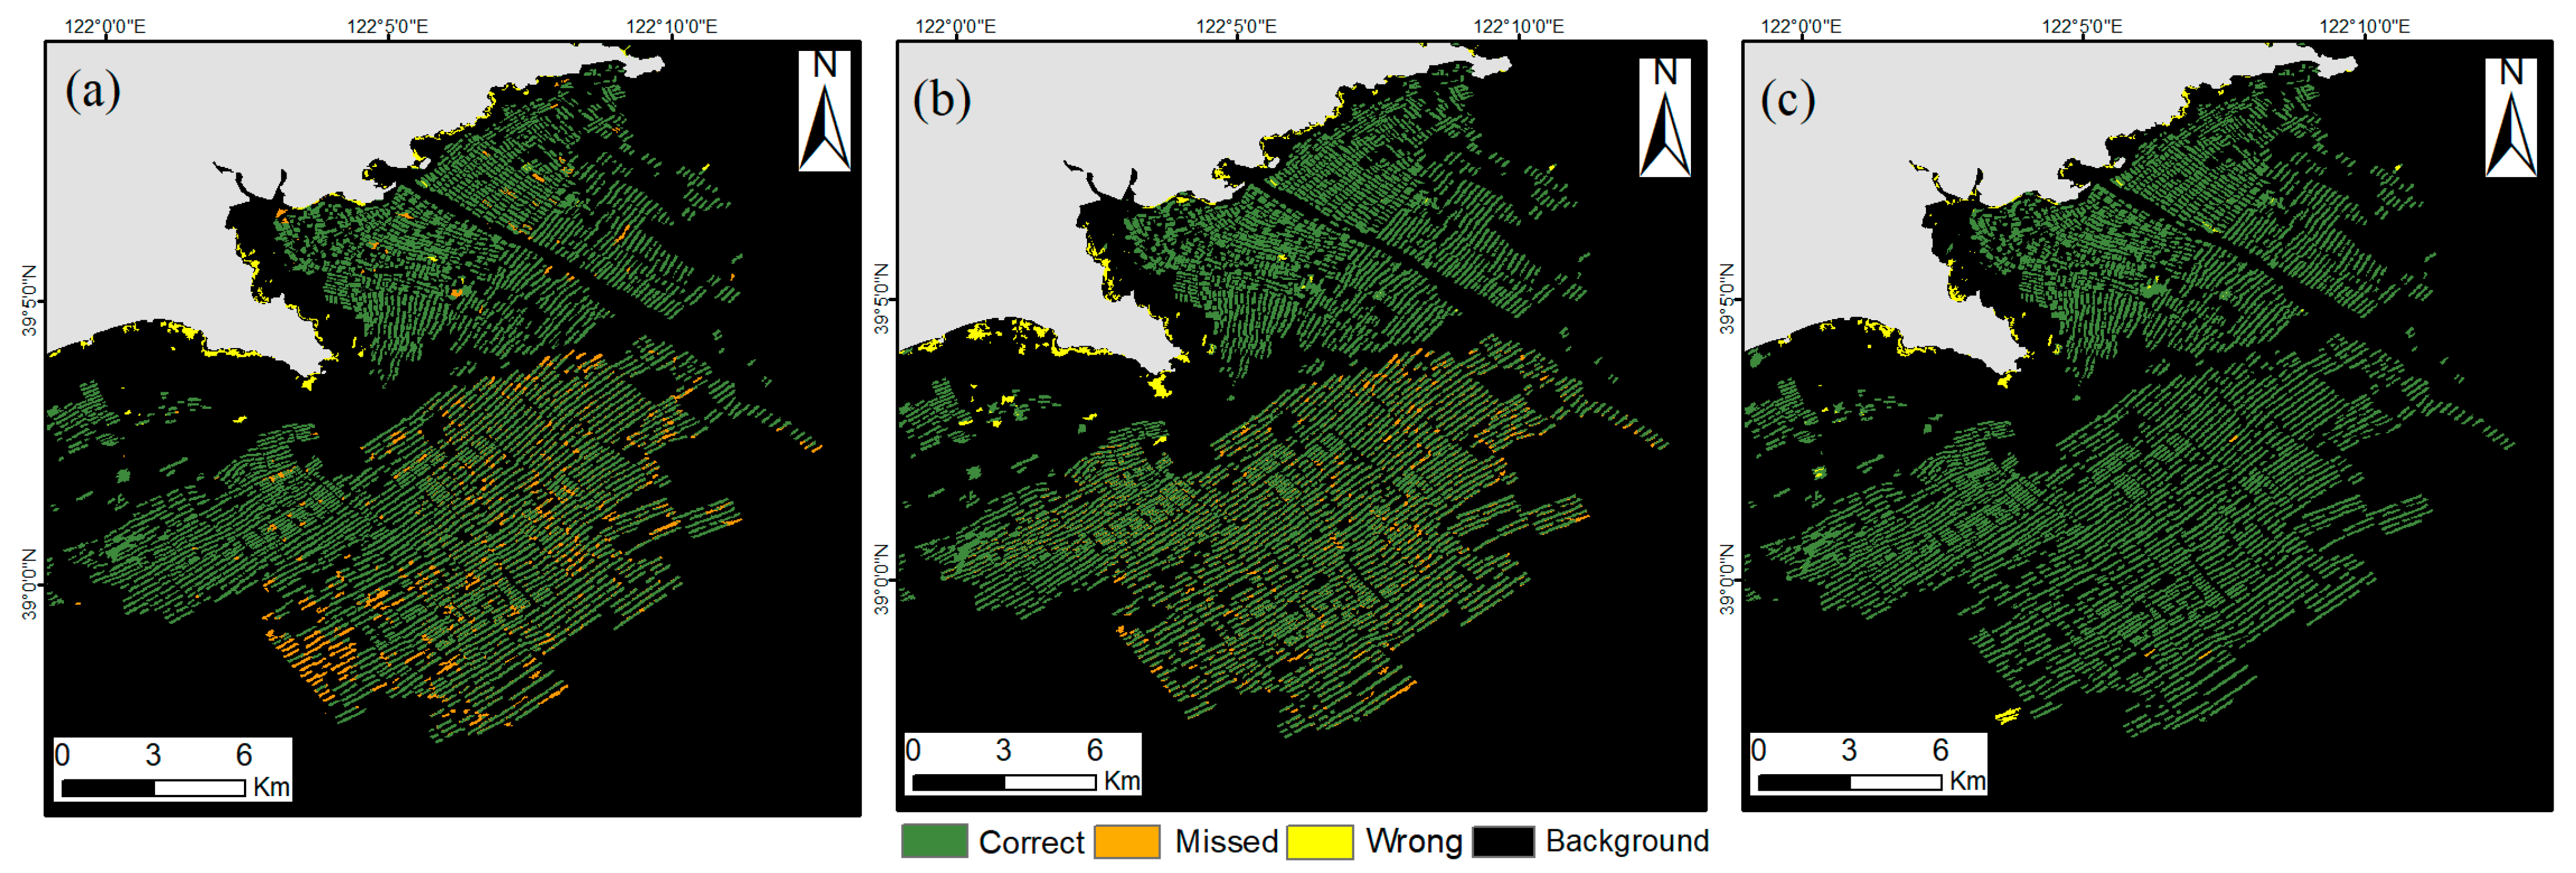
3.1.1. Experiment 1: Sentinel-2 Based Classification Results

  • Test region I
Sentinel-2 features includes MAI, the neighbor difference feature SNDMAI and the MAI texture. We combined the geometric feature compactness with the Sentinel-2 features to form a three classification combination: (1) MAI and SNDMAI; (2) MAI, SNDMAI, and MAI texture; and (3) MAI, SNDMAI, and MAI texture and compactness. The classification results of different feature combinations are shown in Figure 9.
As shown in Figure 9a, the extraction of raft aquaculture leads to a very good result. There are no large seawater or raft aquaculture areas that are misclassified. However, there are still some offshore non-culture area seawater areas misclassified as raft aquaculture. Some raft aquaculture areas were not identified either. In contrast, the missed offshore areas decrease while the number of wrong areas increases after adding texture features (Figure 9b). After adding the geometric feature of compactness, the missed and wrong areas rapidly reduce. Only a small amount of the offshore seawater areas are misclassified as raft aquaculture areas (Figure 9c).
MAI and SNDMAI are able to recognize raft aquaculture well. Texture features improve the recognition accuracy of raft aquaculture and neighboring seawater, and the geometric feature improves the accuracy of non-culture area seawater.
  • Test region II
Similarly, we conducted mariculture extraction based on Sentinel-2 data in the test region II Zhuanghe City. In contrast to test region I, which has algal rafting, test region II has algal rafting and shellfish rafting.
From Figure 10, we find that even after the median synthesis, the difference in reflectance between seawater in the optical image is still large, while the difference between small area seawater and raft aquaculture is not obvious. Only a part of raft aquaculture is observed in the Sentinel-2 median image.
To test the extraction effect of Sentinel-2 in test region II, three different feature combinations were used for mariculture extraction (Figure 11). With the addition of texture features and geometric features, the classification accuracy is improved. The wrong area is gradually reduced while the missed area remains unchanged. However, no matter how many features are added, the wrong and missed area is large. The classification results only correctly identified the raft aquaculture around the western islands.
The results indicate that Sentinel-2 data alone cannot identify all the raft aquaculture area in test region II.

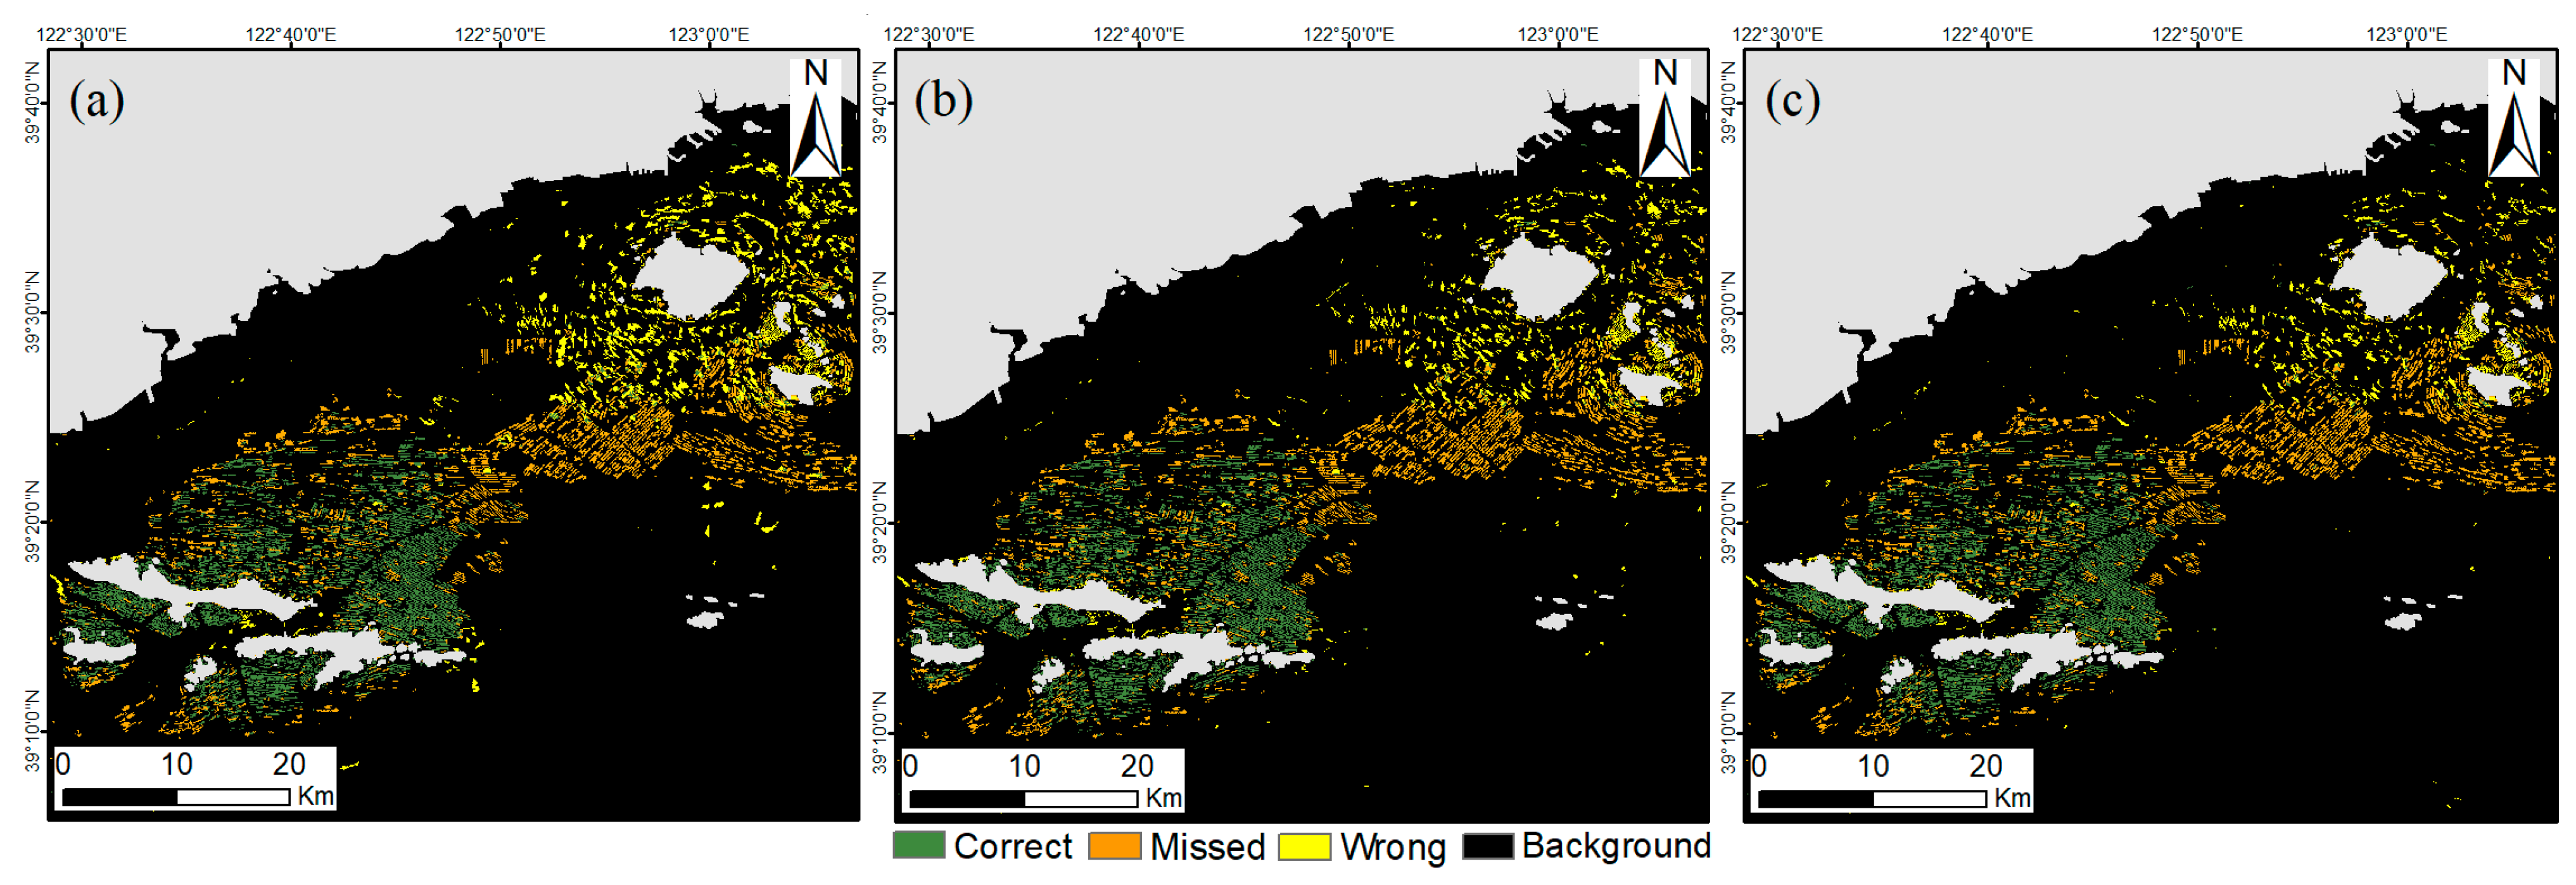
3.1.2. Experiment 2: Synergistic Use of Sentinel-1 and Sentinel-2 Classification Results

We used both optical and radar data to extract the information on mariculture for both experimental regions. Test region II is taken as an example to show the SNDVV and texture features of Sentinel-1 (Figure 12). Both SNDVV and VV textures highlight mariculture. In comparison, due to the effect of scatter noise in the VV images, there are a considerable amount of small areas of seawater and raft aquaculture with similar values in VV textures. Sentinel-1’s neighborhood difference feature of SNDVV works better than texture feature in mariculture recognition.
By using a combination of the optical features of MAI, SDNMAI, MAI texture, and compactness, and SAR features of VV, SDNVV, and VV texture, the random forest algorithm was applied to obtain the mariculture results in the two test areas (Figure 13).
In Figure 13a, the inclusion of Sentinel-1 images reduces the amount of incorrect offshore areas to some extent. However, in general, the classification results do not change much with the addition of Sentinel-1.
In Figure 13b, the classification results of Sentinel-1 and Sentinel-2 include almost all raft areas. Compared with Figure 11c, nearly all missed areas are correctly classified and the number of wrong areas is reduced. The accuracy of raft aquaculture classification with Sentinel-1 and Sentinel-2 was much higher than that of the Sentinel-2 classification results. In test region II, the inclusion of Sentinel-1 produced a significant improvement in the classification results, and many raft aquaculture areas that could not be seen in the Sentinel-2 images appeared.

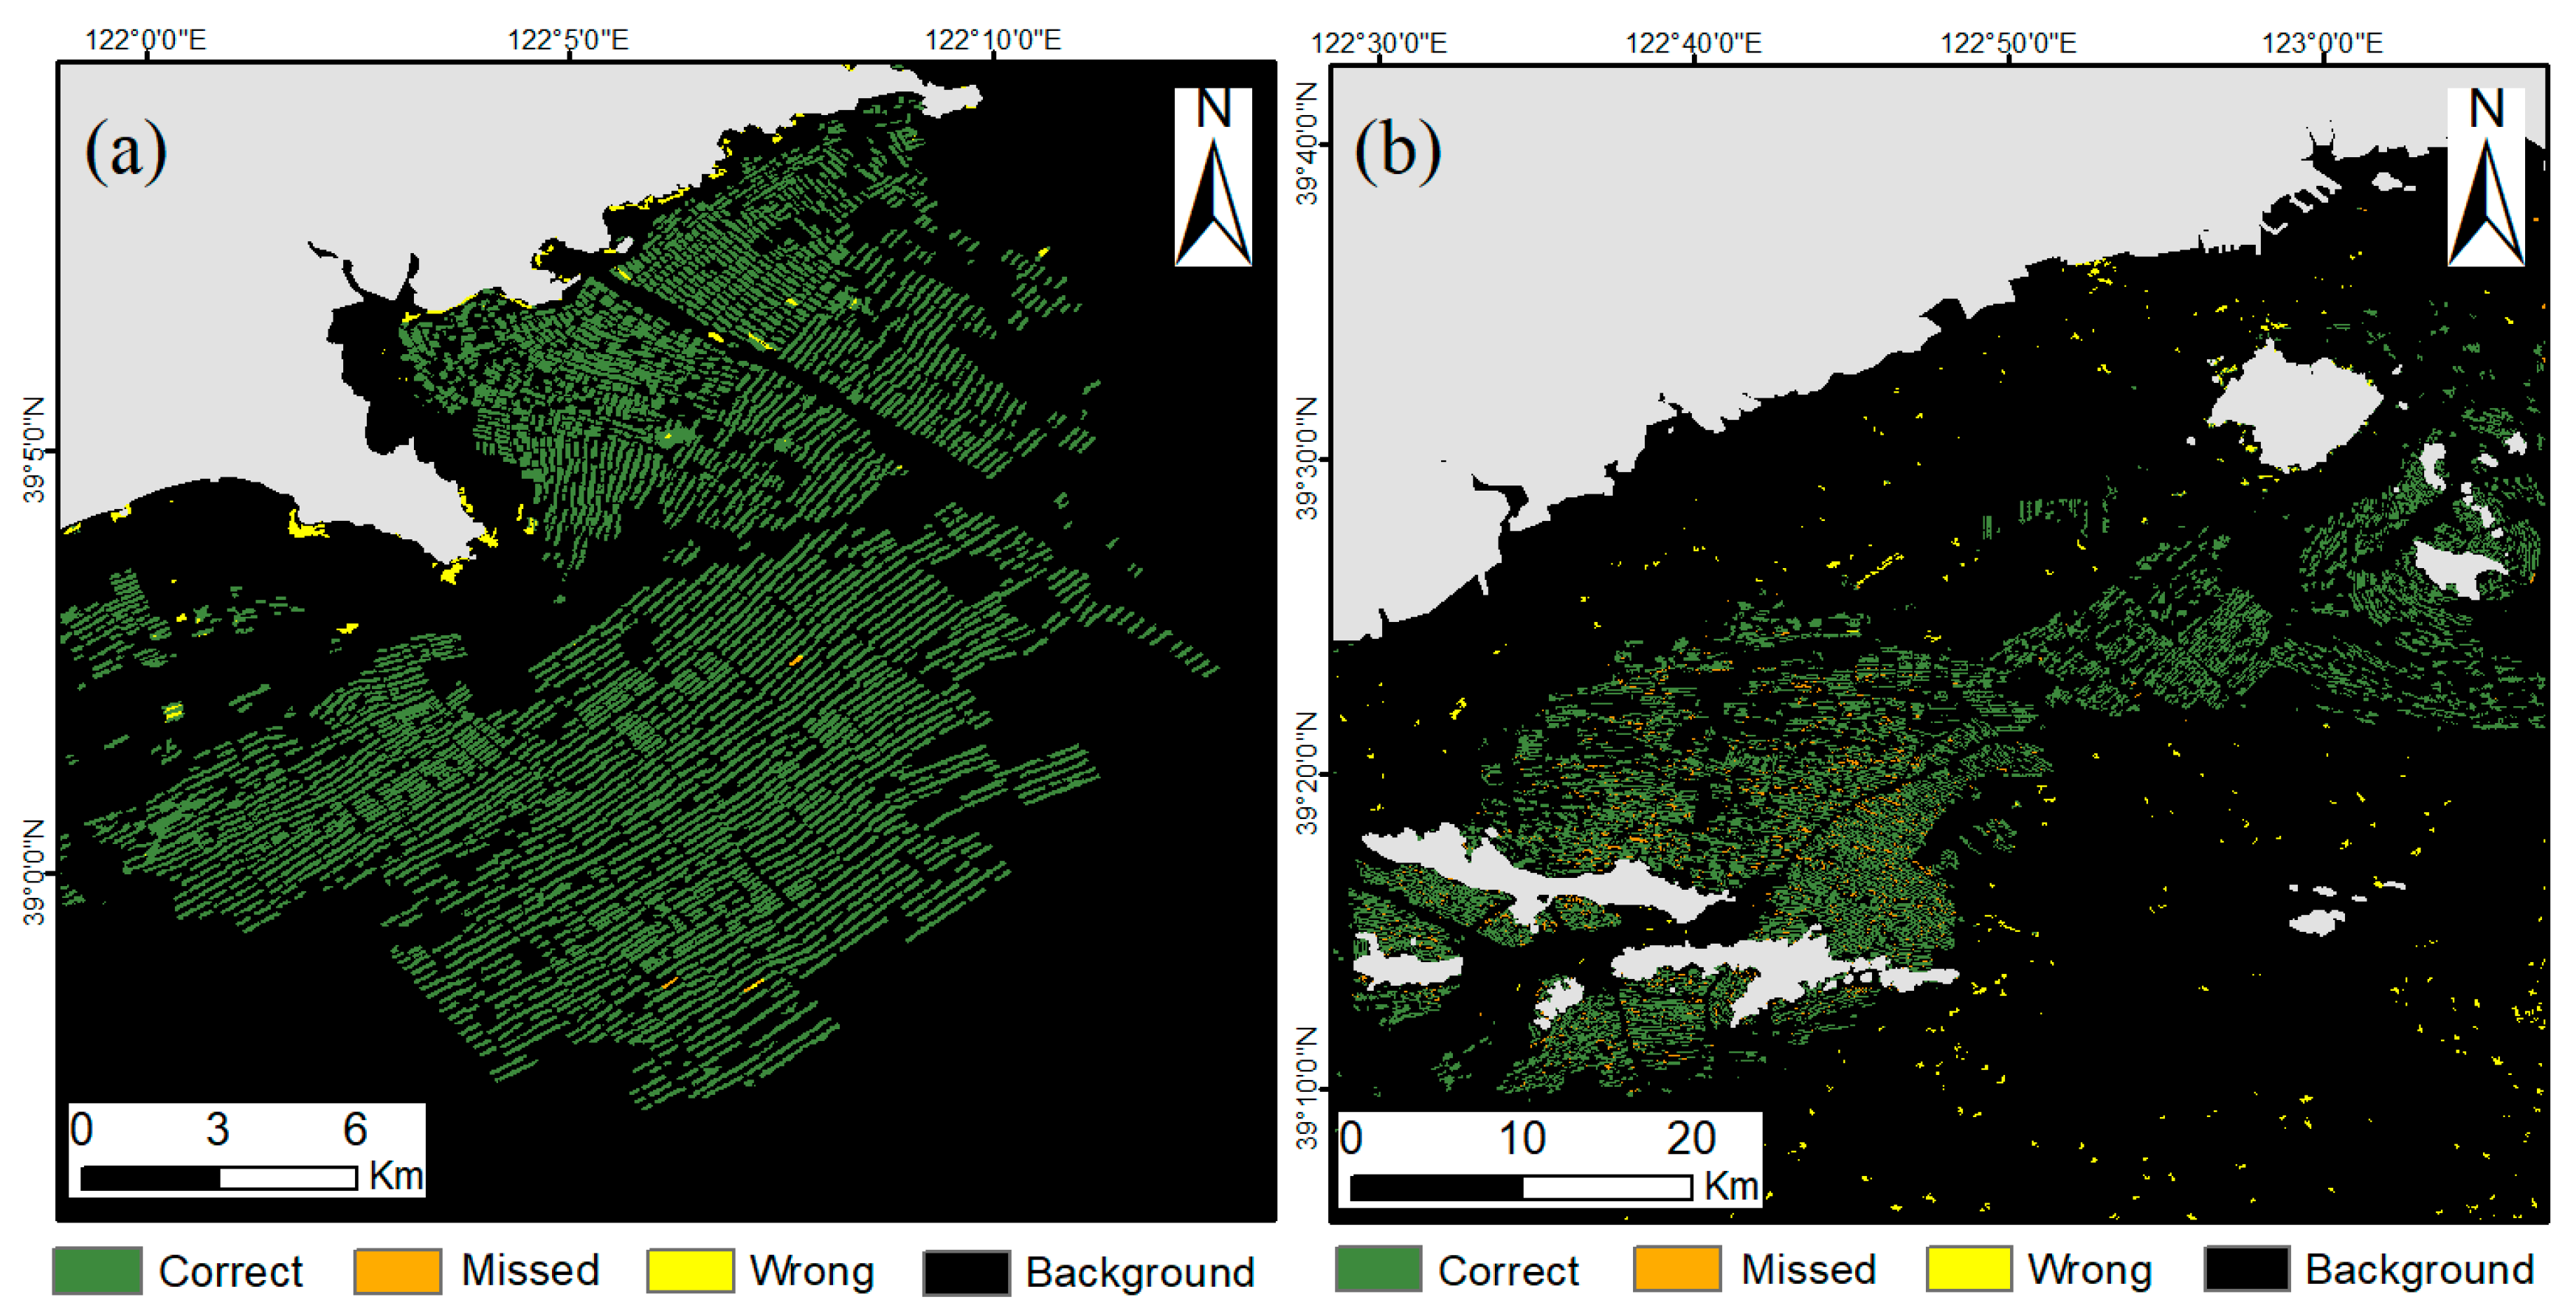
3.2. Accuracy Assessment

The confusion matrix was calculated based on 373 samples, and the results are shown in Table 1. It is indicated that the overall accuracy of classification reached 94.10% and the Kappa coefficient reached 0.91. The producer’s accuracy of raft aquaculture is 93.33% and user’s accuracy is 95.45%. The classification accuracy of cage aquaculture was higher than raft aquaculture. The producer’s accuracy of raft aquaculture was 93.33% and the user’s accuracy was 95.45%.

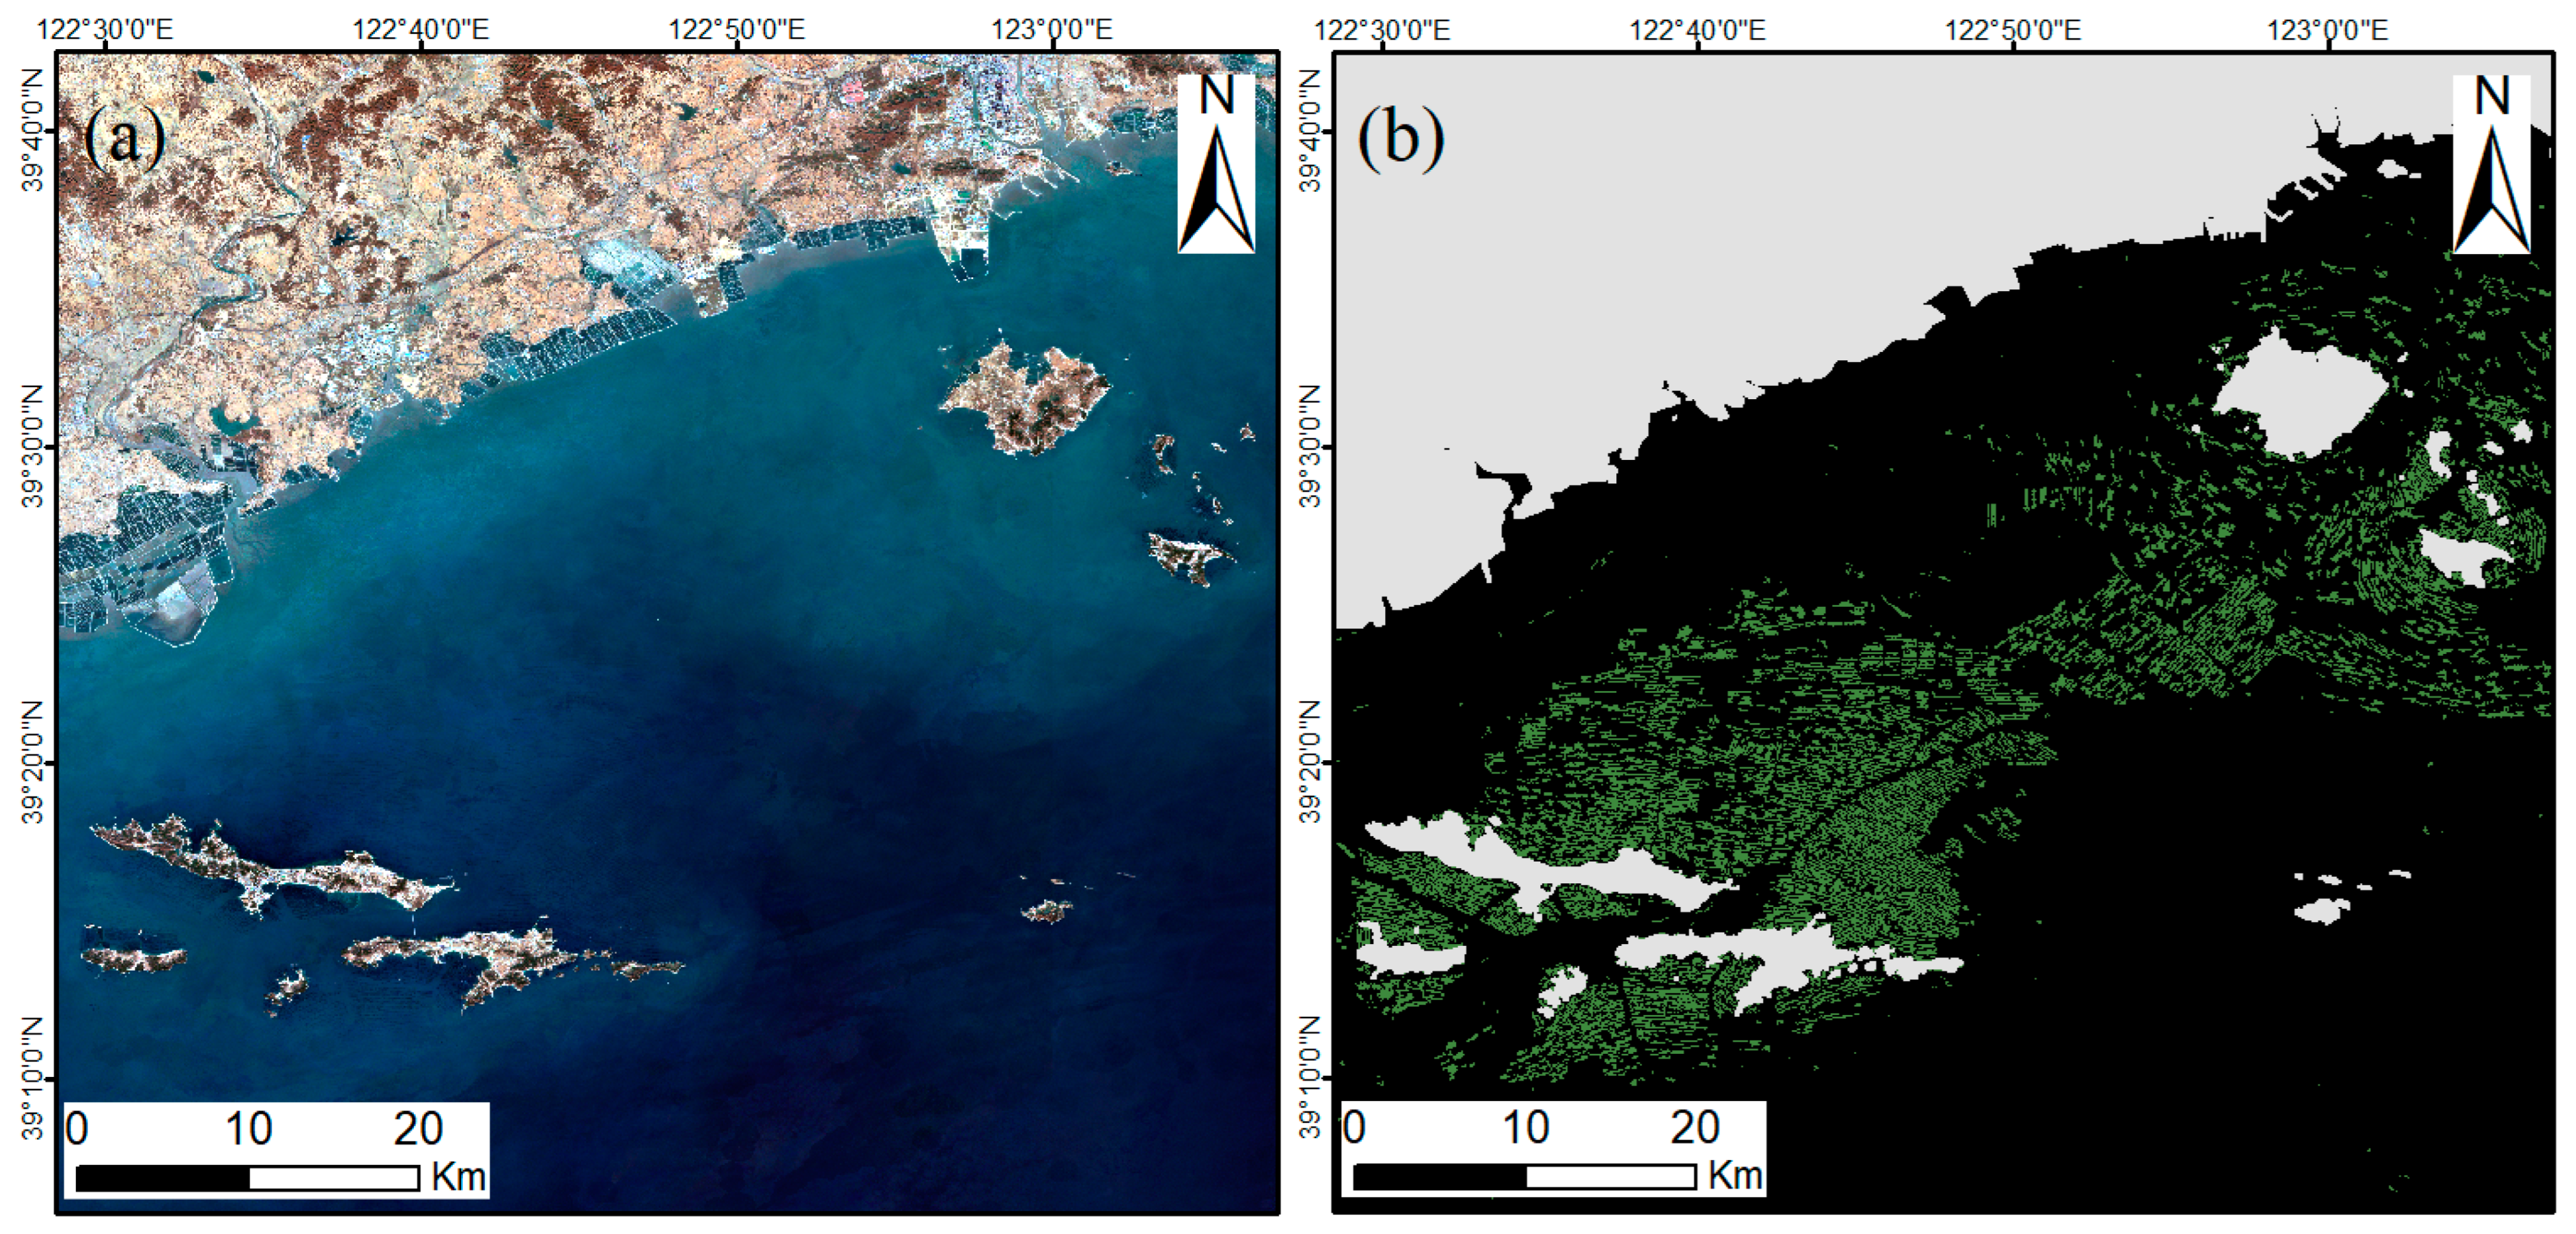
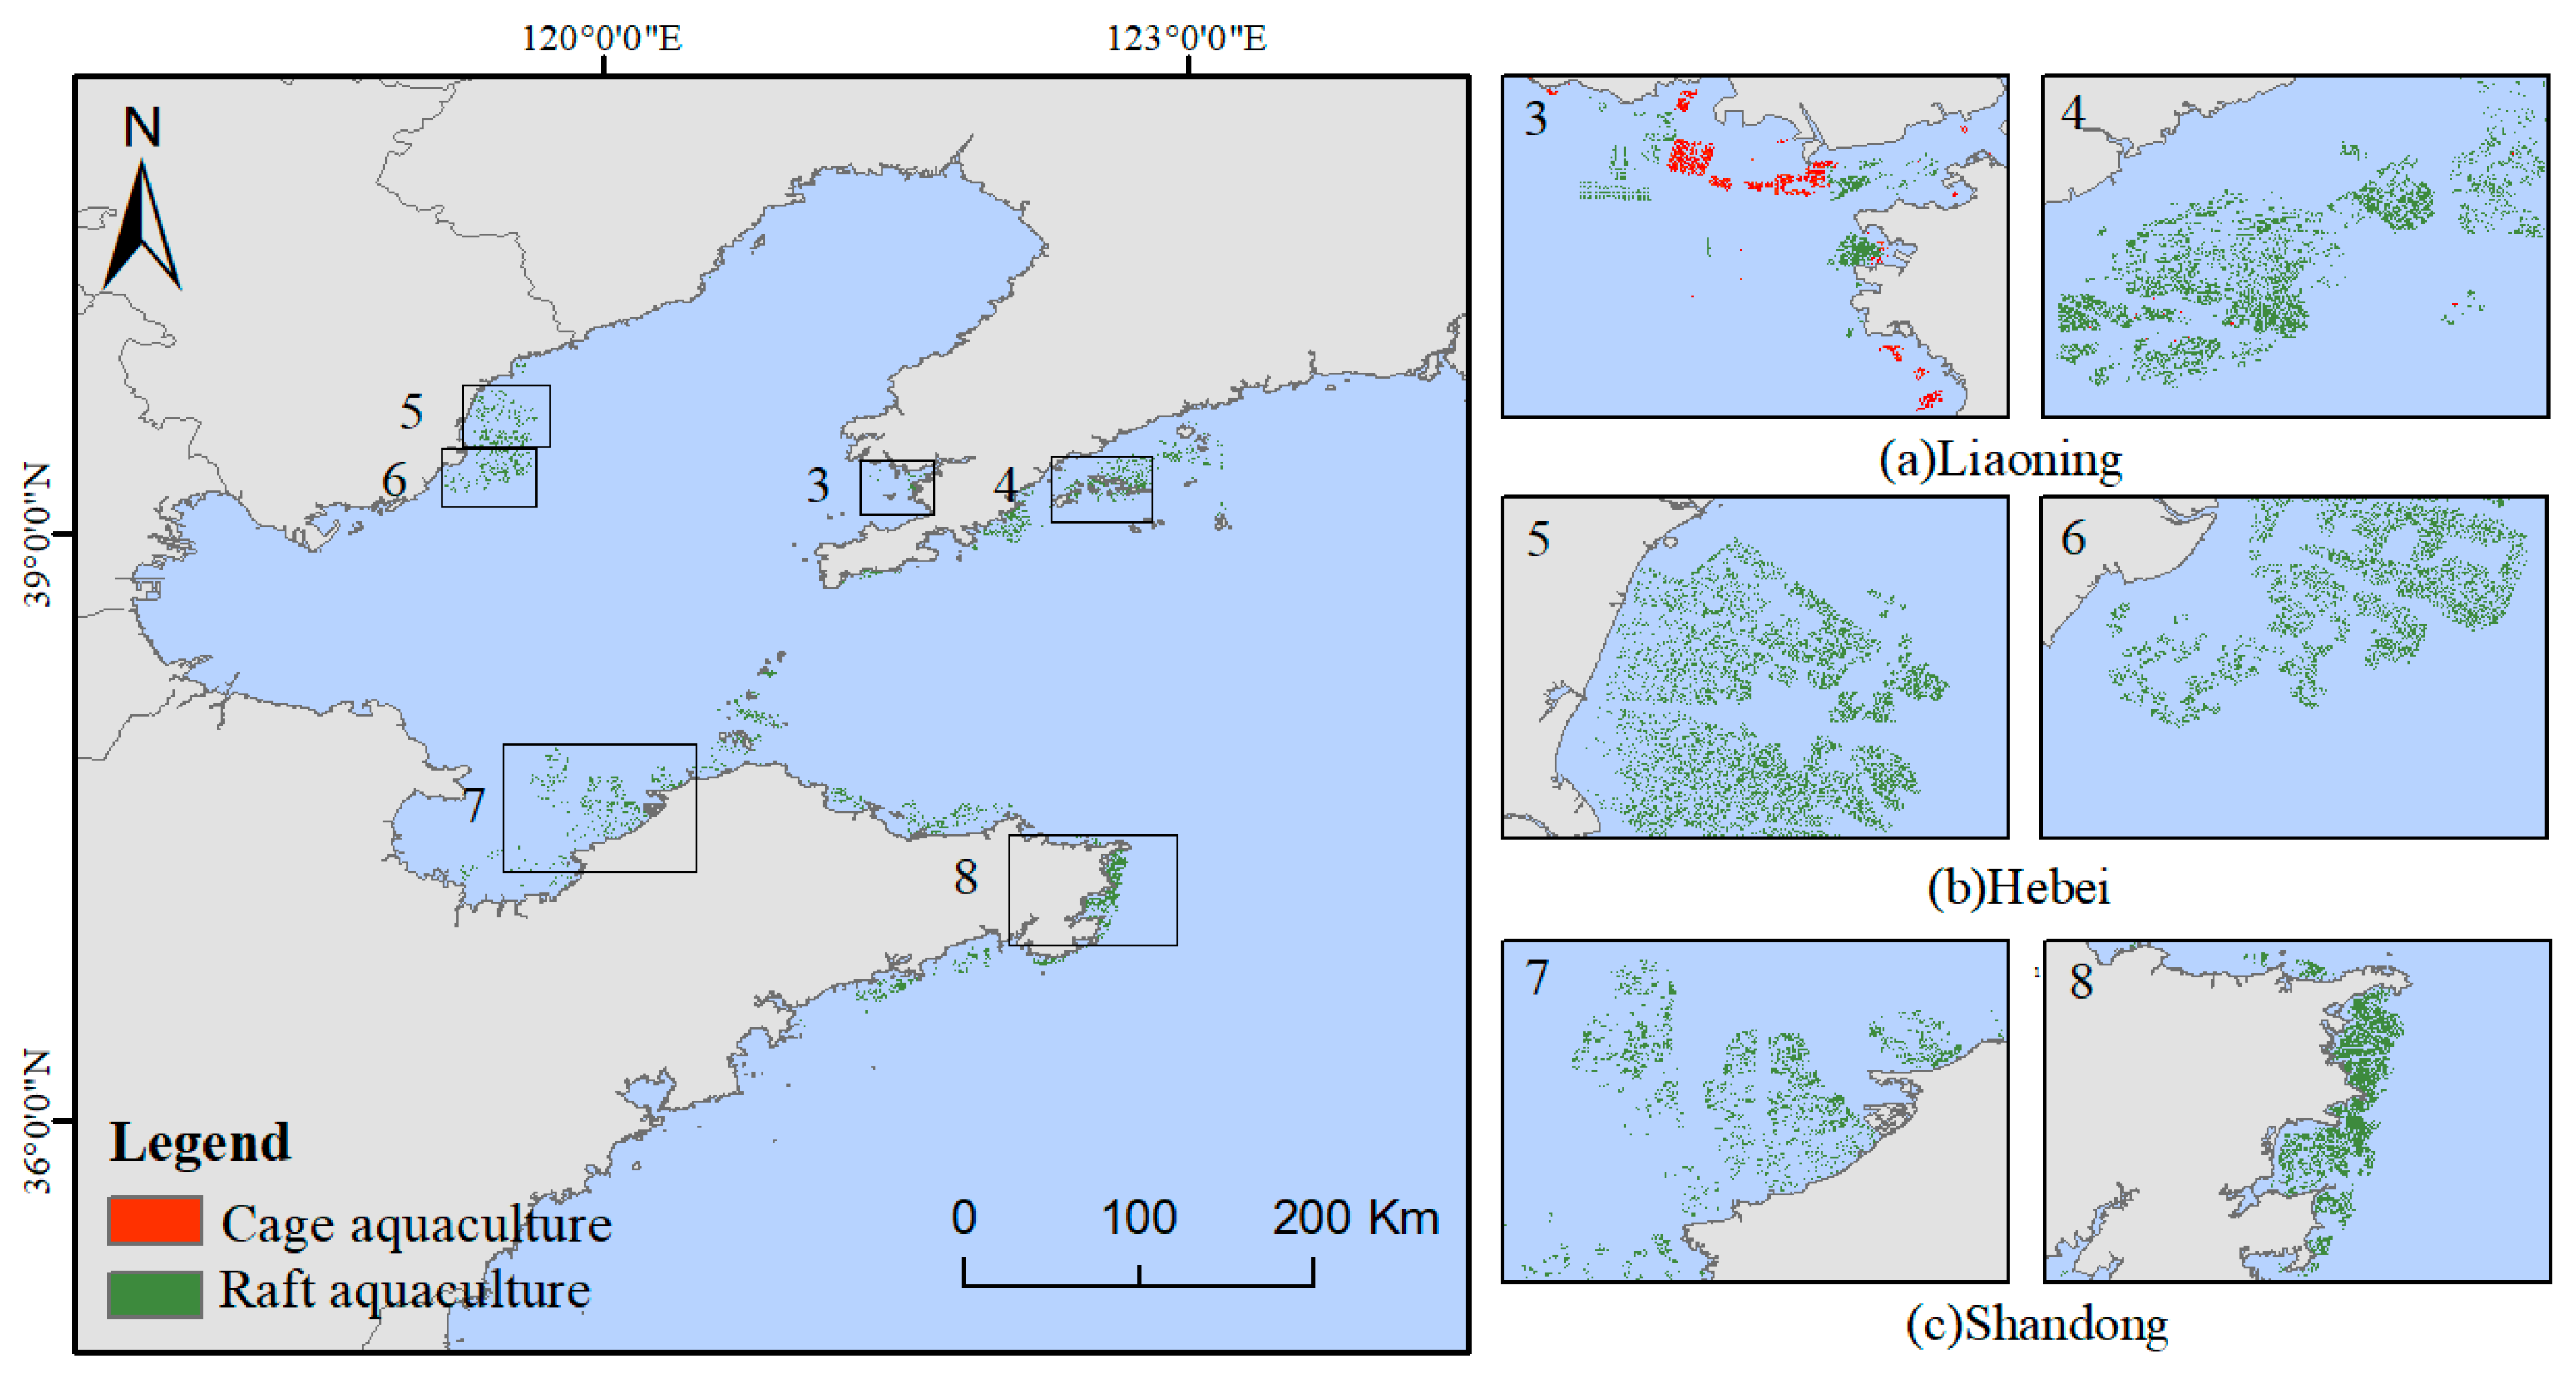
3.3. Spatial Distribution of Mariculture around Bohai Sea

Based on the optimal remote sensing classification scheme of Experiment 2, we realized mariculture extraction in the Bohai Rim. From the distribution of mariculture in 2020 (Figure 14), it is obtained that mariculture is mostly distributed in offshore areas and near islands within 30 km of the coastline. It has an obvious trend of concentrated distribution. The area of mariculture in the Yellow Sea is much higher than in the Bohai Sea. The total area of mariculture is 1224.60 km2. In total, the area of cage aquaculture is 16.89 km2 and the area of raft aquaculture is 1206.71 km2.
Mariculture was found to be mainly distributed in the three provinces of eastern Liaoning, northern Hebei, and eastern Shandong in the Bohai Rim (Figure 14).
According to the main culture breed, mariculture in the Liaoning Province is divided by the old Tieshan Cape into Liaodong Bay and the northern Yellow Sea (NYS) (Figure 14a). Most mariculture was distributed in NYS, with a large number of raft aquaculture areas. It is dominated by a bedrock shoreline with extensive tidal flats and located at the junction of the Yellow and Bohai Rims. Mariculture in Liaodong Bay is concentrated near Wafangdian and Changxing island, with mainly cage aquaculture. The cage aquaculture is distributed in and around aquaculture ponds which belong to a sandy coast with wide tidal flats.
Mariculture in Hebei province is mainly concentrated in the northern part of the Luanhe River estuary area (Figure 14b), with only raft aquaculture. The sediment and nutrients carried by the Luanhe River provide sufficient food for shellfish.
Shandong Province has a well-developed mariculture industry. Mariculture is mainly raft aquaculture and litter cage aquaculture. Raft aquaculture is concentrated in Yantai City and Weihai City (Figure 14c), while cage aquaculture distribution is evident in the south of Qingdao and east of Yantai. The Yellow River transports a large amount of nutrients and plankton to provide sufficient food for shellfish. Therefore, shellfish and algae raft aquaculture are very well developed.

4. Discussion

4.1. Advantages of Optical Remote Sensing Spectral Index Features

Today, many studies can be found that are based on optical remote sensing spectral index features for the extraction of mariculture. Xu [60] found that NDVI, NDWI, and NDBI could better highlight the differences between aquaculture areas and seawater. However, seawater is unstable, the sea surface is rippled, and the average brightness varies. NDWI is easily affected by sea wind and waves. Algae raft aquaculture is a type of raft aquaculture. Many studies have used NDVI for raft aquaculture extraction due to the fact that algae contain chlorophyll. Wang [19] proposed an object-based visually salient NDVI (OBVS-NDVI) feature, which has a higher accuracy than NDVI alone. However, the actual NDVI of mariculture and seawater was similar (Figure 6b), meaning that OBVS-NDVI may not play an important role. Moreover, there is a large amount of plankton living in seawater. Planktons also contain chlorophyll, which leads to a higher NDVI in seawater without raft aquaculture.
Except for chlorophyll, algae plants contain other auxiliary pigments, which are physiologically active chemicals that are good at absorbing blue and green light. These pigments absorb blue and green light for algae, such as phycocyanobilin in kelp and phycoerythrobilin in seaweed. Therefore, the reflectance of aquatic algae in the blue band and green band is lower than that of the surrounding seawater. In contrast, the red band, Red Edge, NIR, and other bands are less affected by algae. Thus, based on the bands of blue, green, and red, the proposed new spectral index of MAI could reduce the spectral complexity of seawater and enhance the difference between raft aquaculture and seawater.
Furthermore, the spectral neighbor difference feature is proposed to further emphasizes the difference between mariculture and seawater. Given the specificity of mariculture neighborhood relations, the SNDMAI of seawater is always higher than that of raft aquaculture, and the MAI texture of seawater is always smaller than that of the raft aquaculture. The texture of SNDMAI and MAI reveals the difference between raft aquaculture and sea. Furthermore, some non-culture seawater areas with a low MAI also tend to be identified as seawater features according to SNDMAI and MAI texture (Figure 15). Thus, SNDMAI and MAI are of benefit to raft aquaculture identification, and these techniques improve the extraction accuracy.
Aside from the widely used indices, some indices were proposed specifically for mariculture. Hou [38] proposed a hyperspectral index (HSI-FRA) based on ZY1-02D satellites. However, HSI-FRA involves a constant parameter, which needs to be determined by experiments. It increases the uncertainty of exponents. Compared with HSI-FRA, MAI is a fixed, simple but effective index which solves the classification problem of raft aquaculture, and has stronger applicability.

4.2. The Function of Sentinel-1 and Sentinel-2

To explore the role of synergistic Sentinel-1 and Sentinel-2 data in the image segmentation and mariculture classification process, the areas with large differences between the two experiments (only Sentinel-2, and synergistic integration of Sentinel-1 and Sentinel-2) in test area II of Zhuanghe City were selected. The results (Figure 16) of multi-scale segmentations show that optical images alone cannot segment all raft aquaculture, some rafted aquaculture elements are segmented into a patch with seawater elements, and incorrectly segmented raft aquaculture will also be misclassified. The results indicated that some raft aquaculture cannot be imaged in the optical Sentinel-2 image (Figure 16a). However, after adding Sentinel-1 imagery, these raft aquacultures can be segmented and classified correctly (Figure 16b). There are three main reasons for this, which are detailed below.
(1) The impact of clouds. Sentinel-2 is an optical satellite influenced by cloud distribution. Cloudy weather is not conducive to obtaining complete information.
(2) The impact of raft aquaculture types. According to culture production, raft aquaculture is classified as algae raft aquaculture and shellfish raft aquaculture. Algae raft aquaculture can be imaged because it floats on the surface and has plant properties. Compared with algal raft aquaculture, shellfish in shellfish raft aquaculture have a deeper water level of about 3–10 m. There are no suspended substances in the water. Therefore, shellfish raft aquaculture is difficult to identify using optical images.
(3) The impact of imaging principles of optical and radar images. Sentinel-1 belongs to radar satellites with a strong penetrating power. The penetration distance of radar satellite electromagnetic waves is about 3–10 m in seawater at −2–30 °C, and the data can be obtained regardless of the weather. The backscattering characteristics are sensitive to the roughness and structure of the water. The roughness of the floating body of algal raft aquaculture and shellfish raft aquaculture above the water surface and the seawater differ greatly [14], so the backscattering coefficients of algal raft aquaculture, shellfish raft aquaculture, and seawater are somewhat different [61]. In summary, Sentinel-1 can identify shellfish raft aquaculture and algal raft aquaculture, which makes up for the deficiency of optical remote sensing and improves the accuracy of raft aquaculture classification.
The combination of optical and SAR data in mariculture identification has become an important means of mariculture classification. Andrey [39] developed a new method for automatically mapping aquaculture structures in coastal areas based on Sentinel-1 and Sentinel-2 data. Cheng [62] mapped mariculture along the Jiangsu coast of China based on Sentinel-1 and Sentinel-2 data using random forest. However, SAR data were applied for one band and in the form of single echo information, meaning only a limited amount of information about ground objects was obtained. The backscatter coefficient of individual cage aquaculture, shellfish raft aquaculture, and algal raft aquaculture is similar. For this reason, we added SDNDVV and VV texture features to further enhance the extraction accuracy of raft aquaculture.
Due to cloud interference, we were unable to determine the type of raft aquaculture that Sentinel-1 can identify but Sentinel-2 cannot. We plan to find a way to classify different types of raft aquaculture in the future.

4.3. Comparison with Other Aquaculture Data

In recent years, mariculture in the Bohai Sea Rim has developed rapidly, and the mariculture production in the Bohai Sea Rim reached 7.97 million tons in 2020, so it is important to have timely information on aquaculture. In this study, the current status of aquaculture in the Bohai Rim was mapped in collaboration with Sentinel-2 and Sentinel-1 data.
We compared our data with the data provided in the statistic yearbook, as shown in Table 2. The mariculture area we extracted reached 1223.60 km2, which is smaller than the area in the statistical yearbook of 1961.91 km2. The main reason is that the raft aquaculture statistical standards are different. The area of raft aquaculture we extracted is based on pixels and resolution. However, the measurement of the area included in the yearbook did not adhere to a strict standard. The current estimation method of mariculture has limitations. Raft aquaculture mostly uses seedling rope as the statistical standard. A 1000 m seedling rope is counted as 1 acre of culture water. According to field surveys, except for purple cabbage, the seedling rope estimation method leads to a larger culture statistical area than the actual situation. For example, the statistical area of wakame is 1.8 times the actual area [63]. Therefore, the yearbook statistics of mariculture are much larger than the actual data. Aquaculture on the same parcel might even have three times the area difference according to a different standard [31]. The statistical error led to a difference between our results and the statistical data. In addition, some shellfish aquaculture may not be extracted. Because of the seasonality of raft aquaculture growth and noise of Sentinel-1, a number of shellfish aquaculture cannot be seen in the Sentinel-1 median image. For cage aquaculture, the mariculture area we extracted is larger than the area in the statistical yearbook. We used a shoreline dataset provided by IGSNRR to determine whether it is mariculture or not. The local bureaus classify some offshore cage aquaculture located in aquaculture ponds as land culture. This makes the area of cage aquaculture larger than the yearbook data analyzed in this study.
The mariculture area we extracted is larger than the area described in the 2018 mariculture data [45] (Table 2). The difference between the two is only 1.22 km2 for raft aquaculture in Hebei province, but the difference reaches 274.29 km2 and 293.06 km2 for raft aquaculture in the Liaoning and Shandong provinces. This is because the remote sensing data sources are different. To collect mariculture data, Liu [45] only used Landsat 8 optical images, whereas our research uses both optical and radar images, which can identify more shellfish raft aquaculture areas; thus, our raft aquaculture area is larger. The addition of radar data extracts more marine organisms and significantly improves the identification accuracy of raft aquaculture in Liaoning and Shandong provinces, which are important shellfish culture bases in China. In addition, the continuous expansion of mariculture is also the reason for the large difference between our 2020 results and 2018 comparison data on mariculture area.

4.4. Limitations

In this study, a new method is proposed for large area mariculture area mapping. However, some issues should be further addressed. First, MAI still has some problems. First, the distinction between cage aquaculture and raft aquaculture was poor. Therefore, MAI still has room for improvement, and the application of the NIR band in mariculture deserves further exploration. Second, mariculture in this study is divided into two categories: cage aquaculture and raft aquaculture. Among them, the raft aquaculture we extracted is mostly algae raft aquaculture, and the extraction of shellfish raft aquaculture needs to be studied in depth. This study only obtains the mariculture map for 2020, which is not sufficient for further applications. The long-term spatial and temporal variation of mariculture and its impact on agriculture, the economy, and ecosystems are analyzed by using satellite observation data of a long time series, so as to provide informed suggestions for the sustainable development of the study area.

5. Conclusions

By performing the synergistic integration of time series Sentinel-1 and Sentinel-2 satellite data, an approach was proposed for mapping mariculture by using the random forest algorithm. The conclusions of the study are as follows.
  • A new optical spectral index of MAI was proposed for extracting the mariculture area. Compared to the traditional NDVI and NDWI, it was concluded that MAI can increase the difference between raft aquaculture and seawater. The extraction of raft aquaculture can be improved to some extent by constructing combinations of the features of MAI, SNDMAI, MAI texture, and compactness.
  • By combining optical and SAR features, the random forest algorithm was applied to achieve the extraction of mariculture. In general, the classification of raft aquaculture can be improved by incorporating Sentinel-1 images to reduce the misclassification area of offshore mariculture to some extent.
  • Based on the optical and SAR data of Sentinel satellites, the mariculture area in the Bohai Sea Rim was extracted by combining the proposed mariculture method. The overall accuracy of mariculture extraction in the Bohai Rim is 94.10%, and the kappa coefficient is 0.91. The mariculture area of the Bohai Sea Rim is 1224.6 km2. In total, 16.89 km2 of the cage aquaculture is mainly distributed near the Wafangdian and Changxing islands in Liaodong Bay, and 1206.71 km2 of the raft aquaculture is mainly distributed in the North Yellow Sea region, specifically the eastern part of Liaoning Province, northern Hebei, and the eastern Shandong region.

Author Contributions

Conceptualization, C.H., S.W. and H.L.; methodology, S.W. and H.L.; data curation, S.W.; writing—original draft preparation, S.W. and H.L.; writing—review and editing, C.H., H.L. and Q.L.; supervision, C.H. and Q.L.; project administration, C.H.; funding acquisition, C.H. All authors have read and agreed to the published version of the manuscript.

Funding

This study was supported by the Science and Technology Basic Resources Investigation Program of China (2021FY101003), the Strategic Priority Research Program of the Chinese Academyof Sciences (XDA23050101), the Key Project of Innovation LREIS (KPI001), and Youth Project of Innovation LREIS (YPI004).

Data Availability Statement

Not applicable.

Acknowledgments

We acknowledge all who contributed to data collection, processing and review, as well as the constructive and insightful comments made by the editor and anonymous reviewers.

Conflicts of Interest

The authors declare no conflict of interest.

References

  1. Li, B.; Gong, A.; Chen, Z.; Pan, X.; Li, L.; Li, J.; Bao, W. An Object-Oriented Method for Extracting Single-Object Aquaculture Ponds from 10 m Resolution Sentinel-2 Images on Google Earth Engine. Remote Sens. 2023, 15, 856. [Google Scholar] [CrossRef]
  2. FAO. The State of World Fisheries and Aquaculture 2022. Towards Blue Transformation; FAO: Rome, Italy, 2022. [Google Scholar]
  3. Wang, Z.; Zhang, J.; Yang, X.; Huang, C.; Su, F.; Liu, X.; Liu, Y.; Zhang, Y. Global mapping of the landside clustering of aquaculture ponds from dense time-series 10 m Sentinel-2 images on Google Earth Engine. Int. J. Appl. Earth Obs. Geoinf. 2022, 115, 103100. [Google Scholar] [CrossRef]
  4. Wang, L.; Li, Y.; Zhang, D.; Liu, Z. Extraction of Aquaculture Pond Region in Coastal Waters of Southeast China Based on Spectral Features and Spatial Convolution. Water 2022, 14, 2089. [Google Scholar] [CrossRef]
  5. Bureau of Fisheries, Ministry of Agriculture and Rural Affairs. China Fishery Statistical Yearbook 2021; China Agriculture Press: Beijing, China, 2021. [Google Scholar]
  6. Bureau of Fisheries, Ministry of Agriculture and Rural Affairs. China Fisheries Statistical Yearbook 2012; China Agriculture Press: Beijing, China, 2012. [Google Scholar]
  7. Nguyen, T.T.; Némery, J.; Gratiot, N.; Strady, E.; Tran, V.Q.; Nguyen, A.T.; Aimé, J.; Peyne, A. Nutrient dynamics and eutrophication assessment in the tropical river system of Saigon–Dongnai (southern Vietnam). Sci. Total Environ. 2019, 653, 370–383. [Google Scholar] [CrossRef]
  8. Racine, P.; Marley, A.; Froehlich, H.E.; Gaines, S.D.; Ladner, I.; MacAdam-Somer, I.; Bradley, D. A case for seaweed aquaculture inclusion in US nutrient pollution management. Mar. Policy 2021, 129, 104506. [Google Scholar] [CrossRef]
  9. Rajitha, K.; Mukherjee, C.; Chandran, R.V. Applications of remote sensing and GIS for sustainable management of shrimp culture in India. Aquac. Eng. 2007, 36, 1–17. [Google Scholar] [CrossRef]
  10. Ayisi, C.L.; Apraku, A. The Use of Remote Sensing and GIS in Aquaculture: Recent Advances and Future Opportunities. Int. J. Aquac. 2016, 6, 1–8. [Google Scholar] [CrossRef]
  11. Alexandridis, T.K.; Topaloglou, C.A.; Lazaridou, E.; Zalidis, G.C. The performance of satellite images in mapping aquacultures. Ocean. Coast. Manag. 2008, 51, 638–644. [Google Scholar] [CrossRef]
  12. Xue, M.; Chen, Y.; Tian, X.; Yan, M.; Zhang, Z. Detection the expansion of marine aquaculture in Sansha Bay by remote sensing. In Proceedings of the IGARSS 2018–2018 IEEE International Geoscience and Remote Sensing Symposium, Valencia, Spain, 22–27 July 2018; pp. 7866–7869. [Google Scholar]
  13. Geng, J.; Fan, J.; Wang, H. Weighted fusion-based representation classifiers for marine floating raft detection of SAR images. IEEE Geosci. Remote Sens. Lett. 2017, 14, 444–448. [Google Scholar] [CrossRef]
  14. Fan, J.; Zhao, J.; An, W.; Hu, Y. Marine floating raft aquaculture detection of GF-3 PolSAR images based on collective multikernel fuzzy clustering. IEEE J. Sel. Top. Appl. Earth Obs. Remote Sens. 2019, 12, 2741–2754. [Google Scholar] [CrossRef]
  15. Kang, J.; Sui, L.; Yang, X.; Liu, Y.; Wang, Z.; Wang, J.; Yang, F.; Liu, B.; Ma, Y. Sea surface-visible aquaculture spatial-temporal distribution remote sensing: A case study in Liaoning province, China from 2000 to 2018. Sustainability 2019, 11, 7186. [Google Scholar] [CrossRef]
  16. Wang, J.; Sui, L.; Yang, X.; Wang, Z.; Liu, Y.; Kang, J.; Lu, C.; Yang, F.; Liu, B. Extracting coastal raft aquaculture data from landsat 8 OLI imagery. Sensors 2019, 19, 1221. [Google Scholar] [CrossRef] [PubMed]
  17. Wang, F.; Xia, L.; Chen, Z.; Cui, W.; Liu, Z.; Pan, C. Remote sensing identification of coastal zone mariculture modes based on association-rules object-oriented method. Trans. Chin. Soc. Agric. Eng. 2018, 34, 210–217. [Google Scholar]
  18. Wang, Y.; Zhang, Y.; Chen, Y.; Wang, J.; Bai, H.; Wu, B.; Li, W.; Li, S.; Zheng, T. The Assessment of More Suitable Image Spatial Resolutions for Offshore Aquaculture Areas Automatic Monitoring Based on Coupled NDWI and Mask R-CNN. Remote Sens. 2022, 14, 3079. [Google Scholar] [CrossRef]
  19. Wang, Z.; Yang, X.; Liu, Y.; Lu, C. Extraction of coastal raft cultivation area with heterogeneous water background by thresholding object-based visually salient NDVI from high spatial resolution imagery. Remote Sens. Lett. 2018, 9, 839–846. [Google Scholar] [CrossRef]
  20. Cheng, B.; Liu, Y.; Liu, X. Research on Extraction method of high resolution Remote Sensing image offshore aquaculture Area based on multi-source feature fusion. Remote Sens. Technol. Appl. 2018, 33, 296–304. [Google Scholar]
  21. Lu, Y.; Li, Q.; Du, X.; Wang, H.; Liu, J. An automatic extraction method for offshore aquaculture areas based on high resolution images. Remote Sens. Technol. Appl. 2015, 30, 486–494. (In Chinese). [Google Scholar]
  22. Fu, Y.; Deng, J.; Ye, Z.; Gan, M.; Wang, K.; Wu, J.; Yang, W.; Xiao, G. Coastal aquaculture mapping from very high spatial resolution imagery by combining object-based neighbor features. Sustainability 2019, 11, 637. [Google Scholar] [CrossRef]
  23. Peng, Y.; Sengupta, D.; Duan, Y.; Chen, C.; Tian, B. Accurate mapping of Chinese coastal aquaculture ponds using biophysical parameters based on Sentinel-2 time series images. Mar. Pollut. Bull. 2022, 181, 113901. [Google Scholar] [CrossRef]
  24. Chen, D.; Wang, Y.; Shen, Z.; Liao, J.; Chen, J.; Sun, S. Long Time-Series Mapping and Change Detection of Coastal Zone Land Use Based on Google Earth Engine and Multi-Source Data Fusion. Remote Sens. 2022, 14, 1. [Google Scholar] [CrossRef]
  25. Guo, Y.; Zhang, S.; Yang, J.; Yu, G.; Wang, Y. Dual memory scale network for multi-step time series forecasting in thermal environment of aquaculture facility: A case study of recirculating aquaculture water temperature. Expert Syst. Appl. 2022, 208, 118218. [Google Scholar] [CrossRef]
  26. Liu, X.; Wang, Z.; Yang, X.; Liu, Y.; Liu, B.; Zhang, J.; Gao, K.; Meng, D.; Ding, Y. Mapping China’s offshore mariculture based on dense time-series optical and radar data. Int. J. Digit. Earth 2022, 15, 1326–1349. [Google Scholar] [CrossRef]
  27. Ottinger, M.; Clauss, K.; Kuenzer, C. Large-scale assessment of coastal aquaculture ponds with Sentinel-1 time series data. Remote Sens. 2017, 9, 440. [Google Scholar] [CrossRef]
  28. Sun, Z.; Luo, J.; Yang, J.; Yu, Q.; Zhang, L.; Xue, K.; Lu, L. Nation-scale mapping of coastal aquaculture ponds with sentinel-1 SAR data using google earth engine. Remote Sens. 2020, 12, 3086. [Google Scholar] [CrossRef]
  29. Tian, P.; Liu, Y.; Li, J.; Pu, R.; Cao, L.; Zhang, H.; Ai, S.; Yang, Y. Mapping Coastal Aquaculture Ponds of China Using Sentinel SAR Images in 2020 and Google Earth Engine. Remote Sens. 2022, 14, 5372. [Google Scholar] [CrossRef]
  30. Wang, M.; Mao, D.; Xiao, X.; Song, K.; Jia, M.; Ren, C.; Wang, Z. Interannual changes of coastal aquaculture ponds in China at 10-m spatial resolution during 2016–2021. Remote Sens. Environ. 2023, 284, 113347. [Google Scholar] [CrossRef]
  31. Purnamasayangsukasih, P.R.; Norizah, K.; Ismail, A.A.; Shamsudin, I. A review of uses of satellite imagery in monitoring mangrove forests. In Proceedings of the IOP Conference Series: Earth and Environmental Science, Kuala Lumpur, Malaysia, 13–14 April 2016; p. 012034. [Google Scholar]
  32. Liu, Y.; Han, M.; Wang, M.; Fan, C.; Zhao, H. Habitat Quality Assessment in the Yellow River Delta Based on Remote Sensing and Scenario Analysis for Land Use/Land Cover. Sustainability 2022, 14, 15904. [Google Scholar] [CrossRef]
  33. Zheng, Y.; Wu, J.; Wang, A.; Chen, J. Object-and pixel-based classifications of macroalgae farming area with high spatial resolution imagery. Geocarto Int. 2018, 33, 1048–1063. [Google Scholar] [CrossRef]
  34. Cheng, Y.; Sun, Y.; Peng, L.; He, Y.; Zha, M. An Improved Retrieval Method for Porphyra Cultivation Area Based on Suspended Sediment Concentration. Remote Sens. 2022, 14, 4338. [Google Scholar] [CrossRef]
  35. Xu, Y.; Lu, L. Spatiotemporal distribution of cage and raft aquaculture in China’s offshore waters using object-oriented random forest classifier. In Proceedings of the 2022 10th International Conference on Agro-geoinformatics (Agro-Geoinformatics), Quebec City, QC, Canada, 11–14 July 2022; pp. 1–6. [Google Scholar]
  36. Xu, Y.; Wu, W.; Lu, L. Remote Sensing Mapping of Cage and Floating-raft Aquaculture in China’s Offshore Waters Using Machine Learning Methods and Google Earth Engine. In Proceedings of the 2021 9th International Conference on Agro-Geoinformatics (Agro-Geoinformatics), Shenzhen, China, 26–29 July 2021; pp. 1–5. [Google Scholar]
  37. Russell, A.G.; Castillo, D.U.; Elgueta, S.A.; Sierralta, C.J. Automated fish cages inventoryng and monitoring using H/A/α unsupervised wishart classification in sentinel 1 dual polarization data. In Proceedings of the 2020 IEEE Latin American GRSS & ISPRS Remote Sensing Conference (LAGIRS), Santiago, Chile, 22–26 March 2020; pp. 471–476. [Google Scholar]
  38. Hou, T.; Sun, W.; Chen, C.; Yang, G.; Meng, X.; Peng, J. Marine floating raft aquaculture extraction of hyperspectral remote sensing images based decision tree algorithm. Int. J. Appl. Earth Obs. Geoinf. 2022, 111, 102846. [Google Scholar] [CrossRef]
  39. Kurekin, A.A.; Miller, P.I.; Avillanosa, A.L.; Sumeldan, J.D. Monitoring of Coastal Aquaculture Sites in the Philippines through Automated Time Series Analysis of Sentinel-1 SAR Images. Remote Sens. 2022, 14, 2862. [Google Scholar] [CrossRef]
  40. Gao, L.; Li, Y.; Zhong, S.; Luo, D. Remote sensing detected mariculture changes in Dongshan Bay. J. Mar. Sci 2014, 32, 35–42. (In Chinese). [Google Scholar]
  41. Wang, P.; Wang, J.; Liu, X.; Huang, J. A Google Earth Engine-Based Framework to Identify Patterns and Drivers of Mariculture Dynamics in an Intensive Aquaculture Bay in China. Remote Sens. 2023, 15, 763. [Google Scholar] [CrossRef]
  42. Haralick, R.M.; Shanmugam, K.; Dinstein, I.H. Textural features for image classification. IEEE Trans. Syst. Man Cybern. 1973, SMC-3, 610–621. [Google Scholar] [CrossRef]
  43. Sanchez-Ruiz, S.; Moreno-Martinez, A.; Izquierdo-Verdiguier, E.; Chiesi, M.; Maselli, F.; Gilabert, M.A. Growing stock volume from multi-temporal landsat imagery through google earth engine. Int. J. Appl. Earth Obs. Geoinf. 2019, 83, 101913. [Google Scholar] [CrossRef]
  44. Liu, Y.; Wang, Z.; Yang, X.; Zhang, Y.; Yang, F.; Liu, B.; Cai, P. Satellite-based monitoring and statistics for raft and cage aquaculture in China’s offshore waters. Int. J. Appl. Earth Obs. Geoinf. 2020, 91, 102118. [Google Scholar] [CrossRef]
  45. Fu, T.; Zhang, L.; Yuan, X.; Chen, B.; Yan, M. Spatio-temporal patterns and sustainable development of coastal aquaculture in Hainan Island, China: 30 Years of evidence from remote sensing. Ocean. Coast. Manag. 2021, 214, 105897. [Google Scholar] [CrossRef]
  46. Drusch, M.; Del Bello, U.; Carlier, S.; Colin, O.; Fernandez, V.; Gascon, F.; Hoersch, B.; Isola, C.; Laberinti, P.; Martimort, P. Sentinel-2: ESA’s optical high-resolution mission for GMES operational services. Remote Sens. Environ. 2012, 120, 25–36. [Google Scholar] [CrossRef]
  47. Lanaras, C.; Bioucas-Dias, J.; Galliani, S.; Baltsavias, E.; Schindler, K. Super-resolution of Sentinel-2 images: Learning a globally applicable deep neural network. ISPRS J. Photogramm. Remote Sens. 2018, 146, 305–319. [Google Scholar] [CrossRef]
  48. Gorelick, N.; Hancher, M.; Dixon, M.; Ilyushchenko, S.; Thau, D.; Moore, R. Google Earth Engine: Planetary-scale geospatial analysis for everyone. Remote Sens. Environ. 2017, 202, 18–27. [Google Scholar] [CrossRef]
  49. Patel, N.N.; Angiuli, E.; Gamba, P.; Gaughan, A.; Lisini, G.; Stevens, F.R.; Tatem, A.J.; Trianni, G. Multitemporal settlement and population mapping from Landsat using Google Earth Engine. Int. J. Appl. Earth Obs. Geoinf. 2015, 35, 199–208. [Google Scholar] [CrossRef]
  50. Zhu, Z.; Wang, S.; Woodcock, C.E. Improvement and expansion of the Fmask algorithm: Cloud, cloud shadow, and snow detection for Landsats 4–7, 8, and Sentinel 2 images. Remote Sens. Environ. 2015, 159, 269–277. [Google Scholar] [CrossRef]
  51. Foga, S.; Scaramuzza, P.L.; Guo, S.; Zhu, Z.; Dilley Jr, R.D.; Beckmann, T.; Schmidt, G.L.; Dwyer, J.L.; Hughes, M.J.; Laue, B. Cloud detection algorithm comparison and validation for operational Landsat data products. Remote Sens. Environ. 2017, 194, 379–390. [Google Scholar] [CrossRef]
  52. Ottinger, M.; Bachofer, F.; Huth, J.; Kuenzer, C. Mapping aquaculture ponds for the coastal zone of Asia with Sentinel-1 and Sentinel-2 time series. Remote Sens. 2022, 14, 153. [Google Scholar] [CrossRef]
  53. Nagler, T.; Rott, H.; Hetzenecker, M.; Wuite, J.; Potin, P. The Sentinel-1 mission: New opportunities for ice sheet observations. Remote Sens. 2015, 7, 9371–9389. [Google Scholar] [CrossRef]
  54. Di, Y. Research progress of wetland cover identification and classification with different SAR parameters. J. Chifeng Univ. Nat. Sci. 2018, 34, 3. [Google Scholar]
  55. Liu, C.; Shi, R. Boundary Data of Asia Tropical Humid & Semi-Humid Eco-Region (ATHSBND). Digit. J. Glob. Chang. Data Repos. 2014. [Google Scholar] [CrossRef]
  56. Liu, C.; Shi, R. Boundary Data of East Asia Summer Monsoon Geo_Eco_Region (EASMBND). Digit. J. Glob. Chang. Data Repos. 2015. [Google Scholar] [CrossRef]
  57. Ren, C.; Wang, Z.; Zhang, Y.; Zhang, B.; Chen, L.; Xi, Y.; Xiao, X.; Doughty, R.B.; Liu, M.; Jia, M. Rapid expansion of coastal aquaculture ponds in China from Landsat observations during 1984–2016. Int. J. Appl. Earth Obs. Geoinf. 2019, 82, 101902. [Google Scholar] [CrossRef]
  58. Lathrop, R.G.; Montesano, P.; Haag, S. A multi-scale segmentation approach to mapping seagrass habitats using airborne digital camera imagery. Photogramm. Eng. Remote Sens. 2006, 72, 665–675. [Google Scholar] [CrossRef]
  59. Zeng, Z.; Wang, D.; Tan, W.; Yu, G.; You, J.; Lv, B.; Wu, Z. RCSANet: A Full Convolutional Network for Extracting Inland Aquaculture Ponds from High-Spatial-Resolution Images. Remote Sens. 2020, 13, 92. [Google Scholar] [CrossRef]
  60. Xu, Y.; Hu, Z.; Zhang, Y.; Wang, J.; Yin, Y.; Wu, G. Mapping Aquaculture Areas with Multi-Source Spectral and Texture Features: A Case Study in the Pearl River Basin (Guangdong), China. Remote Sens. 2021, 13, 4320. [Google Scholar] [CrossRef]
  61. Zhang, Y.; Wang, C.; Chen, J.; Wang, F. Shape-constrained method of remote sensing monitoring of marine raft aquaculture areas on multitemporal synthetic sentinel-1 imagery. Remote Sens. 2022, 14, 1249. [Google Scholar] [CrossRef]
  62. Cheng, J.; Jia, N.; Chen, R.; Guo, X.; Ge, J.; Zhou, F. High-Resolution Mapping of Seaweed Aquaculture along the Jiangsu Coast of China Using Google Earth Engine (2016–2022). Remote Sens. 2022, 14, 6202. [Google Scholar] [CrossRef]
  63. Nan, C.; Yang, X.; Hai, Y. Exploring the measurement method of large seaweed culture area in China. Ocean. Dev. Manag. 2015, 32, 4. [Google Scholar]
Figure 1. Schematic diagram of the study area.
Remotesensing 15 02243 g001
Figure 2. Examples of cage aquaculture (a) and raft aquaculture (b).
Remotesensing 15 02243 g002
Figure 3. Difference between Sentinel-2 single image (a) and median synthetic image (b) for mariculture.
Remotesensing 15 02243 g003
Figure 4. Flow chart for mariculture extraction.
Remotesensing 15 02243 g004
Figure 5. The spectral curves of Sentinel-2 images at different bands (bands 1 to 12 represent the bands of Aerosols, Blue, Green, Red, Red Edge1, Red Edge2, Red Edge3, NIR, Red Edge4, water vapor, SWIR 1, and SWIR 2, respectively).
Remotesensing 15 02243 g005
Figure 6. Different spectral index of raft aquaculture and neighbor seawater ((a) NDWI; (b) NDVI; (c) MAI).
Remotesensing 15 02243 g006
Figure 7. Different spectral feature maps of raft aquaculture and seawater in the test region I. ((a) NDWI; (b) NDVI; (c) MAI).
Remotesensing 15 02243 g007
Figure 8. Different spectral feature maps of raft aquaculture and seawater surrounding island. ((a) NDWI; (b) NDVI; (c) MAI).
Remotesensing 15 02243 g008
Figure 9. Classification results of different feature combinations ((a) MAI and SNDMAI; (b) MAI, SNDMAI and MAI texture; (c) MAI, SNDMAI, and MAI texture and compactness) in test region I. (The correct areas indicated in green are the correctly classified raft aquaculture patch; the wrong areas indicated in yellow are the seawater patch classified as the raft aquaculture; the missed areas indicated in orange are the raft aquaculture patch classified as seawater; and the background indicated in dark is the correctly classified seawater area).
Remotesensing 15 02243 g009
Figure 10. The annual median synthetic image (a) and raft aquaculture visual interpretation result (b) of test region II in Zhuanghe City.
Remotesensing 15 02243 g010
Figure 11. Classification results of different feature combinations. ((a) MAI and SNDMAI; (b) MAI, SNDMAI, and MAI texture; (c) MAI, SNDMAI, and MAI texture and compactness) in test region II. (The correct areas indicated in green are correctly classified as the raft aquaculture patch; the wrong areas indicated in yellow are the seawater patches classified as raft aquaculture; missed areas indicated in orange are the raft aquaculture patch classified as seawater; and the background indicated in dark is the correctly classified seawater).
Remotesensing 15 02243 g011
Figure 12. Different feature maps ((a) SNDVV; (b) VV texture).
Remotesensing 15 02243 g012
Figure 13. Classification results by synergistic integration of Sentinel-1 and Sentinel-2. ((a) Test region I; (b) Test region II).
Remotesensing 15 02243 g013
Figure 14. Distribution of mariculture in different coastal provinces in Bohai Rim in 2020.
Remotesensing 15 02243 g014
Figure 15. Features of MAI texture (a) and SNDMAI (b).
Remotesensing 15 02243 g015
Figure 16. Different segmentation results ((a) Segmentation of Sentinel-2; (b) Segmentation of Sentinel-1 and Sentinel-2).
Remotesensing 15 02243 g016
Table 1. Confusion matrix of classification results based on Sentinel-1 and Sentinel-2 data.
Cage AquacultureRaft AquacultureCulture Area SeawaterNon-Culture Area SeawaterUser’s Accuracy
Cage aquaculture8440095.45%
Raft aquaculture41173094.35%
Culture area seawater1770593.17%
Non-culture area Seawater12768
Producer’s accuracy93.33%90.00%98.04%
Overall accuracy94.10%Kappa coefficient0.91
Table 2. Remote sensing data and statistical data of mariculture area (km2).
ProvinceCage AquacultureRaft Aquaculture
Our ResultsYearbook StatisticData in 2018 from Liu [45]Our ResultsYearbook StatisticData in 2018 from Liu [45]
Liaoning13.740.413.25473.82485.52199.53
Hebei000240.26484.17239.04
Tianjin000000
Shandong3.152.242.61492.63989.57254.57
Total16.892.655.861206.711959.26639.14
Disclaimer/Publisher’s Note: The statements, opinions and data contained in all publications are solely those of the individual author(s) and contributor(s) and not of MDPI and/or the editor(s). MDPI and/or the editor(s) disclaim responsibility for any injury to people or property resulting from any ideas, methods, instructions or products referred to in the content.

