1. Introduction
Eddies play a key role in ocean dynamics by encapsulating and transporting large amounts of water and their associated physical and biochemical properties over long distances. This has a significant impact on ocean circulation, heat uptake, gas exchange, carbon sequestration, and nutrient transport [
1,
2]. As one of the most important elements of the climate system, a single eddy may transport trillions of tons of water and tens of terajoules of heat from their generation regions to the dissipation site, thus having a significant influence on climate variability and predictability [
1]. Eddies dominate the kinetic energy of the ocean over horizontal distances of tens to hundreds of kilometers and play a major role in vertical and horizontal mixing, such as cross-frontal exchange [
3]. The detailed study of mesoscale eddies is crucial for better understanding dynamic, climatic, and biological ocean processes.
A marginal ice zone (MIZ) is a transition region from the open sea to dense drift ice. The MIZ is characterized by strong lateral buoyancy gradients, energetic atmosphere–ice–ocean interactions, and enhanced biological productivity [
4]. The formation of eddies at the MIZ is a common dynamic feature that plays an important role in the various exchange processes of mass, heat, and momentum. These eddies can affect the position of the ice edge and biological productivity within the MIZ [
5,
6].
To this day, the data from altimetry missions are the main sources of information about mesoscale variability in the World Ocean. The accumulation of decades-long global altimetry time series, the development of gridded altimetry products from multiple missions, and the implementation of various automated eddy identification algorithms have enabled oceanographers to obtain an unprecedented amount of statistical information on various eddy properties and their propagation characteristics, such as the number of generated eddies, their geometric and physical properties, and translation velocities [
1,
7]. However, the altimetry data have significant limitations in the polar regions. Arctic eddies are several times smaller in size than low-latitude eddies, and the gridded altimetry AVISO fields resolve only a small fraction of eddies in the polar regions with typical radii of 30–50 km [
8]. Consequently, spatial scales under 30 km are essentially unobserved. Moreover, the conventional way of using the altimetry data for eddy observation is complicated in the polar regions by the presence of sea ice, which makes this data type almost inapplicable for eddy detection in the MIZ.
Eddy-resolving models with a resolution of 1 km or finer are important sources of data on the mesoscale/submesoscale dynamics in the polar regions. Models such as FESOM make it possible to study the dynamics of small eddies near the sea ice edges [
8,
9]. However, eddy-resolving Arctic Ocean simulations are computationally demanding and require actual data as part of an observational basis for model improvement and validation [
9]. For MIZ regions, this information is still very limited due to the scarcity of in situ observations, spatial and temporal limitations of altimetry data, and weather restrictions of optical satellite data.
Currently, the most universal source of information about eddy dynamics in polar regions is remote sensing data obtained from synthetic aperture radar (SAR). High-resolution SAR images can resolve ocean dynamics at scales of 0.1–1 km, and they are weather and cloud independent. SAR signatures of sea ice are well sustained under any weather conditions, making them nearly perfect for monitoring eddy dynamics in MIZ regions. Eddies manifest themselves on SAR images via three main mechanisms: wave-current interactions that modulate short-scale surface roughness patterns, near-surface wind variations across oceanic fronts, and the accumulation of slicks and ice floes in the MIZ [
10,
11]. Since our work considers eddies in the MIZ region, the presence of sea ice is an underlying condition for the efficiency of the developed method of eddy detection.
It should be emphasized that other sensors can potentially be used for eddy monitoring, such as optical sensors that provide images in visible and infrared channels of the electromagnetic spectrum [
12]. The main advantage of optical images is easier visual interpretability, especially in comparison to SAR data. Additionally, similar to SAR, optical data are usually provided in high spatial resolution, allowing for the identification of smaller eddies and sea ice formations and structures on the underlying surface. However, the most crucial limitation of such data is their high sensitivity to atmospheric and light conditions, which is a significant problem for the Arctic region where cloud cover and long periods of darkness prevail for several months of the year [
13]. Therefore, optical sensors can only be partially used depending on the data availability and final application [
14].
Numerous studies have used SAR images for eddy detection in MIZ [
4,
8,
10,
15]. However, the underlying methodology for all these studies is based on visual inspection of satellite images, which is time-consuming, strongly relies on expert knowledge, and is prone to various biases and errors. Based on decades of experience in eddy identification from satellite data, it is clear that for the accumulation of a significant amount of statistical data on eddy properties in MIZ regions, it is necessary to develop a robust methodology for automated eddy identification from SAR images. It should also be noted that in recent years, several studies have implemented various machine learning algorithms for eddy detection from SAR images [
16,
17,
18,
19]. However, all of these studies were focused on identifying eddies in ice-free zones. In contrast, our study is focused on the MIZ region where the main eddy tracers are different types of sea ice, which require a completely new approach for eddy detection.
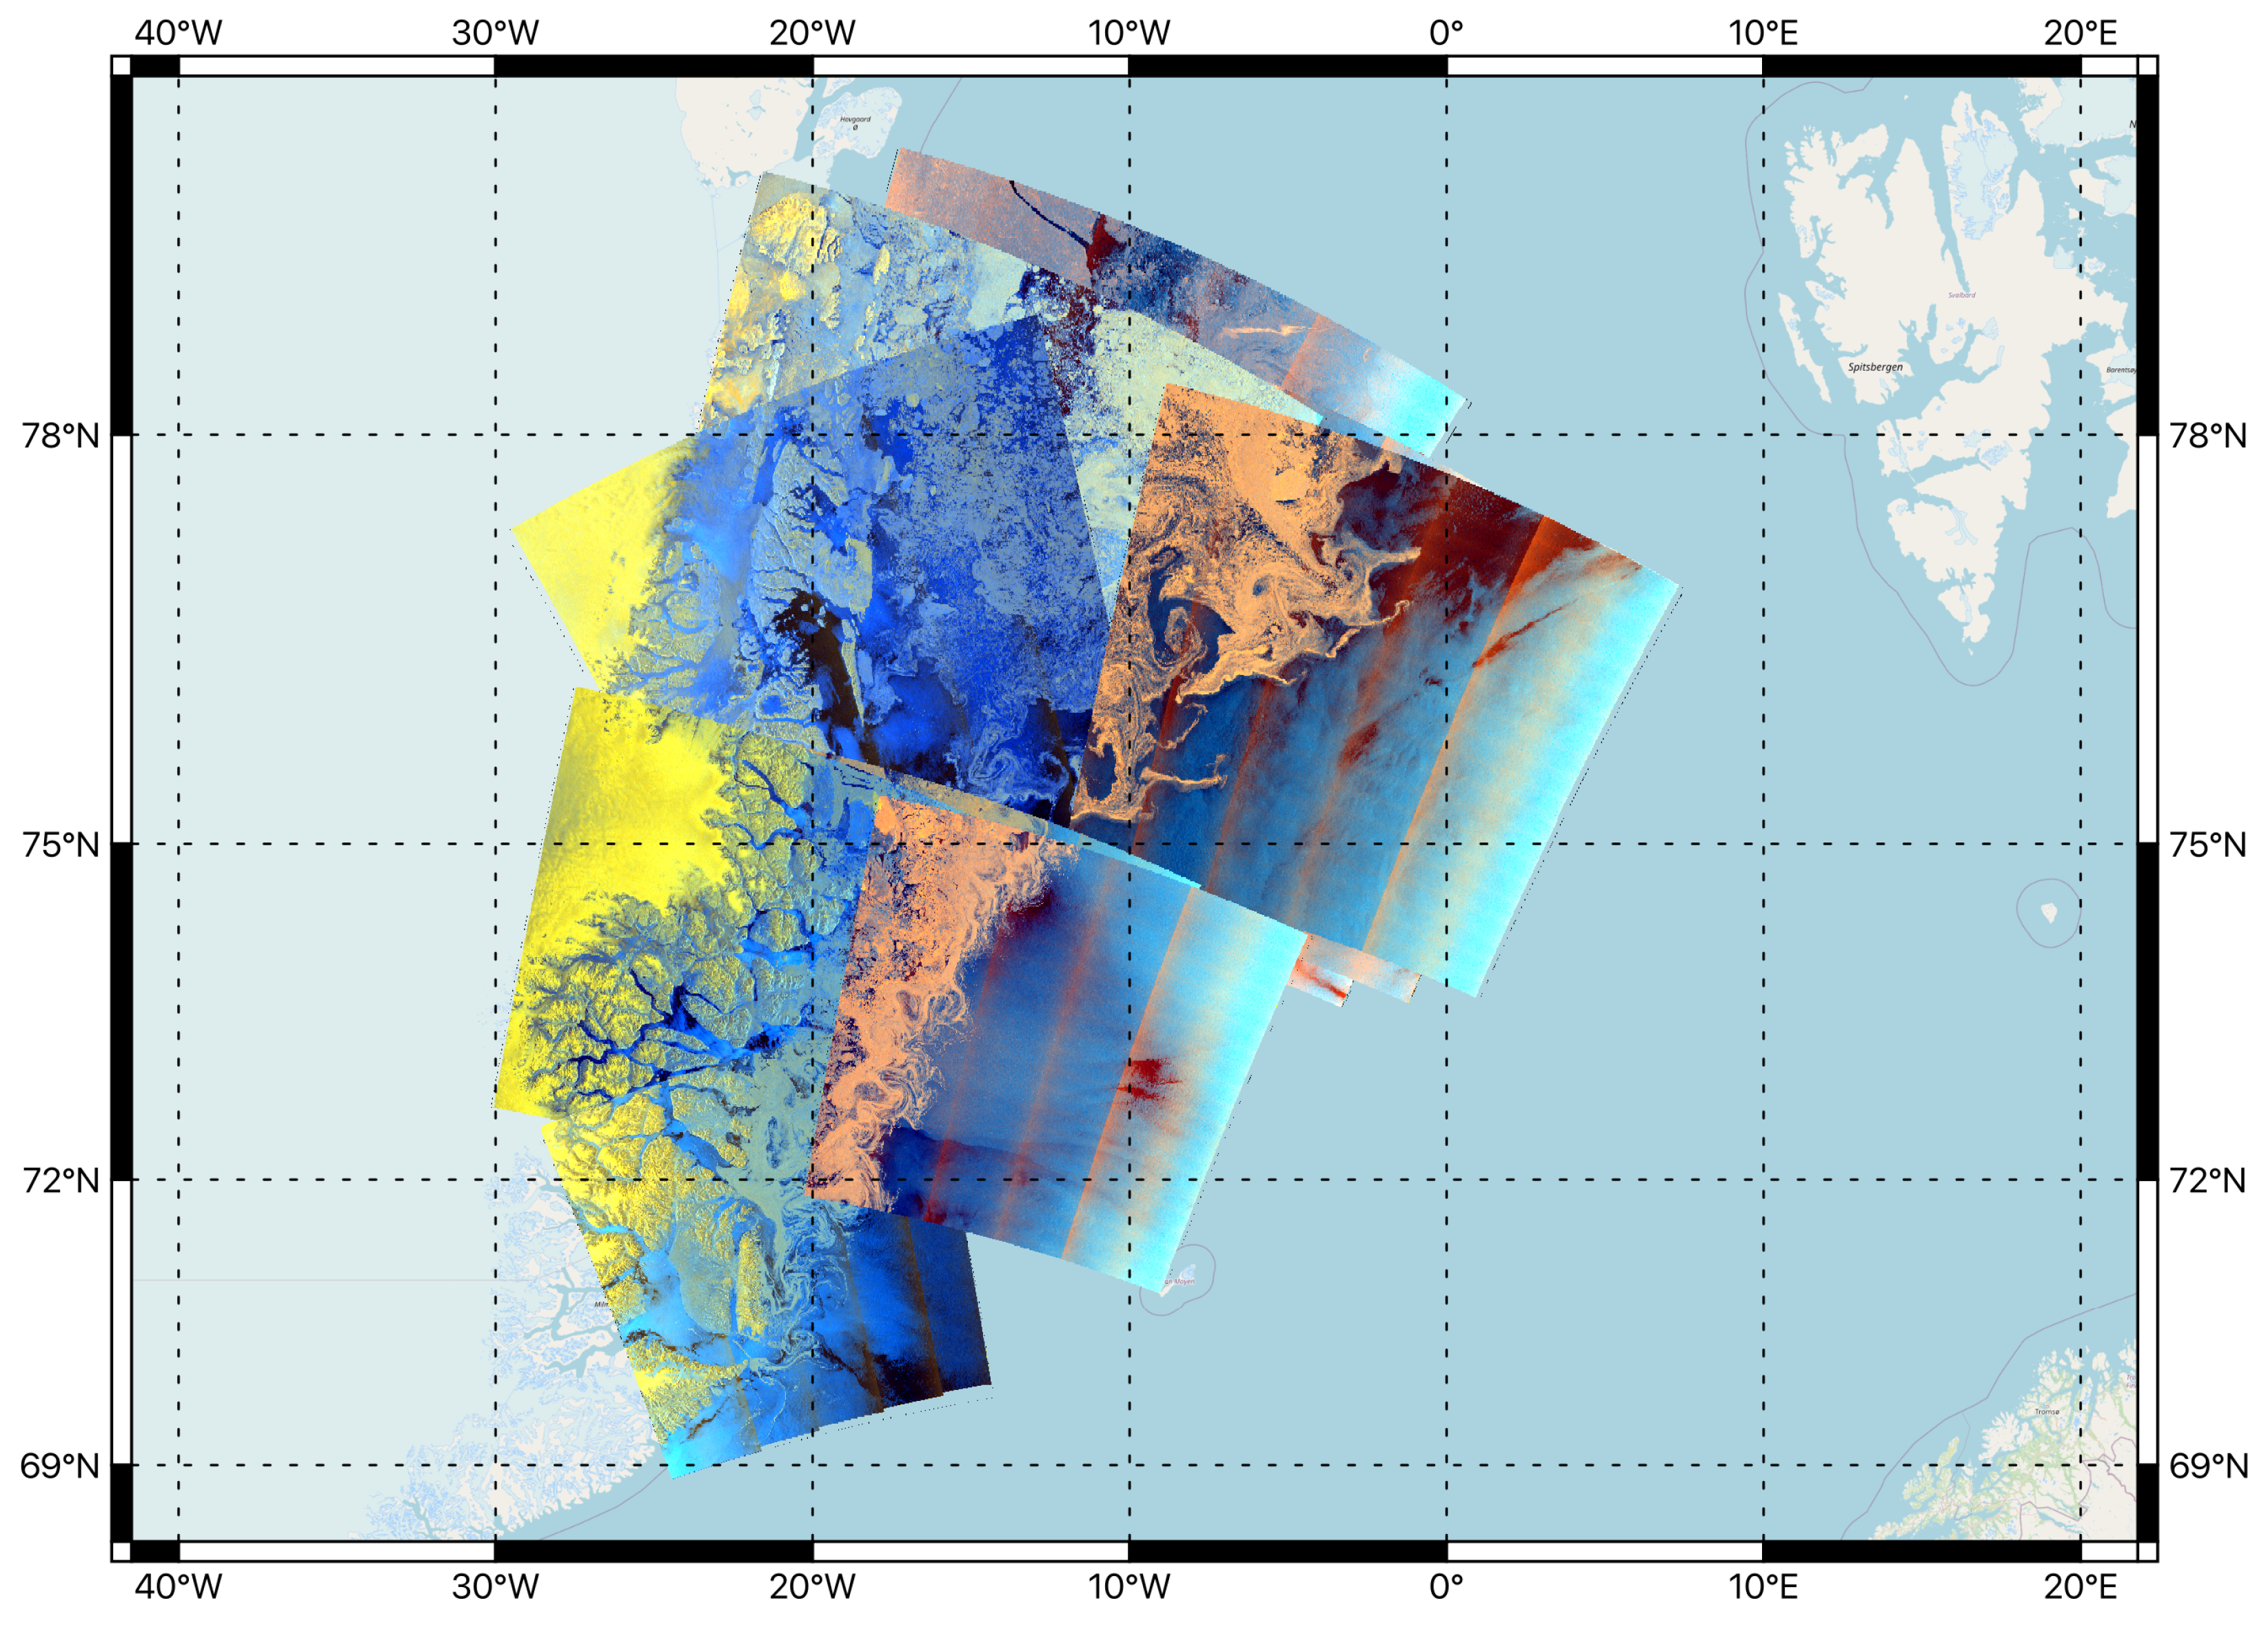
The study area is located over the Fram Strait, which is a 600 km wide passage between the Svalbard archipelago and Greenland, representing a unique deep-water connection between the Arctic and the rest of the world. The water mass exchange is controlled by two main currents: West Spitsbergen Current (WSC) and the East Greenland Current (EGC). Fram Strait is an ideal place to study eddies in the MIZ, due to the fact that this is one of the most dynamic regions and it is the main gateway through which sea ice leaves the Arctic Ocean.
The rest of this paper is organized as follows.
Section 2 demonstrates the dataset description.
Section 3 shows the method used in this study.
Section 4 presents an analysis and experimental results. Finally, the discussion and conclusions are presented in
Section 5.
2. Dataset Description
The following section describes the dataset used in this study. The dataset was generated from Sentinel-1 imagery in an extra-wide (EW) swath mode at dual-polarization (HH and HV). Sentinel-1 operates at the C-band with a central frequency of 5.404 GHz and includes two polar-orbit Sentinel-1A and Sentinel-1B missions that are able to work at multiple sensing modes. There are several crucial things that motivated us to specifically use Sentinel-1. First and foremost is the complete independence of atmospheric and light conditions, which is particularly significant when operating in polar regions. The second major benefit is that Sentinel-1 can provide high-resolution imagery with a pixel size of 40 m, which allows us to visually identify eddies with different sizes and distinguish smaller structures on the surface. Moreover, it is worth emphasizing that Sentinel-1 data are publicly available through Copernicus Open Access Hub, the European Union’s Earth observation program. Accordingly, the Sentinel-1 data were corrected for thermal noise and calibrated to sigma nought in dB using the ESA Sentinel-1 Toolbox.
The collected dataset includes 25 scenes, from June to November 2022, which cover the melting and ice formation season over the area of the Greenland Sea, East Greenland. The aforementioned scenes were partitioned into two distinct sets: a training set consisting of 20 scenes, and a validation set consisting of 5 scenes, for the purpose of training and evaluating the neural network. It should be noted that the validation dataset includes four scenes with eddies in the MIZ that will be further demonstrated. The 5th one is the open ocean image with various ocean signatures, which was employed to make sure that the detection algorithm will not fail in the scenario with no eddies in the MIZ. Moreover, we collected a few additional scenes, which were not labeled in order to test the proposed architecture.
Figure 1 illustrates the study area along with the false-color composites that were used for training.
Figure 2 illustrates a few eddy signature examples that were used for training. It is evident that eddies in the MIZ, especially on SAR images, can look very different depending on many parameters. In this paper, we are focusing on detecting all of the eddy signatures. However, in future studies, we will plan to distinguish and detect different types of eddies in terms of their size, shape, and rotation direction.
3. Method Description
In this study, we trained different YOLOv5 [
20] models for the purpose of eddy detection in the MIZ. YOLOv5 is a state-of-the-art object detection algorithm that can detect and locate objects in an image or video in real time with high accuracy. It is the latest version of the YOLO (You Only Look Once) family of object detection models, and it was introduced in 2020 by Ultralytics. YOLOv5 uses a deep convolutional neural network architecture that is trained on the common objects in context (COCO) dataset [
21], an extensive dataset of labeled images to identify various objects, such as people, animals, vehicles, etc.
The YOLOv5 network uses a combination of convolutional, upsampling, and specialized layers to identify objects with varying scales and aspect ratios [
20]. The network is composed of a backbone feature extractor, a neck, and a head. The backbone is a pre-trained network that extracts rich feature representations from images, reducing spatial resolution and increasing channel resolution. YOLOv5 uses CSP-Darknet53 as its backbone, which combines CSPNet [
22] and Darknet-53 [
23]. Darknet-53 is a 53-layer convolutional neural network used for feature extraction, while CSPNet solves the issue of redundant gradients in large-scale backbones, such as Darknet, by truncating gradient flow. This reduces the number of parameters and computation required, improving inference speed, which is crucial for real-time object detection [
22]. The neck module includes a spatial pyramid pooling (SPP) [
24] module that maximizes input pooling and group features of different scales. This allows the model to generalize well to objects of different sizes and scales. The model head is a convolutional neural network that performs final operations, applying anchor boxes on feature maps to render the final output: classes, scores, and bounding boxes.
There are several various sizes of YOLOv5 that cater to different use cases and requirements. YOLOv5 nano (YOLOv5n) and YOLOv5 small (YOLOv5s) are the smallest and fastest variants of YOLOv5, with smaller model sizes and fewer layers. They are suitable for applications that require real-time object detection on low-powered devices. YOLOv5 medium (YOLOv5m) has a medium-sized model with more layers and higher accuracy than YOLOv5s. It is suitable for applications that require higher accuracy while still maintaining real-time performance. YOLOv5 large (YOLOv5l) has a larger model size and more layers than YOLOv5m, which results in even higher accuracy but at the cost of slower inference speed. It is suitable for applications that require the highest possible accuracy. YOLOv5 x-large (YOLOv5x) has the largest model size and the most layers of all YOLOv5 variants. It achieves the highest accuracy among all YOLOv5 models but at the cost of a slower inference speed and higher memory requirements. It is suitable for applications that require the highest possible accuracy and have access to high-performance computing resources.
In order to select the best-performing YOLOv5 model, the five different models were trained using the specified training set and evaluated using the validation set for up to 500 epochs each. It is worth noting that our dataset for eddy detection is substantially small, which presents a challenge for training accurate object detection models. In order to address this challenge, we chose to fine-tune pre-trained YOLOv5 models for eddy detection.
During training, the model learns to predict bounding boxes around eddies and calculates a confidence score for each predicted box. To evaluate the accuracy of the models, the mean average precision (mAP) metric was used, with a confidence threshold range of
to
. The mAP is a commonly used metric in object detection [
25] that measures the accuracy of the model in detecting objects at different levels of confidence. Specifically, it calculates the average precision (AP) for each class of object detected and then takes the mean across all classes to arrive at an overall mAP score.
In the present case, the model with the highest mAP score was selected for each architecture.
4. Experimental Results & Discussion
The following section demonstrates the comparison of different YOLOv5 models along with a performance of fine-tuned YOLOv5s on the validation and test datasets for the detection of eddies in the MIZ.
4.1. Comparison
To optimize training efficiency, the false-color composites were resized to 1500 × 1500 pixels. This allowed the models to be trained faster without sacrificing accuracy. To compute the models, NVIDIA T4 Tensor Core GPUs were used, which were available through Google Colab.
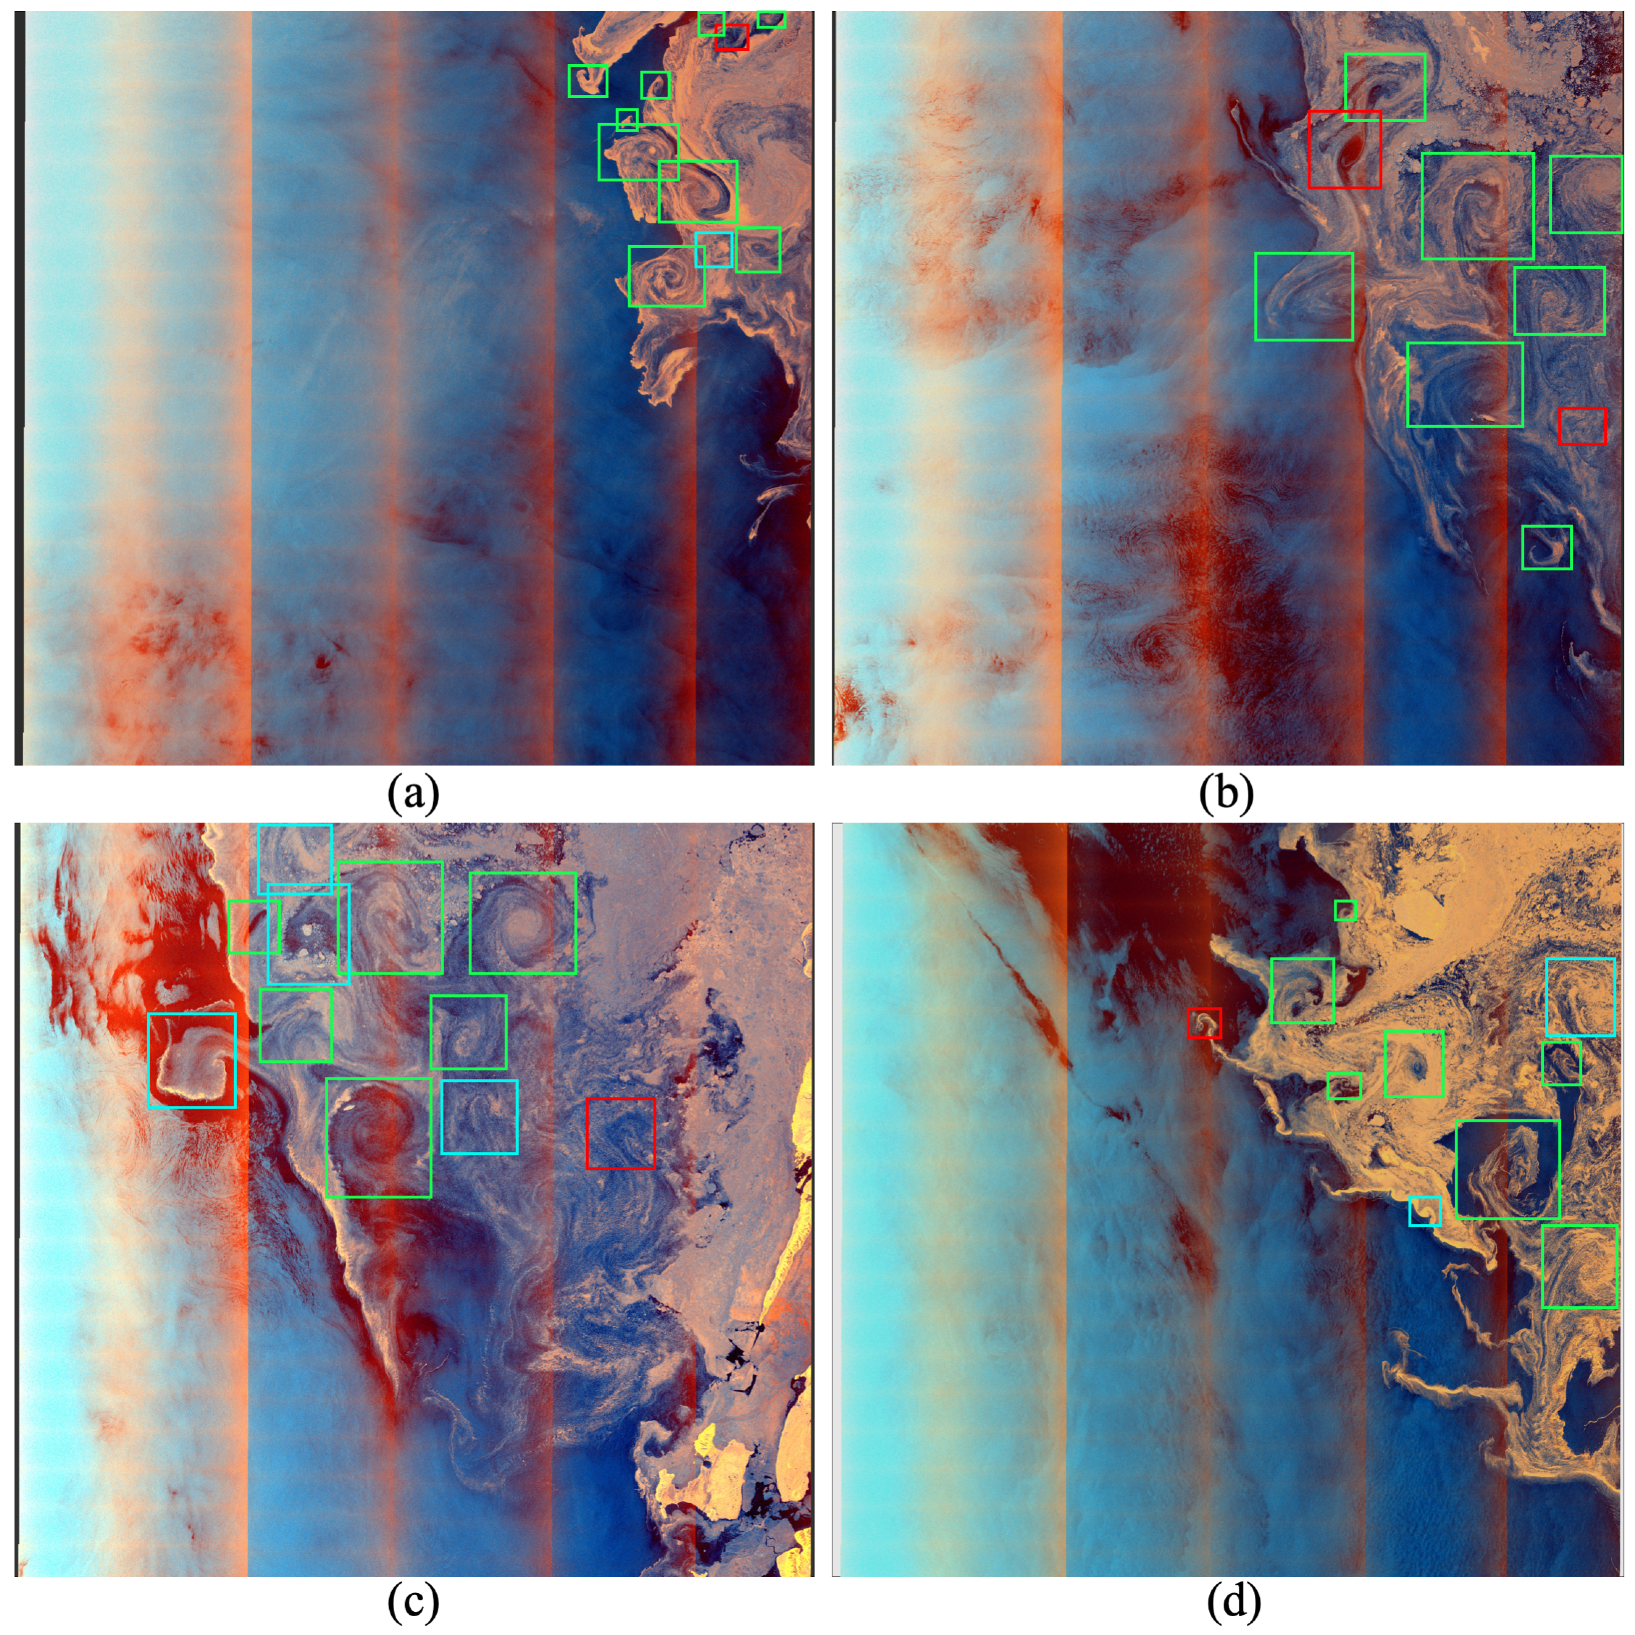
In
Table 1, we present the metrics of the best models for each architecture. The detection results of these models on the validation set were compared, revealing that YOLOv5x had superior overall metrics.
Figure 3 displays the output of the YOLOv5 small, large, and x-large deep-learning algorithms, featuring the detected eddy signatures in the MIZ. The green boxes indicate the correctly detected eddies, while the red boxes represent missed eddies. Cyan boxes denote eddies that were not initially labeled but were subsequently detected by the algorithm. This validation image serves as a suitable example of why we prefer YOLOv5s for eddy detection. Although larger architectures have higher metrics due to their superior performance in detecting more difficult eddies, YOLOv5s is an efficient and lightweight model that excels in detecting the most obvious eddies. Moreover, YOLOv5s outperformed YOLOv5x in detecting more prominent eddies. Therefore, we selected YOLOv5s for our specific application of eddy detection.
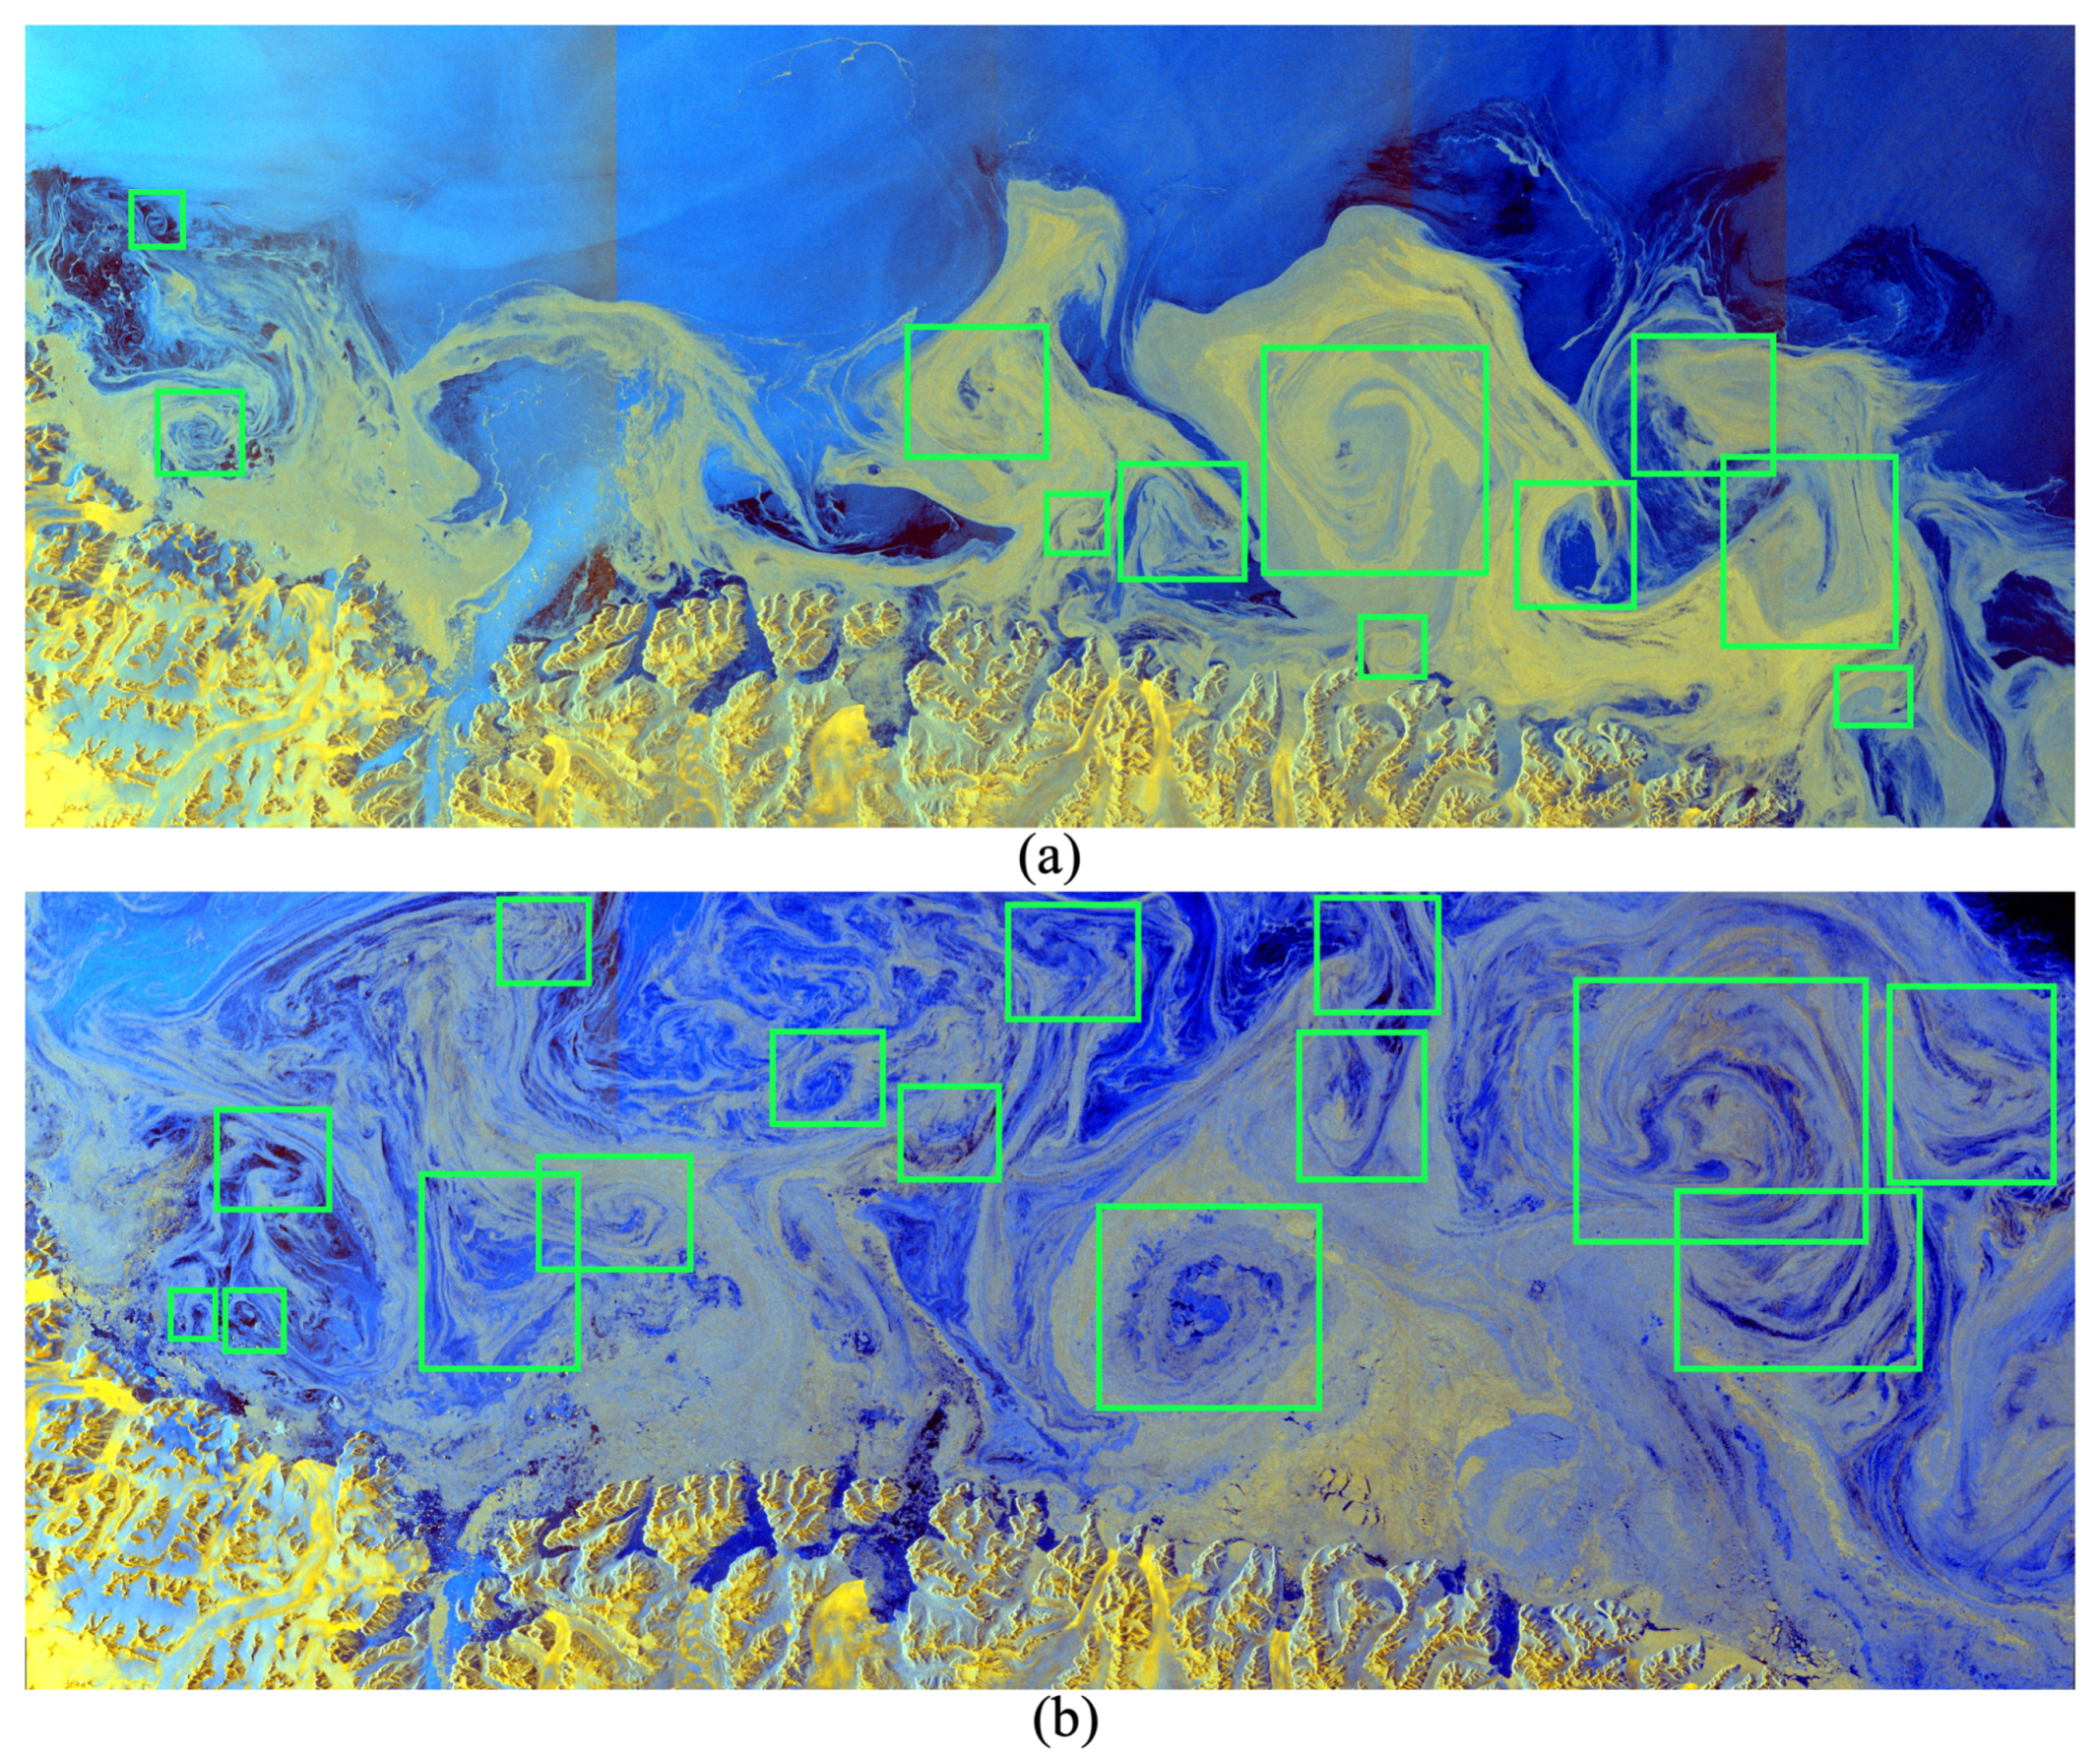
4.2. Validation Dataset
Figure 4 illustrates the output of the YOLOv5s deep-learning model, which was used to detect eddy signatures in the MIZ from SAR false-color composites. The algorithm was evaluated using a validation dataset, which consisted of labeled eddies. Green boxes show the correctly detected eddies, while the missed eddies are demonstrated with red boxes. Additionally, the cyan boxes illustrate the eddies that were not initially labeled but were detected. It is evident from the images that we were able to highly minimize the false alarm detections by choosing the right deep-learning architecture. Even though the eddy signatures on the SAR false-color composites vary significantly in terms of shape and size, especially in the MIZ, almost all of the labeled eddies were properly detected. While the individual small submesoscale eddies were missed by the chosen model in
Figure 4a,d, in
Figure 4b, the algorithm missed a lower part of the dipole eddy. Moreover, some of the eddy signatures were not initially labeled, however, they were detected by the algorithm, which is especially clear in
Figure 4c.
Sea ice acts as Lagrangian particles, and in the vast majority of cases, the algorithm was able to perfectly capture the eddy shape spiraling signatures and identify the core and most of the peripheral areas of the vortex structure. Based on the data from the validation dataset, the algorithm detects eddies in the spatial scale range from 1 to 100 km, thus covering both the mesoscale and submesoscale ranges.
The ocean eddies manifest themselves on the ocean surface via different geometrical forms. They can be very close to the circular shape, which poses no problem for the algorithm. However, in certain cases, the eddies take elongated shapes and even stretch into filaments due to interactions with background currents that are inhomogeneous in space [
26]. In some cases, the algorithm detects such filament structures, which cannot be fully avoided since most of the filaments have a high value of vorticity and are even visually almost inseparable from the main eddy field. Additionally, the elongated shapes of the eddies lead to the impossibility of detection of the peripheral part of the eddies.
The eddy boundary in the high turbulent areas, such as MIZ, is diffusive and cannot be correctly identified with the approach used in our work. There are different methods for eddy boundary detection [
1,
7] and it usually demands the implementation of the physical or geometrical criteria, which is out of the scope of this study.
While identifying eddies is a complex task due to their intricate geometric configurations, recent advancements in machine learning offer exciting opportunities to overcome these challenges. Although labeling eddies demands specialized expertise, resulting in a limited dataset and uncertainties in labels, we are confident that we can obtain high-quality labeled data with modern techniques. Furthermore, integrating other sensors with a coarser spatial resolution can expand the dataset and improve the accuracy of our model. Although there may be some misdetections in our current approach, they can be resolved through further investigation and improvement in future studies. We believe that our approach will provide valuable insights and contribute to the advancement of eddy detection using machine learning.
4.3. Test Dataset
Here, we present the outputs of the YOLOv5s algorithm for detecting eddies in the MIZ over the East Greenland Coast. The test data used for this analysis were acquired on (a) 27 November and (b) 9 December 2022. The detected eddies are highlighted in green boxes in
Figure 5, demonstrating the ability of the algorithm to robustly detect eddy signatures with different structures.
One of the major advantages of using YOLOv5 for eddy detection is its ability to perform real-time processing of the image data. This allows for the timely detection of eddies, which is critical in various applications, such as polar navigation, offshore operations, and oceanographic observations. The results of our experiments using YOLOv5s consistently demonstrate the robust detection of eddies in the MIZ, which is a crucial first step toward automating the eddy detection process.
5. Conclusions
In this paper, we demonstrate the first step towards the automatization of eddy detection in the MIZ. Specifically, we focused on the MIZ areas where the main tracers of eddies are different types of sea ice, mainly brash ice. This is a narrow field that has not been extensively studied, requiring a new approach to eddy detection. The experimental results obtained from both the validation and test datasets consistently demonstrated the effectiveness and robustness of the chosen deep learning architecture in identifying submesoscale and mesoscale eddies with various shapes. This reveals the huge potential of deep-learning algorithms for such a challenging task as eddy detection in the MIZ.
SAR data were utilized in this work for eddy detection in the MIZ for several crucial reasons, such as independence of light and weather conditions, high spatial resolution, and public availability. The eddies on the SAR imagery can be detected due to the difference in surface roughness between the sea ice and open water boundary. Nevertheless, other instruments can be used, namely sea surface temperature sensors, satellites equipped with altimeters, and optical sensors. Each of these sensors has its own advantages and limitations. As a future step, we will consider integrating various sources of data since combining data from different instruments can potentially improve the understanding of the interactions between the ocean and the sea ice as well as the formation of eddies for a particular region.
While the primary goal of this study is to select and optimize the appropriate architecture for detecting all eddy signatures without further discrimination based on size (submesoscale or mesoscale), shape, or rotation direction (anticyclonic or cyclonic), future research will mainly focus on distinguishing and detecting various eddy types in the MIZ.
Overall, the results presented in this study illustrate the effectiveness and robustness of YOLOv5 in detecting eddies in the MIZ, providing a promising foundation for future research in automating the detection of eddies in various marine environments.


