Article

Backscattering Characteristics of SAR Images in Damaged Buildings Due to the 2016 Kumamoto Earthquake

Department of Architecture and Building Engineering, Tokyo Institute of Technology, Yokohama 226-8502, Japan
*
Author to whom correspondence should be addressed.
Remote Sens. 2023, 15(8), 2181; https://doi.org/10.3390/rs15082181
Submission received: 21 February 2023 / Revised: 11 April 2023 / Accepted: 18 April 2023 / Published: 20 April 2023

Abstract

:
Most research on the extraction of earthquake-caused building damage using synthetic aperture radar (SAR) images used building damage certification assessments and the EMS-98-based evaluation as ground truth. However, these methods do not accurately assess the damage characteristics. The buildings identified as Major damage in the Japanese damage certification survey contain damage with various characteristics. If Major damage is treated as a single class, the parameters of SAR images will vary greatly, and the relationship between building damage and SAR images would not be properly evaluated. Therefore, it is necessary to divide Major damage buildings into more detailed classes. In this study, the Major damage buildings were newly classified into five damage classes, to correctly evaluate the relationship between building damage characteristics and SAR imagery. The proposed damage classification is based on Japanese damage assessment data and field photographs, and is classified according to the dominant damage characteristics of the building, such as collapse and damage to walls and roofs. We then analyzed the backscattering characteristics of SAR images for each classified damage class. We used ALOS-2 PALSAR-2 images observed before and after the 2016 Kumamoto earthquake in Mashiki Town, where many buildings were damaged by the earthquake. Then, we performed the analysis using two indices, the correlation coefficient R and the coherence differential value γdif, and the damage class. The results indicate that the backscattering characteristics of SAR images show different trends in each damage class. The R tended to decrease for large deformations such as collapsed buildings. The γdif was likely to be sensitive not only to collapsed buildings but also to damage with relatively small deformation, such as distortion and tilting. In addition, it was suggested that the ground displacement near the earthquake fault affected the coherence values.

Graphical Abstract

1. Introduction

Disasters, especially major earthquakes, cause widespread human and economic losses and severely impact society [1]. Rapid disaster response is necessary to minimize the losses and impacts of earthquakes. Recently, vision technologies emerged as an effective way to perform tasks such as structural health monitoring [2,3] and damage assessment [4]. Powered by such technologies, remote sensing using airborne and satellite-based technologies play an increasingly important role in supporting rapid disaster response [5,6]. In addition, in Japan, the use of optical satellite imagery and aerial photography was incorporated into manuals for field survey–based damage assessment [7]. As observation techniques and sensor resolution improve year by year, the use of remote sensing in disaster response is likely to increase.
There are two types of satellite-based observations: optical sensors and synthetic aperture radar (SAR). Optical sensors are passive sensors that require sunlight to observe the Earth’s surface and cannot penetrate clouds, limiting their ability to observe when disasters occur. On the other hand, SAR is an active sensor that emits microwaves, so it is less affected by rain and clouds and can be used regardless of weather conditions and observation time. SAR is considered to be flexible for use in disaster damage assessment because of its ability to observe regardless of the observation conditions. In SAR observations, sensors emit microwaves and record the amplitude and phase components of backscattered waves from the ground surface, which can then be analyzed to detect changes in the ground surface. SAR is also widely used to detect building damage, crustal deformation, land subsidence, landslides, etc., because it has information on microwave intensity and phase that is not available in optical images [8].
The early assessment of building damage is one of the most important issues in disaster response because the distribution of building damage is closely related to saving lives in emergencies [9]. Ge et al. compiled a comprehensive review of building damage assessment during disasters using SAR [10]. Generally, building damage extraction is performed by applying both pre-event and post-event data and is based on changes in the intensity, phase, and polarization characteristics of SAR images before and after a disaster. An approach to building damage assessment using only post-event data was also proposed for cases where ideal pre-event data are not available [11,12].
Using intensity images to determine the building damage caused by earthquakes, changes in backscatter coefficients are extracted as the building deforms before and after the earthquake. As with optical imagery, SAR intensity images were widely used for disaster monitoring [13,14]. The difference and correlation coefficients of backscatter coefficients are often used to detect building damage using intensity images [15,16,17]. Matsuoka and Yamazaki quantitatively analyzed the possibility of extracting damage distribution using ERS-1 data observed before and after the 1995 Kobe earthquake and found that the difference in backscatter coefficients was larger and the correlation coefficient was lower in severely damaged areas [18]. In addition, correlation coefficients are more sensitive to subtle changes in the ground surface than to intensity differences [19].
Extracting disaster damage using interferometric coherence requires frequent pre- and post-disaster observations, and if there are two pre-event images and one post-event image, it is possible to extract the change in interferometric coherence between the pre-event pair and the co-event pair. Interferometric coherence analysis was used for a variety of applications, including the use of coherence changes to identify tsunami damage and detect liquefied areas [20,21]. Coherence differential values and coherence ratios between co-event and pre-event are often used in the detection of earthquake building damage using coherence [22,23,24]. Arciniegas et al. studied building damage detection for the 2003 Bam and Iran earthquakes using the coherence differential values in ENVISAT images and showed that the detection accuracy was better than intensity differences [25]. Ito et al. proposed a damage estimation model based on the coherence ratio for the 1995 Kobe earthquake and validated it for the 1999 Kocaeli earthquake using ERS-1/2 SAR images [26,27]. Liu et al. studied the extraction of collapsed building areas from PALSAR-2 images for the 2016 Kumamoto earthquake concerning two indices, coherence and coherence ratio, and showed that they were more accurate than the intensity parameter [16].
Polarimetric analysis (PolSAR) was proposed to detect changes in the scattering mechanisms of surface targets before and after a disaster. For example, PolSAR analysis was examined during the 2011 Tohoku earthquake and is effective in detecting damaged and inundated areas [28,29]. Problems with this approach include the low spatial resolution in full polarimetry mode and a low number of observations.
We briefly describe the evolution of research on building damage detection as SAR resolution improves. Low-resolution sensors, such as ERS-1/2 and RADARSAT-1, launched in the 1990s, have difficulty identifying individual building features because a single pixel contains multiple ground targets. Therefore, the detection of building damage with low-resolution SAR is limited to block-by-block detection in which multiple targets are contained within a single block [15,20,23,24]. Since 2007, satellite-borne SARs, such as TerraSAR-X, COSMO-SkyMed, RADARSAT-2, and ALOS-2, achieved spatial resolutions of less than 3 m in the strip-map mode. These satellites have the potential to detect damage to individual buildings, and damage detection on a building-by-building basis is being considered [17,24,30].
The damage classification of damaged buildings when evaluating the detection of building damage by SAR varies depending on the purpose of the study and the building dataset, and many studies divided the damage into two broad classes: severely damaged buildings and other buildings. Liu et al. and Li et al. focused only on collapsed buildings among the damaged buildings [17,31]. Matsuoka et al. and Arciniegas et al. focused on particularly damaged buildings that were grade 4 or grade 5 in EMS-98 [18,25]. On the other hand, few studies analyzed the relationship between SAR images and the detailed damage extent, classifying each building according to the damage characteristics. Natsuaki et al. classified buildings one by one based on EMS-98 for the Kumamoto earthquake and analyzed the relationship with coherence in high-resolution SAR from ALOS-2 [32]. However, the sample size was only 186 buildings, and they were analyzed by subdividing by the damage level and building size, so they did not have a sufficient number of samples for some damage levels. Considering the application of SAR-based building damage detection to disaster response in Japan, it is necessary to quantitatively analyze the relationship between SAR images and the detailed damage characteristics surveyed in the Japanese residential damage assessment survey. However, EMS-98 evaluates the extent of damage to buildings as a whole, and no study examined the relationship between damage characteristics based on the items in the Japanese damage assessment survey. Paolo et al. validated the performance of SAR imagery in post-earthquake damage detection for emergency response management at several resolutions, and showed that COSMO-SkyMed StripMap HIMAGE images at 3 × 3 m resolution can detect damaged buildings relatively well and can be used effectively for emergency purposes [33]. The high-resolution mode of ALOS-2 has a similar resolution to COSMO-SkyMed StripMap HIMAGE and could be shown to be effective for post-earthquake damage assessment in Japan by examining the relationship between damage characteristics based on Japanese damage assessment surveys.
In this paper, we classified damaged buildings one by one according to their damage characteristics using a large dataset from the Japanese residential damage assessment survey, and we analyzed the relationship between the damage and high-resolution L-band SAR images. The intensity and coherence of ALOS-2 PALSAR-2 images of damaged buildings from the 2016 Kumamoto earthquake were analyzed to evaluate the possibility of building damage detection. The coherence was expected to include not only building damage but also the effects of ground deformation. Therefore, we focused on buildings with minor damage near the earthquake fault, and we examined the influence of ground deformation on coherence based on the relationship between the coherence value and the distance from the earthquake fault.

2. Kumamoto Earthquake and ALOS-2 Observation

A brief description of the 2016 Kumamoto earthquake is discussed in this paper: a magnitude 6.5 earthquake occurred in Kumamoto, Japan, on 14 April 2016, followed by a magnitude 7.3 earthquake on 16 April 2016. The main ground deformation occurred along the Futagawa and Hinagu faults, extending 40 km from southwest to northeast. In this paper, we focused on the damaged buildings in Mashiki Town and Uki City. Mashiki Town is the area where the earthquake caused significant damage to buildings, while Uki City is located some distance away from the earthquake fault and suffered relatively minor damage to buildings. The earthquake faults here are faults that were confirmed to have appeared on the ground surface during an earthquake. Figure 1 shows the location of Mashiki Town, Uki City, the Futagawa Fault, the Hinagu Fault, and the earthquake faults. Regarding the faults, we referred to the active fault map of the Geospatial Information Authority of Japan (GSI) [34].
JAXA conducted emergency ALOS-2 observations for disaster response, and ALOS-2 successfully observed almost all areas of the affected area in high-resolution mode with a ground resolution of 5 m. This paper used datasets observed on 7 March and 18 April 2016, and 11 and 30 March 2015. The satellite’s orbit was descending and the observations were conducted from east to west. Figure 2 shows the backscattering coefficient and the coherence images used for the analysis. The backscatter coefficient is a measure of the intensity of the received backscattered waves and is measured in dB. This index is explained in more detail in Section 3.2. The coherence is a dimensionless quantity with values ranging from 0 to 1, a measure of the degree of spatial interference between the phases of the two periods. The closer the value of the index to 0, the greater the change in the ground surface between the two periods. This indicator is described in more detail in Section 3.3. For the intensity images in Figure 2a,b, the areas with higher backscatter coefficients than the other areas were urban areas with dense buildings. For example, the area northwest of Mashiki Town is an urban area and is shown brighter than the surrounding area in the images (a) and (b). For the coherence image in Figure 2c, no major earthquakes occurred between the two time periods, and backscatter is stable in urban areas with dense man-made structures. Therefore, the coherence value is close to 1 and appears bright in the image. For the coherence image in Figure 2d, a large earthquake occurred between the two time periods, and the coherence value approaches 0 in the urban area of Mashiki Town, because many buildings collapsed and the ground surface changed significantly.

3. Methodology

3.1. Classification of the Damaged Buildings

In Japan, after a major disaster, the affected local governments conduct a damage assessment of buildings based on the Japanese residential damage assessment survey manual. This is an important assessment criterion because it is the basis for granting tax exemptions to disaster victims and support funds for building reconstruction. According to the manual established by the Cabinet Office, the degree of economic loss is determined by calculating the percentage of damage to each part of the building, such as walls and roofs, and then, adding them together to calculate the percentage of damage to the entire dwelling [7]. At that time, there were four categories of damage assessment: “Major damage”, “Moderate + damage (Mod+ damage)”, “Moderate-damage (Mod- damage)”, and “Minor damage”. The Japanese residential damage assessment is supplemented by comparison with other earthquake damage assessment methods applied outside Japan. Formisano et al. used the post-earthquake damage and safety assessment (AeDES) form implemented by the Italian Civil Protection Department (DPC) to assess the earthquake vulnerability of buildings [35]. AeDES was proposed to quickly and efficiently assess the safety of buildings after an earthquake. The evaluation is based on a systematic visual inspection of the building, including structural elements and non-structural elements such as windows, doors, and ceilings, and has some similarities with Japanese residential damage assessment in terms of survey methodology. Guidelines for prompt post-earthquake assessment of housing in Andalusia (Spain) were proposed, and the damage assessment presented in the guidelines combines the severity of the damage and the percentage of its spread to quantify the damage to the building and its risk [36]. This has some similarities with the Japanese residential damage assessment in terms of damage quantification.
In this paper, we collected and analyzed a large dataset of the results of damage assessment by the local government, survey sheets used for the assessment, and field photographs of the buildings at the time of the survey. To minimize the impact of variations in building size and characteristics on the results of our analysis, we only considered wooden structures among the residential buildings for which damage assessment surveys were conducted.
Of the four damage categories, “Major damage” could be determined without calculating the percentage of damage to each part of the building. Major damage is determined when the following characteristics are confirmed in the simple visual survey of the appearance.
  • The building collapsed;
  • The standard value of the unequal settlement due to the fact of ground subsidence or liquefaction was exceeded;
  • Seventy-five percent of the circumference of the foundation was destroyed or the building is distorted significantly;
  • The standard value of the building inclination without unequal settlement was exceeded.
In case these damage conditions are not found, a more detailed survey will be conducted. In a detailed survey, the percentage of damage to the roof and the percentage of damage to the walls and foundation are each calculated, and if the total percentage of damage is 50% or more, the building is considered to be Major damage. The percentage of damage to walls and roofs is set to be larger than that to walls and foundations. Figure 3 shows an example of a building determined to be categorized as Major damaged due to the fact of each type of damage and an example of a building determined to be Major damaged based on a detailed survey. No buildings damaged by unequal subsidence were identified among the subject buildings. The damaged buildings in Figure 3 show that the damage varied greatly from building to building, even though they were all classified as Major damage. Some of the previous studies attempted to extract damage separately for buildings classified as Major damage and others [15], but the large variation in the damage characteristics of buildings classified as Major damage possibly affected the results of the extraction.
In this paper, to understand the sensitivity of the SAR observations to each type of damage, buildings with Major damage were classified according to the type of damage and then analyzed. Based on the survey sheets used for damage assessment and field photographs of damaged buildings, we classified the buildings with Major damage, 1469 in Mashiki Town and 251 in Uki City, into five classes. The five classes of buildings with Major damage, as well as Minor damage, Mod- damage, and Mod+ damage, are shown in Table 1. Table 1 summarizes the characteristics and number of buildings in each damage class. A total of 4650 buildings in Mashiki Town and 6292 buildings in Uki City are treated. Table 1 also shows the correspondence between Class 1 through Class 5 and the pictures of the Major damage buildings in Figure 3. Classes 1 and 2 mainly include buildings that were determined to be in the Major damage category by detailed surveys and buildings with foundation circumferences of 75% or more. Both classes are damaged without building deformation. Class 3, Class 4, and Class 5 are buildings that were determined to be in the Major damage category by the simple visual survey of appearance and have damage that can be judged visually from the exterior with deformation of the building.
The differences between the proposed damage classification and the European Macroseismic Scale 1998 (EMS-98), which is commonly used for building damage assessment, are explained. In EMS-98, the damage is defined by grade for masonry buildings and reinforced concrete buildings, but damage is not defined in detail for wooden buildings due to the small number of such buildings in Europe [37]. The buildings targeted in this study were wooden buildings, and the proposed damage classification focused on wooden buildings that are determined to be Major damage. Additionally, while EMS-98 classifies buildings by the degree of damage, the proposed damage classification classifies buildings by their dominant damage characteristics, such as roof damage, collapse, and distortion.
The number of undamaged buildings in both Mashiki Town and Uki City is extremely small in the building data treated in this paper, making it impossible to compare buildings in each damaged class with those in the undamaged class. Therefore, buildings categorized as Minor damage were treated as a class of buildings with little change in the SAR observations due to the earthquake.

3.2. Backscattering Coefficient

The backscatter coefficient is the ratio of the power of the scattered wave at the radar position from the unit ground surface to the power of the scattered wave when microwaves incident on the unit ground surface are scattered uniformly, and it is an indicator of the strength of the received wave. Since the power of the received wave varies depending on the observation conditions, such as the distance between the satellite and the Earth’s surface, wavelength, and angle of incidence, it can be converted to a backscattering coefficient to enable comparison between images with different observation conditions. The formula for the backscatter coefficient in the case of ALOS-2 PALSAR-2, which was the subject of this paper, is shown in Equation (1) [38]:
σ 0 [ d B ] = 10 log 10 D N 2 + C F 1
where σ0 is the backscatter coefficient, DN is the brightness value (intensity) of the image, and CF1 is a constant determined by JAXA, the operational source. 〈〉 denotes the averaging process.
We used the correlation coefficient R of the backscatter coefficient as a measure of the intensity in our analysis. R was calculated from the intensity images at the two time periods before and after the earthquake. The correlation coefficient R is expressed in Equation (2):
R = N i = 1 N σ a σ b i = 1 N σ a i = 1 N σ b ( N i = 1 N σ a 2 ( i = 1 N σ a ) 2 ) ( N i = 1 N σ b 2 ( i = 1 N σ b ) 2 )
where σa is the backscatter coefficient before the earthquake on 7 March 2015, and σb is the backscatter coefficient after the earthquake on 18 April 2016. N refers to the number of pixels within the window size to be calculated. R is calculated by the window size centered on the pixel that overlaps the center of gravity of the building polygon. The ground resolution of the high-resolution mode of PALSAR-2 is approximately 5 m. To increase the area ratio of the building within the window, the window size in this study was set to 3 × 3 pixels.

3.3. Coherence

Coherence is a measure of the degree of spatial interference between the phases of two time periods with values ranging from 0 to 1. It measures the alignment of the phases within a window size region of the calculation. If the observed ground surface changes between the two periods, the distance from the satellite changes and, thus, the phase varies. Thus, coherence responds to changes in the Earth’s surface, and since it has sensitivity below the wavelength of microwaves, it can be used as an indicator of changes in the Earth’s surface.
The coherence is obtained by aligning SAR images from two periods with similar observation conditions and then calculating the complex correlation. When the two-time SAR images are C1 and C2, and the coherence is γ, the formula for calculating the coherence is as shown in Equation (3).
γ = | C 1 C 2 ¯ | | C 1 | 2 | C 2 | 2
C ¯ represents the conjugate of the complex number C, and 〈〉 represents the averaging process. The coherence calculation is obtained using C1 and C2 contained within the window size. As with the correlation coefficient R, the window size was 3 × 3 pixels. The coherence of the building was the coherence of the pixel overlapping the center of gravity of the building polygon.
We used the coherence differential value γdif as a measure of coherence in our analysis. γdif was calculated using two pre-earthquake and one post-earthquake ALOS-2 PALSAR-2 image. The coherence differential value γdif is expressed as in Equation (4).
γ d i f = γ p r e γ c o
γpre refers to the coherence calculated for the pre-event pair, and γco refers to the coherence calculated for the co-event pair. The reason for taking the difference from γpre here is to reduce the influence of the spatial positioning of the satellite and the noise randomly generated by vegetation. γdif takes values between −1 and 1 and approaches 1 when the change in the ground surface is large and the phase coherence is poor.

3.4. Extraction of Indices

This section describes the process of extracting indicators contained in SAR images of buildings. Figure 4 shows a flowchart of the research process that includes dataset creation. The point data that represent building centers are created from 3D LiDAR point clouds provided by [39] to extract the indices of the pixels overlapping the center of the building. Specifically, the centroids of building roofs in the point clouds are computed. Then, the building centers are obtained by projecting the centroids onto the ground plane. After geocoding the backscatter coefficients and coherence images, they were superimposed on the building center data to extract indices for each period. R and γdif for each building were calculated and used as a dataset from the extracted indices.

4. Results

4.1. Correlation Coefficient of the Backscatter Coefficient R

A box-and-whisker diagram of the correlation coefficient R for each damage class is shown in Figure 5. The vertical axis shows the correlation coefficient R, and the horizontal axis shows the damage class. Classes 1 through 5 are damage classes for buildings that were classified as Major damage. Values more than 1.5 times the interquartile range (IQR) away from the first and third quartiles were judged to be outliers and represented by white dots in the figure. For Mashiki Town, the median values for Minor damage, Mod- damage, and Mod+ damage were similar at 0.73, 0.70, and 0.72, respectively, and there was no significant difference in the quartile range. The medians of Class 1, 2, 3, 4, and 5 for Major damage were 0.62, 0.64, 0.56, 0.51, and 0.45, decreasing as the damage increased, and the interquartile range also tended to be lower. For Uki City, the median values for Minor damage, Mod- damage, and Mod+ damage were similar at 0.90, 0.88, and 0.89, respectively, and the quartile range fell within the range of 0.75 to 1.0. The medians of Class 1, 2, 3, 4, and 5 for Major damage were 0.81, 0.85, 0.86, 0.82, and 0.73, respectively, and although Class 5 had a relatively low value, it did not show the same decreasing trend as Mashiki Town. The quartile range also showed no clear decreasing trend even when the damage class increased, except for Class 5.
To test for significant differences between Mashiki Town and Uki City in damage class, the Mann–Whitney U test was conducted for each damage class. Since the distribution of the correlation coefficient R was not confirmed to be normal, this test method was employed. The Mann–Whitney U test is one of the nonparametric tests used to test the difference of medians between two independent samples [40]. As it is a nonparametric test, this test can be used when the distribution does not follow a normal distribution. The sample size was set to 20, in line with Class 5 in Uki City, which had a smaller number of buildings, and the significance level was set at 0.05. The results of the test are shown in Table 2. Yellow cells indicate that there was a significant difference. Significant differences were found between Mashiki Town and Uki City in all damage classes.
The Mann–Whitney U test was also conducted to examine significant differences between damage classes. The results of the test are shown in Table 3. For the results for Mashiki Town, only Class 5 showed significant differences in all comparisons between Minor damage, Mod- damage, and Mod+ damage. Two sets of significant differences were found in the test between Major damage classes: Class 5–Class 1 and Class 5–Class 4. Regarding the results for Uki City, there was no class of Major damage buildings for which a significant difference was confirmed in all comparisons between Minor damage, Mod- damage, and Mod+ damage. There were also no combinations where there were significant differences in the tests between the Major damage classes.

4.2. Coherence Differential Value γdif

A box-and-whisker diagram of the coherence differential value γdif for each damage class is shown in Figure 6. The vertical axis shows the coherence differential value γdif, and the horizontal axis shows the damage class. Class 1 through Class 5 are the damage classes for the buildings categorized as Major damage. As in Figure 5, values more than 1.5 times the IQR away from the first and third quartiles were determined to be outliers and represented by white dots in the figure. For Mashiki Town, the median values for Minor damage, Mod- damage, and Mod+ damage were 0.26, 0.34, and 0.37, respectively, increasing with the severity of the damage, and the quartile range also increased. The medians of Class 1, 2, 3, 4, and 5 for Major damage were 0.44, 0.41, 0.47, 0.53, and 0.56, respectively, and increased as the damage increased, with the quartile range also increasing. For Uki City, the median values for Minor damage, Mod- damage, and Mod+ damage were 0.06, 0.10, and 0.15, respectively, increasing with greater damage, and the interquartile range was also increasing. The medians of Class 1, 2, 3, 4, and 5 for destruction were 0.16, 0.18, 0.20, 0.24, and 0.27, respectively, increasing with greater damage, and all classes of Major damage were at least 0.2 lower than those in Mashiki Town. The quartile range showed no clear decreasing trend even as the damage class increased, except for Class 5.
To examine the significant differences between Mashiki Town and Uki City in the damage classes, we ran the Mann–Whitney U test on each damage class, as well as the correlation coefficient R. The results of the test are presented in Table 4. The yellow cells indicate that a significant difference was determined. All damage classes found significant differences between Mashiki Town and Uki City.
The Mann–Whitney U test was conducted to examine the significant differences between the damage classes. The results of the test are shown in Table 5. For the results for Mashiki Town, significant differences were found in Classes 3, 4, and 5 for all comparisons between Minor damage, Mod- damage, and Mod+ damage. The four groups that showed significant differences in the test between the Major damage classes were Class 5–Class 1, Class 5–Class 2, Class 3–Class 2, and Class 4–Class 2. Regarding the results for Uki City, Class 4 and 5 were the Major damage classes for which significant differences were confirmed in all comparisons between Minor damage, Mod- damage, and Mod+ damage. The four combinations with significant differences in the test between Major damage classes were Class 5–Class 1, Class 5–Class 2, Class 5–Class 3, and Class 4–Class 1.

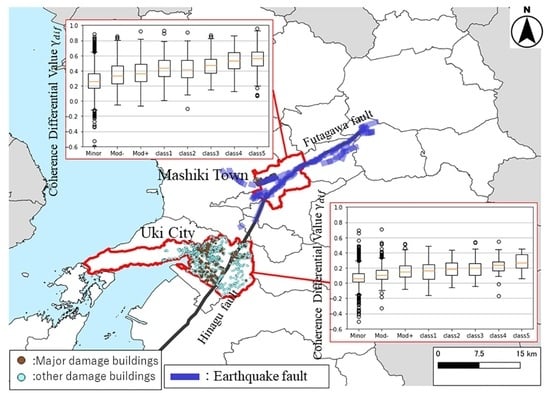
4.3. Relationship between Earthquake Faults and the Coherence Differential Value γdif

Significant differences in the coherence differential value γdif between Class 1, 2, and buildings categorized as Minor damage were observed in both Mashiki Town and Uki City. Class 1 and 2 were buildings with damage to walls and roofs that did not deform the building, and the significant difference between Class 1, 2, and Minor damage was thought to be due to the presence of factors other than building damage. Kagawa et al. examined the effect of ground deformation on coherence by simulation and found that changes in ground slope had a significant effect on coherence [41]. This suggests that the significant difference between Class 1, 2, and Minor damage was influenced by ground displacement.
To confirm the effect of the ground deformation on coherence, we analyzed the relationship between the distance from the damaged building to the earthquake fault and the difference in coherence, γdif, for buildings categorized as Minor damage in Mashiki Town. Since there are no data documenting ground deformation over the entire affected area, the distance from the earthquake fault was applied as a rough indicator of the degree of ground deformation, assuming that the closer one was to the earthquake fault that appeared on the ground surface during the earthquake, the greater the ground deformation. The target buildings were selected as Minor damage buildings because the damage was minor and the variation in coherence due to the fact of changes in the buildings was small. Figure 7 shows the distribution of earthquake faults and buildings categorized as Minor damage. The locations of the earthquake faults were based on the active fault maps published by the Geospatial Information Authority of Japan [34].
The distance from the buildings categorized as Minor damage to the earthquake fault was divided into 100 m increments, and a box-and-whisker diagram of the coherence differential value γdif for each distance category is shown in Figure 8. The median value of γdif within 100 m of the earthquake fault was 0.37, and the median value of γdif above 700 m was 0.17. The median value tended to decrease as the distance from the earthquake fault increased. The interquartile range also tended to take lower values as the distance increased, and the range became narrower.

5. Discussion

5.1. Factors Affecting the Correlation Coefficient R and Sensitivity to Building Damage

In R for Mashiki Town and Uki City, the median value for the same damage class was lower in Mashiki Town, confirming a significant difference between the two areas in all damage classes (Figure 5, Table 2). The reason why the R values of the buildings in Mashiki Town tended to be lower and noncorrelated even for buildings with the same damage characteristics may be that Mashiki Town had a higher concentration of Major damage buildings than Uki City (Figure 9), and the backscatter characteristics of the target buildings were altered by the collapse of adjacent buildings and their debris.
Classes 3, 4, and 5 are damage classes involving building deformation, and the median and interquartile range tended to decrease with more deformed damage. Except for the Mod- buildings in Uki City, the Class 5 collapsed buildings show significant differences from the Mod+ damage and below, and R is likely to be lower for buildings deformed to the point of collapse. However, for Class 3 and 4 buildings with large distortion or tilt in Uki City, there was no significant difference from those in the Mod+ damage or below class, suggesting that the change in R due to the fact of building damage, such as distortion or tilting, was small. Significant differences were determined for Class 3 buildings in Mashiki Town compared to the Minor and Mod+ classes, but this may be due to factors other than damage to the target buildings, such as debris around the buildings and adjacent buildings.
For Classes 1 and 2, which do not involve building deformation, there was also not a significant enough difference from all classes below Mod+ damage to suggest that damage, such as peeling roofs and cracked or peeling walls, may have had little effect on R.

5.2. Factors Causing Changes in the Coherence Differential Value γdif and Sensitivity to Building Damage

The increase in γdif was caused by an increase in the random displacement of scatterers on the ground surface. Compared to γdif in Uki City, the median values for all damage classes in Mashiki Town were higher by more than 0.2, confirming a significant difference between the two regions (Figure 6, Table 4). Similar to R, buildings with the same damage tended to differ between the two regions, but the trend was more pronounced for γdif. The reason for the different trends could be the effects of the debris and adjacent building damage other than damage to the subject building as in R. In addition, the correlation between γdif, and the distance from the earthquake fault for buildings categorized as Minor damage in Mashiki Town suggests that ground deformation may be related.
Classes 3, 4, and 5 are damage classes involving building deformation, and the median and interquartile range tended to increase with more deformed damage. Significant difference tests with the classes of Mod+ damage and below confirmed significant differences in Classes 3, 4, and 5 in Mashiki Town and Classes 4 and 5 in Uki City. This suggests that not only collapsed buildings but also building deformation, such as tilting and distortion, affect γdif.
For Classes 1 and 2 without building deformation, the difference between Classes 1 and 2 was not significant between the classes with and without roof damage, and so, γdif did not change due to the small random displacement caused by roof damage. Since we can confirm a significant difference between Classes 1 and 2, and buildings whose damage was Minor, damage such as cracks and peeling of walls may affect γdif. However, since the difference was not significant enough between Mod- damage and Mod+ damage, damage without building deformation was not suitable for detection by γdif.
Comparing the sensitivity of R and γdif to building damage, the median and interquartile range for each damage class and the results of significance tests indicate that γdif was more sensitive to both damages with and without building deformation. However, upon reviewing the overall distribution of each damage class, there were many overlapping areas, and it was difficult to determine the damage with a high degree of accuracy using γdif alone, and so, some additional effort was required, such as adding an indicator or applying a correction to γdif.

5.3. Influence of Earthquake Fault on the Coherence Differential Value γdif

Figure 8 shows that γdif tended to be larger at smaller distances from the earthquake fault. The increase in γdif occurred when different directions or amounts of displacement occurred at the ground surface and there was a nonuniform phase change within the coherence window size. Buildings categorized as Minor damage were not considered to affect the phase difference, indicating that the ground deformation was greater closer to the earthquake fault.
However, there was variation in the value of γdif even in the same distance category, and the distance from the fault alone did not accurately represent local ground deformation, and it was not possible to separate components due to the fact of ground displacement from those due to the fact of building damage from γdif. Fujiwara et al. used SAR interferograms from ALOS-2 to extract the lineaments of the Kumamoto earthquake, and the lineaments represented earthquake faults, liquefaction, and landslides [42]. The locations of earthquake faults surveyed by GSI overlapped well with the locations of the lineaments, and more lineaments were found than earthquake faults. Lineaments were thought to capture ground deformation in more detail and possibly provide a clearer assessment of the impact of ground deformation when compared to γdif.

6. Conclusions

The purpose of this paper was to correctly evaluate the relationship between building damage characteristics and SAR images. First, to evaluate the damage characteristics of the buildings in detail, the 1469 buildings in Mashiki Town and 251 buildings in Uki City categorized as Major damage were classified into five new damage classes based on the field photographs and damage survey sheets. Then, to analyze the characteristics of backscatter from ALOS-2 PALSAR-2 observations, we compiled a box-and-whisker diagram of the correlation coefficient R of the backscatter coefficient and the coherence differential value γdif, and conducted a significance difference test between the damage classes.
The results showed that the backscatter characteristics of the SAR images showed different trends for different damage classes. The R tended to decrease for large deformations such as collapsed buildings. On the other hand, damage with small or no deformation, such as distortion, tilting, or damage to building surfaces, had little effect on the R. The γdif was likely to be sensitive not only to collapsed buildings but also to damage with relatively small deformation, such as distortion and tilting, while it was stable for walls and roofs without deformation. The types of building damage to which the values are sensitive were identified for each of the R and the γdif. However, even though each damage class showed different trends, there were many overlapping areas in the overall distribution of both R and γdif for each damage class, and improvements are needed to detect building damage with high accuracy. A comparison of the damaged buildings in Mashiki Town and Uki City in the same class and the relationship with the distance of buildings categorized as Minor damage from the earthquake faults suggest that the ground deformation near the earthquake fault affected γdif.
Finally, the scope of further research will be discussed. The buildings included in this study were limited to wood-frame houses, and in order to understand the relationship between damage levels and SAR images for other building types, a new dataset of damage levels for that type of building would need to be created and analyzed. In addition, since the present analysis did not take into account the condition of the soil beneath the building, one area for further study would be to analyze the backscatter characteristics of the SAR images linking geological conditions and building damage levels.

Author Contributions

Conceptualization, S.C. and M.M.; methodology, S.C. and M.M.; formal analysis, S.C.; investigation, S.C. and M.M.; data curation, H.X.; writing—original draft preparation, S.C.; writing—review and editing, H.X. and M.M.; visualization, S.C. All authors have read and agreed to the published version of the manuscript.

Funding

This research was funded by the Japanese Society for the Promotion of Science (JSPS) Grants-in-Aid for Scientific Research (KAKENHI), grant number: #20H02411 and #23H01654.

Data Availability Statement

Not applicable.

Acknowledgments

The building damage assessment survey data used in this study were provided by the town of Mashiki and the city of Uki, Kumamoto Prefecture, as part of the Tokyo Metropolitan Resilience Project of the Ministry of Education, Culture, Sports, Science, and Technology (MEXT) of the Japanese Government, the National Research Institute for Earth Science and Disaster Resilience (NIED), and Niigata University.

Conflicts of Interest

The authors declare no conflict of interest.

References

  1. Doocy, S.; Daniels, A.; Packer, C.; Dick, A.; Kirsch, T.D. The human impact of earthquakes: A historical review of events 1980-2009 and systematic literature review. PLoS Curr. 2013, 5. [Google Scholar] [CrossRef] [PubMed]
  2. Que, Y.; Dai, Y.; Ji, X.; Kwan Leung, A.; Chen, Z.; Jiang, Z.; Tang, Y. Automatic classification of asphalt pavement cracks using a novel integrated generative adversarial networks and improved VGG model. Eng. Struct. 2023, 277, 115406. [Google Scholar] [CrossRef]
  3. Tang, Y.; Huang, Z.; Chen, Z.; Chen, M.; Zhou, H.; Zhang, H.; Sun, J. Novel visual crack width measurement based on backbone double-scale features for improved detection automation. Eng. Struct. 2023, 274, 115158. [Google Scholar] [CrossRef]
  4. Sahar, S.M.; Pradhan, B. Challenges and limitations of earthquake-induced building damage mapping techniques using remote sensing images—A systematic review. Geocarto Int. 2021, 37, 6186–6212. [Google Scholar]
  5. Kucharczyk, M.; Hugenholtz, C.H. Remote sensing of natural hazard-related disasters with small drones: Global trends, biases, and research opportunities. Remote Sens. Environ. 2021, 264, 112577. [Google Scholar] [CrossRef]
  6. Kakku, K. Satellite remote sensing for disaster management support: A holistic and staged approach based on case studies in Sentinel Asia. Int. J. Disaster Risk Reduct. 2019, 33, 417–432. [Google Scholar] [CrossRef]
  7. Cabinet Office, Manual for Implementation System of Residential Damage Recognition Work Related to Disasters. Available online: http://www.bousai.go.jp/taisaku/pdf/h3003saigai_tebiki_full.pdf (accessed on 27 November 2022). (In Japanese)
  8. Plank, S. Rapid Damage Assessment by Means of Multi-Temporal SAR—A Comprehensive Review and Outlook to Sentinel-1. Remote Sens. 2014, 6, 4870–4906. [Google Scholar] [CrossRef]
  9. Xie, S.; Duan, J.; Liu, S.; Dai, Q.; Liu, W.; Ma, Y.; Guo, R.; Ma, C. Crowdsourcing Rapid Assessment of Collapsed Buildings Early after the Earthquake Based on Aerial Remote Sensing Image: A Case Study of Yushu Earthquake. Remote Sens. 2016, 8, 759. [Google Scholar] [CrossRef]
  10. Ge, P.; Gokon, H.; Meguro, K. A review on synthetic aperture radar-based building damage assessment in disasters. Remote Sens. Environ. 2020, 240, 111693. [Google Scholar] [CrossRef]
  11. Polli, D.A.; Dell’Acqua, F.; Lisini, G. Automatic mapping of earthquake damage using post-event radar satellite data: The story goes on. In Proceedings of the 30th EARSeL Symposium, Paris, France, 31 May–3 June 2010; pp. 565–572. [Google Scholar]
  12. Graves, R. Using a grid-search approach to validate the Graves–Pitarka broadband simulation method. Earth Planets Space 2022, 74, 186. [Google Scholar] [CrossRef]
  13. Stramondo, S.; Bignami, C.; Chini, M.; Pierdicca, N.; Tertulliani, A. Satellite radar and optical remote sensing for earthquake damage detection: Results from different case studies. Int. J. Remote Sens. 2006, 27, 4433–4447. [Google Scholar] [CrossRef]
  14. Brunner, D.; Lemoine, G.; Bruzzone, L. Earthquake Damage Assessment of Buildings Using VHR Optical and SAR Imagery. IEEE Trans. Geosci. Remote Sens. 2010, 48, 2403–2420. [Google Scholar] [CrossRef]
  15. Nojima, N.; Matsuoka, M.; Sugito, M.; Ezaki, K. Quantitative estimation of building damage based on data integration of seismic intensities and satellite SAR imagery. J. Struct. Mech. Earthq. Eng. 2006, 62, 808–821. (In Japanese) [Google Scholar] [CrossRef]
  16. Liu, W.; Yamazaki, F. Extraction of Collapsed Buildings in the 2016 Kumamoto Earthquake Using Multi-Temporal PALSAR-2 Data. J. Disaster Res. 2017, 12, 2. [Google Scholar] [CrossRef]
  17. Miura, H.; Midorikawa, S.; Matsuoka, M. Building Damage Assessment Using High-Resolution Satellite SAR Images of the 2010 Haiti Earthquake. Earthq. Spectra 2016, 32, 591–610. [Google Scholar] [CrossRef]
  18. Matsuoka, M.; Yamazaki, F. Use of Satellite SAR Intensity Imagery for Detecting Building Areas Damaged due to Earthquakes. Earthq. Spectra 2004, 20, 975–994. [Google Scholar] [CrossRef]
  19. Liu, W.; Yamazaki, F. Urban change monitoring from multi-temporal TerraSAR-X images. In 2011 Joint Urban Remote Sensing Event; IEEE: Munich, Germany, 2011; pp. 277–280. [Google Scholar]
  20. Tamura, M.; ElGharbawi, T. Mapping damage in Ishinomaki city due to the 2011 Tohoku Earthquake using. In: SAR coherence change. In Proceedings of the 58th Spring Conference of the Remote Sensing Society of Japan, Chiba, Japan, 2–3 June 2015; pp. 29–30. (In Japanese). [Google Scholar]
  21. Kobayashi, T.; Tobita, M.; Koarai, M.; Otoi, K.; Nakano, T. Liquefaction area associated with the 2011 off the Pacific coast of Tohoku earthquake inferred from interferometric SAR coherence change. J. Geosp. Inf. Auth. Jpn. 2011, 122, 143–151. [Google Scholar]
  22. Hoffmann, J. Mapping damage during the Bam (Iran) earthquake using interferometric coherence. Int. J. Remote Sens. 2007, 28, 1199–1216. [Google Scholar] [CrossRef]
  23. Fielding, E.J.; Talebian, M.; Rosen, P.A.; Nazari, H.; Jackson, J.A.; Ghorashi, M.; Walker, R. Surface ruptures and building damage of the 2003 Bam, Iran, earthquake mapped by satellite synthetic aperture radar interferometric correlation. J. Geophys. Res. 2005, 110, B03302. [Google Scholar] [CrossRef]
  24. Watanabe, M.; Thapa, R.B.; Ohsumi, T.; Fujiwara, H.; Yonezawa, C.; Tomii, N.; Suzuki, S. Detection of damaged urban areas using interferometric SAR coherence change with PALSAR-2. Earth Planet Sp. 2016, 68, 131. [Google Scholar] [CrossRef]
  25. Arciniegas, G.A.; Bijker, W.; Kerle, N.; Tolpekin, V.A. Coherence- and Amplitude-Based Analysis of Seismogenic Damage in Bam, Iran, Using ENVISAT ASAR Data. IEEE Trans. Geosci. Remote Sens. 2007, 45, 1571–1581. [Google Scholar] [CrossRef]
  26. Ito, Y.; Hosokawa, M. Damage estimation model using temporal coherence ratio. IEEE Int. Geosci. Remote Sens. Symp. 2002, 5, 2859–2861. [Google Scholar]
  27. Ito, Y.; Hosokawa, M.; Matsuoka, M. A degree estimation model of earthquake damage using temporal coherence ratio. IGARSS 2003. 2003 IEEE Int. Geosci. Remote Sens. Symposium. Proc. 2003, 4, 2410–2412. [Google Scholar]
  28. Sato, M.; Chen, S.W.; Satake, M. Polarimetric SAR analysis of tsunami damage following the March 11, 2011 East Japan Earthquake. Proc. IEEE 2012, 100, 2861–2875. [Google Scholar] [CrossRef]
  29. Watanabe, M.; Motohka, T.; Miyagi, Y.; Yonezawa, C.; Shimada, M. Analysis of urban areas affected by the 2011 off the pacific coast of Tohoku Earthquake and Tsunami with L-band SAR full-polarimetric mode. IEEE Geosci. Remote Sens. Lett. 2012, 9, 472–476. [Google Scholar] [CrossRef]
  30. Bouaraba, A.; Younsi, A.; Aissa, A.B.; Acheroy, M.; Milisavljevic, N.; Closson, D. Robust techniques for coherent change detection using COSMO-SkyMed SAR images. Prog. Electromagn. Res. M 2012, 22, 219–232. [Google Scholar] [CrossRef]
  31. Li, X.; Guo, H.; Zhang, L.; Chen, X.; Liang, L. A New Approach to Collapsed Building Extraction Using RADARSAT-2 Polarimetric SAR Imagery. IEEE Geosci. Remote Sens. Lett. 2012, 9, 677–681. [Google Scholar]
  32. Natsuaki, R.; Nagai, H.; Tomii, N.; Tadono, T. Sensitivity and Limitation in Damage Detection for Individual Buildings Using InSAR Coherence—A Case Study in 2016 Kumamoto Earthquakes. Remote Sens. 2018, 10, 245. [Google Scholar] [CrossRef]
  33. Mazzanti, P.; Scancella, S.; Virelli, M.; Frittelli, S.; Nocente, V.; Lombardo, F. Assessing the Performance of Multi-Resolution Satellite SAR Images for Post-Earthquake Damage Detection and Mapping Aimed at Emergency Response Management. Remote Sens. 2022, 14, 2210. [Google Scholar] [CrossRef]
  34. Geospatial Information Authority of Japan, Outline of 1:25,000 Active Fault Map “Kumamoto. Revised Edition”. Available online: https://www.gsi.go.jp/bousaichiri/afm_kouhyou201710_kumamoto.html (accessed on 27 November 2022).
  35. Formisano, A.; Chieffo, N. Seismic damage scenarios induced by site effects on masonry clustered buildings: A case study in south Italy. Int. J. Archit. Herit. 2022, 17, 262–283. [Google Scholar] [CrossRef]
  36. Mascort-Albea, E.J.; Canivell, J.; Jaramillo-Morilla, A.; Romero-Hernández, R.; Ruiz-Jaramillo, J.; Soriano-Cuesta, C. Action Protocols for Seismic Evaluation of Structures and Damage Restoration of Residential Buildings in Andalusia (Spain): “IT-Sismo” APP. Buildings 2019, 9, 104. [Google Scholar] [CrossRef]
  37. Grunthal, G. (Ed.) European Macroseismic Scale 1998; Centre Europeen de Geodynamique et de Seismologie: Luxembourg, 1998. [Google Scholar]
  38. JAXA, Calibration Result of ALOS-2. Available online: https://www.eorc.jaxa.jp/ALOS/jp/alos-2/a2_calval_j.htm (accessed on 1 December 2022).
  39. Xiu, H.; Shinohara, T.; Matsuoka, M.; Inoguchi, M.; Kawabe, K.; Horie, K. Collapsed Building Detection Using 3D Point Clouds and Deep Learning. Remote Sens. 2020, 12, 4057. [Google Scholar] [CrossRef]
  40. Mcknight, P.E.; Najab, J. Mann-Whitney U Test. Corsini Encycl. Psychol. 2010. [Google Scholar] [CrossRef]
  41. Kagawa, K.; Ogushi, F.; Matsuoka, M. Extraction of building damage from coherence and backscatter intensity of PALSAR-2 imagery observed in the affected areas of the 2016 Kumamoto earthquake. J. Soc. Saf. Sci. 2016, 38, 185–186. (In Japanese) [Google Scholar]
  42. Fujiwara, S.; Yarai, H.; Kobayashi, T.; Morishita, Y.; Nakano, T.; Miyahara, B.; Nakai, H.; Miura, Y.; Ueshiba, H.; Kakiage, Y.; et al. Small-displacement linear surface ruptures of the 2016 Kumamoto earthquake sequence detected by ALOS-2 SAR interferometry. Earth Planets Space 2016, 68, 160. [Google Scholar] [CrossRef]
Figure 1. Study areas in the Kumamoto Prefecture, Japan. The black lines show the Futagawa and Hinagu faults, and the blue lines show the location of the earthquake fault. Municipal administrative boundaries and shoreline data were provided by GSI.
Remotesensing 15 02181 g001
Figure 2. These are ALOS-2PALSAR-2 images of the areas affected by the Kumamoto earthquake. The areas circled in red are the study areas: (a) backscatter coefficient image of the 7 March 2016 pre-event; (b) backscatter coefficient image of the 18 April 2016 post-event; (c) coherence image of the 30 November 2015–7 March 2016 pre-event pair; (d) coherence image of the 7 March 2016–18 April 2016 co-event pair.
Remotesensing 15 02181 g002
Figure 3. Photographs of the buildings classified as Major damage.
Remotesensing 15 02181 g003
Figure 4. Flowchart of the research process. The SAR images and the point data representing the building center were created and superimposed to obtain the SAR images parameters at each building. R and γdif were calculated from the parameters for each building to create a dataset, which was then used for statistical analysis.
Remotesensing 15 02181 g004
Figure 5. Box-and-whisker plots of the correlation coefficient of the backscatter coefficient R for each damage class.
Remotesensing 15 02181 g005
Figure 6. Box-and-whisker plots of the coherence differential value γdif for each damage class.
Remotesensing 15 02181 g006
Figure 7. Distribution map of the buildings categorized as Minor damage and the earthquake faults in Mashiki Town (blue dots indicate the Minor damage buildings, and red lines indicate the earthquake faults). Building points and the earthquake faults are plotted on the map provided by ESRI.
Remotesensing 15 02181 g007
Figure 8. Relationship between the distance from the fault and the coherence differential value γdif for the buildings categorized as Minor damage.
Remotesensing 15 02181 g008
Figure 9. Distribution map of the buildings categorized as Major damage in Mashiki Town and Uki City (brown dots indicate the Major damage buildings).
Remotesensing 15 02181 g009
Table 1. Characteristics of each damage class and the number of buildings.
Damage ClassCharacteristics of DamageCorrespondence
to Figure 3
Number of Buildings
Mashiki TownUki City
Major damage Class 5Collapsed(a)39921
Class 4Large interlayer deformation (not collapsed)(b)13222
Class 3Large distortion or large inclination(c)19264
Class 2Damage to roof and walls (including foundation)(e)39289
Class 1Damage to walls (including foundation)(d), (f)35456
Mod+ damage40~50% of economic damage to the building-386177
Mod- damage20~40% of economic damage to the building-1001672
Minor damageBelow 20% of economic damage to the building-26955191
Total46506292
Table 2. Results of significant difference test for Mashiki Town and Uki City in R of each damage class (yellow indicates a significant difference was determined).
Damage ClassMinorMod-Mod+Class 1Class 2Class 3Class 4Class 5
p-Value7.2 × 10−31.2 × 10−21.5 × 10−36.7 × 10−38.3 × 10−31.5 × 10−49.6 × 10−31.7 × 10⁻³
Table 3. Results of the significant difference test for R between the damage classes (yellow indicates a significant difference was determined).
Mashiki Town
MinorMod-Mod+ Class 1Class 2Class 3Class 4Class 5
Class 16.7 × 10−23.2 × 10−12.6 × 10⁻¹Class 1-3.0 × 10−11.1 × 10−14.3 × 10−12.7 × 10−2
Class 21.6 × 10−21.2 × 10−11.1 × 10⁻¹Class 2--2.7 × 10−12.8 × 10−16.0 × 10⁻²
Class 35.3 × 10−38.6 × 10−23.8 × 10⁻²Class 3---1.3 × 10−11.9 × 10−1
Class 46.3 × 10−23.1 × 10−12.7 × 10⁻¹Class 4----1.9 × 10⁻²
Class 51.1 × 10−41.4 × 10−32.4 × 10⁻³Class 5-----
Uki City
MinorMod-Mod+ Class 1Class 2Class 3Class 4Class 5
Class 18.2 × 10−24.1 × 10−11.1 × 10⁻¹Class 1-1.9 × 10−12.9 × 10−13.2 × 10−17.8 × 10−2
Class 23.2 × 10−23.4 × 10−13.6 × 10⁻²Class 2--1.9 × 10−13.2 × 10−12.4 × 10⁻¹
Class 37.4 × 10−22.1 × 10−11.2 × 10⁻¹Class 3---2.4 × 10−17.4 × 10−2
Class 45.7 × 10−24.3 × 10−16.7 × 10⁻²Class 4----1.1 × 10⁻¹
Class 51.0 × 10−21.4 × 10−19.0 × 10⁻³Class 5-----
Table 4. Results of the significant difference test for Mashiki Town and Uki City in γdif of each damage class (yellow indicates a significant difference was determined).
Damage ClassMinorMod-Mod+Class 1Class 2Class 3Class 4Class 5
p-Value6.9 × 10−77.1 × 10−69.0 × 10−51.0 × 10−66.9 × 10−72.0 × 10−62.3 × 10−56.0 × 10⁻⁷
Table 5. Results of the significant difference test for γdif between the damage classes (yellow indicates a significant difference was determined).
Mashiki Town
MinorMod-Mod+ Class 1Class 2Class 3Class 4Class 5
Class 12.3 × 10−42.8 × 10−27.0 × 10⁻²Class 1-2.2 × 10−11.8 × 10−11.6 × 10−11.1 × 10−2
Class 21.0 × 10−48.6 × 10−21.6 × 10⁻¹Class 2--1.3 × 10−21.3 × 10−21.2 × 10⁻³
Class 37.9 × 10−72.8 × 10−44.2 × 10⁻³Class 3---4.6 × 10−11.6 × 10−1
Class 43.5 × 10−71.7 × 10−42.2 × 10⁻³Class 4----1.6 × 10⁻¹
Class 52.3 × 10−73.3 × 10−56.7 × 10⁻⁴Class 5-----
Uki City
MinorMod-Mod+ Class 1Class 2Class 3Class 4Class 5
Class 11.6 × 10−29.9 × 10−24.8 × 10⁻¹Class 1-1.3 × 10−11.7 × 10−11.5 × 10−23.4 × 10−4
Class 21.0 × 10−42.0 × 10−37.4 × 10⁻²Class 2--4.8 × 10−19.0 × 10−23.3 × 10⁻³
Class 37.4 × 10−41.4 × 10−21.6 × 10⁻¹Class 3---8.2 × 10−26.2 × 10−3
Class 41.7 × 10−41.5 × 10−31.5 × 10⁻²Class 4----7.0 × 10⁻²
Class 52.9 × 10−62.3 × 10−55.1 × 10⁻⁴Class 5-----
Disclaimer/Publisher’s Note: The statements, opinions and data contained in all publications are solely those of the individual author(s) and contributor(s) and not of MDPI and/or the editor(s). MDPI and/or the editor(s) disclaim responsibility for any injury to people or property resulting from any ideas, methods, instructions or products referred to in the content.

