Article

Revealing a Shift in Solar Photovoltaic Planning Sites in Vietnam from 2019 to 2022

Institute of Industrial Science, The University of Tokyo, Tokyo 153-8505, Japan
*
Author to whom correspondence should be addressed.
Remote Sens. 2023, 15(11), 2756; https://doi.org/10.3390/rs15112756
Submission received: 29 March 2023 / Revised: 15 May 2023 / Accepted: 19 May 2023 / Published: 25 May 2023

Abstract

:
Solar photovoltaic (PV) technology has been widely used as a major source of renewable energy. Vietnam is especially active in installing solar energy systems. The total installed solar PV capacity in Vietnam has significantly increased since 2019, but the spatial evolution of solar panels is yet to be discussed. Therefore, this study aims to reveal the shift that occurred in solar photovoltaic planning sites in Vietnam from 2019 to 2022. Solar PV maps were produced from Sentinel-2 imagery via a deep learning segmentation model. Land cover maps, terrain slope, solar power potential, population density, and power grid datasets were compared to the locations of the detected PV sites each year to reveal a shift in the solar farm planning sites. The result show that the deep learning model achieved satisfactory performance. The observed shift in the PV installation sites suggests that for the first two years, large solar farms were built on suitable land near the electricity grid, while smaller PVs were constructed at locations less suitable for solar energy production in 2021 and 2022. These findings suggest that the shift in solar PV planning in Vietnam was caused by the availability of suitable land with an appropriate energy transfer capacity and the participation of smaller-scale PV operators.

Graphical Abstract

1. Introduction

Renewable energy is the key to reducing carbon emissions from society, and the world has been working on expanding its renewable electricity capacity. The implementation of these energies is essential in countering climate change [1]. In 2021, renewable energy accounted for 28.7% of the total energy generation in the world [2]. Solar PV technology has been the fastest-growing renewable energy resource in recent years [2]. The capacity of newly installed solar PV technology has been continuously growing, and a total PV capacity of 139.4 GW was added to the global electricity supply systems in 2020 [3]. China, the USA, India, Japan, and the EU are leading the evolution of solar-based electricity generation, but Vietnam emerged as one of the top ten countries for cumulative installed capacity in 2020 [3] following the installation of its significant 4.8 GW solar PV capacity in the previous year. Such rapid development is usually supported by governmental policies and subsidies, for example, the feed-in-tariff (FIT) enables the rapid development of solar power [4].
These rapidly evolving solar power stations have attracted attention from different aspects of science and engineering. Since solar farms occupy large swathes of land, they are visible and usually detectable in remote sensing imagery obtained via satellites or airplanes. However, due to the large number of PV sites that presently exist, it is not practical to manually label these panels one by one. Therefore, machine-learning-based detection schemes for identifying PV materials in remotely sensed data have been proposed and tested as time-efficient options for solar farm identification on the national to regional scale. The convolutional neural network (CNN) model has proven to be effective at delineating solar PV extents in both high-resolution and medium-resolution remote sensing imagery. A large-scale PV dataset was produced from high-resolution imagery taken over the United States [5]. The CNN-based land use/land cover (LULC) classification model achieved a user’s accuracy of 99.42% and a producer’s accuracy of 92.93% for the solar PV class in Japan, using imagery obtained from medium-resolution satellites such as Sentinel-2 and PALSAR-2 [6]. The CNN architecture also worked well on 30-meter-resolution multispectral imagery for the identification of PVs [7]. The U-Net-based image segmentation model was successfully utilized to perform the binary classification of complex background imagery into solar PV panels and other objects [8,9,10]. The combination of CNNs and RNNs is also an accurate tool for detecting the global-scale distribution of solar PV sites in medium- and high-resolution satellite imagery [11]. The pairing of support vector machines (SVMs) and CNNs is found to be a good approach to identifying PV sites in high-resolution imagery [12]. These CNN-based models are the accurate and powerful tools for characterizing the shapes of solar PV sites; however, pixel-wise machine learning (ML) models are still found to perform well. The random forest model [13] is one of the most popular ML models, and it was applied to the detection of solar PV sites in Landsat imagery taken over China at a resolution of 30 m [14]. It was also tested on both Sentinel-2 and Sentinel-1 data for the detection of PV sites in Japan [15] and the Netherlands [16].
In addition to the identification of solar PV sites in satellite imagery, changes in LULC associated with the introduction of large-scale solar farms are also of great interest from an environmental point of view. Various types of machine learning (ML) models have already proven to be useful for labeling land features in satellite imagery. Among these models, random forests, support vector machines, and artificial neural networks are the popular options for land cover mapping [17,18,19]. The random forest algorithm was originally developed in 2001 [13], and it has been widely adopted for land cover classification tasks [17,19]. The support vector machine, or SVM, was originally developed for a binary separation problem, but it was later adopted for multi-class classification, including land cover classification tasks [18]. An artificial neural network mimics how the brain performs a particular task by adopting the synaptic weights to the input [20]. It has been used successfully on satellite data to produce an accurate map of land cover status in satellite imagery [21,22]. The combination of multiple ML models has also been found to achieve decent accuracy in land cover mapping tasks [23,24]. Classified land cover maps have been utilized for assessing the dynamics of changes in the Earth’s surface in long time series data. The random forest algorithm was successfully applied to optical and SAR sensor data to quantify the land cover changes from 1990 to 2020 in Vietnam [19]. Landsat-5 and SPOT-5 imagery were utilized to show the dynamic environmental change due to urban development in Islamabad, Pakistan [25]. Several machine learning algorithms, namely, random forest, support vector machine, and classification and regression trees were applied to Sentinel-2 and Landsat-8 imagery to reveal the land cover characteristics in Munneru River Basin, India [26]. Land cover changes in forested areas in Lombok Island, Indonesia, were investigated through a stack of Landsat imagery, and it was found that the forest areas had steadily decreased from 1990 to 2010 [27]. In 2015, a study found that utility-scale solar PV panels in California are mostly found in shrublands, croplands, and pastures [28]. Some satellite-based solar PV databases are utilized to find the LULC classes that are used for solar PV panel installation. On the global scale, croplands, arid lands, and grasslands are the most common land cover types used for constructing PV power facilities [11], which is aligned with the conclusion that croplands have the highest PV potential [29]. A similar trend is observed in China, as PV panels are built most frequently on croplands [14]. It was also shown that in Japan and South Korea, the construction of medium-scale solar farms contributed to the loss of natural and semi-natural environments, and some conserved areas were used for PV installation [30]. The necessary scale of land use meeting ambitious renewable energy goals is also large, as shown in a study performed in India in which 6700–11,900 km2 of forest land and 24,100–55,700 km2 of agricultural land could be impacted due to solar and wind power installation if the installation is advanced with the singular aim of resource potential [31]. Therefore, it is crucial to check the development of PV panel installation and its corresponding impacts on the existing ecosystems. In addition to the apparent transformation of the local environment by PV cells, some solar cells are situated in hazardous areas after their rapid development, as shown in a case study in Japan [15,32]. A survey in Japan found that utility-scale solar farms were sometimes severely damaged after typhoons or heavy rain events [33]. These negative aspects of solar energy farms could become common as more PV panels are installed in many countries and are predicted to occupy 0.5-5% of total land in 2050 [34]; therefore, the appropriate monitoring and quantification of the trend in solar site installation would be beneficial for a better solar-powered society in Vietnam.
Another challenge is the integration of solar power into the large-scale electricity grid. Since solar energy is an unstable power resource compared to conventional power plants, it is a difficult task to balance electricity consumption and supply to maintain a steady frequency and voltage [35]. The typical problem due to the natural variation in the energy supply from solar power is called the “duck curve”, which is defined as “the total actual electricity load curve minus the renewable energy generation” [36]. This variation is currently mainly balanced by flexible energy supply sources. However, it will place considerable peaking and ramping regulation stress on conventional dispatchable generators as more solar power penetration to the grid is achieved [36]. In some parts of Japan, the existing PV capacity exceeds the minimum power demand during the daytime; therefore, the energy production from these PV sites is curtailed, and the PV integration is severely affected [37]. To mitigate this problem, the distribution of existing PV cells shall be clarified to address the dynamic energy outputs from numerous PV facilities. The inadequate grid capacity problem and the curtailment of electricity output from existing PV sites are also reported in Vietnam [38]. Therefore, there is a need to quantify the relationship between the existing power grid and the solar PV sites to achieve a better understanding of the importance of power transmission’s capability to facilitate the construction of more solar farms in suitable places.
Based on the above-mentioned points, this study aims to achieve the following goals, focusing on the changes in PV cell installation trends in the whole of Vietnam from 2019 to 2022 by constructing solar PV cell maps through the use of deep learning models and satellite imagery: (1) to quantify the changes in LULC associated with the rapid installation of PV cells in Vietnam, (2) to conduct spatial analysis on the development of solar PV cell sites throughout the study period, and (3) to propose policy suggestions for a better solar-integrated society.

2. Methodology

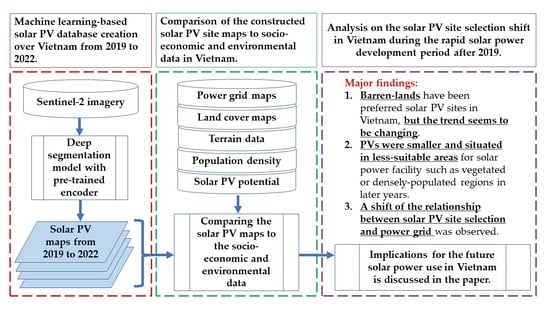
2.1. Flow Chart of the Study

The flow chart of this study is shown in Figure 1. It mainly comprises four parts.

2.2. Study Area

Vietnam is located in the south-eastern region of Asia, and it had a population of 97,468,029 in 2021, according to the World Bank. The country is characterized by a tropical monsoon climate and has a long shape, stretching from north to south, as shown in Figure 2. The economy has been growing rapidly as it achieved an 8.0% growth in its GDP in 2022 [39]. The industrialization of the country will fuel the surging demand for energy and consumption in the next decade. The Vietnamese government has taken serious steps by revising the Master Power Development Plan VIII (PDP8), with the significant inclusion of renewable sectors in energy development [40]. The government of Vietnam has extended the deadline for the feed-in-tariff for solar projects until 2023 [41]. Therefore, Vietnam was chosen as the appropriate study area to investigate how renewable energy, particularly solar power, evolved in a country, and what is needed to further facilitate solar energy production in the long run. Thanks to the wide coverage of the satellite imagery, the entire Vietnamese lands are analyzed in this study.

2.3. Input Data

The first part of this study involved image preprocessing in which cloud-free Sentinel-2 imagery was produced on the Google Earth Engine platform. COPERNICUS/S2_SR_HARMONIZED was used as the original satellite data source. The COPERNICUS/S2_CLOUD_PROBABILITY product was combined with the corresponding Sentinel-2 imagery to provide it with a cloud probability band since it was calculated from 10 Sentinel-2 bands, namely, B01, B02, B04, B05, B08, B8A, B09, B10, B11, and B12, via the lightGBM classifier [42]. If the cloud probability value exceeded 50%, it was masked and not used for further analysis. From 2019 to 2022, images taken from January 1st to the end of June were processed, and their median value was calculated as the input data. Although most of the clouds should have been removed through the use of the cloud masks, a small number of clouds not detected by the cloud detection model or cloud shadows could have remained, which would affect the analysis result. Hence, the median was chosen here because it is more robust to extremely high or low values caused by the presence of temporal clouds or cloud shadows. The photovoltaic spectral index (PVSI) [43], which is defined in Equation (1), was calculated to enhance the presence of PV cells in the Sentinel-2 imagery, and the value was multiplied by 1000 to be exported as an integer. The resulting Sentinel-2 images were downloaded to Google Drive in 0.25° by 0.25° squares covering all of Vietnam in unsigned, 16-bit integers in a WGS84 coordinate reference system. The Sentinel-2 data had different spatial resolutions depending on the target bands. In this study, the resolution of the images was set to 10 m for all the bands during the export process by setting the “scale” parameter to 10 in the ee.batch.Export.image.toDrive() function available on the GEE python API. Producing data with a resolution of 10 m from 20 m bands (e.g., B11 and B12) was achieved using the nearest neighbor, which is the default resampling operation on the Google Earth Engine during the reprojection [44].
PVSI = 2.3 × B 11 S 2 1.1 × B 12 S 2 B 8 S 2 2.3 × B 11 S 2 + 1.1 × B 12 S 2 + B 8 S 2 + 0.5 × B 2 S 2 B 4 S 2 B 8 S 2 + signum 1.3 B 6 S 2 B 8 S 2 1  

2.4. Training, Validation, and Test Data Preparation

To prepare the necessary datasets of PV sites for training the deep learning model, the following steps were taken. First, ten 0.25° by 0.25° square areas were selected, as shown in Figure 3.
Most of the large solar farms were visually found in the southern provinces of Vietnam, so the training data collection sites were also concentrated on the southern part of the country to create enough image patches that could train the deep learning model. However, the test data collection sites were also distributed to north-central, south-central, and central-highland regions to assess the performance of the PV site detection model over the entire country. In northern regions, including the capital, Hanoi, utility-scale PV sites were almost not present based on a visual assessment of the Sentinel-2 imagery taken in 2022, so those areas were not included in the data collection sites. The data from 2022 were used to train the model since these data were considered to contain enough variety of PV sites appearing in the study region over the four years. All the PV sites visually distinguishable inside the squares in the 2022 Sentinel-2 images were manually labeled solar PV sites. The delineated PV site shapes were saved in a vector file format. The delineated PV site shapes were converted into binary files which indicated whether a pixel was a PV site or was not a PV site. A pixel coordinate was chosen via the random.choice module in Python. Since PV sites occupy considerably smaller areas compared to other classes of land cover, half of the target data collection locations were randomly selected from the PV areas for the training and validation datasets. For example, if the target number of the image patches was 6000, 3000 of them had a central pixel corresponding to the solar PV panel class. In the case of the test dataset, to avoid significant overlap amongst the cropped data, 120 locations and 480 locations were chosen from the PV and non-PV pixel coordinates, respectively. The initial location was used as the center of a 256 by 256 square, which was the input shape of the deep-segmentation model. If no part of the square was outside the image boundary, the 2022 Sentinel-2 imagery and the corresponding PV labels were clipped inside the window and saved separately as TIF files. This process was repeated until the given number of the set of images and labels were prepared. In total, 6000, 600, and 600 image patches were produced for training, validation, and testing, respectively. The training and test datasets contained multiple tiles for collection, as shown in Figure 3, so the data were evenly acquired from those areas.

2.5. Solar PV Panel Detection Model and Accuracy Evaluation Metrics

Although the existing studies showed the general applicability of ML models (e.g., random forests, SVMs, and artificial neural networks) in land feature identification, the recently developed deep neural networks have demonstrated superior performance, including in semantic segmentation, which assigns specific categories in the input image [45]. Therefore, this study utilized a deep-segmentation model for identifying solar farms in the satellite imagery.
Many deep-learning-based segmentation models such as U-Net have an encoder–decoder structure [46]. The encoder encodes or extracts the features from an input image, and the decoder uses this information for performing segmentation. The pre-trained weights of the deep-learning models can be reused for other image-segmentation tasks to achieve a faster training time, reduce computational costs and the ecological footprint, and improve performance [47]. A PyTorch implementation of the deep semantic segmentation models available in the Segmentation Model Pytorch library [48] was used for the PV detection task. In this study, the LinkNet model, which was developed to overcome the long processing times of the existing semantic segmentation models, was used as the architecture (decoder) of the model [49]. The model bypassed the input of each encoder to the corresponding decoder, which helped recover the lost spatial information and enabled to use of fewer parameters at the decoder part, resulting in a more efficient network structure [49]. EfficientNet-b7, which outperformed other popular CNN models, was employed as the encoder in this study [50]. The Imagenet-based weights were used in the encoder model. The combined model was trained using an NVIDIA A100 GPU. The input bands for the deep learning models were B2, B3, B4, B6, B8, B11, B12, and PVSI. These input bands were chosen to cover the visible (B2, B3, and B4), infrared (B6, and B8), and short-wave-infrared (B11 and B12) wavelengths for characterizing the solar PV materials in a wide wavelength region. The PVSI was also included since it would better enhance the presence of PV sites in the image [43]. During the training process, horizontal flipping, vertical flipping, and random resizing of the input imagery with probabilities of 0.8, 0.8, and 0.5, respectively, were applied for data augmentation purposes. A total of 30 model-training epochs were executed with a batch size of 32, but if the loss function did not improve by three times, the training process was stopped to avoid overfitting. The focal loss was used as the loss function of the model training. The lowest validation loss model was kept as the best-performing model. The accuracy of the model was measured using the intersection-over-union (IOU), F-score, accuracy, precision, and recall metrics on the test dataset, as implemented in the SMP [48].
IOU = TP TP + TN + FN + FP + eps
F score = 1 + β 2 × TP + eps 1 + β 2 × TP + β 2 × FN + FP + eps
Accuracy = TP + TN TP + TN + FN + FP
Precision = TP + eps TP + FP + eps
Recall = TP + eps TP + FN + eps
where TP, TN, FN, and FP are true positive, true negative, false negative, and false positive, respectively. There are two additional parameters defined in the calculation, β   = 1 and eps = 1 × 10⁷, in which the latter is used to avoid zero division errors [48]. To evaluate the solar PV panel detection performance over different land cover types, the 600 test images were classified into different background categories depending on the most frequent land cover type outside the PV shapes by using the 2020 land cover maps. Then, the IOU metric was calculated for each land cover category.

2.6. Creating Solar PV Maps using Satellite Data from 2019 to 2022

The trained deep segmentation model was applied to each 0.25° by 0.25° square-shaped Sentinel-2 image from 2019 to 2022. Since the original data were larger than the 256 by 256 dimension the model was originally trained on, the input image was divided into 256 by 256 tiles. At the edge of the original image, the inner parts were reflected to conform to the 256 by 256 dimension. Each tile was supplied to the trained model, and the prediction result was combined again to produce a PV panel distribution map of a given input Sentinel-2 image. To remove misclassified pixels, masks based on the normalized difference vegetation index (NDVI) [51] and the modified normalized difference water index (MNDWI) [52] were applied to the initial PV detection maps. Pixels corresponding to NDVI > 0.5 or MNDVI > 0 were masked since they were unlikely to be solar PV panels. The prediction results were vectorized and combined into a single vector file for each year. The eventual vector files were stored in geojson format.

2.7. Post-Processing the PV Panel Detection Results and the Built-Year Estimation of the PV Sites

The detected PV sites from 2019 to 2022 were subjected to further post-processing to improve the data quality. In this study, the deep segmentation model was trained on the 2022 Sentinel-2 data so that the detected PV panel maps from that year would be the most reliable data source. PV sites usually have a lifetime of more than 20 years, so once a solar farm is established, it is unlikely to disappear in a short period. Therefore, the solar PV sites increase their area monotonically, which means that the extent of the 2022 solar PV sites is the maximum area for the four years. Here, the 2022 solar PV panel data were used as a basis for the analysis, and if a detected PV polygon from 2019 to 2021 did not intersect with the 2022 PV maps, it was considered to be a misclassified object and was subsequently removed from the analysis.
To assess the shift in the “new PV site selection strategy”, the following procedure was carried out to estimate the year in which the construction of each PV site began. First, all the PV sites detected in the 2022 satellite imagery were assumed to be constructed in 2022. Next, the 2021 PV map was compared to the 2022 PV extent; if there were PV sites that intersected with more than 50% of the 2022 PV polygon, the year of the initiation of that site’s construction was updated to 2021. This criterion was empirically determined and used to avoid the effects of misclassifying PV pixels in the “built-year estimation” process by ensuring that the PV construction sites were covered by solar panels and not by a small number of misclassified pixels. The same operation was repeated for the 2019 and 2020 PV maps. Typically, large-scale solar PV sites are composed of a set of “islands” of PV panels. Those PVs should belong to the same operating company and be considered a single PV site. To connect these separated polygons into a single PV site datum, PV polygons that fell within a certain distance were considered to be in the same PV site. A 100 m threshold was proposed in the cases of solar farms in Japan and Korea [30], but 30 m was chosen as an appropriate distance in Vietnam after an inspection of the distribution of the PV sites. An example of this post-processing process is shown in Figure 4. The polygons were first reprojected onto Pseudo-Mercator coordinates to apply a buffer of a one-meter unit. Fifteen-meter buffers were created around the exterior of each polygon; then, if the buffers intersected with each other, those objects were classified as belonging to the same PV site. The year of the start of the construction of that PV site was updated to the oldest PV polygon contained in the group.

2.8. LULC Change Analysis after PV Installation

Changes in LULC due to the installation of PV panels were analyzed by combining the newly built PV site and the LULC data available from [19]. The LULC dataset contains annual LULC estimates for the whole of Vietnam from 1990 to 2020 which were created from a machine learning model at a resolution of 30 m. It has decent predictive performance from 85.7  ±  1.3 to 92.0  ±  1.2% with the primary dominant LULC and 77.6  ± 1.2% to 84.7  ±  1.1% with the secondary dominant LULC. The data are freely available from the distribution website [53]. In this study, 10 “level-1” LULC classes defined in the dataset description were used for the analysis. These categories were “Residential land”, “Rice paddies”, “Croplands”, “Grassland”, “Barren land”, “Shrub”, “Forests”, “Wetlands”, “Open water”, and “Aquaculture”. The dataset contains land cover maps until the year 2020; therefore, the 2021 land cover condition was assumed to be the same as in the previous year. Since Vietnam started investing significantly in large-scale PV installations in 2019 and the installation of PV panels prior to 2018 was very limited [38], those small-scale PV sites could be hard to detect accurately. Therefore, all the detected PV sites from 2019 were assumed to be new installations. The newly installed PV sites from after 2019 were estimated by taking the set operations, implemented as the gdf1.overlay (gdf2, how = ’difference’) method, which only returns shapes contained in gdf1 but not in gdf2. Here, gdf1 corresponded to the geopandas.GeoDataFrame object of PV polygons for a given year, and gdf2 showed the geopandas.GeoDataFrame object containing solar PV polygons from the previous year. This result produced an estimate of the added PV area and locations in a given year compared to the previous year. In this process, if a solar PV extent in a previous year had areas that were not included in a later year, they were considered misclassified pixels since solar farms should have increased their areas and extents monotonically. The LULC values for the previous year at each new PV installation location were extracted and used to estimate the LULC changes corresponding to the installation of the PV panels.

2.9. Analysis of the Factors behind the Rapid Installation of PV Sites

Although governmental subsidies were the dominant factor for the PV boom in Vietnam, there could be factors that enabled the very rapid installation of large-scale PV sites. There could also be a shift in strategies for selecting PV installation sites, as suitable land for the installation of PV panels, such as open areas and areas that receive high amounts of solar radiation near existing transmission lines, are consumed each year. Hence, four additional factors were analyzed in this study. These are: (1) terrain slope, (2) solar power potential, (3) population density, and (4) power transmission lines. Terrain is an important factor for solar PV installation since the construction cost of preparing the surface to withstand the weight of PV panels is higher on steep slopes. The solar power potential indicates a suitable place for PV site installation such that the PV sites would have been chosen first in high-potential areas. Population density was chosen due to the value of the land because densely populated areas are usually expensive to develop for solar farms. The land price of a densely populated area is usually higher than that of a low-population-density area. It is also hard to acquire a large open land in populated areas. The descriptions of the data sources are provided as follows. The slope of the terrain over Vietnam was calculated based on MERIT DEM: Multi-Error-Removed Improved-Terrain DEM, which is available on Google Earth Engine [54]. The ee.Terrain.slope() function was used to obtain the slope values, and the raster data were exported to Google Drive at a resolution of 100 m. Yearly average photovoltaic electricity production potential data were obtained from the Global Solar Atlas database [55]. “Population density 2018 UN adjusted” was used as the basis of the population database [56]. The National Power Transmission Corporation (EVNNPT) operates the national power grid in Vietnam, but the grid information was not available nor downloadable as GIS data. Hence, the power-transmission line map as of 11 March 2023 on Open Street Map (OSM) [57] was used in this study. The oldest object in the OSM database used was last modified on 26 February 2016, and it has been updated continuously. Hence, it is the most up-to-date information available online compared to other sources, such as the 2016 grid data published by the World Bank (https://datacatalog.worldbank.org/search/dataset/0042329, accessed on 18 May 2023). A field survey was conducted in Đồng Nai and Bà Rịa–Vũng Tàu Provinces on 6 February 2023 to check the actual status of the power grids on the ground. Photos were taken by an iPad (6th generation) and an arrows We A101FC smartphone with GPS tags.
After determining the year that construction began for each PV site detected in the 2022 satellite data, the average population density, slope values, solar power potential within each solar farm, and distance to the closest power transmission line were calculated. The capacity of the nearest power line to a PV site was also calculated to see whether there was any shift in the preference for the type of power line when planning a solar farm.

3. Results

3.1. PV Detection Results

The model training ended in 21 epochs, and the trained model was applied to the test dataset. The accuracy metrics were calculated via the SMP library. The accuracy metrics are summarized in Table 1 [6,8]. The produced solar PV vector files had data sizes of 1.3 MB, 2.7 MB, 9.9 MB, and 11.1 MB, and there were 11.5 km2, 42.8 km2, 98.3 km2, and 105.1 km2 of total PV site areas in 2019, 2020, 2021, and 2022, respectively.
The comparison of the IOU values among different land cover backgrounds is shown in Table 2. Eight land cover classes, excluding regions with no data, were found in the test image data. These were “aquaculture”, “rice paddies”, “barren land”, “cropland”, “forest”, “open water”, “residential land”, and “shrub”. However, only five and two images were included in the “residential land” and “aquaculture” classes, respectively. Hence, those results are not included in the table since the performance could not be appropriately evaluated without a sufficient number of test samples. The IOU values indicate that the performance of the deep learning model was different over different types of land cover. The accuracy metrics were the highest over forest land, and images containing rice paddies led to the lowest performance of the solar PV site detection method.
To visualize the change in the distribution of PV sites each year, the entire study site was first divided into a set of 0.1° by 0.1° squares. The area of the intersection of the detected PV sites and each square was calculated and is shown in Figure 5a–d. The major power line map was taken from Open Street Map [57] and is shown in Figure 5e to compare the distribution of solar PV sites to the power transmission infrastructure. The distribution of the PV sites indicates that the coastal areas in the southeast of the country have been significantly utilized for PV panel installation. The comparison among the PV distribution maps in different years shows that PV panel installation surged in 2021 and spread to the inland areas of the southern part of the country. However, the 2022 result shows that the increase in PV sites was limited compared to the previous year.

3.2. LULC Changes due to PV Site Installation

The changes in LULC due to PV site installation were estimated by overlaying the newly expanded PV polygon extent for each year on the 30-meter-resolution land cover map. The output of this process was the number of each type of land cover class used for the expansion of the new PV site, which was then converted into km2 units by assuming that each pixel had an area of 30 m × 30 m = 0.0009 km2, which was the same resolution as the original LULC map. Figure 6a shows that the total area of the newly added solar farms each year increased almost monotonically from 2019 until 2021, which corresponds to the dramatic development of solar-based energy production in Vietnam. However, the installed capacity in 2022 dropped significantly compared to the previous year.
The share of the LULC used for the new PV site installation shown in Figure 6b indicates that barren land was the most popular LULC class chosen for the installation of PV sites for all four years. However, the share of barren land for new PV farms decreased in 2021 and 2022 compared to 2019 and 2020, and other LULC classes, namely, forests and shrubs, were also becoming common for PV site selection. It is also notable that the share of the urban land cover for solar PV installation sites has been steadily increasing, which might correspond to the large-scale rooftop PV panels visible on buildings in the Sentinel-2 imagery.

3.3. The Trend in PV Panel Installation and Site Selection in Vietnam

The trend in the selection of PV site installation was assessed via the following five aspects: (1) the PV site areas, (2) the average slope values at each solar PV facility, (3) the average PV potential within each PV site, (4) the average population density around the solar farms, and (5) the relationship between the solar farms and the power transmission lines. All the results were derived from the solar PV maps with the estimated “Year when the construction of the facility initiated” based on the process described in Section 2.7.
The box plots of the estimated areas of the PV sites classified by the year of construction of the facilities are shown in Figure 7. It can be seen from Figure 7 that the size of the PV sites being newly constructed each year decreased over the 4-year study period. The construction of large solar power plants typically takes several months or years. Consequently, while the construction of the large-scale PV sites would have been mainly initiated in 2019 and 2020, as shown in Figure 7, the peak of solar panel installation is thought to have occurred in 2021, as shown in Figure 6a.
The slope values inside each solar farm perimeter were calculated by using the rasterstats.zonal_stats library. The results are shown in Figure 8. The results show that in 2019 and 2020, most of the solar PV sites were built on slopes of less than 5°. However, in 2021 and 2022, steeper slopes were used for installation of solar facilities.
The PV potential data were obtained from the Global Solar Atlas website [55], and the average value for the PV sites installed each year was calculated and is shown in Figure 9. The 2019 and 2020 distributions are similar, and the two value peaks correspond to 1600 kWh/kWp and 1470 kWh/kWp. However, the distribution of the average PV output potential values shifted to lower values in 2021 and 2022, and the values are concentrated to the lower peak of around 1470 kWh/kWp.
The average population density around the newly installed PV sites was calculated by comparing the extent of the predicted PV site and the population density data in 2018. The results are summarized in Figure 10. It was shown that in contrast to the previous two years, densely populated areas were chosen for PV installation sites in 2021 and 2022. The data from the years 2021 and 2022 indicate a clear shift as more developed and populated regions were chosen as locations for the construction of new PV sites.
During the field survey conducted in Đồng Nai and Bà Rịa–Vũng Tàu Provinces, it was visually confirmed that the locations of the power grids shown on the OSM agree with the actual power grids on the ground. An example of the observed transmission tower is shown in Figure 11a. These power grids are also visible in the high-resolution Google Earth imagery, so the OSM-based power grids were considered to be placed in the correct locations. However, there were transmission towers which were visible and confirmed during the field survey but are not recorded on the OSM map, as shown in Figure 11b,c. This tower could either be a new facility or could have been missed by the mappers who contributed to the data in the region. In total, there are 6444 km of 500 kV power lines and 6585 km of 220 kV power lines recorded on the power line data extracted from Open Street Map. Vietnam‘s National Power Transmission Corporation (EVNNPT) possesses 10,467 km of 500 kV lines and 18,959 km of 220 kV power lines as of 26 April 2023 [58]. Therefore, 1/3 of the 500 kV lines and 2/3 of the 220 kV lines could have been missed by the OSM database.
The distance from a PV site to the nearest power lines listed on the OSM was calculated using the geopandas.GeoDataFrame.distance() method after reprojecting both the power line data and the PV site maps onto the “VN-2000/UTM zone 48N” projection, which covers the whole of Vietnam in meter units. The results are shown in Figure 12. The distributions of the newly built PV sites to the closest power grids in 2019 and 2020 were quite similar, while in 2021 and 2022, the solar farms could have been placed in distant locations from the power lines.
There were eight different types of power grids in the study area in the OSM data after removing the power line data without capacity information. These were ‘110 kV, 210 kV, 220 kV, 220 kV; 110 kV, 230 kV, 33 kV, 500 kV, and 500 kV; 220 kV. 220 kV; 110 kV and 500 kV; 220 kV, meaning that different capacity power lines were running parallel in the same way. The frequency with which each transmission capacity was chosen as the closest power line to the PV sites was tallied each year. The resulting data were summarized for each power transmission capacity from 2019 to 2022, and it was normalized by the total number of PV sites built each year. The results are shown in Table 3. The 220 kV and 500 kV lines were the dominant power grid capacities throughout the study period, but the 110 kV grid became more common in 2021 and 2022 compared to the first two years.

4. Discussion

4.1. Performance of PV Site Detection

In general, the deep segmentation model, which combines the LinkNet architecture and the EfficientNet-b7 encoder, performed well at mapping the solar PV sites, as listed in Table 1. The results indicate satisfactory performance in the solar PV site detection tasks using the 10-meter Sentinel-2 imagery, and the values are close to the reported solar PV site detection scores achieved using deep semantic learning models in Japan and Brazil [6,8]. The generality of the detection results appears to be supported since the model achieved high accuracy metric values on the test dataset taken from the north-central, south-central, central-highland, and southeastern parts of the country. Some examples of the detection outputs and reference high-resolution images on Google Earth are shown in Figure 13. In Figure 13a,b, the detailed shape of the PV sites is well represented in the prediction result. Narrow separation lines amongst the clusters of PV sites are also depicted in the segmentation output. However, due to the limitation of the resolution of the input satellite imagery (10 m), the spaces between the rows of PV panels visible in the high-resolution imagery are not included in the prediction, which shall be taken into account when the detection result needs to be turned into more detailed information on the solar farm, such as the number of panels situated in the facility. In addition, solar farms that were smaller than the 10 m × 10 m dimension, which corresponds to the size of a single cell of the input Sentinel-2 data, could not be accurately detected by the deep learning models since they require recognizable shapes in the image. Notably, some of the rooftop PV panels in urban areas, which are considerably smaller than the utility-scale PV panels in open fields, were also detected by the deep segmentation model, as shown in Figure 13c,d. There are many materials in those artificial environments that are similar to the PV panels in satellite images, but the model generally succeeded in avoiding the misclassifications of non-PV-panel rooftops as solar panels. However, the detection performance seemed to not as good as the results of the utility-scale PV panels in non-urban areas. This underperformance of the model in an urban environment could be explained by the lack of training data representing rooftop PV panels and the smaller scale of those facilities due to the limitation of the available space on the rooftops. The model failed to detect a portion of PV panels in some solar farms, as can be seen in Figure 13e,f. This could be due to the uncleaned or dusty surfaces of the panels since it is known that the reflectance of the PV panels is affected by soiling [59].
The study site is composed of a mixture of various land cover classes, including agricultural areas, urban settlements, and barren lands with limited vegetation. The comparison of the solar PV site detection performance over different land cover backgrounds showed that the solar PV panels are distinguishable from vegetated areas (forest and shrub), and open water. Solar panel materials can stand out from those backgrounds, which led to better performance compared to barren lands, croplands, and paddy fields. The reason for the underperformance of these three land covers could be due to the presence of soil. Since solar panels are built after removing most of the surface vegetation, they usually stand on bare land or sparsely vegetated areas. The reflectance from the soil surface could be mixed with the solar PV panels’ spectral signatures since there are gaps between the panels. Hence, if the surrounding environment is composed of soil, solar farms might not stand out in the image patch.
There was also an uncertainty regarding the post-processing in which the PVs that did not intersect with the 2022 solar PV polygons were remoted from the analysis. The 2022 solar PV database was used as the reference, but it should not be considered perfect data. Therefore, there are errors in the results in which actual PVs detected before 2021 were falsely removed if they were missed in the 2022 data.

4.2. Shift in the Distribution of the PV Sites

In Figure 5, the shift in the spatial distribution of the solar PV installation sites from 2019 to 2022 is shown. In general, most of the solar boom in Vietnam occurred in the southern part of the country, where the PV sites were concentrated compared to the northern regions such as the capital, Hanoi. The southeastern coast was initially utilized for building solar farms in 2019. A similar trend continued in 2020, as more PV sites were found in the coastal areas. Some inland regions were also used for PV sites. In 2021, the southeastern part of the country continued to be developed for large-scale PV sites. However, a clear shift occurred compared to the last two years as the smaller PV sites were placed into areas in which the large solar farms were not installed in 2019 and 2020. This would indicate that individuals and small companies, who usually cannot afford to operate costly, megawatt-scale PV facilities, joined the booming PV business. It is also notable that in the central part of Vietnam, PV sites seemed to be placed along the coast, aligned with the power lines.
The increase in the installation of PV sites in 2022 significantly dropped to the level of 2019, as can be seen in Figure 6a, and no dynamic PV site installation shift was observable in Figure 5d. Figure 6b shows the shift in the type of land cover used for solar PV site installation. “Barren lands” had been the most common for all four years and were the dominant choice in 2019 and 2020. These infertile lands are usually cheap to acquire, and the cost of removing woody vegetation would not be high. The population should also be low in those environments; therefore, conflicts with the local community due to the construction of the PV sites could be avoided. Therefore, they could be a good place for solar power site installation, which transforms barren lands into an income source by selling the produced electricity at a fixed price thanks to the FIT policy.
This finding is quite different from that of the previous global-scale study, which concluded that croplands are the most common LULC class used for PV installations [11]. Hence, the availability of these barren lands might be one of the key components for PV development in Vietnam. However, in 2021 and 2022, the share of barren lands dropped, and forests and croplands were also chosen for PV site construction. By also considering the findings that the size of the PV sites had been decreasing continuously, PV sites were placed on steeper slopes, in areas with lower PV potential, and in more populated areas, as shown in Figure 7, Figure 8, Figure 9 and Figure 10, respectively. It could be inferred that the PV sites were situated on lands less suitable for solar-based energy generation in later years. Since the FIT mechanism is active until 2023, financial support shall not be the dominant factor for the shift in the PV site installation trend. Furthermore, the cost of a solar PV site had been decreasing until at least 2020 [60], and the newly installed PV capacity has been growing globally [61]; that sudden price hikes in the study period from 2019 to 2022 could hamper the new installation of PV sites is also unlikely. Hence, this shift could be caused by the following two reasons: first, smaller-scale PV site operators, such as individuals, would have limited choices for PV construction sites. Therefore, their solar facilities could not be placed in suitable locations such as the flat and sunny barren lands along the southeastern coast. Second, the capacity of the energy transmission through the power line limits the number of PV panels that can be placed and connected along the grid. Therefore, once the energy grid capacity transferring electricity from suitable locations to the energy consumption areas has been used up, additional PV panels must be placed in locations where the room for electricity transmission is still available, and the size of the solar farms could decrease because of the insufficient transmission capacity in the nearby power grids. The second hypothesis is further discussed in Section 4.3.

4.3. The Relationship between the Solar PV Site Installation and the Energy Grid

Even though the completeness of the power grid information available in the OSM database was limited compared to the official statistics, there were noticeable shifts between the solar PV installation sites and the power grid. In Figure 12, the increase in the distance to the nearest major power line is apparent in 2022 compared to 2021. A similar shift is suggested by Welch’s t-test, which showed that the increase in the mean distance from PV sites to power grids in 2021 compared to 2020 is statistically significant at the 5% significance level (p = 0.029). This would suggest that in 2019 and 2020, PV panels were placed near major power lines so that the cost of building a connection to the grid could be minimized, but in later years, PV site operators were trying to connect their solar farms from more distant locations. This might have been caused by the availability of the nearby power line capacity. If the nearby transmission capacity is already full, people or companies would have needed to look for an available location even though it was far from their PV facilities. In Table 3, 550 kV and 220 kV power lines, which are the largest classes of energy grids, were mostly chosen as the closest power lines to the solar farms built in 2019 and 2020, and there was be enough availability of power transmission capacity in those existing grids, allowing for the initiation of many large-scale solar farms. These two types of power lines also run along the southeastern coasts where significant PV site installation occurred, as shown in Figure 5. In 2021 and 2022, those largest-capacity power lines still occupied more than 70% of preference for power lines for PV site installation. However, smaller-capacity power lines, especially the 110 kV lines, became common as their shares increased to 12.19 % and 21.16 % each year, respectively. This shift would imply that the large-capacity power lines, which would allow for the transmission of a large amount of electricity, were occupied by the PV sites built in the first two years so that the latecomers to the PV business had to switch to the smaller-capacity power grids with limitations for connecting significant solar farms.

4.4. Implications for the Future Use of Solar Power in Vietnam

The shift in the installation of solar PV sites in Vietnam shows that the rapid development of PV sites might have become possible thanks to the availability of large and high-solar-potential barren lands and the high-voltage electricity grids which could deliver the electricity produced to urban areas, in addition to the governmental policy and subsidies provided by the FIT. The promotion of solar power should have also been beneficial for the landowners who transformed their unused barren lands into profitable solar farms. However, the observed land cover changes indicate that the small-scale PV sites sprawled to more vegetated areas or populated regions. In addition, the availability of the grid capacity could also have become a problem in recent years for building solar farms as large as those that were built in the first two years, even though the FIT is active until 2023. Hence, there are two major implications for the future use of solar energy in Vietnam. First, it is necessary to both improve the grid capacity and implement energy storage mechanisms appropriately. Strengthening the power grind would allow for more participation in solar energy production. The areas along the southeastern coastline could be the best locations for investment since there are already many PVs that may have used up the available transmission capacity, but large swathes of barren lands are still not utilized. Once the existing transmission lines are reinforced to allow for more PV connections, those unused lands would become a source of income for regional companies and communities. Energy storage devices such as batteries would reduce the burden on the electricity grid during the daytime by storing the excess energy and releasing it later so that the amount of electricity flowing at peak times can be reduced to allow for the connection of more PV panels to the grid. Second, local authorities should focus on the potential environmental and social impacts of PV panel installation. Since forests and shrublands were being turned into PV sites in Vietnam in 2021 and 2022, and PV sites are known to change the local climate, such as the nighttime temperature [62], newer PV sites should receive the necessary environmental impact assessments and use construction site selection strategies to minimize the impacts due to their construction.
The construction of large-scale solar farms is known to change the soil properties and soil water content under or among the panels [63,64]. It is also suggested that the installation of large-scale solar farms will result in soil compaction, the potential alteration of drainage channels, and increased runoff and erosion [65]. One study found that the soil water content showed a significant decrease under PV panels compared to control locations [63]. Hence, in the case of large-scale solar PV facilities in Vietnam, the dry soil particles exposed after the installation of the panel assets could easily be blown away to the nearby areas and would lead to worsened conditions. However, the magnitude of the environmental changes would be different for the different soil types and land cover types that were present before PV site installation (e.g., grass, forest, or bare lands).
Some residents might complain about the presence of PV panels and environmental changes caused by the PV sites, as reported in Japan [66], so a more detailed study on the environmental impacts associated with solar farm construction that combines a macro-scale analysis using remote sensing and a micro-scale study including laboratory tests and field surveying would be useful.

4.5. Limitations, Uncertainties, and Future Work

It was assumed that the PV polygons falling within a 30-m distance belonged to the same solar farm. However, the threshold value was manually adjusted to match the visual clusters of the solar PVs. Hence, a more robust and automated clustering approach shall be taken to expand the study region to other countries or regions. As mentioned in Section 4.1, the deep segmentation model could be further improved by incorporating rooftop solar PV panels into the training dataset. Sentinel-2 imagery will not be able to detect household-scale rooftop solar panels due to the limitation of its resolution, but the larger-scale PV facilities on top of warehouses or factories would be better detected once appropriate labeling is provided in future studies. At the same time, an analysis focusing on the background effects of built-up areas on solar PV panel detection must be carried out to determine how a complex environment would affect the performance of a deep learning model.
There is also room for improvement in the “built-year estimation” used in this study. In this study, the yearly solar PV maps were compared to identify when construction started. However, a more robust approach could be taken to directly analyze the time series of the reflectance values, which should be drastically changed once solar PV panels are installed.
The largest uncertainties lie in the completeness of the power grid. OSM-based power grid maps are almost the only open-access global coverage data source that receives continuous updates. However, since the database is based on the voluntary work of its mappers, the completeness of the data is not guaranteed, as suggested by the field survey. The comparison of the recorded length of the power grid on the OSM to the official statistics showed that 1/3 of the 500 kV lines and 2/3 of the 220 kV lines could not be included in the analysis since they were not recorded in the database. Therefore, this could be aided with other information, such as remote sensing imagery. There is already a study investigating the possibility of estimating the distribution of the energy grid by using the nighttime light imagery taken by satellites [67]. However, other approaches, especially the detection of transmission towers in SAR imagery [68,69,70], could also be a good way of supplementing the insufficient information in OSM. Additional field surveys shall be conducted in other parts of the country, especially the north and the central parts of the country, to determine the agreements between the OSM-based grid data and the actual situation on the ground.
The existing solar power potential maps usually focus on the availability of solar energy; however, the availability of the grid capacity to transmit the electricity produced from PV sites should also be included for the practical quantification of the solar power installation potential.
The environmental impact due to large-scale PV installations was only evaluated in terms of the changes in the LULC, but a detailed investigation of the relationship between the local ecosystem and PV sites would also facilitate the understanding of and better planning for eco-friendly solar power systems.

5. Conclusions

In conclusion, solar PV panel maps from 2019 to 2022 for the whole of Vietnam were produced using remote sensing data and a deep learning model. We then focused on the rapid installation of solar PV sites and its relationship to LULC, slope, population density, solar power potential, and the energy grid. The deep segmentation model, which combined the LinkNet architecture and EfficientNet-b7 encoder, performed well at accurately labeling PV sites. However, there is still room to improve the performance, especially in urban areas, by incorporating more training datasets including rooftop solar PV panels. The shift in the installation of new solar PV sites in the study region was assessed based on the produced PV site database, and it was shown that the newly constructed PV sites were growing smaller and being built in areas with lower solar potential, steeper slopes, areas that were more densely populated or were vegetated, and locations that were far from existing transmission lines. This would indicate that suitable lands with the available energy transmission capacity for large-scale PV facilities were almost exhausted after the rapid installation in the first two years such that the companies and individuals were required to shift to smaller PV sites in vegetated or populated areas. These newer PV sites sprawled over a larger area, so appropriate measures to monitor the environmental and social impacts caused by the PV site installations would be necessary. However, by strengthening the power grids, especially in the southeastern coasts of the country, the available barren lands would again be used for installing large-scale solar farms to promote the further integration of green energy into the economy. The findings of this study have shown that not only are monetary and regulatory support from the government important but the availability of appropriate spaces with the grid capacity for solar farms is also an important factor for facilitating the rapid promotion of PV site installation in society.

Author Contributions

Conceptualization, S.S.; methodology, S.S.; software, S.S.; validation, S.S.; formal analysis, S.S.; investigation, W.T.; resources, W.T.; data curation, S.S.; writing—original draft preparation, S.S.; writing—review and editing, W.T, and S.S.; visualization, S.S.; supervision, W.T.; project administration, W.T.; funding acquisition, S.S. and W.T. All authors have read and agreed to the published version of the manuscript.

Funding

This research was funded in part by a research grant from the Remote Sensing Technology Center of Japan.

Data Availability Statement

All the processing codes and model input data are available from: https://drive.google.com/drive/folders/1Qi7hWBhBGhz2sNdi1XAAW3CImR_c-Esw?usp=sharing (accessed on 18 May 2023) and https://drive.google.com/drive/folders/1CDnbIqhD0ZGbucr9ZEm6JRGug_RxTZUV?usp=sharing (accessed on 18 May 2023), respectively.

Conflicts of Interest

The authors declare no conflict of interest.

References

  1. The Global Goals. Available online: https://www.globalgoals.org/goals/7-affordable-and-clean-energy/ (accessed on 16 December 2022).
  2. Renewable Electricity. Available online: https://www.iea.org/reports/renewable-electricity (accessed on 16 December 2022).
  3. Snapshot of Global PV Markets. 2021. Available online: https://iea-pvps.org/wp-content/uploads/2021/04/IEA_PVPS_Snapshot_2021-V3.pdf (accessed on 28 March 2023).
  4. Tamura, T. Policy of Solar Photovoltaics in Japan 2022. In Proceedings of the 2nd Conference of the Japan Photovoltaic Society, Kanazawa, Japan, 28 June 2022. [Google Scholar]
  5. Yu, J.; Wang, Z.; Majumdar, A.; Rajagopal, R. DeepSolar: A Machine Learning Framework to Efficiently Construct a Solar Deployment Database in the United States. Joule 2018, 2, 2605–2617. [Google Scholar] [CrossRef]
  6. Sota, H.; Takeo, T.; Masato, O.; Yousei, M.; Kenlo, N.N.; Koichi, I.; Naoyoshi, H.; Fumi, O.; Masanori, D.; Tsutomu, Y. Generation of High-Resolution Land Use and Land Cover Maps in Japan Version 21.11. J. Remote Sens. Soc. Jpn. 2022, 42, 199–216. [Google Scholar]
  7. Ryosuke, N.; Tomohiro, I.; Kiyokazu, N.; Hidenori, S.; Simo-serra, E.; Yoshihiko, M.; Satoshi, I.; Hiroshi, I. Object Recognition on Earth-Observing Satellite Imagery. In Proceedings of the 30th Annual Conference of the Japanese Society for Artificial Intelligence, Kita-Kyushu, Japan, 6 June 2016. [Google Scholar]
  8. Costa, M.V.; Carvalho, O.L.; Orlandi, A.G.; Hirata, I.; Albuquerque, A.O.; Silva, F.V.; Guimarães, R.F.; Gomes, R.A.; Júnior, O.A. Remote Sensing for Monitoring Photovoltaic Solar Plants in Brazil Using Deep Semantic Segmentation. Energies 2021, 14, 2960. [Google Scholar] [CrossRef]
  9. Darapaneni, N.; Jagannathan, A.; Natarajan, V.; Swaminathan, G.V.; Subramanian, S.; Paduri, A.R. Semantic Segmentation of Solar PV Panels and Wind Turbines in Satellite Images Using U-Net. In Proceedings of the 2020 IEEE 15th International Conference on Industrial and Information Systems (ICIIS), Rupnagar, India, 26 November 2020; pp. 7–12. [Google Scholar]
  10. Castello, R.; Roquette, S.; Esguerra, M.; Guerra, A.; Scartezzini, J.-L. Deep Learning in the Built Environment: Automatic Detection of Rooftop Solar Panels Using Convolutional Neural Networks. J. Phys. Conf. Ser. 2019, 1343, 012034. [Google Scholar] [CrossRef]
  11. Kruitwagen, L.; Story, K.T.; Friedrich, J.; Byers, L.; Skillman, S.; Hepburn, C. A Global Inventory of Photovoltaic Solar Energy Generating Units. Nature 2021, 598, 604–610. [Google Scholar] [CrossRef]
  12. Li, Q.; Feng, Y.; Leng, Y.; Chen, D. SolarFinder: Automatic Detection of Solar Photovoltaic Arrays. In Proceedings of the 2020 19th ACM/IEEE International Conference on Information Processing in Sensor Networks (IPSN), Sydney, NSW, Australia, 21–24 April 2020; pp. 193–204. [Google Scholar]
  13. Breiman, L. Random Forests. Mach. Learn. 2001, 45, 5–32. [Google Scholar] [CrossRef]
  14. Zhang, X.; Xu, M.; Wang, S.; Huang, Y.; Xie, Z. Mapping Photovoltaic Power Plants in China Using Landsat, Random Forest, and Google Earth Engine. Earth Syst. Sci. Data 2022, 14, 3743–3755. [Google Scholar] [CrossRef]
  15. Shoki, S.; Wataru, T. Detection and Disaster Risk Evaluation of Solar Photovoltaic Cells in Satellite Remote Sensing Data. J. Remote Sens. Soc. Jpn. 2022, 42, 51–62. [Google Scholar]
  16. Plakman, V.; Rosier, J.; van Vliet, J. Solar Park Detection from Publicly Available Satellite Imagery. GIsci. Remote Sens. 2022, 59, 461–480. [Google Scholar] [CrossRef]
  17. Amini, S.; Saber, M.; Rabiei-Dastjerdi, H.; Homayouni, S. Urban Land Use and Land Cover Change Analysis Using Random Forest Classification of Landsat Time Series. Remote Sens. 2022, 14, 2654. [Google Scholar] [CrossRef]
  18. Ul Din, S.; Mak, H.W.L. Retrieval of Land-Use/Land Cover Change (LUCC) Maps and Urban Expansion Dynamics of Hyderabad, Pakistan via Landsat Datasets and Support Vector Machine Framework. Remote Sens. 2021, 13, 3337. [Google Scholar] [CrossRef]
  19. Phan, D.C.; Trung, T.H.; Truong, V.T.; Sasagawa, T.; Vu, T.P.T.; Bui, D.T.; Hayashi, M.; Tadono, T.; Nasahara, K.N. First Comprehensive Quantification of Annual Land Use/Cover from 1990 to 2020 across Mainland Vietnam. Sci. Rep. 2021, 11, 9979. [Google Scholar] [CrossRef] [PubMed]
  20. Mas, J.F.; Flores, J.J. The Application of Artificial Neural Networks to the Analysis of Remotely Sensed Data. Int. J. Remote Sens. 2008, 29, 617–663. [Google Scholar] [CrossRef]
  21. Yuan, H.; Van Der Wiele, C.; Khorram, S. An Automated Artificial Neural Network System for Land Use/Land Cover Classification from Landsat TM Imagery. Remote Sens. 2009, 1, 243–265. [Google Scholar] [CrossRef]
  22. Shimada, S.; Takeuchi, W. A Machine-Learning Based Scheme for Solar PV Detection Using Medium-Resolution Satellite Images in Vietnam. In Proceedings of the IGARSS 2022–2022 IEEE International Geoscience and Remote Sensing Symposium, Kuala Lumpur, Malaysia, 17 July 2022; pp. 255–258. [Google Scholar]
  23. Bui, Q.-T.; Chou, T.-Y.; Hoang, T.-V.; Fang, Y.-M.; Mu, C.-Y.; Huang, P.-H.; Pham, V.-D.; Nguyen, Q.-H.; Anh, D.T.N.; Pham, V.-M.; et al. Gradient Boosting Machine and Object-Based CNN for Land Cover Classification. Remote Sens. 2021, 13, 2709. [Google Scholar] [CrossRef]
  24. Alshari, E.A.; Abdulkareem, M.B.; Gawali, B.W. Classification of Land Use/Land Cover Using Artificial Intelligence (ANN-RF). Front. Artif. Intell. 2023, 5, 964279. [Google Scholar] [CrossRef]
  25. Hassan, Z.; Shabbir, R.; Ahmad, S.S.; Malik, A.H.; Aziz, N.; Butt, A.; Erum, S. Dynamics of Land Use and Land Cover Change (LULCC) Using Geospatial Techniques: A Case Study of Islamabad Pakistan. Springerplus 2016, 5, 812. [Google Scholar] [CrossRef]
  26. Loukika, K.N.; Keesara, V.R.; Sridhar, V. Analysis of Land Use and Land Cover Using Machine Learning Algorithms on Google Earth Engine for Munneru River Basin, India. Sustainability 2021, 13, 13758. [Google Scholar] [CrossRef]
  27. Kim, C. Land Use Classification and Land Use Change Analysis Using Satellite Images in Lombok Island, Indonesia. For. Sci. Technol. 2016, 12, 183–191. [Google Scholar] [CrossRef]
  28. Hernandez, R.R.; Hoffacker, M.K.; Murphy-Mariscal, M.L.; Wu, G.C.; Allen, M.F. Solar Energy Development Impacts on Land Cover Change and Protected Areas. Proc. Natl. Acad. Sci. USA 2015, 112, 13579–13584. [Google Scholar] [CrossRef]
  29. Adeh, E.H.; Good, S.P.; Calaf, M.; Higgins, C.W. Solar PV Power Potential Is Greatest Over Croplands. Sci. Rep. 2019, 9, 11442. [Google Scholar] [CrossRef] [PubMed]
  30. Kim, J.Y.; Koide, D.; Ishihama, F.; Kadoya, T.; Nishihiro, J. Current Site Planning of Medium to Large Solar Power Systems Accelerates the Loss of the Remaining Semi-Natural and Agricultural Habitats. Sci. Total Environ. 2021, 779, 146475. [Google Scholar] [CrossRef] [PubMed]
  31. Kiesecker, J.; Baruch-Mordo, S.; Heiner, M.; Negandhi, D.; Oakleaf, J.; Kennedy, C.; Chauhan, P. Renewable Energy and Land Use in India: A Vision to Facilitate Sustainable Development. Sustainability 2019, 12, 281. [Google Scholar] [CrossRef]
  32. Hao, K.; Ialnazov, D.; Yamashiki, Y. GIS Analysis of Solar PV Locations and Disaster Risk Areas in Japan. Front. Sustain. 2021, 2, 815986. [Google Scholar] [CrossRef]
  33. Tomohiro, T. Damages on Solar Photovoltaics after Natural Hazards. In Proceedings of the The 30th Conference of the Material Cycles and Waste Management Research, Sendai, Japan, 19 September 2019; pp. 13–14. [Google Scholar]
  34. van de Ven, D.-J.; Capellan-Peréz, I.; Arto, I.; Cazcarro, I.; de Castro, C.; Patel, P.; Gonzalez-Eguino, M. The Potential Land Requirements and Related Land Use Change Emissions of Solar Energy. Sci. Rep. 2021, 11, 2907. [Google Scholar] [CrossRef]
  35. Yang, W.; Zhou, X.; Xue, F. Impacts of Large Scale and High Voltage Level Photovoltaic Penetration on the Security and Stability of Power System. In Proceedings of the 2010 Asia-Pacific Power and Energy Engineering Conference, Chengdu, China, 28–31 March 2010; pp. 1–5. [Google Scholar]
  36. Hou, Q.; Zhang, N.; Du, E.; Miao, M.; Peng, F.; Kang, C. Probabilistic Duck Curve in High PV Penetration Power System: Concept, Modeling, and Empirical Analysis in China. Appl. Energy 2019, 242, 205–215. [Google Scholar] [CrossRef]
  37. Komiyama, R.; Fujii, Y. Optimal Integration Assessment of Solar PV in Japan’s Electric Power Grid. Renew. Energy 2019, 139, 1012–1028. [Google Scholar] [CrossRef]
  38. Vietnam’s Solar Power Boom: Policy Implications for Other Asean Member States. Available online: https://www.iseas.edu.sg/articles-commentaries/iseas-perspective/2021-28-vietnams-solar-power-boom-policy-implications-for-other-asean-member-states-by-thang-nam-do-and-paul-j-burke/ (accessed on 16 December 2022).
  39. World Bank Harnessing the Potential of the Services Sector for Growth. Available online: https://documents1.worldbank.org/curated/en/099544403132351453/pdf/IDU0343e48530e212043860bee605aae66cfb04a.pdf (accessed on 17 March 2023).
  40. International Trade Administration Vietnam—Country Commercial Guide, Power Generation, Transmission, and Distribution. Available online: https://www.trade.gov/country-commercial-guides/vietnam-power-generation-transmission-and-distribution (accessed on 17 March 2023).
  41. International Trade Administration, Vietnam Solar Power Sector. Available online: https://www.trade.gov/market-intelligence/vietnam-solar-power-sector (accessed on 18 May 2023).
  42. Anze, Z. Improving Cloud Detection with Machine Learning. Available online: http://web.archive.org/web/20221130122809/https://medium.com/sentinel-hub/improving-cloud-detection-with-machine-learning-c09dc5d7cf13 (accessed on 12 May 2023).
  43. Shoki, S.; Wataru, T. A New Spectral Index to Characterize Solar Photovoltaic Panels for Sentinel-2 Data 2022 In Proceedings of the 43rd Asian Conference on Remote Sensing (ACRS2022), Ulaanbaatar, Mongolia, 3–5 October 2022.
  44. Google Earth Engine Resampling and Reducing Resolution. Available online: https://developers.google.com/earth-engine/guides/resample#resampling (accessed on 12 May 2023).
  45. Yuan, X.; Shi, J.; Gu, L. A Review of Deep Learning Methods for Semantic Segmentation of Remote Sensing Imagery. Expert Syst. Appl. 2021, 169, 114417. [Google Scholar] [CrossRef]
  46. Ronneberger, O.; Fischer, P.; Brox, T. U-Net: Convolutional Networks for Biomedical Image Segmentation. In Medical Image Computing and Computer-Assisted Intervention—MICCAI 2015: 18th International Conference, Munich, Germany, 5–9 October 2015, Proceedings, Part III 18; Springer International Publishing: Berlin/Heidelberg, Germany, 2015. [Google Scholar]
  47. Dippel, J.; Lenga, M.; Goerttler, T.; Obermayer, K.; Höhne, J. Transfer Learning for Segmentation Problems: Choose the Right Encoder and Skip the Decoder. arXiv 2022, arXiv:2207.14508. [Google Scholar]
  48. Yakubovskiy, P. Segmentation Models Pytorch. Available online: https://github.com/qubvel/segmentation_models.pytorch (accessed on 9 January 2023).
  49. Chaurasia, A.; Culurciello, E. LinkNet: Exploiting Encoder Representations for Efficient Semantic Segmentation. In Proceedings of the 2017 IEEE Visual Communications and Image Processing (VCIP), St. Petersburg, FL, USA, 10–13 December 2017. [Google Scholar] [CrossRef]
  50. Tan, M.; Le, Q.V. EfficientNet: Rethinking Model Scaling for Convolutional Neural Networks. Proc. Mach. Learn. Res. 2019, 97, 6105–6114. [Google Scholar]
  51. Rouse, J.W.; Haas, R.H.; Schell, J.A.; Deering, D.W. Monitoring Vegetation Systems in the Great Plains with ERTS. NASA Spec. Publ. 1974, 351, 309. [Google Scholar]
  52. Xu, H. Modification of Normalised Difference Water Index (NDWI) to Enhance Open Water Features in Remotely Sensed Imagery. Int. J. Remote Sens. 2006, 27, 3025–3033. [Google Scholar] [CrossRef]
  53. Annual Land Use and Land Cover Maps across Mainland Vietnam from 1990 to 2020 (Released in September 2021/Version 21.09). Available online: https://www.eorc.jaxa.jp/ALOS/en/dataset/lulc/lulc_vnm_v2109_e.htm (accessed on 21 February 2022).
  54. Yamazaki, D.; Ikeshima, D.; Tawatari, R.; Yamaguchi, T.; O’Loughlin, F.; Neal, J.C.; Sampson, C.C.; Kanae, S.; Bates, P.D. A High-Accuracy Map of Global Terrain Elevations. Geophys. Res. Lett. 2017, 44, 5844–5853. [Google Scholar] [CrossRef]
  55. Global Solar Atlas. Available online: https://globalsolaratlas.info/download/vietnam (accessed on 19 October 2022).
  56. World Pop. Available online: https://hub.worldpop.org/geodata/summary?id=48780 (accessed on 19 October 2022).
  57. Open Street Map. Available online: https://www.openstreetmap.org (accessed on 7 January 2023).
  58. Evnnpt Overview of the National Power Transmission System. Available online: https://web.archive.org/web/20230428074556/https://www.npt.com.vn/c3/en-US/he-thong-truyen-tai-dien (accessed on 28 April 2023).
  59. Supe, H.; Avtar, R.; Singh, D.; Gupta, A.; Yunus, A.P.; Dou, J.; Ravankar, A.A.; Mohan, G.; Chapagain, S.K.; Sharma, V.; et al. Google Earth Engine for the Detection of Soiling on Photovoltaic Solar Panels in Arid Environments. Remote Sens. 2020, 12, 1466. [Google Scholar] [CrossRef]
  60. Wang, H.; Yang, X.; Lou, Q.; Xu, X. Achieving a Sustainable Development Process by Deployment of Solar PV Power in Asean: A SWOT Analysis. Processes 2021, 9, 630. [Google Scholar] [CrossRef]
  61. IEA-PVPS Snapshot of Global PV Markets. 2022. Available online: https://iea-pvps.org/snapshot-reports/snapshot-2022/ (accessed on 24 February 2023).
  62. Barron-Gafford, G.A.; Minor, R.L.; Allen, N.A.; Cronin, A.D.; Brooks, A.E.; Pavao-Zuckerman, M.A. The Photovoltaic Heat Island Effect: Larger Solar Power Plants Increase Local Temperatures. Sci. Rep. 2016, 6, 35070. [Google Scholar] [CrossRef]
  63. Moscatelli, M.C.; Marabottini, R.; Massaccesi, L.; Marinari, S. Soil Properties Changes after Seven Years of Ground Mounted Photovoltaic Panels in Central Italy Coastal Area. Geoderma. Reg. 2022, 29, e00500. [Google Scholar] [CrossRef]
  64. Choi, C.S.; Cagle, A.E.; Macknick, J.; Bloom, D.E.; Caplan, J.S.; Ravi, S. Effects of Revegetation on Soil Physical and Chemical Properties in Solar Photovoltaic Infrastructure. Front. Env. Sci. 2020, 8, 140. [Google Scholar] [CrossRef]
  65. Solar Energy Development Programmatic EIS Solar Energy Development Environmental Considerations. Available online: http://web.archive.org/web/20230406092904/https://solareis.anl.gov/guide/environment/ (accessed on 12 May 2023).
  66. Akihiro, N. Examining Structural Causes of Trouble in the Course of Social Acceptance of Photovoltaic Generation for a Better Solution: An Outlook. J. Interdiscip. Res. Community Life 2015, 6, 61–70. [Google Scholar]
  67. Arderne, C.; Zorn, C.; Nicolas, C.; Koks, E.E. Predictive Mapping of the Global Power System Using Open Data. Sci. Data 2020, 7, 19. [Google Scholar] [CrossRef]
  68. Yang, W.; Zhang, H.; Chen, J.; Sun, H. Automatic Detection of Power Transmission Series in Full Polarimetric SAR Imagery. In Proceedings of the 2007 IEEE Radar Conference, Waltham, MA, USA, 17–20 April 2007; pp. 789–793. [Google Scholar]
  69. Yang, W.; Xu, G.; Chen, J.; Sun, H. Power Transmission Towers Extraction in Polarimetric SAR Imagery Based on Genetic Algorithm. In Intelligent Computing in Signal Processing and Pattern Recognition; Springer: Berlin/Heidelberg, Germany; pp. 410–420.
  70. Peng, D.; Zhang, H.; Guo, W.; Yang, W. Power Transmission Tower Series Extraction in PolSAR Image Based on Time-Frequency Analysis and A-Contrario Theory. Sensors 2016, 16, 1862. [Google Scholar] [CrossRef] [PubMed]
Figure 1. The flowchart of the study.
Remotesensing 15 02756 g001
Figure 2. The map of the study area covers the whole of Vietnam.
Remotesensing 15 02756 g002
Figure 3. The data collection sites. (a) The distribution of the 0.25° by 0.25° square-shaped areas for training, validation, and test data collection. (b) An example of hand-delineated PV sites overlayed on high-resolution Google Earth satellite imagery.
Remotesensing 15 02756 g003
Figure 4. The post-processing process of combining separated PV polygons into a single multi-polygon; (a) output from the PV detection and built-year estimation flow; (b) PV polygons within a distance of 30 m were combined to a single multi-polygon.
Remotesensing 15 02756 g004
Figure 5. The solar PV site distribution trend from 2019 to 2022 was calculated as the PV-site-occupied area (km2) per each 0.1° by 0.1° square covering the study region: (a) 2019 results; (b) 2020 results; (c) 2021 results; (d) 2022 results. (e) Major power lines on Open StreetMap in the study region.
Remotesensing 15 02756 g005
Figure 6. LULC classes used for new PV site installations from 2019 to 2022: (a) the area (km2) of the land cover type used for new PV site installations; (b) the share (%) of the land cover type used for the installation of new PV sites.
Remotesensing 15 02756 g006
Figure 7. The boxplot of the area of the newly installed PV sites from 2019 to 2021.
Remotesensing 15 02756 g007
Figure 8. The average slope values within the solar farm perimeters from 2019 to 2022.
Remotesensing 15 02756 g008
Figure 9. The histogram of the average PV potential within the newly installed solar farms from 2019 to 2022: (a) 2019 result; (b) 2020 result; (c) 2021 result; (d) 2022 result.
Remotesensing 15 02756 g009
Figure 10. The average population density (people/km2) within the newly installed solar farms from 2019 to 2022.
Remotesensing 15 02756 g010
Figure 11. The field survey results of the electrical grid in Đồng Nai and Bà Rịa–Vũng Tàu Provinces: (a) an example of the observed transmission towers and energy grids in the field survey region; (b) an transmission tower unrecorded on the OSM; (c) The location of the photo and the areas where transmission towers should be located.
Remotesensing 15 02756 g011
Figure 12. The distance from the newly installed solar farms to the nearest power grid listed on OSM from 2019 to 2022.
Remotesensing 15 02756 g012
Figure 13. Examples of the solar PV panel detection results achieved by the deep segmentation model and the corresponding high-resolution imagery on Google Earth: (a) a detected PV site in 2022 Sentinel-2 imagery; (b) high-resolution imagery of the PV site shown in (a); (c) detected rooftop PV panels in Ho-Chi-Minh city; (d) high-resolution imagery of the PV site shown in (c); (e) detected PV sites missing some parts of the facility; (f) high-resolution imagery of the PV site shown in (e).
Remotesensing 15 02756 g013
Table 1. The accuracy evaluation metrics of the deep-learning-based solar PV site detection method on the test dataset using Sentinel-2 imagery.
Accuracy MetricsMetrics Values against the Test Dataset
IOU0.904
F-value0.932
Accuracy0.993
Precision0.974
Recall0.925
Table 2. The IOU values of the test dataset over different land cover backgrounds.
Background Land CoverNumber of ImagesIOU Values
Barren land1430.859
Cropland870.848
Forest790.972
Open water1290.971
Rice paddies540.847
Shrub520.924
Table 3. The frequency that a capacity was chosen as the closest power line to PV sites from 2019 to 2022. The counts are normalized by the number of PV sites built each year.
Estimated Built Year of PV SitesTransmission CapacityShare of the Capacity as the Closest Power Line to PV Sites (%)
2019220 kV71.6
500 kV16.05
110 kV8.64
210 kV3.7
2020220 kV74.8
500 kV17.89
110 kV4.47
210 kV2.85
2021220 kV49.16
500 kV38.25
110 kV12.19
210 kV0.17
220 kV; 110 kV0.11
500 kV; 220 kV0.06
230 kV0.03
33 kV0.03
2022220 kV51.71
500 kV26.2
110 kV21.16
210 kV0.64
220 kV; 110 kV0.16
500 kV; 220 kV0.08
33 kV0.04
Disclaimer/Publisher’s Note: The statements, opinions and data contained in all publications are solely those of the individual author(s) and contributor(s) and not of MDPI and/or the editor(s). MDPI and/or the editor(s) disclaim responsibility for any injury to people or property resulting from any ideas, methods, instructions or products referred to in the content.

