Article

Monitoring Impervious Surface Area Dynamics in Urban Areas Using Sentinel-2 Data and Improved Deeplabv3+ Model: A Case Study of Jinan City, China

1
School of Surveying and Geo-Informatics, Shandong Jianzhu University, Jinan 250101, China
2
Jinan Real Estate Measuring Institute, Jinan 250001, China
3
College of Applied Arts and Science, Beijing Union University, Beijing 100191, China
*
Author to whom correspondence should be addressed.
Remote Sens. 2023, 15(8), 1976; https://doi.org/10.3390/rs15081976
Submission received: 5 March 2023 / Revised: 2 April 2023 / Accepted: 7 April 2023 / Published: 8 April 2023

Abstract

:
Timely and rapidly mapping impervious surface area (ISA) and monitoring its spatial-temporal change pattern can deepen our understanding of the urban process. However, the complex spectral variability and spatial heterogeneity of ISA caused by the increased spatial resolution poses a great challenge to accurate ISA dynamics monitoring. This research selected Jinan City as a case study to boost ISA mapping performance through integrating the dual-attention CBAM module, SE module and focal loss function into the Deeplabv3+ model using Sentinel-2 data, and subsequently examining ISA spatial-temporal evolution using the generated annual time-series ISA data from 2017 to 2021. The experimental results demonstrated that (a) the improved Deeplabv3+ model achieved satisfactory accuracy in ISA mapping, with Precision, Recall, IoU and F1 values reaching 82.24%, 92.38%, 77.01% and 0.87, respectively. (b) In a comparison with traditional classification methods and other state-of-the-art deep learning semantic segmentation models, the proposed method performed well, qualitatively and quantitatively. (c) The time-series analysis on ISA distribution revealed that the ISA expansion in Jinan City had significant directionality from northeast to southwest from 2017 to 2021, with the number of patches as well as the degree of connectivity and aggregation increasing while the degree of fragmentation and the complexity of shape decreased. Overall, the proposed method shows great potential in generating reliable times-series ISA data and can be better served for fine urban research.

1. Introduction

The impervious surface area of the city (ISA) is the type of land cover that can prevent surface water from directly infiltrating into the soil, mainly including buildings, roads, squares, parking lots and other artificial structures. ISA can reflect the urbanization process and is a pivotal factor affecting the urban hydrological environment, local climate conditions and surface energy cycle [1,2]. Up-to-date ISA data can underpin the understanding of the spatial-temporal dynamic development changes of cities. Due to numerous merits, such as large-scale simultaneous observation, short revisit and low cost, the remote sensing technique has developed as the mainstream method for ISA mapping and its dynamic change analysis [3,4,5,6,7,8]. However, the complex spectral variability and spatial heterogeneity of ISA pose great challenges to accurate ISA dynamics monitoring. Therefore, developing a rapid and reliable ISA mapping methodology is considerably urgent for urban refinement management, infrastructure construction and sustainable development.
In recent decades, numerous approaches have been developed for ISA mapping, including ISA index-based, per-pixel classification and sub-pixel [9,10,11,12]. For example, Liu et al. developed a new index called NUACI for rapid large-scale ISA mapping by merging DMSP-OLS, MODIS EVI and NDWI, and an admirable result was derived [13]. In sub-pixel ISA mapping, Liu et al. designed a random forest regression routine for sub-pixel ISA mapping in Nansi Lake of China by combining China’s GF-5 hyperspectral images and GF-1 pan sharpening data [14]. For per-pixel ISA mapping based on image classification, Zhang et al. performed a global 30 m ISA mapping through combining random forest algorithm with multi-source and multi-temporal remotely sensed images on Google Earth Engine (GEE), with an overall accuracy of 95.1% and kappa coefficient of 0.898 [15]. The aforementioned index-based and sub-pixel ISA mapping method only highlighted the ISA region in the source image through mathematical operation; however, the determination of appropriate threshold is typically a challenging task to further amount to the total area in the enhanced image. The per-pixel ISP mapping approaches were mostly based on traditional machine learning, which were heavily dependent on handcrafted features and made little use of context information of neighboring pixels in classification. In addition, classification based solely on spectral and geometric features cannot solve the confusion caused by the heterogeneity of ground objects. Manually setting the features involved in classification is generally based on shallow features extracted from original data, without mining deep features.
With the advance of artificial intelligence, deep learning, especially the deep convolution neural network (CNN), has made substantial progress in computer vision due to its robust hierarchical features and learning capabilities. Currently, deep CNN for classification can be roughly generalized into two categories, image scene classification and semantic segmentation [16,17]. The former predicts the entire image patch fed into network as a single label. It is manifest that scene classification typically tends to lead to a jaggy predicted boundary for ground objects. Although a series of excellent network architecture (e.g., VGGNet, GoogleNet and ResNet) was developed for scene classification in recent years, the optimization of these networks was strongly dependent on huge sample sets (e.g., ImageNet) due to the large number of model parameters [18,19]. In contrast, constructing a huge sample set for land use/land cover classification is an extremely challenging task in remote sensing fields, which impels researchers to design lightweight network structures with a relatively small number of parameters for land use/land cover type identification. For example, Huang et al. developed a semi-transfer deep CNN called STDCNN for Hong Kong land-use mapping, while the performance of the mapping method is highly dependent on the quality of the STDCNN land-use classification, stated in their discussion. [20]. Liu et al. designed a semi-supervised deep CNN framework for urban green plastics cover mapping in Jinan City using Google Earth images, which was the first attempt to identify green plastic cover from VHR remote sensing data based on deep learning methods [21]. Compared with the preceding scene classification, semantic segmentation based on CNN has the capability of assigning a label to every pixel in an input image patch, which can yield a relatively clear boundary for ground objects due to inclusion of low-level details information. However, the per-pixel manner of semantic segmentation resulted in a relatively large overhead for computer resources compared with patch wise scene classification. As a pioneer, fully convolutional networks (FCN) proposed by Long et al. ushered in a new opening for CNN-based semantic segmentation, which replaced the last fully connected layers with convolutional layers to achieve end-to-end pixel-level classification [22]. Since then, numerous admirable network architectures have been developed for pixel-level image classification, such as Segnet, U-Net, PSPNet, Deeplab, etc. [23,24,25,26,27,28]. Due to its per-pixel classification manner, the abovementioned semantic segmentation networks were extensively applied in numerous remote sensing applications. For instance, Zhang et al. developed a novel Scale Sequence Residual U-Net for identifying and mapping individual plants, which produced the best performances in terms of both robustness to training sample size reduction and computational efficiency compared with the benchmarks, and its average accuracy reached 91.67% [29]. Adrian et al. designed a three-dimensional U-Net for crop type mapping through fusing multi-temporal Sentinel-1 data and Sentinel-2 multispectral data, and a competitive accuracy was derived through extensive ablation experiments [30]. In summary, semantic segmentation networks can actively learn features to obtain optimal models, reducing manual intervention and well compensating for the shortcomings of machine learning models, which play an important role in automatic extraction of ISA.
Jinan City, the capital of Shandong Province in China, is experiencing rapid urban expansion prompted by a series of regional development plans, which partially leads to the increased frequency of urban flooding due to the proliferation of ISA. Therefore, it is urgent to understand the spatial-temporal dynamic characteristics of ISA in Jinan City for building a healthy, happy and sustainable City of Springs. In this study, we aim to develop an accurate ISA mapping method and subsequently produce a time-series ISA data in Jinan City for exploring the ISA spatial-temporal dynamic characteristic. More specifically, this study aims (i) to determine whether ISA mapping accuracy is improved through combining an improved Deeplabv3+ with Sentinel-2 optical multispectral images, (ii) to yield a reliable annual continuous time-series ISA data in Jinan City from 2017 to 2021 and (iii) to understand what the ISA spatial-temporal variation characteristics were in Jinan City from 2017 to 2021.
The rest of this article is organized as follows. Section 2 introduces the study area and the data sources. Section 3 describes the details of the improved Deeplabv3+. In Section 4, the experiments and comparison analyses are presented. Section 5 is the discussion. Section 6 presents the main conclusions and suggestions for future work.

2. Study Area and Dataset

2.1. Study Area Overview

As the core city of the economic circle of the provincial capital, Jinan City lies in the Midwest of Shandong Province, spanning 36°00′N~37°32′N and 116°12′E~117°58′E. The mother river of China, the Yellow River, flows through Jinan City, starting from Pingyin County and ending at Jiyang County. Referring to the General Urban Planning of Jinan City (2011–2020) approved by the State Council, this study selected the planned central city of Jinan as the study area. The central urban area is mainly concentrated in the area suitable for construction between the southern mountain area and the northern Yellow River. It mainly covers the Licheng District, Lixia District, Shizhong District, Tianqiao District, Huaiyin District and Changqing District, with a planned area of about 1022 km2 (Figure 1). By 2019, the city’s built-up area was 760.6 km2, with a permanent population of 8.9087 million, an urban population of 6.3438 million and an urbanization rate of 71.21%. In recent years, Jinan has been experiencing rapid expansion and reconstruction, with the extent of the urban area continuously expanding and the ISA increasing rapidly.

2.2. Dataset

In this study, remotely sensed data for time-series ISA mapping and analysis were captured by Sentinel-2 multispectral instrument (MSI) with 13 spectral bands spanning from the visible and the near infrared to the short-wave infrared. The spatial resolution of MSI images varied from 10 m to 60 m depending on the different spectral band. As the first high-resolution multispectral imaging satellite of European Copernicus program, Sentinel-2 MSI images have been successfully applied to fire assessment [31], land cover classification [32,33,34] and emergency rescue services [35].
The preprocessing of Sentinel-2 images included atmospheric correction, resampling and image clipping. In order to weaken the adverse impact of soil and bare land on ISA extraction, the acquisition time of Sentinel-2 images used in this paper was limited to the period when vegetation growth is excellent (May–October). The time-series MSI images involved the L1C and L2A products, which were downloaded from the Copernicus Open Access Data Center website (https://scihub.copernicus.eu/dhus/#/home, accessed on 7 September 2022). Based on the SNAP processing tool, all bands were resampled to a 10 m spatial resolution. The detailed data description used in this study are listed as follows (Table 1).

3. Methodology

In this study, the workflow for time-series ISA mapping and spatial-temporal characteristics was illustrated in Figure 2. The main steps include (i) data preprocessing and samples construction; (ii) semantic segmentation model training; (iii) time-series ISA extraction; (iv) analysis of the spatial-temporal changes of the ISA.

3.1. Samples

Due to the large study area and the scattered distribution of ISA, in order to reduce the workload of manually interpreting and drawing samples, local areas with high-density ISA were selected from entire image of the study area for the production of sample labels. Taking 2020 as an example, four sample blocks were selected for model training as shown on the left of Figure 3, and one sample block was selected for the model test as shown on the right of Figure 3. In order to verify the migration ability of the model, a different sample block was selected from the images of the other four years for testing. Subsequently, these images and their corresponding masks were cropped to 512×512 pixels to feed the model. Figure 3 shows the distribution of the selected sample blocks and the schematic diagram of sample labels, where the white area is the ISA with label value of 1 and the black area is the permeable surface area with label value of 0. In addition, to enhance the generalization ability of the model and decrease overfit, several data augmentation techniques were adopted in this study, including image flipping, rotating, mirroring, adding noise and so on.

3.2. Details of Model Training

DeepLabv3+ is a typical network structure with high precision in the field of semantic segmentation at present, which introduces coder-decoder structure on the basis of the DeepLabv3 model. The encoder component is used to extract the representative hierarchical features from input images. The decoder component is used to restore the spatial resolution of feature maps and extract the target object using the learned features [30]. Several studies have demonstrated that the attention module can improve the performance of segmentation networks and enhance the accuracy of the predicted results [36,37]. In this paper, several attention modules (the CBAM module [38] and SE module [39,40]) were integrated into the Deeplabv3+ model to attempt to boosting the accuracy of the ISA mapping result. Meanwhile, considering the imbalance problem of positive and negative samples in sample set, the focal loss function [41] was adopted instead of cross-entropy loss to further improve the segmentation accuracy of the model.
The detailed structure of the improved Deeplabv3+ model is illustrated in Figure 4. In the encoder component, Xception network was used as the backbone network for feature extraction, while the ASPP (atrous spatial pyramid pooling) module was employed for mining multi-scale context information of the image using the hole convolution with various expansion rates. The CBAM (Convolutional Block Attention Module) was utilized to intensify the crucial content of feature maps as well as different feature maps. In the decoder part, both high-level features after four-fold up-sampling operation and low-level features extracted by Xception network were jointly passed into the SE module to highlight the feature maps with high importance. Subsequently, the abovementioned two kinds of features were concatenated and further processed to obtain the pixel-level prediction results with the same size with original input images using 3 × 3 convolution and a four- times up-sampling operation.
In this study, the deep learning library used was TensorFlow. The optimization of model parameters was conducted on the Ubuntu 20.04 operating system with Intel Xeon(R) Gold 5118 CPU and NVIDIA TITAN V with 12 GB memory. Due to its capability of automatically adjusting the learning rate value, the Adam optimizer with an initial learn rate of 10−4 was adopted in the process of model optimization. The number of epochs was set to be 50, while the batch size was set to be 3. In addition, an early stopping technique with patience equal to 10 was applied to decrease model overfit during training.

3.2.1. CBAM Module

As it is lightweight and generalizable, a convolutional block attention module (CBAM) can be integrated into any CNN architecture seamlessly with negligible overhead. The convolutional block attention module (CBAM) aimed to concentrate on significant features and suppress unnecessary features, which consisted of two sequential sub-modules, the channel attention module (CAM) and spatial attention module (SAM). The CAM can boost the weight of the input feature maps with a strong representative ability using a learned vector with its length equal to the number of channels of input feature maps. The SAM can improve the significance of different areas in each feature map by a position weight matrix with its height and width same as that of feature map. Such modules have demonstrated usefulness in feature extraction. The structure of the CBAM is illustrated in Figure 5.
Figure 6 illustrates the workflow of the CAM in detail. First, the maximum pooling and the average pooling operations were applied to input feature F (H × W × C) to obtain two weight matrices with the size of 1 × 1 × C. Subsequently, the two weight matrices was passed through the shared multi-layer perceptron. Finally, the two output features from the shared multi-layer perceptron were added together and activated by the sigmoid function to generate a weight matrix of 1 × 1 × C for highlighting key features through the multiplication operation with input features.
The SAM is used to obtain contextual features among global features, so that the features of the same kind at different locations are mutually enhanced, and the semantic segmentation ability is enhanced [42,43]. The workflow of the SAM is shown in Figure 7. First, the average and max operation were, respectively, applied to the channel dimension input features F (H × W × C) for yielding two matrices with the same dimension (H × W ×1). Then, a concatenation operation was performed to the above matrices on their channel dimension to derive a matrix of H × W × 2. Finally, a spatial attention map with the same size (height and width) as the input feature map was generated through a convolution operation and a sigmoid activation function to the matrix of H × W × 2, and a further made multiplication operation with input feature maps was used to improve the importance of different spatial location in each feature map. Therefore, the spatial attention was the weighted sum of spatial location features and the original feature map. According to the spatial attention map, the context features were aggregated so that similar semantic features could promote each other.

3.2.2. SE Module

The SE module can be divided into two steps: squeeze and excitation. The aim of the squeeze step was to obtain the global compressed feature by performing the global average pooling operation on the input feature maps. Excitation aimed to derive the importance of each input feature using two fully connected layers and then use the weighted feature map as the input of the next layer of the network [44]. Figure 8 depicts the structure of the SE module. Initially, the input X was mapped to the output U (H × W × C) through any given Ftr transformation. Then, the U was passed through a squeeze operation to produce a channel descriptor by aggregating the feature map in spatial dimensions (H × W). The function of this descriptor was to generate a globally distributed embedding of channel characteristic response, allowing the information of the global receptive field of the network to be used by all its layers. Aggregation was followed by an incentive operation, which adopted the form of a simple self-gating mechanism that took the embedding as input and produces a collection of modulation weights for input features. These weights were applied to the U to obtain the output of the SE block, which could be directly input to the subsequent layers of the network.

3.2.3. Focal Loss Function

In the image classification task, the model is susceptible to imbalance between positive and negative samples. On the one hand, more non-target samples or backgrounds provide too much useless information, reducing the training efficiency of the model. On the other hand, the model prefers to predict the type with a large sample size. Meanwhile, sample diversity plays a pivotal role in boosting generalization capability of model. Although the proportion of some samples belonging to the same category may be low, they, called hard samples here, are beneficial to enhancing sample diversity. To address the problem of unbalanced positive and negative samples and hard sample mining, the focal loss function is introduced in this paper. Focal loss is an improvement for the commonly used cross-entropy loss function by adding adjustment factors of sample weights to alleviate the problem of unbalanced sample categories and boost hard samples mining. The mathematical formula is as follows.
F f o c a l   l o s s ( p ) = α ( 1 p ) γ log p , p = 1 ( 1 α ) p γ log ( 1 p ) , p = 0
where p is the true label; p′ is the predicted probability; α is the weight parameter of the category in binary classification, which is used to adjust the imbalance of positive and negative samples; γ is the focus parameter; and (1 − p′)γ is used to regulate the simple-hard sample problem.

3.3. Accuracy Assessment

To verify the segmentation performance of the proposed segmentation model, four evaluation metrics, Precision, Recall, IoU and F1 value, were adopted for accuracy verification. For binary image classification, four predicted outcomes exist for an image: True Positive (TP), True Negative (TN), False Positive (FP) and False Negative (FN)—where TP is the number of pixels correctly classified as ISA category, TN is the number of pixels correctly classified as permeable land surface, FP is the number of pixels misclassified as ISA, and FN is the number of pixels misclassified as permeable land surface. The detailed calculation formulas are as follows.
Precision = T P T P + F P
Recall = T P T P + F N
IoU = T P T P + F P + F N
F 1 = 2 × Precision × Recall Precision + Recall
Precision indicates the proportion of the pixels correctly predicted as ISA to the total of ISA pixels in predicted result. Recall refers to the proportion of the correctly predicted ISA pixels to the total of ISA pixels in ground truth. F1 combines Precision and Recall can comprehensively evaluate the accuracy of model. IoU refers to the ratio of the intersection of the predicted result and ground truth over their union, and the higher value represents a better fit for the model.

4. Results

4.1. Accuracy Assessment of Result

This section evaluates the accuracy of ISA generated by the improved Deeplabv3+ model using qualitative and quantitative measures. The qualitative method refers to the manual visual check between the distribution of ISA and the corresponding true-color image. The quantitative approach is based on the four metrics described in Section 3.3.
Figure 9 shows the local ISA extraction results. From Figure 9, it can be observed that the distribution of ISA had good consistency with that of corresponding true-color image, which indicated that the presented model can accurately separate ISA from other land use/land cover types. Through further visual check, the boundary of the ISA extraction result was clear. However, omissions and misclassifications for fine ISA are inevitable. For example, some narrow and long permeable surfaces distributed along the road and the bare land will be misclassified as ISA, reducing the accuracy of ISA mapping.
According to Table 2, it can be found that the Precision, Recall, IoU and F1 reached 82.24%, 92.38%, 77.01% and 0.87, respectively, which demonstrates that the improved Deeplabv3+ achieved good performance in identifying ISA from Sentinel-2 multispectral images.

4.2. Comparison of the Results of Traditional Classification Methods

To further verify the advantages of the proposed method in ISA extraction, we compared it with the random forest (RF) [45] and support vector machine (SVM) methods [46]. As two commonly used traditional image classification methods, RF and SVM have gained more attraction and achieved satisfactory classification results in remote sensing field over the past decades [47,48]. To ensure the comparability of the experiments, sample points were selected within the training sample area, in which 632 ISA, 649 croplands, 687 forestlands, 591 grasslands, 360 watersheds, 397 bare lands and 370 others were selected for training samples, while 424 ISA, 279 croplands, 295 forestlands, 253 grasslands, 155 watersheds, 260 bare lands and 158 others were selected for test samples. The ntree and mty parameters used in RF algorithm were set to 500 and the square root of the total number of classification features, respectively. For SVM classification, a radial basis was selected as the kernel function. The Gamma value in the kernel function was set to the inverse of the number of features. The classification results were processed into binary classification maps containing the ISA and background. The accuracy calculation results are shown in Table 2.
From a quantitative perspective, as shown in Table 3, the presented method outperformed RF and SVM in all four accuracy metrics. Although the Precision (82%) of SVM was close to that (82.24%) of the presented method, the other values of the three accuracy metrics of SVM were clearly lower than that of the proposed approach. In addition, the IoU and F1 of RF was close to that of SVM, but they remained inferior to that of the proposed method. The Precision, Recall, IoU and F1 of the proposed method were improved by 3.42%, 22.38%, 17.85% and 0.13%, respectively, compared to the four accuracy metrics of RF, and improved by 0.24%, 27.38%, 19.99% and 0.14%, respectively, in comparison with SVM. The comparison analysis of accuracy revealed that the improved Deeplabv3+ model was more effective and advantageous than the traditional pixel-wise classification algorithms in ISA mapping based on Sentinel-2 data. In addition, both traditional classification algorithms tended to misclassify bare land as ISA. The reason may be that the classical machine learning method is not enough to mine the deep features of spectral and spatial information, while the deep CNN can mine more abstract semantic information and is more accurate in distinguishing ISA from bare land.

4.3. Comparison of Different Semantic Segmentation Model

This section mainly justifies the superiority of the improved Deeplabv3+ through a comparison with classical CNN semantic segmentation networks such as FCN8, U-Net and original Deeplabv3+. To ensure the comparability of the results, all CNN segmentation models exploited the same training and test samples. Table 4 shows the accuracy comparison of different CNN semantic segmentation model. Overall, all four deep learning methods achieved good accuracy. Although the Precision of the improved DeepLabv3+ model in this paper was lower than that of the FCN8 and U-Net models, the Recall, F1 value and IoU of the proposed model were higher than that of the other three models, with the Recall, F1 and IoU increasing by 7.91%, 0.03 and 4.65% in comparison with FCN8, and increasing by 7.72%, 0.03, and 3.86% compared with U-Net. Therefore, the overall performance of the proposed model was superior to FCN8 and U-Net. Meanwhile, compared with the original DeepLabv3+ model, all accuracy metrics for the improved Deeplabv3+ had higher values, with the Precision, Recall, F1 and IoU increasing by 0.18%, 3.3%, 0.02 and 2.45%, respectively, indicating that the introduction of the CBAM module, SE module and focal loss function improved the extraction accuracy of ISA in high-resolution remote sensing images to a certain extent. The comprehensive comparative analysis demonstrates that the ISA extraction accuracy based on the improved DeepLabv3+ model is the best, with the IoU of 77.01% and the clear edge information of the ISA, which proves the effectiveness and accuracy advantage of the proposed model.

4.4. Analysis of Spatial-Temporal Variation of Impervious Surface in Jinan City

4.4.1. Time-Series ISA Mapping

As stated in Section 4.1, the proposed model achieved a satisfactory accuracy of ISA mapping. This section aims to apply the presented model to produce annual time-series ISA distribution data from 2017–2021 in Jinan City from Sentinel-2 multispectral data with a resolution of 10 m. Figure 10 illustrated the time-series ISA distribution from 2017 to 2021 in Jinan City. Through a comparison between the ISA spatial distribution and its corresponding Sentinel-2 true-color images, we found that distribution of ISA has good consistency with that of its true-color image, which indicates that the model has good generalization ability and can be used to generate reliable time-series ISA for the study of spatial-temporal changes of the ISA.

4.4.2. ISA Area Change

Table 5 shows the annual ISA area and percentage in Jinan City from 2017 to 2021. Figure 11 displayed the spatial-temporal evolution of ISA in Jinan City. It can be observed that the ISA from 2017 to 2021 showed a change of growth-decrease-growth, but the change of area was quite small among different years. Among them, the area only increased by 2.26 km2 from 2017 to 2018, and the area of ISA decreased year by year in 2018–2020. The ISA area reached the lowest value in recent years in 2020, which was due to the severe COVID-19 situation. In the following year, the COVID-19 situation firmed up, resulting in the gradual recovery of construction projects as well as the gradual improvement of the economy, leading the ISA area to reach 496.87 km2 in 2021, with an increase of 49.72 km2 in comparison with 2020. From the whole period, the ISA area varied from 465.02 km2 in 2017 to 496.87 km2 in 2021, with an increase of 31.85 km2. Meanwhile, the ISA area percentage varied from 45.80 in 2017 to 48.93 in 2021, with an increase of approximate three percentage point during the whole study periods.
According to Figure 11, the new areas of the ISA (red areas) were significantly more than the areas of ISA reduction (yellow areas) from 2017 to 2021, which was consistent with the area statistics. During the five consecutive years, Jinan City has been in the development stage of continuous planning and construction, with the urban spawl in Jinan City displaying a pattern to the east and minor ISA changes emerging in the central region. The reduction of ISA was mainly distributed in the village demolition in the western Huaiyin District and Changqing District, the relocation of Jigang Area in the east and the demolition of illegal construction in the whole region. The new areas are mainly concentrated in the development of the eastern Licheng District, including the construction of the new East railway station, the development of residential areas, the new industrial parks and factories. The change of ISA in the central area is not remarkable, with little new ISA. Overall, the expansion of the central urban area of Jinan City is consistent with the urban plan of Jinan City and reflects the development status and urbanization process of Jinan City.

4.4.3. Change Analysis of Landscape Pattern

Landscape pattern refers to the type, size, shape and spatial configuration of landscape patches [49,50,51]. The landscape pattern index can highly concentrate this information and quantitatively reflect the characteristics of the target in terms of organization and spatial configuration. According to the research needs, we selected Number of Patches (NP), Patch Density (PD), Landscape Shape Index (LSI), Largest Patch Index (LPI), Mean Patch Area (AREA_MN), Aggregation Index (AI) and Patch Cohesion Index (COHESION) to analyze the landscape pattern of ISA and its change characteristics; the specific meaning and calculation formula of each index are shown in Ref [52].
Table 6 shows the index of the ISA landscape pattern during 2017–2021. It can be seen that the NP and PD were decreasing-increasing-decreasing-, with the maximum and minimum values appearing in 2019 and 2018, respectively, while the change trend of the AREA_MN was the opposite of the NP and PD absolutely, indicating that the ISA was the most broken in 2019. Then, the ISA continued to expand with the increasing NP, which showed a filling growth trend. The new patches were gradually connected with the existing ISA to form larger patches, reducing the degree of fragmentation. The LSI increased year by year from 2017 to 2020, while it decreased slightly in 2021, indicating that the shape of the ISA had changed, which tended to be complex and irregular. The LPI decreased from 2017 to 2020, yet increased again in 2021, showing an overall growth trend, reflecting the trend that the ISA decreased first and then increased. The AI and COHESION remained above 94 and 99, respectively, in recent years, demonstrating that the aggregation degree and connectivity of the ISA were always at a high level.
Overall, remarkable changes of the landscape pattern of ISA in the central city from 2017 to 2021 occurred, with the PN and LPI increasing, yet the degree of fragmentation decreased. All of these indicated that the ISA continued to grow and fragment regions were gradually connected, which increased the connectivity and aggregation of ISA and reduced the shape complexity.

5. Discussion

5.1. Impact of Including CBAM and SE Module on ISA Mapping

In this section, we discuss the impact of integrating the CBAM and SE module into the Deeplabv3+ model on ISA mapping. In the field of deep learning, the introduction of an attention mechanism means that the network model does not need to process huge amounts of input information, some of which may be redundant, to the same standard, allowing the network to focus on specific parts of the input. In the detection of ISA, due to the existence of small, complex and overlapping samples, the spatial perception ability of the model is also very important. The CBAM module contains two sub-modules, CAM and SAM. After the introduction of the CBAM module, the input feature maps will be sequentially passed through CAM and SAM to extract representative semantic features in both channel and spatial dimensions, thus improving the feature representation capability. The SE module can perform feature recalibration through squeeze and excitation block. As shown in Table 4, the accuracy of ISA yielded by the proposed model was boosted after introducing the CBAM and SE module, with the Precision, Recall, F1 and IoU increasing by 0.18%, 3.3%, 0.02 and 2.45%, respectively, in comparison with the original Deeplabv3+ model, and the edge information of the ISA is clear. In the experiment testing the generalization ability of the proposed model with high-resolution remote sensing images of Jinan City, good results in the extraction of ISA information were achieved. Overall, the improved Deeplabv3+ model has robust generalization ability, which can be used to produce reliable time-series ISA for the study of spatial-temporal changes of ISA.

5.2. Comparison with Other Methods

In this section, we focus on the advantage of the proposed method over other ISA mapping methods. In order to verify the influence of different classification methods on the extraction results of ISA, we compared the improved Deeplabv3+ model with traditional classification methods and classic CNN semantic segmentation models. The experimental results showed that the accuracy of the ISA produced by SVM and RF was inferior to that of the improved Deeplabv3+ deep learning method, and the classification results had an obvious salt-and-pepper effect. The reason could be that classical machine learning methods are insufficient to mine the deep features of spectral and spatial information and lack the ability to capture the high-level representative features when compared to deep learning models, leading to a performance gap in ISA mapping, whereas the deep CNN could extract high-level discriminative features. The results revealed that deep CNN could mine more representative features for ISA mapping.
We examined the superiority of the improved Deeplabv3+ through a comparison with a classical CNN semantic segmentation network such as FCN8, U-Net, and original Deeplabv3+. The FCN8 model realizes semantic segmentation through the full convolution network structure, yet there was still room to improve the segmentation accuracy and other aspects. For example, the FCN8 model is not only not precise enough for the contour and edge classification results of the ISA, but also its sensitivity to detail is low, and the spatial relationship between pixels is not fully considered, resulting in small objects in the image being easily ignored. In addition, the FCN8 model fuses the high-level and low-level semantic information through the addition operation, while the ISA data generated by the FCN8 model have a blurred boundary due to the inclusion of inadequate low-level features containing affluent texture information.
The U-Net model is an improved structure based on FCN [26], which combines the characteristics of transposed convolution and the jump network. One of the differences with the FCN network is that there are a large number of feature channels in the up-sampling part of the U-Net network, which allows the network to propagate context information to higher-resolution layers. When implementing the up-sampling operation to restore the size the feature map to its original size, the U-Net model integrated more low-level features with rich textures into high-level features; therefore, the boundary of the ISA result was relatively clear, and the ISA extraction accuracy was relatively high. However, although the U-Net model combines the features of different scales of the corresponding compression channel through jump connection, its transmission features are relatively simple, resulting in its limited generalization ability for multi-scale features. Especially in high-resolution remote sensing images, due to the complex background of ground objects, there will be many sparse ISA with small coverage areas and irregular shapes, and its network structure will inevitably lose significant details, such as small ISA, which makes it difficult to accurately extract data.
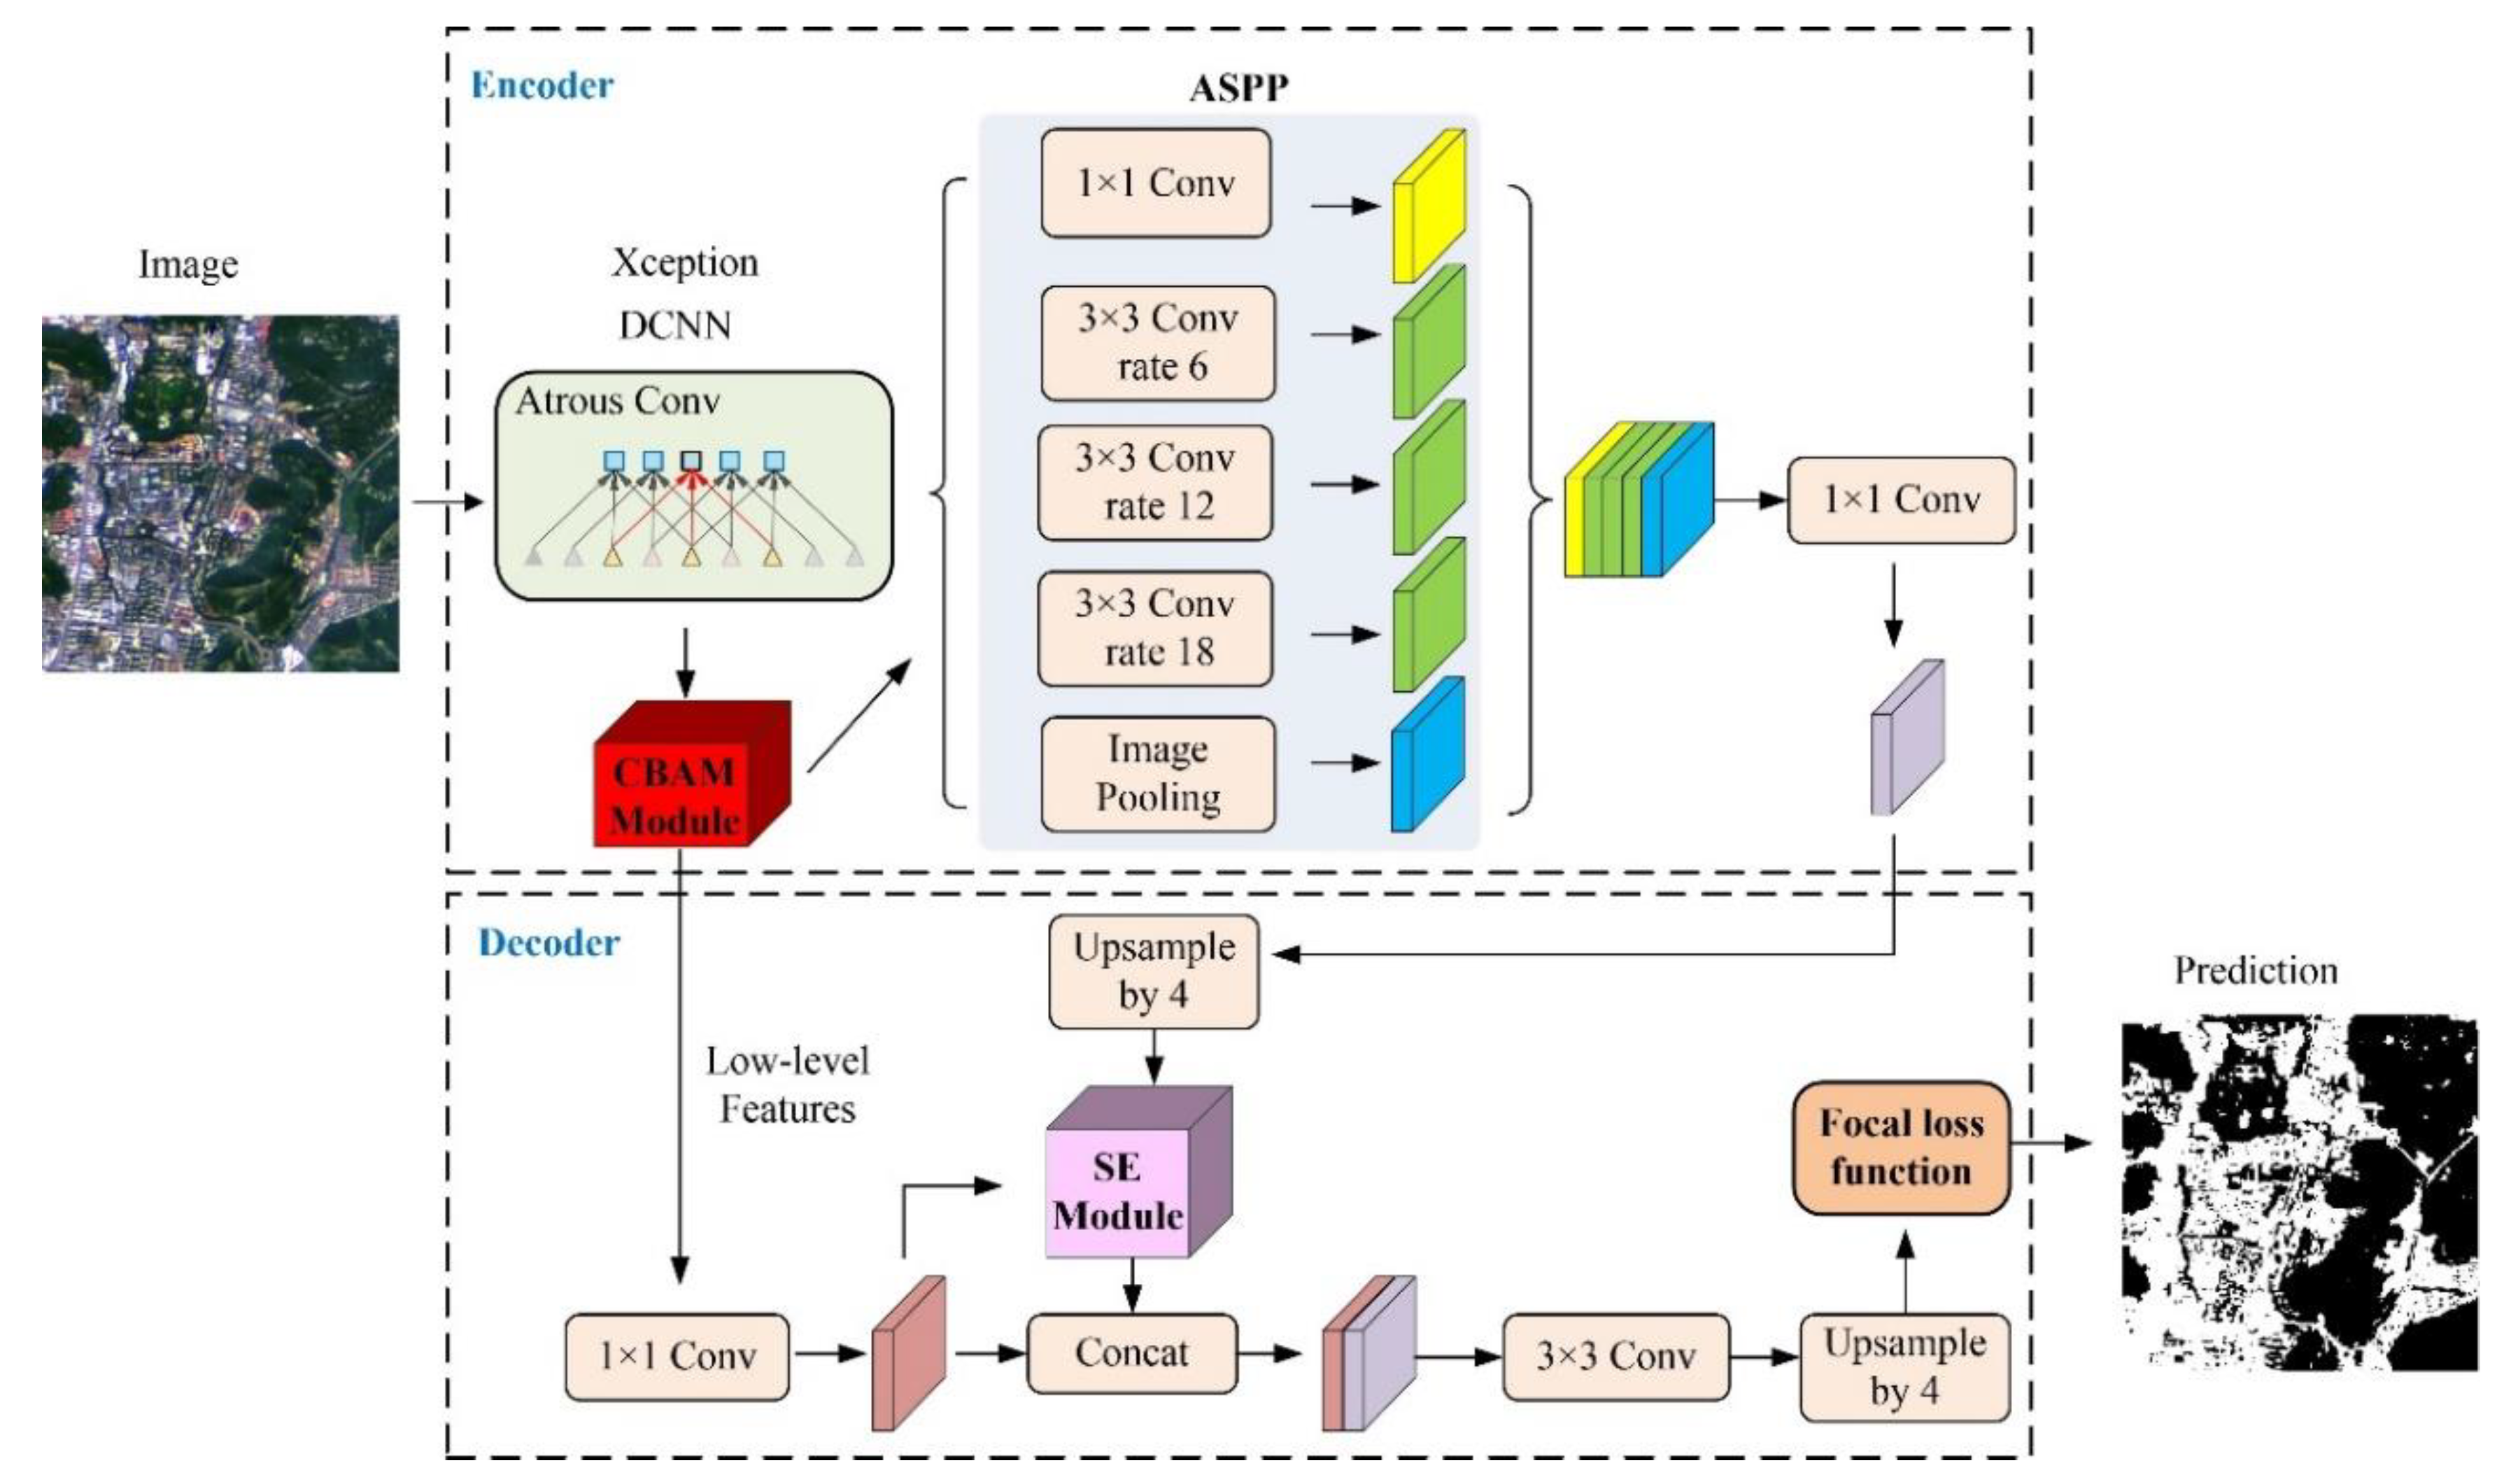
DeepLabv3+ employed the encoder-decoder structure where DeepLabv3 was used to encode the rich contextual information, and a simple yet effective decoder module was adopted to recover the object boundaries. One could also apply the atrous convolution to extract the encoder features, which include shallow features, deep features and multi-scale features at an arbitrary resolution, depending on the available computation resources. Moreover, the addition of the Xception model and atrous separable convolution made the DeepLabv3+ model faster and stronger. The performance of the model was significantly improved, which resulted in the relatively clearer boundary of the ISA result and the further improved accuracy of ISA extraction.
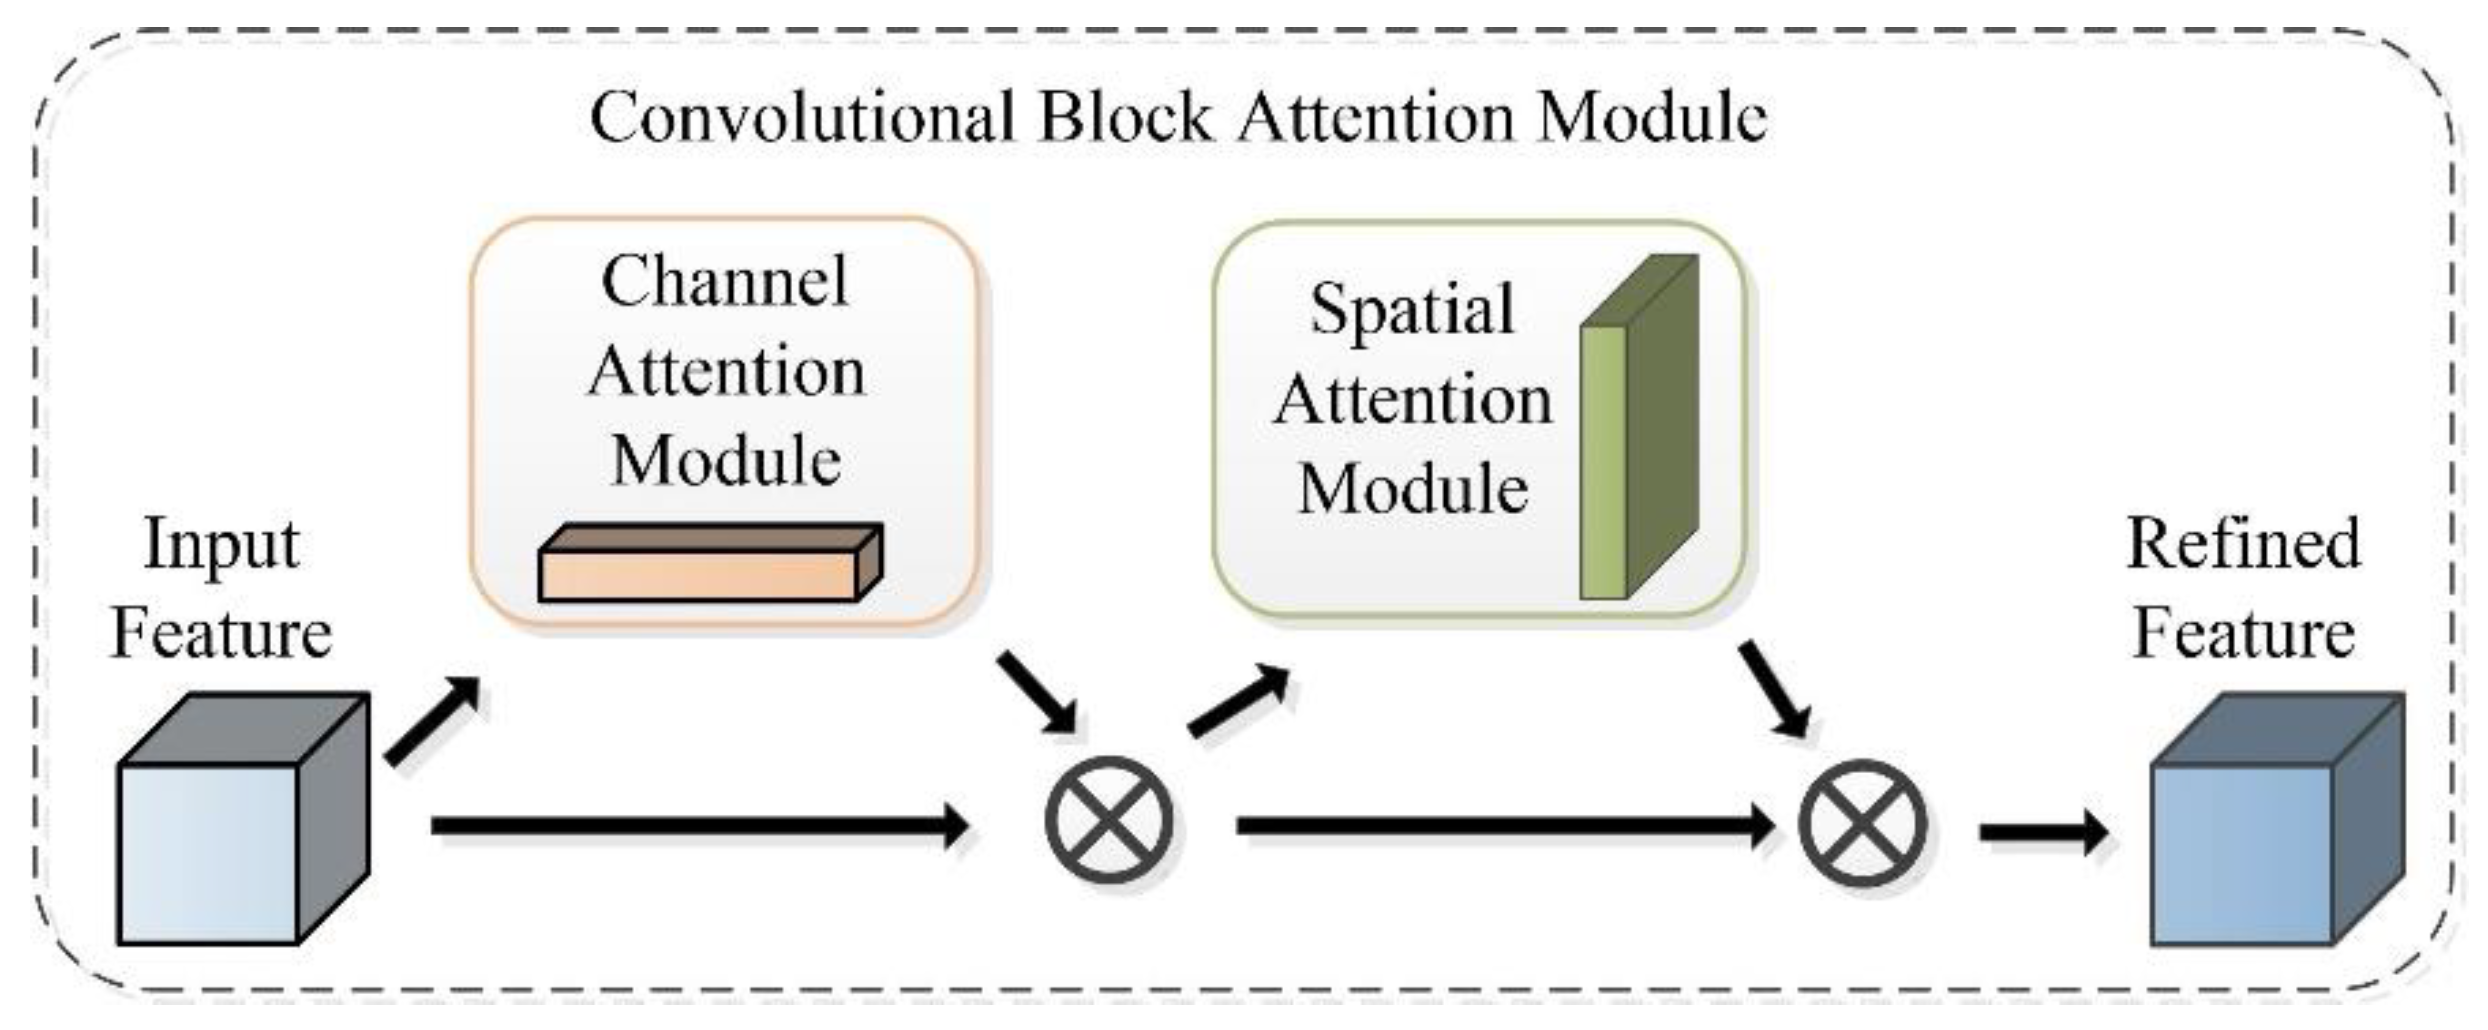
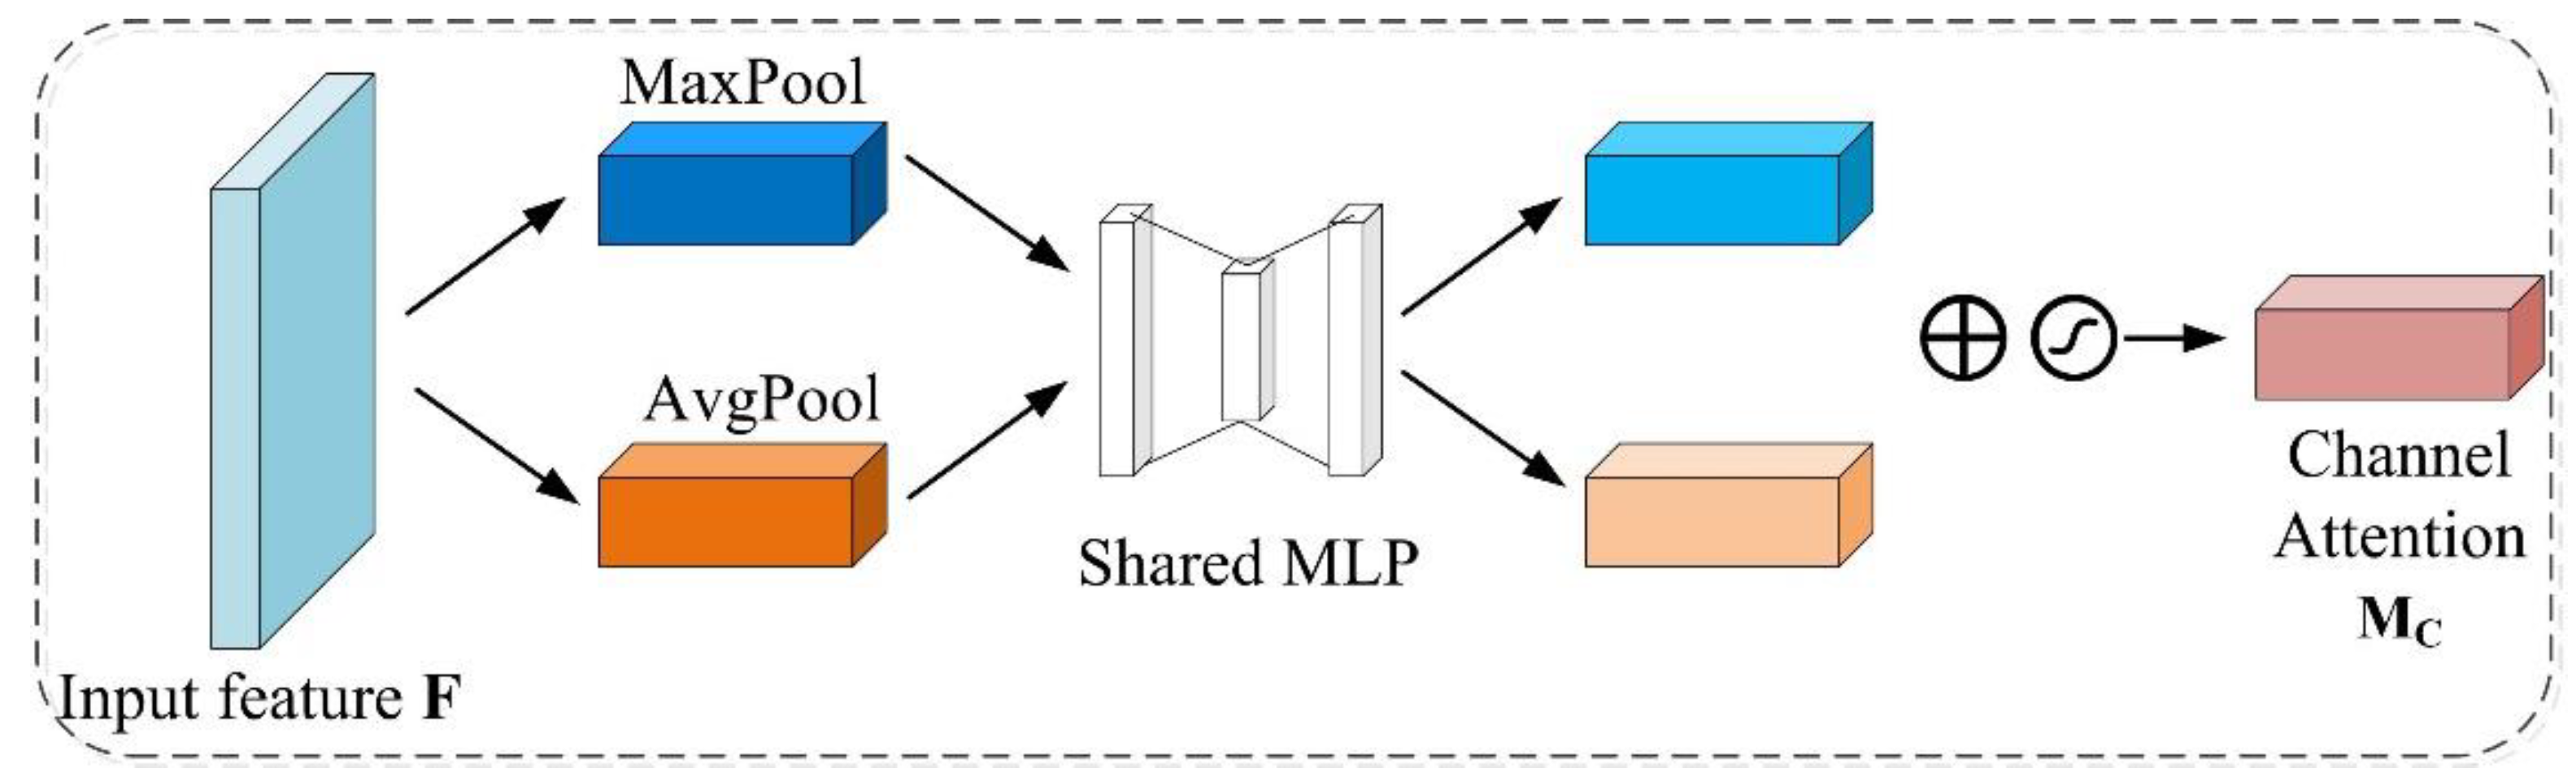
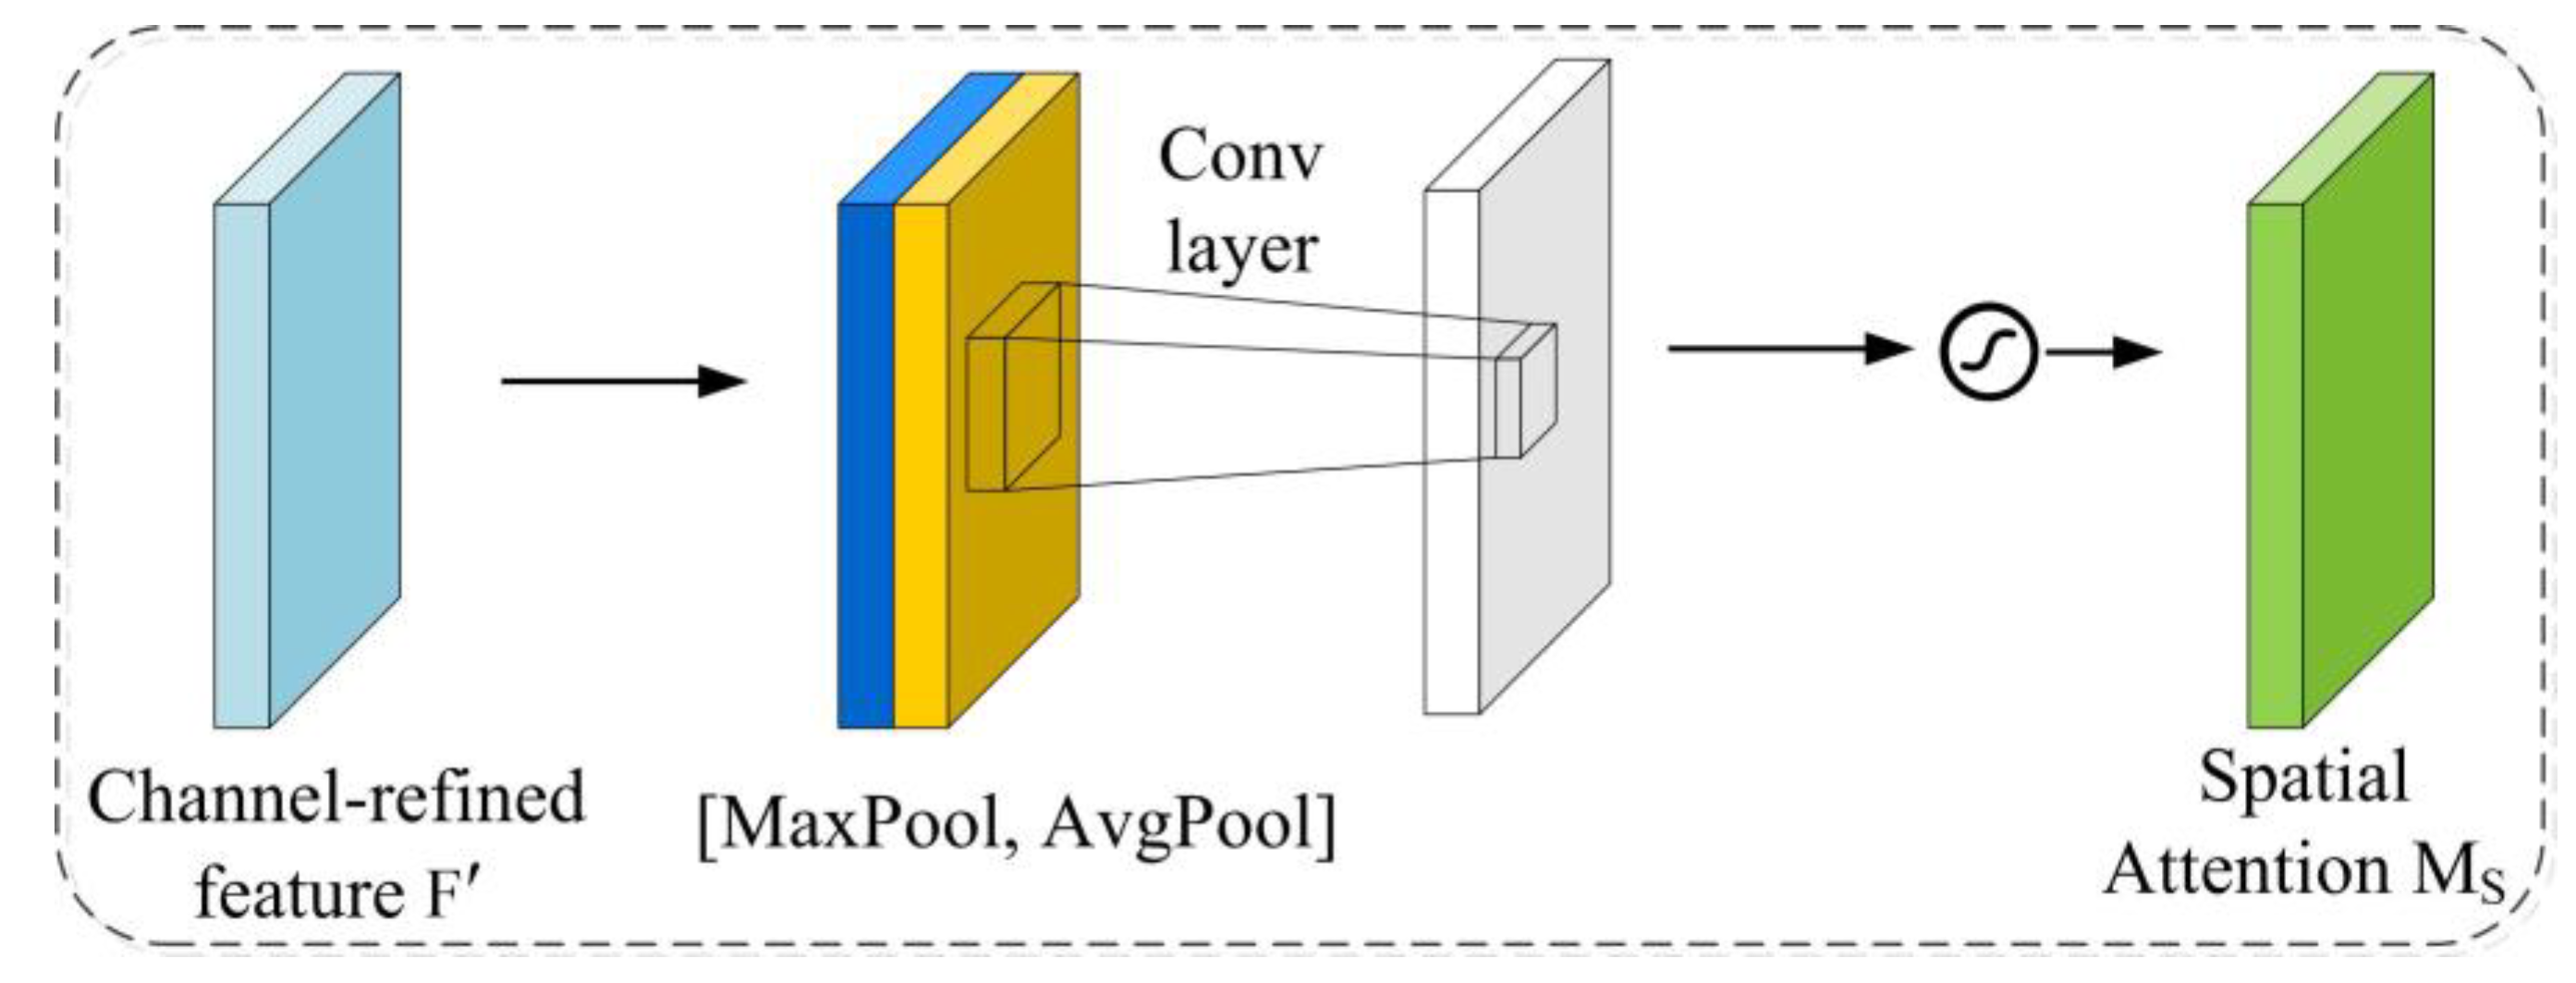
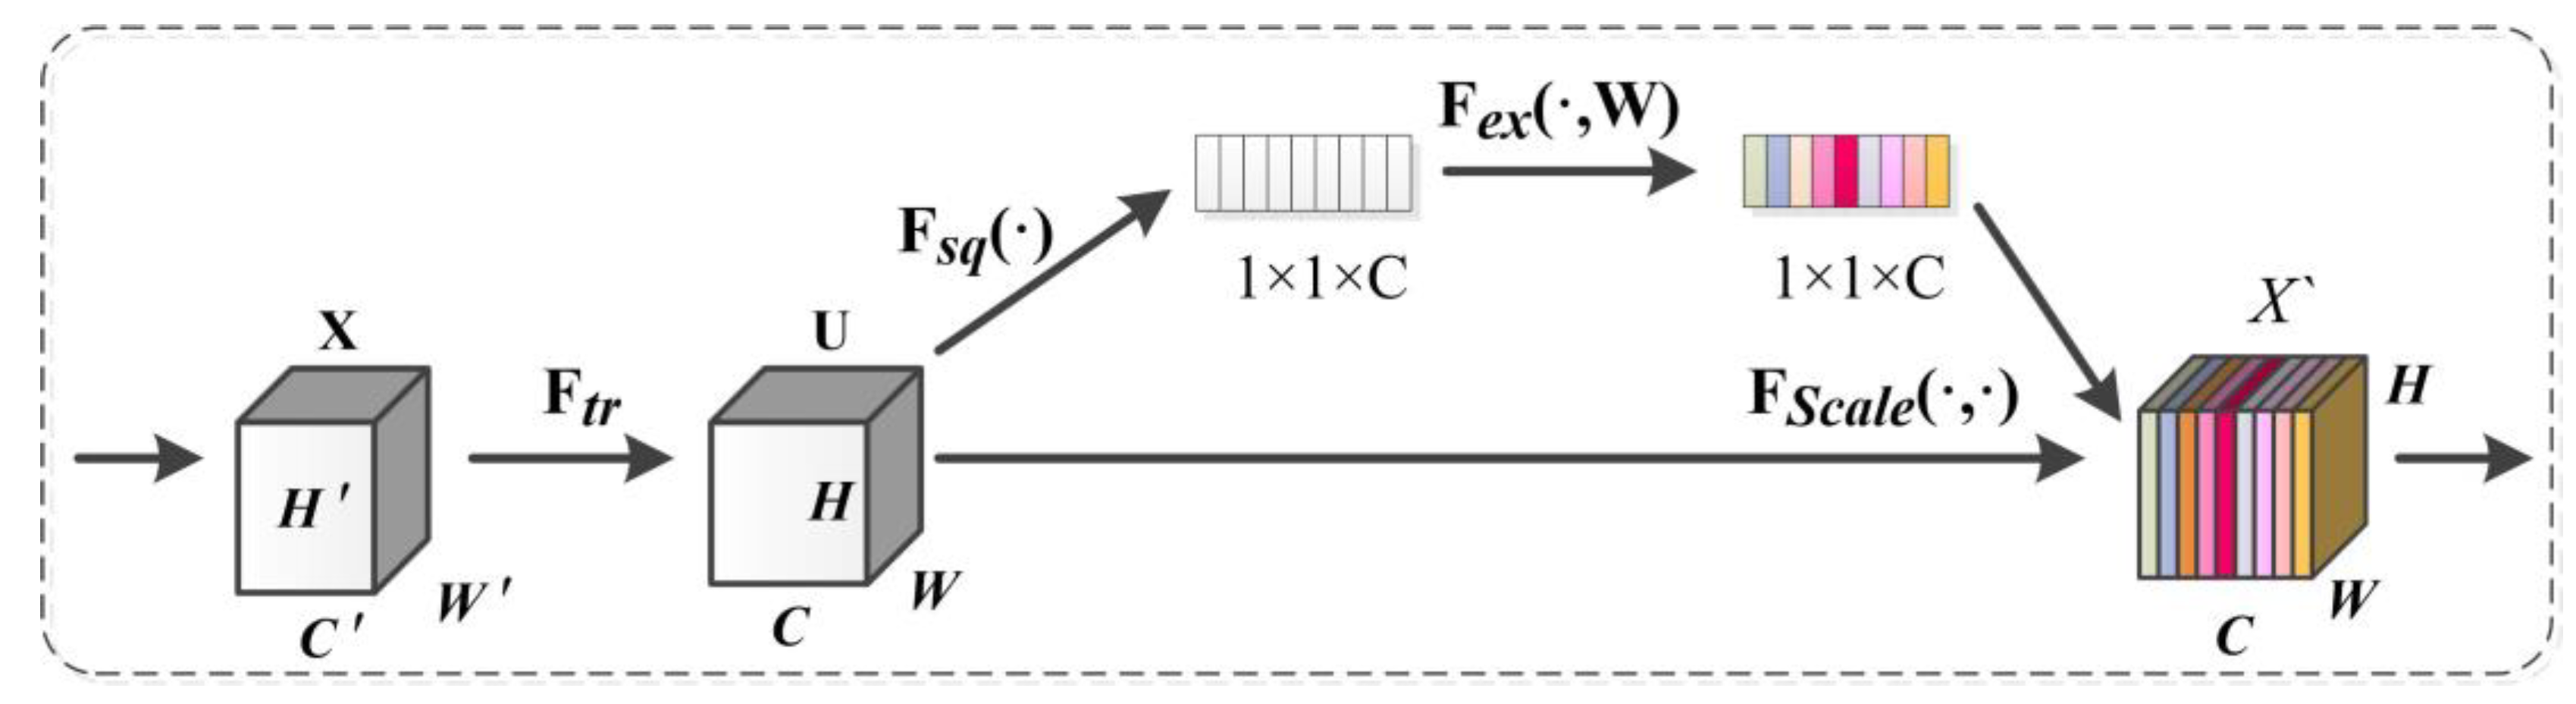
The improved Deeplabv3+ model integrates the dual-attention CBAM module, SE module and focal loss function into the Deeplabv3+ model, which can improve importance of the different location and channel of the feature maps, as well as enhance the identification ability of the network to ISA. As can be seen in Table 3 and Table 4, the Precision, Recall, F1 and IoU of the proposed method in this paper had the highest overall performance accuracy, which proves the effectiveness of this method. Therefore, the proposed method has more advantages in ISA mapping with Sentinel-2 and can achieve accurate ISA extraction.
Meanwhile, it is necessary to discuss the limitations of our method through comparison with previous studies on ISA mapping. In a previous study conducted by Zhang et al., combined multispectral optical data and dual polarization SAR data to identify urban impervious surfaces. In their studies, Zhang et al.’s resulting Precision, Recall, IoU and F1 reached 89.33%, 90.37%, 81.56% and 89.85%, respectively, as calculated from their confusion matrix [
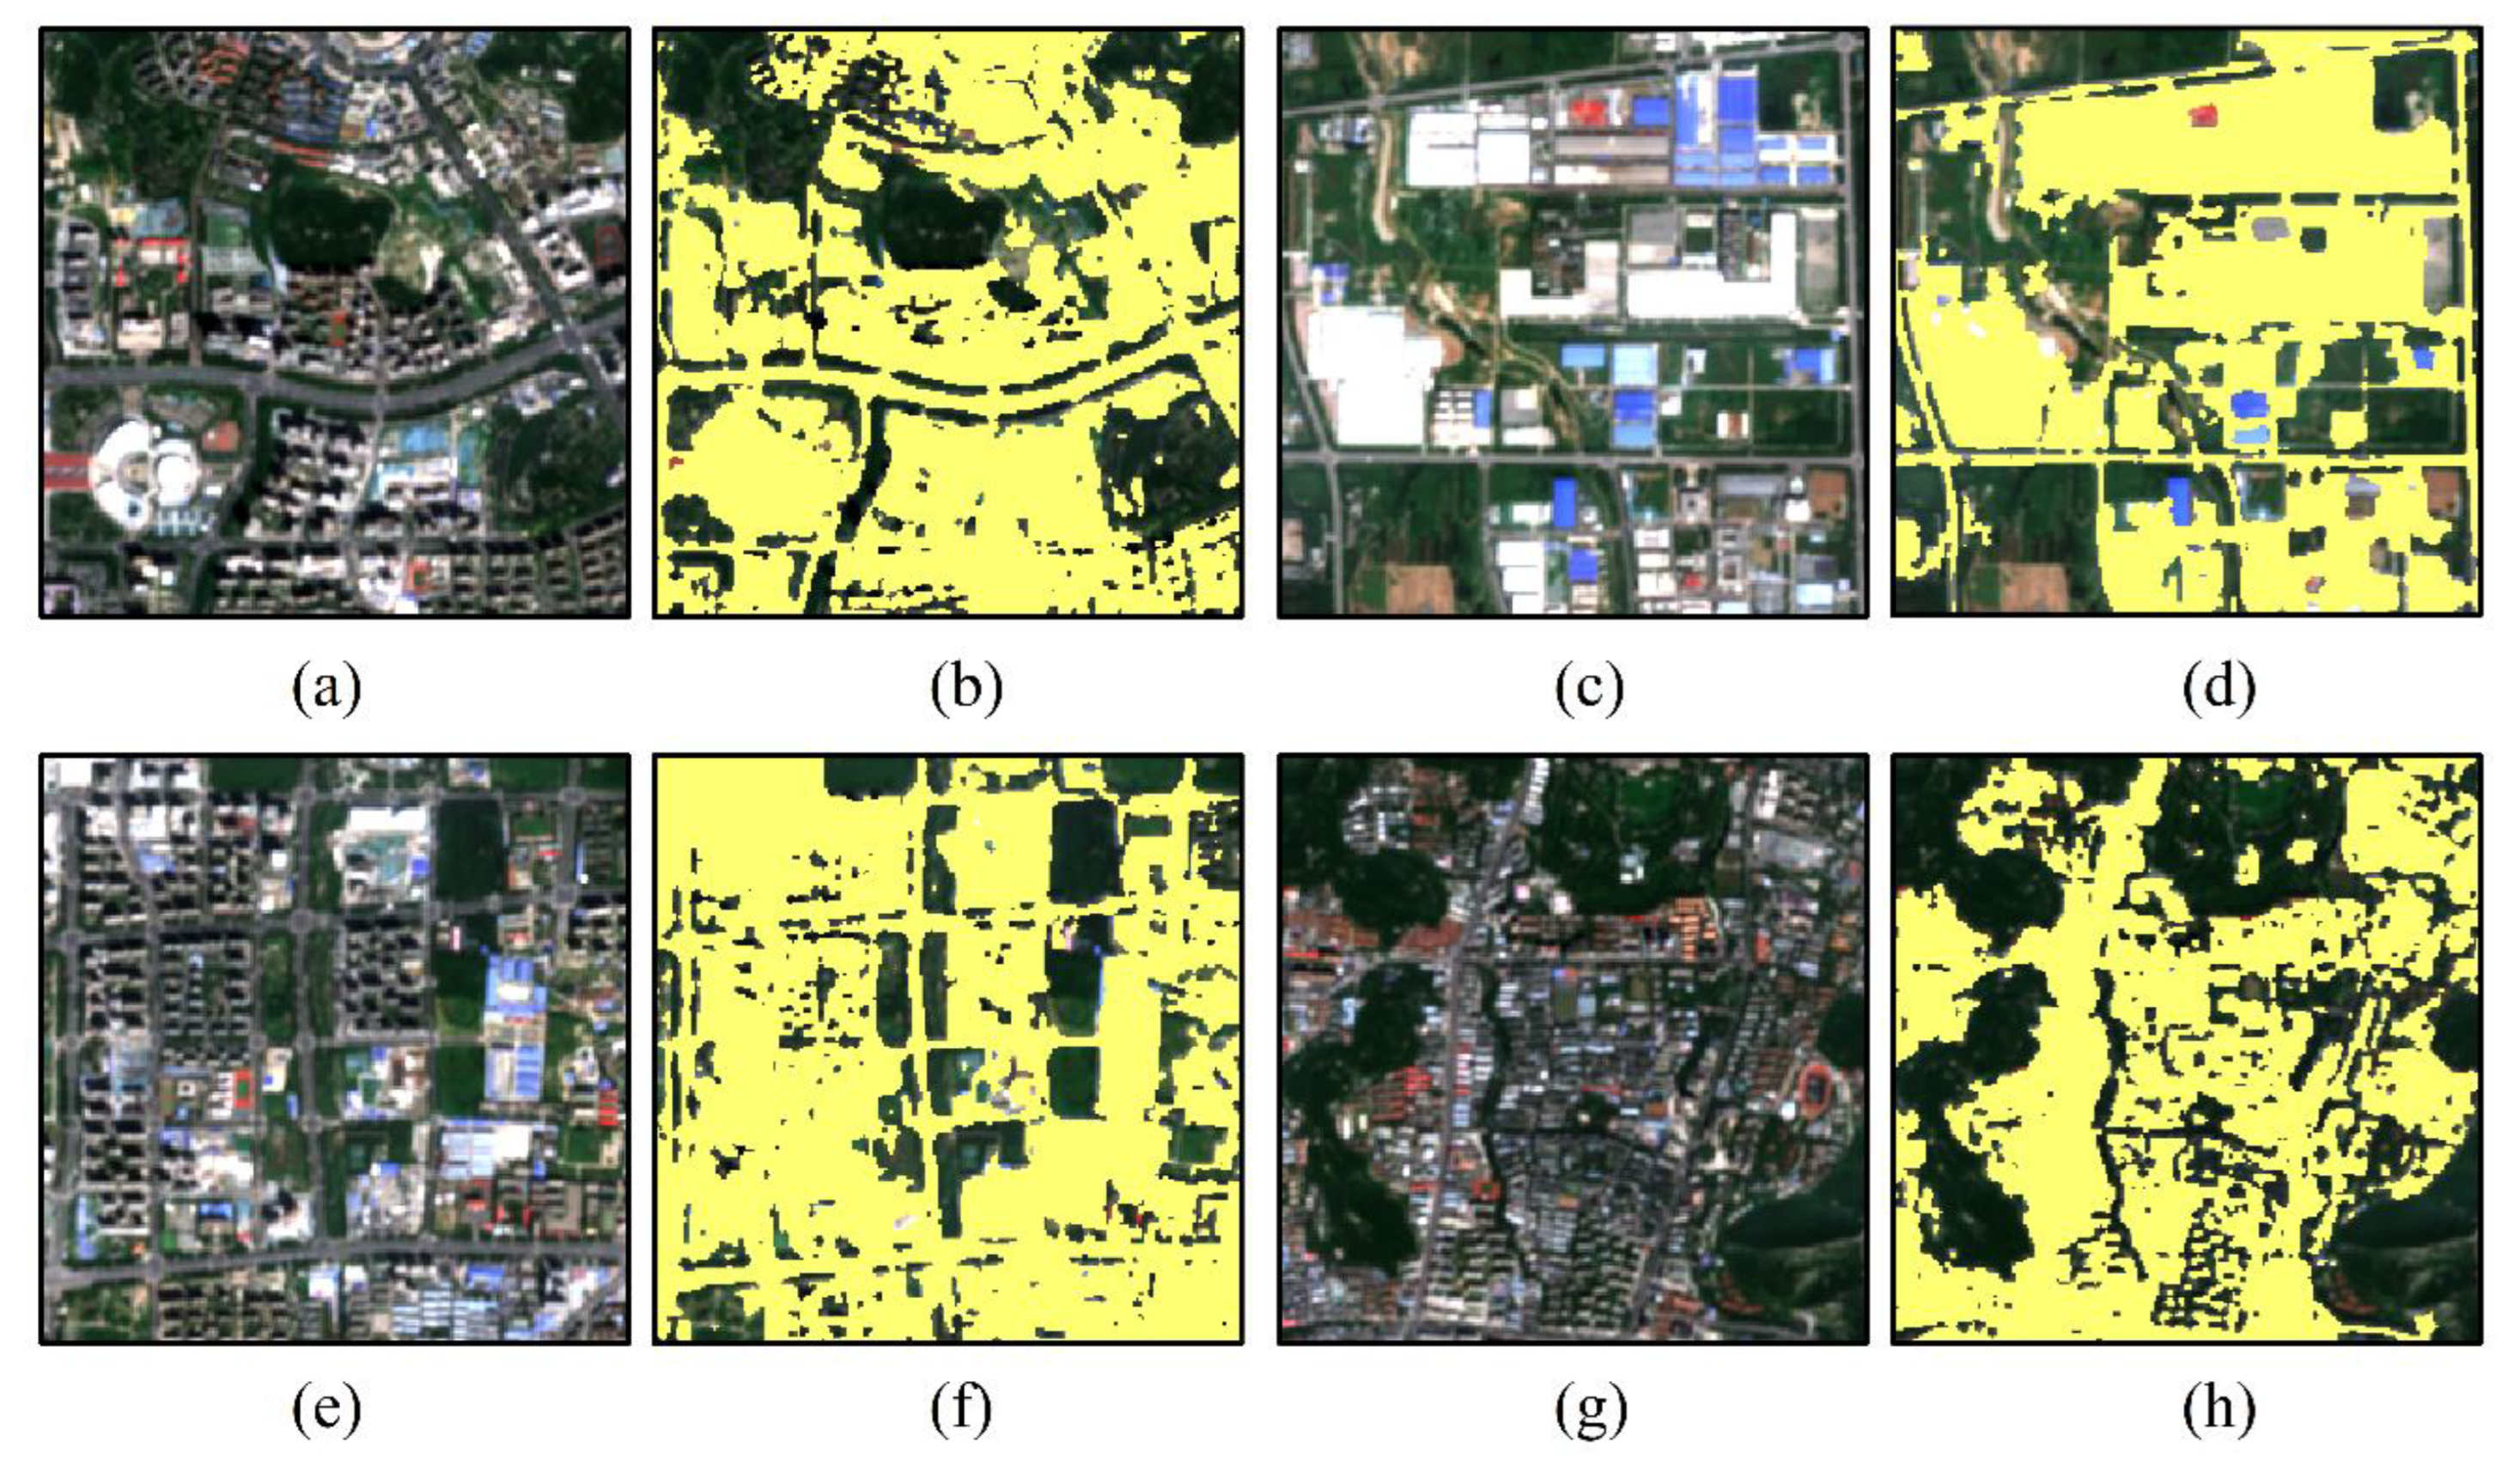
35]. Compared to the accuracy of our method, the Precision, IoU and F1 of their research were improved by approximately 7.09%, 4.55% and 2.85%, respectively, which may have been due to the fact that a large volume of test samples was selected and that the Sentinel-2 single-source data with only 4 bands were used in our study. The number of the test samples in their study was 1028 for impervious surfaces (DIS + BIS) and 1607 for pervious surfaces, respectively, while the number of the test samples in our study was 566,623 for ISA and 481,953 for pervious surfaces, respectively. We believe that a large volume of test samples is more reliable for our ISA mapping model validation. Moreover, the introduction of TerraSAR-X data with a 3 m resolution in their study improved the classification accuracy to a certain extent. Nevertheless, from the perspective of visual interpretation, the results of the ISA extracted by the proposed method in this study are highly matched with the corresponding true-color images, indicating that the proposed method still has a powerful ISA identification ability.
Moreover, applying our improved model to other remote sensing images or Sentinel-2 images without atmospheric correction or other pre-processing operations may affect the accuracy of ISA mapping. In addition, due to the fact that architectural styles vary from region to region, such as significant differences in architectural styles between northern and southern in China, the presented model may also lead to a reduced classification accuracy. For this case, the ISA mapping model needs to be fine-tuned using a small number of samples from new scenes to derive the satisfactory accuracy of ISA mapping.
In general, there is still much room for improvement in the extraction of ISA information from high-resolution remote sensing images. With the continuous development of network architectures and remote sensing technology, further progress will be made in the extraction of data on urban ISA via deep learning.

5.3. The Reason for the Change of ISA

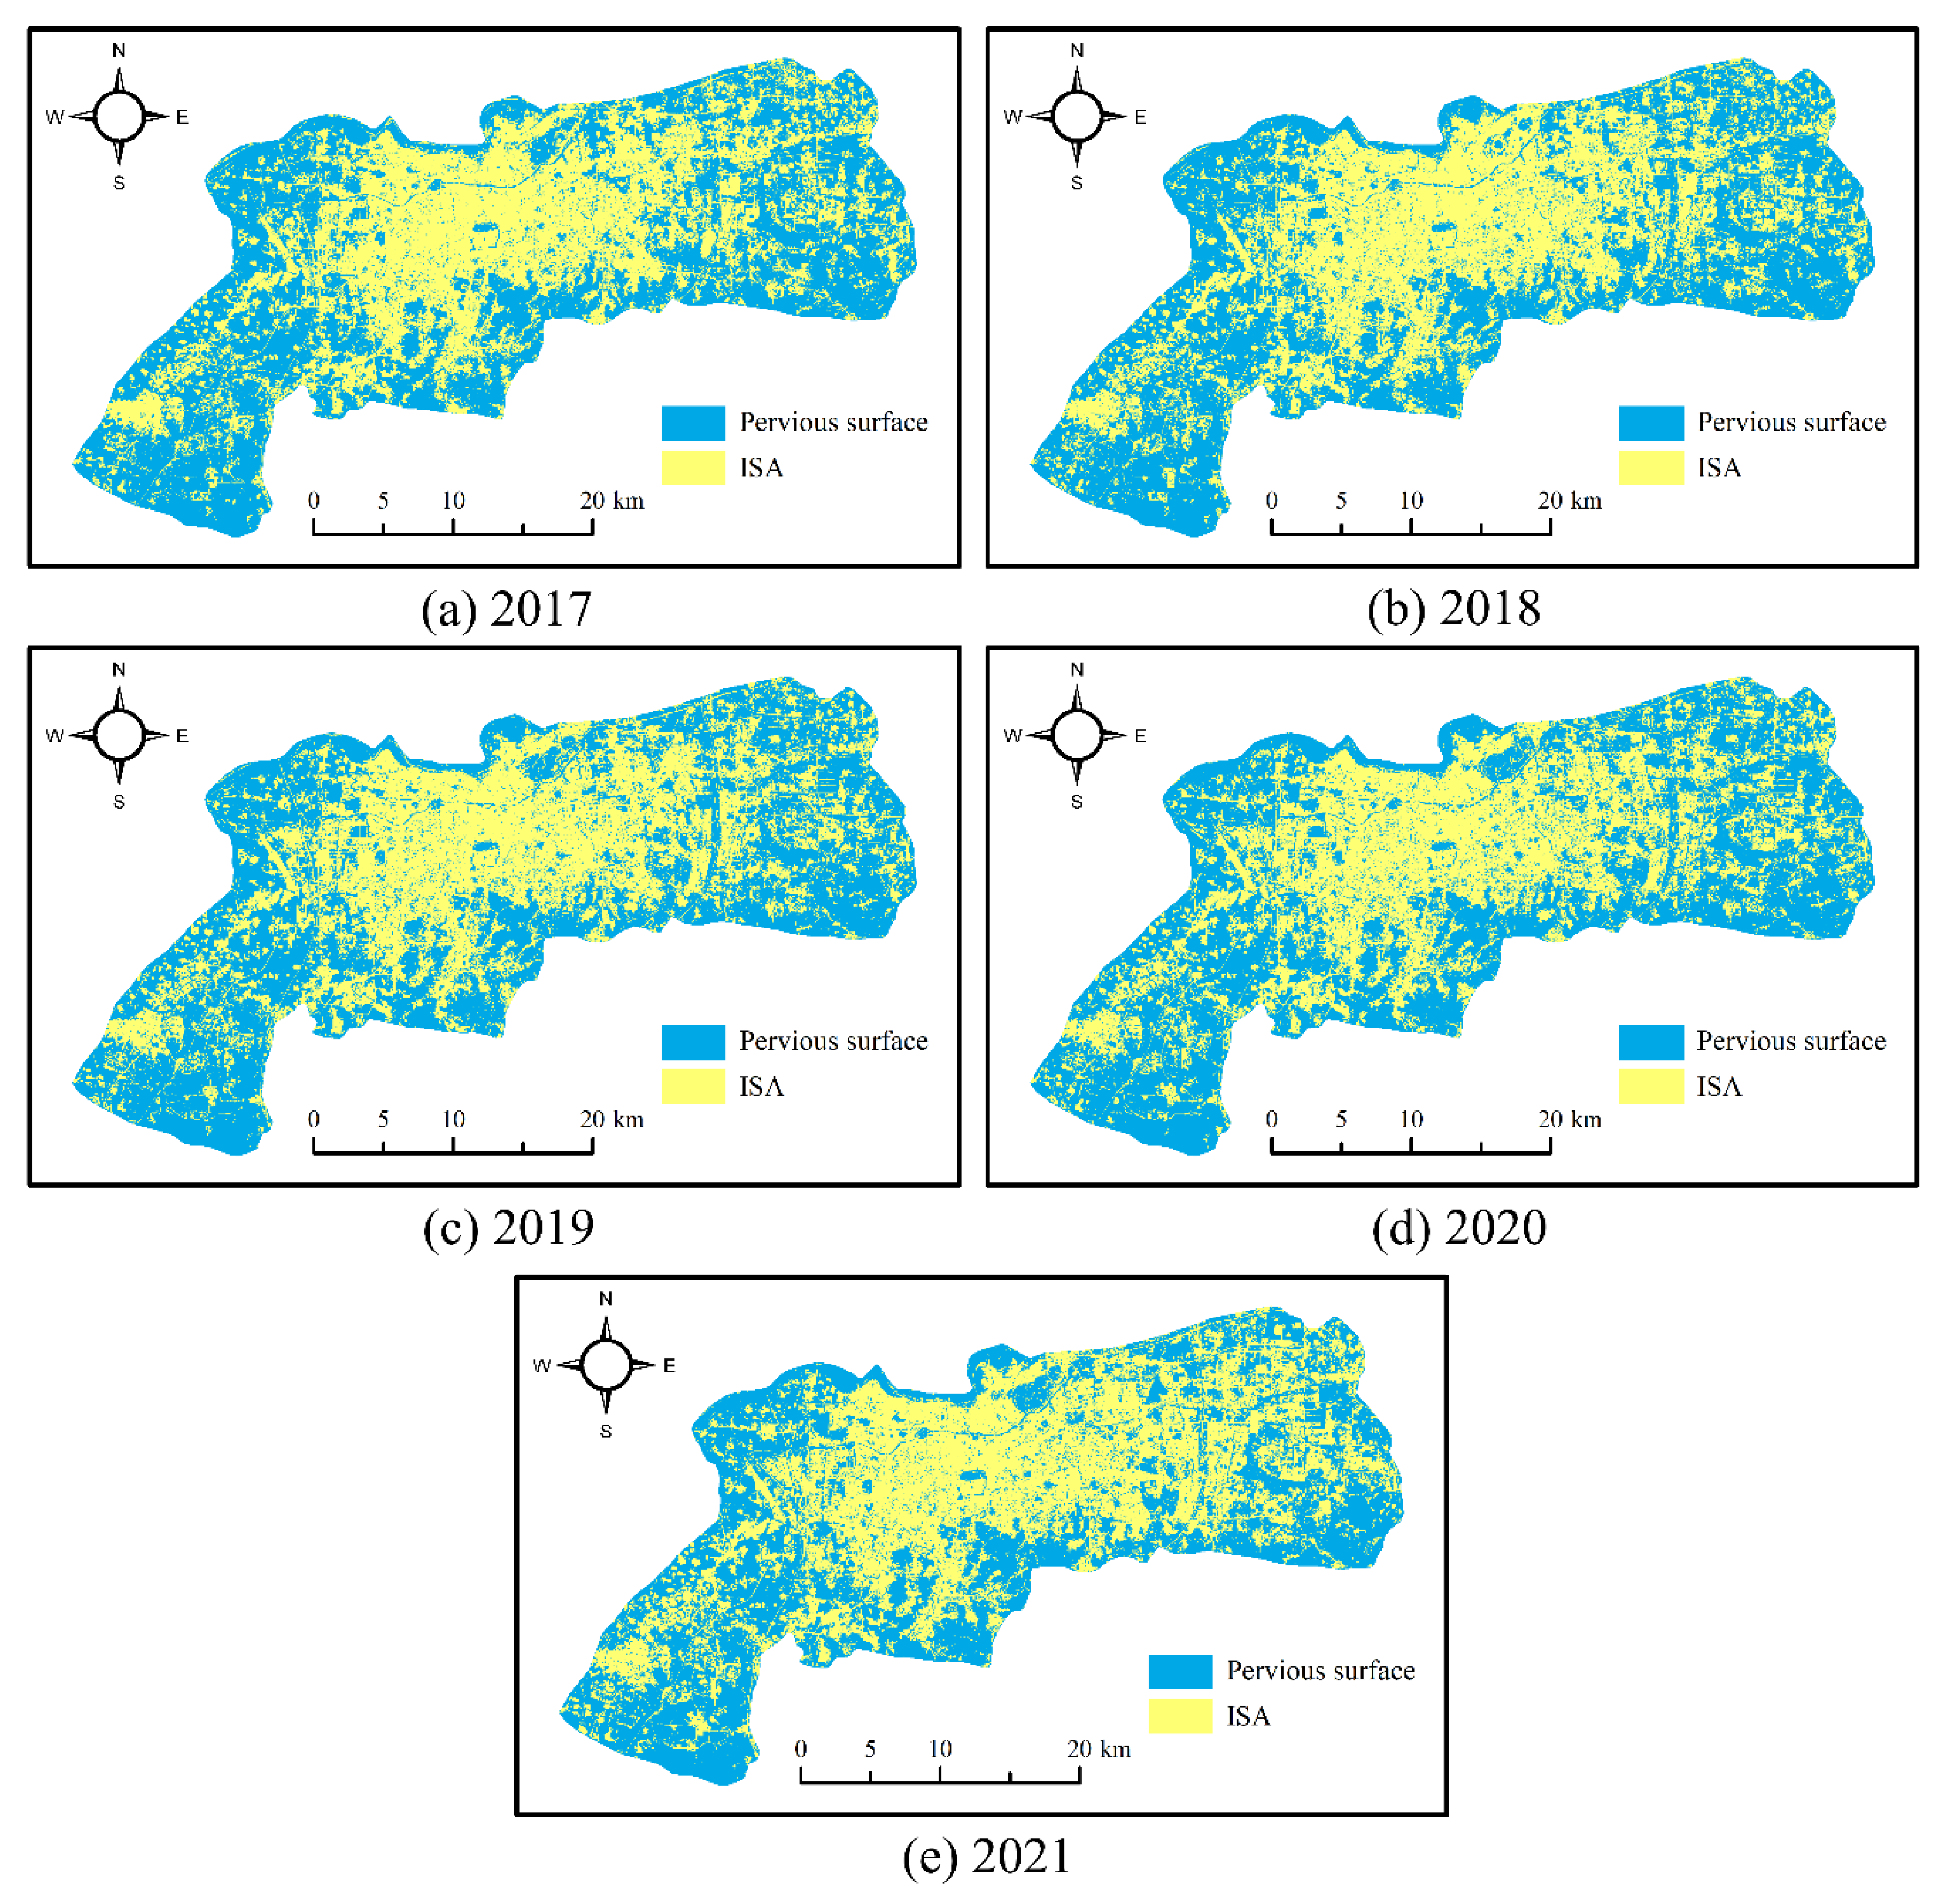
In this section, we discuss the factors that led to the change of the ISA. The ISA statistical data are shown in Table 5. It can be observed that the ISA has shown a growth-decrease-growth change in the past five years, whereas the area change was small and belonged to normal fluctuation. For 2017–2018, the ISA increased slightly, which was attributed to the stable economic performance and continuous population growth by checking the 2018 Jinan National Economic and Social Development Statistical Bulletin (http://jntj.jinan.gov.cn/art/2019/4/17/art_18254_2903837.html, accessed on 1 April 2023). From 2018 to 2020, the ISA continued to decline, which may have been due to the demolition of old buildings and villages on the urban fringe referring to the General Urban Planning of Jinan City (2011–2020) (http://www.jinan.gov.cn/art/2016/8/29/art_28170_3349927.html, accessed on 1 April 2023). In 2020, the ISA area reached its minimum value during the whole period, which may have been due to the fact that the complex economic situation, especially the severe impact of the COVID-19, hindered the progress of the construction project based on the Statistical Bulletin on National Economic and Social Development of Jinan City in 2020 (http://jntj.jinan.gov.cn/art/2021/4/2/art_18254_4742150.html, accessed on 1 April 2023). In 2021, a significant increase of the ISA area occurred, which was closely related to the accelerated implementation of the strategy of “Strengthening the Provincial Capital” and the recovery of construction projects caused by the better COVID-19 situation through checking the Statistical Bulletin on National Economic and Social Development of Jinan City in 2021 (http://jntj.jinan.gov.cn/art/2022/3/4/art_18254_4745381.html, accessed on 1 April 2023).

6. Conclusions

Taking the central urban area of Jinan City as a case in this study, we developed an ISA mapping approach which integrated the dual-attention CBAM module, SE module and focal loss function into the Deeplabv3+ model based on Sentinel-2 data. Subsequently, annual time-series ISA data, spanning from 2017 to 2021 in Jinan City, were yielded by the improved Deeplabv3+. Then, the spatial-temporal distribution characteristics and expansion trends were analyzed using landscape patterns methods. The following conclusions were drawn.
(a) The improved Deeplabv3+ model for ISA extraction achieved a satisfactory accuracy in images from 2020, with the Precision, Recall, F1 value and IoU reaching 82.24%, 92.38%, 0.87 and 77.01%, respectively. These results demonstrate that integrating the CBAM module and SE module into Deeplabv3+ was beneficial to improve the accuracy of ISA mapping method in this study, which can achieve a relative better ISA extraction result to realize large-scale and time-series ISA distribution monitoring.
(b) In comparison to traditional machine learning methods such as SVM and RF, all four accuracy metrics for the improved Deeplabv3+ were superior to that of SVM and RF, which suggests that deep CNN have the powerful capacity of data mining for urban land use/cover mapping. Through a comparative analysis with the FCN8, U-Net and Deeplabv3+ segmentation model, it was found that the proposed method in this study had the highest accuracy and extracted the best details of ISA.
(c) Through analysis of the spatial-temporal change characteristics of the ISA, it found that the ISA distribution in Jinan City exhibited a development pattern from east to west, with significant directionality and enhanced aggregation. The ISA acreage showed a fluctuating growth trend from 2017 to 2021. In 2021, the ISA rapidly increased to 496.87 km2, with an area ratio of 48.93%. In addition, the number of patches, connectivity and aggregation of ISA increased, while fragmentation and shape complexity decreased.
The research we performed mainly focused on developing a rapid and reliable ISA mapping methodology as well as the evolution analysis of the ISA in Jinan City. However, only a single source of Sentinel-2 data was considered without multi-source data fusion with other data. Considering the advantages and availability of street-view images, future studies should attempt to introduce that into the process of ISA classification to improve the classification accuracy [53].

Author Contributions

Methodology, J.L.; software, J.L. and C.L.; validation, Y.Z. and C.L.; formal analysis, J.L. and Y.Z.; data curation, Y.Z. and C.L.; writing—original draft preparation, J.L. and Y.Z.; writing—review and editing, J.L., Y.Z., C.L. and X.L. All authors have read and agreed to the published version of the manuscript.

Funding

This research was funded by the National Natural Science Foundation of China, grant number 42171113, 42271112, and the Doctoral Research Fund of Shandong Jianzhu University (XNBS1903).

Data Availability Statement

The data is unavailable to access due to privacy and ethical restrictions.

Acknowledgments

The authors thank ESA for providing Sentinel-2 Data.

Conflicts of Interest

The authors declare no conflict of interest.

References

  1. Todar, S.A.S.; Attarchi, S.; Osati, K. Investigation the Seasonality Effect on Impervious Surface Detection from Sentinel-1 and Sentinel-2 Images Using Google Earth Engine. Adv. Space Res. 2021, 68, 1356–1365. [Google Scholar] [CrossRef]
  2. Li, W. Mapping Urban Impervious Surfaces by Using Spectral Mixture Analysis and Spectral Indices. Remote Sens. 2019, 12, 94. [Google Scholar] [CrossRef] [Green Version]
  3. Piyoosh, A.K.; Ghosh, S.K. Semi-Automatic Mapping of Anthropogenic Impervious Surfaces in an Urban/Suburban Area Using Landsat 8 Satellite Data. GISci. Remote Sens. 2017, 54, 471–494. [Google Scholar] [CrossRef]
  4. Chen, J.; Yang, K.; Chen, S.; Yang, C.; Zhang, S.; He, L. Enhanced Normalized Difference Index for Impervious Surface Area Estimation at the Plateau Basin Scale. J. Appl. Remote Sens. 2019, 13, 016502. [Google Scholar] [CrossRef] [Green Version]
  5. Tang, F.; Xu, H. Impervious Surface Information Extraction based on Hyperspectral Remote Sensing Imagery. Remote Sens. 2017, 9, 550. [Google Scholar] [CrossRef] [Green Version]
  6. Liu, J.; Li, Y.; Zhang, Y.; Liu, X. Large-Scale Impervious Surface Area Mapping and Pattern Evolution of the Yellow River Delta Using Sentinel-1/2 on the GEE. Remote Sens. 2023, 15, 136. [Google Scholar] [CrossRef]
  7. Shrestha, B.; Ahmad, S.; Stephen, H. Fusion of Sentinel-1 and Sentinel-2 Data in Mapping the Impervious Surfaces at City Scale. Environ. Monit. Assess. 2021, 193, 1–21. [Google Scholar] [CrossRef] [PubMed]
  8. Hu, B.; Xu, Y.; Huang, X.; Cheng, Q.; Ding, Q.; Bai, L.; Li, Y. Improving Urban Land Cover Classification with Combined Use of Sentinel-2 and Sentinel-1 Imagery. ISPRS Int. J. Geo-Inf. 2021, 10, 533. [Google Scholar] [CrossRef]
  9. MacLachlan, A.; Roberts, G.; Biggs, E.; Boruff, B. Subpixel Land-Cover Classification for Improved Urban Area Estimates Using Landsat. Int. J. Remote Sens. 2017, 38, 5763–5792. [Google Scholar] [CrossRef] [Green Version]
  10. Guo, W.; Lu, D.; Wu, Y.; Zhang, J. Mapping Impervious Surface Distribution with Integration of SNNP VIIRS-DNB and MODIS NDVI Data. Remote Sens. 2015, 7, 12459–12477. [Google Scholar] [CrossRef] [Green Version]
  11. Wu, C.; Murray, A.T. Estimating Impervious Surface Distribution by Spectral Mixture Analysis. Remote Sens. Environ. 2003, 84, 493–505. [Google Scholar] [CrossRef]
  12. Zhang, L.; Weng, Q.; Shao, Z. An Evaluation of Monthly Impervious Surface Dynamics by Fusing Landsat and MODIS Time Series in the Pearl River Delta, China, from 2000 to 2015. Remote Sens. Environ. 2017, 201, 99–114. [Google Scholar] [CrossRef]
  13. Liu, X.; Hu, G.; Ai, B.; Li, X.; Shi, Q. A Normalized Urban Areas Composite Index (NUACI) Based on Combination of DMSP-OLS and MODIS for Mapping Impervious Surface Area. Remote Sens. 2015, 7, 17168–17189. [Google Scholar] [CrossRef] [Green Version]
  14. Liu, J.; Liu, C.; Feng, Q.; Ma, Y. Subpixel Impervious Surface Estimation in the Nansi Lake Basin Using Random Forest Regression Combined with GF-5 Hyperspectral Data. J. Appl. Remote Sens. 2020, 14, 034515. [Google Scholar] [CrossRef]
  15. Zhang, X.; Liu, L.; Wu, C.; Chen, X.; Gao, Y.; Xie, S.; Zhang, B. Development of a Global 30 m Impervious Surface Map Using Multisource and Multitemporal Remote Sensing Datasets with the Google Earth Engine Platform. Earth Syst. Sci. Data 2020, 12, 1625–1648. [Google Scholar] [CrossRef]
  16. Chen, L.-C.; Papandreou, G.; Kokkinos, I.; Murphy, K.; Yuille, A.L. Deeplab: Semantic Image Segmentation with Deep Convolutional Nets, Atrous Convolution, and Fully Connected Crfs. IEEE Trans. Pattern Anal. Mach. Intell. 2017, 40, 834–848. [Google Scholar] [CrossRef] [Green Version]
  17. Zhang, J.; Gu, H.; Yang, Y.; Zhang, H.; Li, H. Research Process and Trend of High-Resolution Remote Sensing Imagery Intelligent Interpretation. Natl. Remote Sens. Bull. 2021, 25, 2198–2210. [Google Scholar]
  18. McGlinchy, J.; Johnson, B.; Muller, B.; Joseph, M.; Diaz, J. Application of UNet Fully Convolutional Neural Network to Impervious Surface Segmentation in Urban Environment from High Resolution Satellite Imagery. In Proceedings of the IGARSS 2019-2019 IEEE International Geoscience and Remote Sensing Symposium, Yokohama, Japan, 28 July–2 August 2019; pp. 3915–3918. [Google Scholar]
  19. Parekh, J.R.; Poortinga, A.; Bhandari, B.; Mayer, T.; Saah, D.; Chishtie, F. Automatic Detection of Impervious Surfaces from Remotely Sensed Data Using Deep Learning. Remote Sens. 2021, 13, 3166. [Google Scholar] [CrossRef]
  20. Huang, B.; Zhao, B.; Song, Y. Urban Land-Use Mapping Using a Deep Convolutional Neural Network with High Spatial Resolution Multispectral Remote Sensing Imagery. Remote Sens. Environ. 2018, 214, 73–86. [Google Scholar] [CrossRef]
  21. Liu, J.; Feng, Q.; Wang, Y.; Batsaikhan, B.; Gong, J.; Li, Y.; Liu, C.; Ma, Y. Urban Green Plastic Cover Mapping Based on VHR Remote Sensing Images and a Deep Semi-Supervised Learning Framework. ISPRS Int. J. Geo-Inf. 2020, 9, 527. [Google Scholar] [CrossRef]
  22. Long, J.; Shelhamer, E.; Darrell, T. Fully Convolutional Networks for Semantic Segmentation. In Proceedings of the IEEE Conference on Computer Vision and Pattern Recognition, Boston, MA, USA, 7–12 June 2015; pp. 3431–3440. [Google Scholar]
  23. Chen, L.-C.; Zhu, Y.; Papandreou, G.; Schroff, F.; Adam, H. Encoder-Decoder with Atrous Separable Convolution for Semantic Image Segmentation. In Proceedings of the European Conference on Computer Vision (ECCV), Munich, Germany, 8–14 September 2018; pp. 801–818. [Google Scholar]
  24. Badrinarayanan, V.; Kendall, A.; Cipolla, R. Segnet: A Deep Convolutional Encoder-Decoder Architecture for Image Segmentation. IEEE Trans. Pattern Anal. Mach. Intell. 2017, 39, 2481–2495. [Google Scholar] [CrossRef] [PubMed]
  25. Siddique, N.; Paheding, S.; Elkin, C.P.; Devabhaktuni, V. U-Net and Its Variants for Medical Image Segmentation: A Review of Theory and Applications. IEEE Access 2021, 9, 82031–82057. [Google Scholar] [CrossRef]
  26. Ronneberger, O.; Fischer, P.; Brox, T. U-Net: Convolutional Networks for Biomedical Image Segmentation. In Proceedings of the International Conference on Medical Image Computing and Computer-Assisted Intervention, Munich, Germany, 5–9 October 2015; pp. 234–241. [Google Scholar]
  27. Zeng, X.; Wang, Z.; Sun, X.; Chang, Z.; Gao, X. DENet: Double-Encoder Network with Feature Refinement and Region Adaption for Terrain Segmentation in Polsar Images. IEEE Trans. Geosci. Remote Sens. 2021, 60, 1–19. [Google Scholar] [CrossRef]
  28. Li, R.; Duan, C.; Zheng, S.; Zhang, C.; Atkinson, P.M. MACU-Net for Semantic Segmentation of Fine-Resolution Remotely Sensed Images. IEEE Geosci. Remote Sens. Lett. 2021, 19, 1–5. [Google Scholar] [CrossRef]
  29. Zhang, C.; Atkinson, P.M.; George, C.; Wen, Z.; Diazgranados, M.; Gerard, F. Identifying and Mapping Individual Plants in a Highly Diverse High-Elevation Ecosystem Using UAV Imagery and Deep Learning. ISPRS J. Photogramm. Remote Sens. 2020, 169, 280–291. [Google Scholar] [CrossRef]
  30. Adrian, J.; Sagan, V.; Maimaitijiang, M. Sentinel SAR-Optical Fusion for Crop Type Mapping Using Deep Learning and Google Earth Engine. ISPRS J. Photogramm. Remote Sens. 2021, 175, 215–235. [Google Scholar] [CrossRef]
  31. Seydi, S.T.; Akhoondzadeh, M.; Amani, M.; Mahdavi, S. Wildfire Damage Assessment over Australia Using Sentinel-2 Imagery and MODIS Land Cover Product within the Google Earth Engine Cloud Platform. Remote Sens. 2021, 13, 220. [Google Scholar] [CrossRef]
  32. Feng, Q.; Yang, J.; Zhu, D.; Liu, J.; Guo, H.; Bayartungalag, B.; Li, B. Integrating Multitemporal Sentinel-1/2 Data for Coastal Land Cover Classification Using a Multibranch Convolutional Neural Network: A Case of the Yellow River Delta. Remote Sens. 2019, 11, 1006. [Google Scholar] [CrossRef] [Green Version]
  33. Zhang, T.; Su, J.; Xu, Z.; Luo, Y.; Li, J. Sentinel-2 Satellite Imagery for Urban Land Cover Classification by Optimized Random Forest Classifier. Appl. Sci. 2021, 11, 543. [Google Scholar] [CrossRef]
  34. Phiri, D.; Simwanda, M.; Salekin, S.; Nyirenda, V.R.; Murayama, Y.; Ranagalage, M. Sentinel-2 Data for Land Cover/Use Mapping: A Review. Remote Sens. 2020, 12, 2291. [Google Scholar] [CrossRef]
  35. Zhang, H.; Lin, H.; Li, Y.; Zhang, Y.; Fang, C. Mapping Urban Impervious Surface with Dual-Polarimetric SAR Data: An Improved Method. Landsc. Urban Plan. 2016, 151, 55–63. [Google Scholar] [CrossRef]
  36. Yanqiong, B.; Yufu, Z.; Hong, T. Semantic Segmentation Method of Road Scene Based on Deeplabv3+ and Attention Mechanism. J. Meas. Sci. Instrum. 2021, 12, 412–421. [Google Scholar]
  37. Azad, R.; Asadi-Aghbolaghi, M.; Fathy, M.; Escalera, S. Attention deeplabv3+: Multi-level Context Attention Mechanism for Skin Lesion Segmentation. In Proceedings of the European Conference on Computer Vision, Glasgow, UK, 23–28 August 2020; pp. 251–266. [Google Scholar]
  38. Woo, S.; Park, J.; Lee, J.-Y.; Kweon, I.S. Cbam: Convolutional Block Attention Module. In Proceedings of the European Conference on Computer Vision (ECCV), Munich, Germany, 8–14 September 2018; pp. 3–19. [Google Scholar]
  39. Feng, Q.; Zhu, D.; Yang, J.; Li, B. Multisource Hyperspectral and Lidar Data Fusion for Urban Land-Use Mapping Based on a Modified Two-Branch Convolutional Neural Network. ISPRS Int. J. Geo-Inf. 2019, 8, 28. [Google Scholar] [CrossRef] [Green Version]
  40. Li, Y.; Liu, Y.; Cui, W.-G.; Guo, Y.-Z.; Huang, H.; Hu, Z.-Y. Epileptic Seizure Detection in EEG Signals Using a Unified Temporal-Spectral Squeeze-and-Excitation Network. IEEE Trans. Neural Syst. Rehabil. Eng. 2020, 28, 782–794. [Google Scholar] [CrossRef] [PubMed]
  41. Lin, T.-Y.; Goyal, P.; Girshick, R.; He, K.; Dollár, P. Focal Loss for Dense Object Detection. In Proceedings of the IEEE International Conference on Computer Vision, Venice, Italy, 22–29 October 2017; pp. 2980–2988. [Google Scholar]
  42. Nam, H.; Ha, J.-W.; Kim, J. Dual Attention Networks for Multimodal Reasoning and Matching. In Proceedings of the IEEE Conference on Computer Vision and Pattern Recognition, Honolulu, HI, USA, 21–27 July 2017; pp. 299–307. [Google Scholar]
  43. Fu, J.; Liu, J.; Jiang, J.; Li, Y.; Bao, Y.; Lu, H. Scene Segmentation with Dual Relation-Aware Attention Network. IEEE Trans. Neural Netw. Learn. Syst. 2020, 32, 2547–2560. [Google Scholar] [CrossRef] [PubMed]
  44. Zhong, Z.; Lin, Z.Q.; Bidart, R.; Hu, X.; Daya, I.B.; Li, Z.; Zheng, W.-S.; Li, J.; Wong, A. Squeeze-and-Attention Networks for Semantic Segmentation. In Proceedings of the IEEE/CVF Conference on Computer Vision and Pattern Recognition, Seattle, WA, USA, 13–19 June 2020; pp. 13065–13074. [Google Scholar]
  45. Breiman, L. Random Forests. Mach. Learn. 2001, 45, 5–32. [Google Scholar] [CrossRef] [Green Version]
  46. Cortes, C.; Vapnik, V. Support-Vector Networks. Mach. Learn. 1995, 20, 273–297. [Google Scholar] [CrossRef]
  47. Gu, X.; Gao, X.; Ma, H.; Shi, F.; Liu, X.; Cao, X. Comparison of Machine Learning Methods for Land Use/Land Cover Classification in the Complicated Terrain Regions. Remote Sens. Technol. Appl. 2019, 34, 57–67. [Google Scholar]
  48. Wu, Q.; Zhong, R.; Zhao, W.; Song, K.; Du, L. Land-Cover Classification Using GF-2 Images and Airborne Lidar Data Based on Random Forest. Int. J. Remote Sens. 2019, 40, 2410–2426. [Google Scholar] [CrossRef]
  49. Singh, S.K.; Srivastava, P.K.; Szabó, S.; Petropoulos, G.P.; Gupta, M.; Islam, T. Landscape Transform and Spatial Metrics for Mapping Spatiotemporal Land Cover Dynamics Using Earth Observation Data-Sets. Geocarto Int. 2017, 32, 113–127. [Google Scholar] [CrossRef] [Green Version]
  50. Aksu, G.A.; Tağıl, Ş.; Musaoğlu, N.; Canatanoğlu, E.S.; Uzun, A. Landscape Ecological Evaluation of Cultural Patterns for the Istanbul Urban Landscape. Sustainability 2022, 14, 16030. [Google Scholar] [CrossRef]
  51. Ozcan, O.; Aksu, G.A.; Erten, E.; Musaoglu, N.; Çetin, M. Degradation Monitoring in Silvo-Pastoral Systems: A Case Study of the Mediterranean Region of Turkey. Adv. Space Res. 2019, 63, 160–171. [Google Scholar] [CrossRef]
  52. Leitao, A.B.; Ahern, J. Applying Landscape Ecological Concepts and Metrics in Sustainable Landscape Planning. Landsc. Urban Plan. 2002, 59, 65–93. [Google Scholar] [CrossRef]
  53. Chen, B.; Feng, Q.; Niu, B.; Yan, F.; Gao, B.; Yang, J.; Gong, J.; Liu, J. Multi-Modal Fusion of Satellite and Street-View Images for Urban Village Classification Based on a Dual-Branch Deep Neural Network. Int. J. Appl. Earth Obs. Geoinf. 2022, 109, 102794. [Google Scholar] [CrossRef]
Figure 1. Study area overview. (a) Study Area Location; (b) Study area images (Sentinel-2 B4 (R), B3 (G), B2 (B) band synthesis in 2021).
Remotesensing 15 01976 g001
Figure 2. Methodology flowchart.
Remotesensing 15 01976 g002
Figure 3. Sample block distribution map and schematic diagram. (a) Training set; (b) Test set; (c) True color image; (d) Label image.
Remotesensing 15 01976 g003
Figure 4. Structure of the improved Deeplabv3+ model.
Remotesensing 15 01976 g004
Figure 5. CBAM attention module structure.
Remotesensing 15 01976 g005
Figure 6. Channel attention structure.
Remotesensing 15 01976 g006
Figure 7. Spatial attention structure.
Remotesensing 15 01976 g007
Figure 8. SE module structure diagram.
Remotesensing 15 01976 g008
Figure 9. Local ISA distribution for (b) sub-region I; (d) sub-region II; (f) sub-region III; and (h) sub-region IV. True-color images for (a) sub-region I; (c) sub-region II; (e) sub-region III; and (g) sub-region IV.
Remotesensing 15 01976 g009
Figure 10. Extraction results of the impervious surface in the central city of Jinan. (a) 2017; (b) 2018; (c) 2019; (d) 2020; (e) 2021.
Remotesensing 15 01976 g010
Figure 11. Change in the impervious surface increase and decrease from 2017 to 2021.
Remotesensing 15 01976 g011
Table 1. Time-series Sentinel-2 data.
Imaging DateImaging SatelliteProduct LevelCloud Volume/%
7 September 2017S2BL1C0
7 September 2018S2AL1C0
18 August 2019S2BL2A0.72
1 September 2020S2BL2A0.95
11 September 2021S2AL2A0.88
Table 2. Accuracy of the ISA mapping of the proposed model.
MethodPrecision (%)Recall (%)IoU (%)F1 (%)
The proposed model82.2492.3877.0187
Table 3. The comparison with the accuracy of traditional classification methods.
MethodPrecision (%)Recall (%)IoU (%)F1 (%)
The proposed model82.2492.3877.0187
RF797059.1674
SVM826557.0273
Table 4. Accuracy comparison of semantic segmentation methods.
MethodPrecision/%Recall/%F1IoU/%
FCN883.4684.470.8472.36
U-Net84.3384.660.8473.15
Deeplabv3+82.0689.080.8574.56
Improved Deeplabv3+82.2492.380.8777.01
Table 5. Statistics of the impervious surface area in the central city of Jinan, 2017–2021.
Year20172018201920202021
Area (km2)465.02467.28461.90447.15496.87
Area Percentage (%)45.8046.9145.4944.0448.93
Table 6. Impervious Surface Landscape Pattern Index, 2017–2021.
YearNPPDAREA_MNLSILPIAICOHESION
201776437.536.08106.6840.9795.0999.961
201874187.316.30112.0339.5194.8699.958
201984738.345.45116.4739.0794.6299.957
202079627.845.62120.5937.5194.3499.956
202178157.706.36114.2344.2494.9299.968
Disclaimer/Publisher’s Note: The statements, opinions and data contained in all publications are solely those of the individual author(s) and contributor(s) and not of MDPI and/or the editor(s). MDPI and/or the editor(s) disclaim responsibility for any injury to people or property resulting from any ideas, methods, instructions or products referred to in the content.

