
Does Regional Urbanization Promote Balanced Land Development? Evidence from Long Time Series Satellite Imagery

Abstract
:1. Introduction
2. Materials and Methods
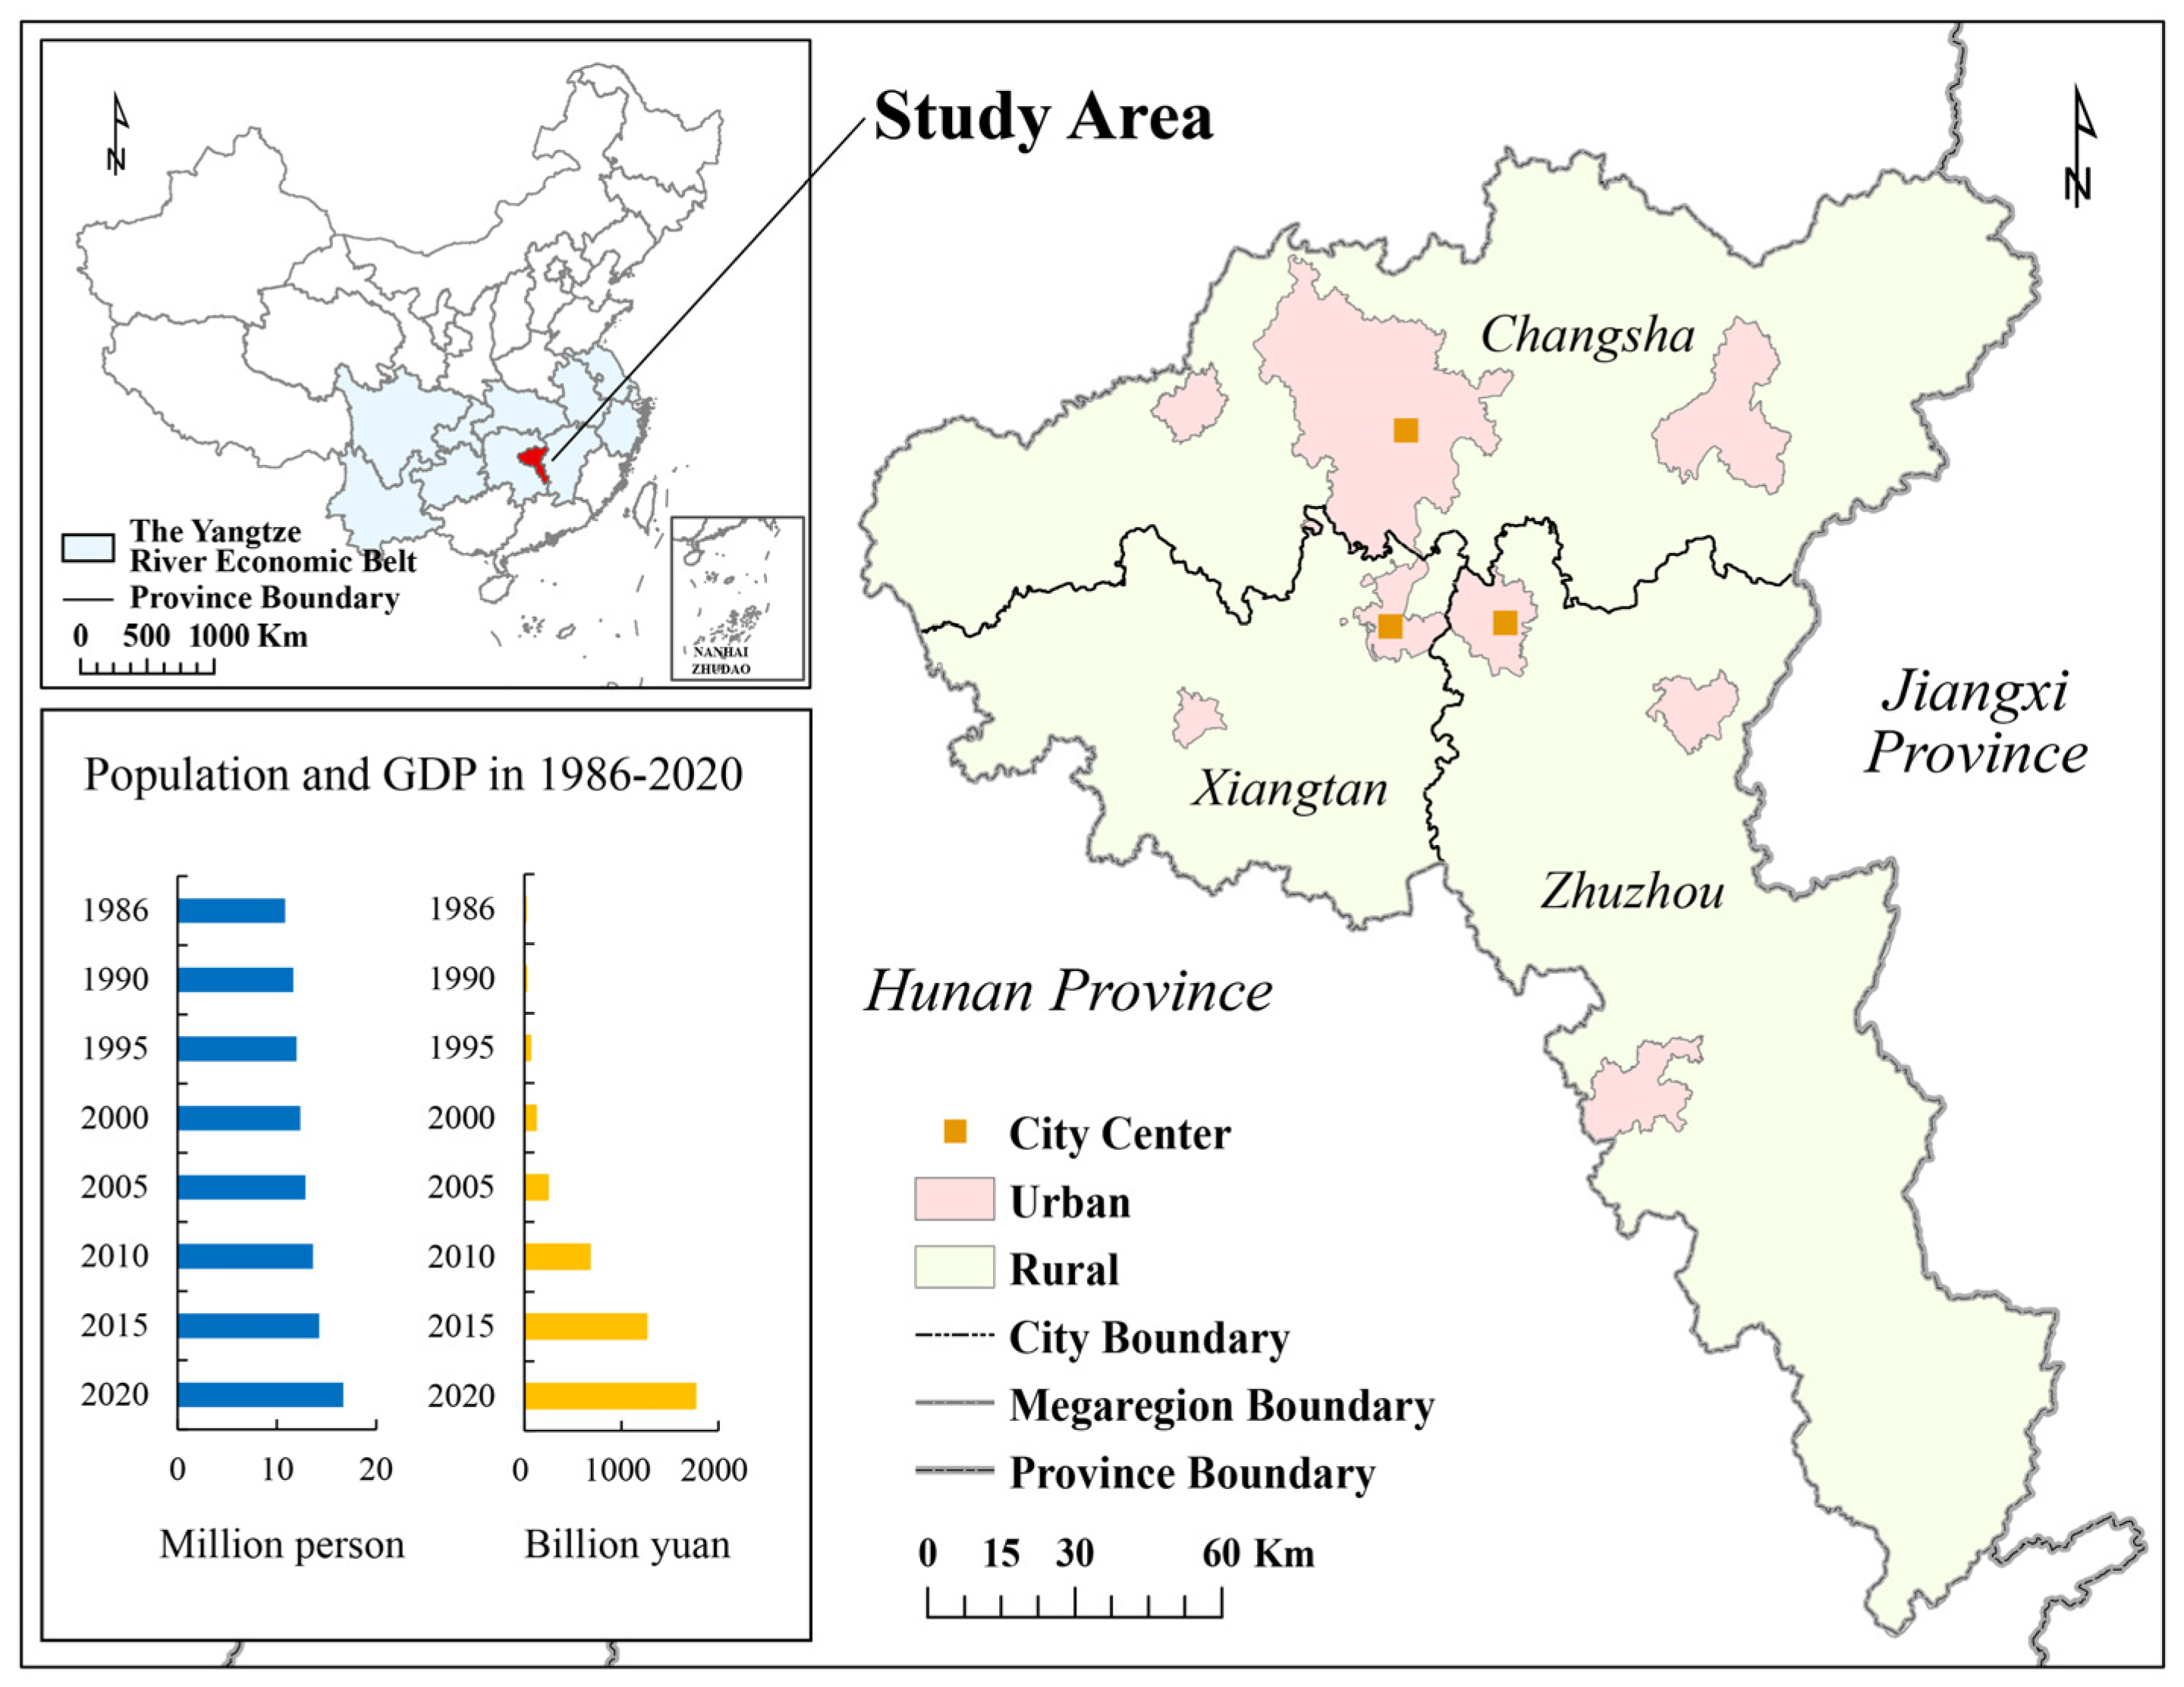
2.1. Study Area
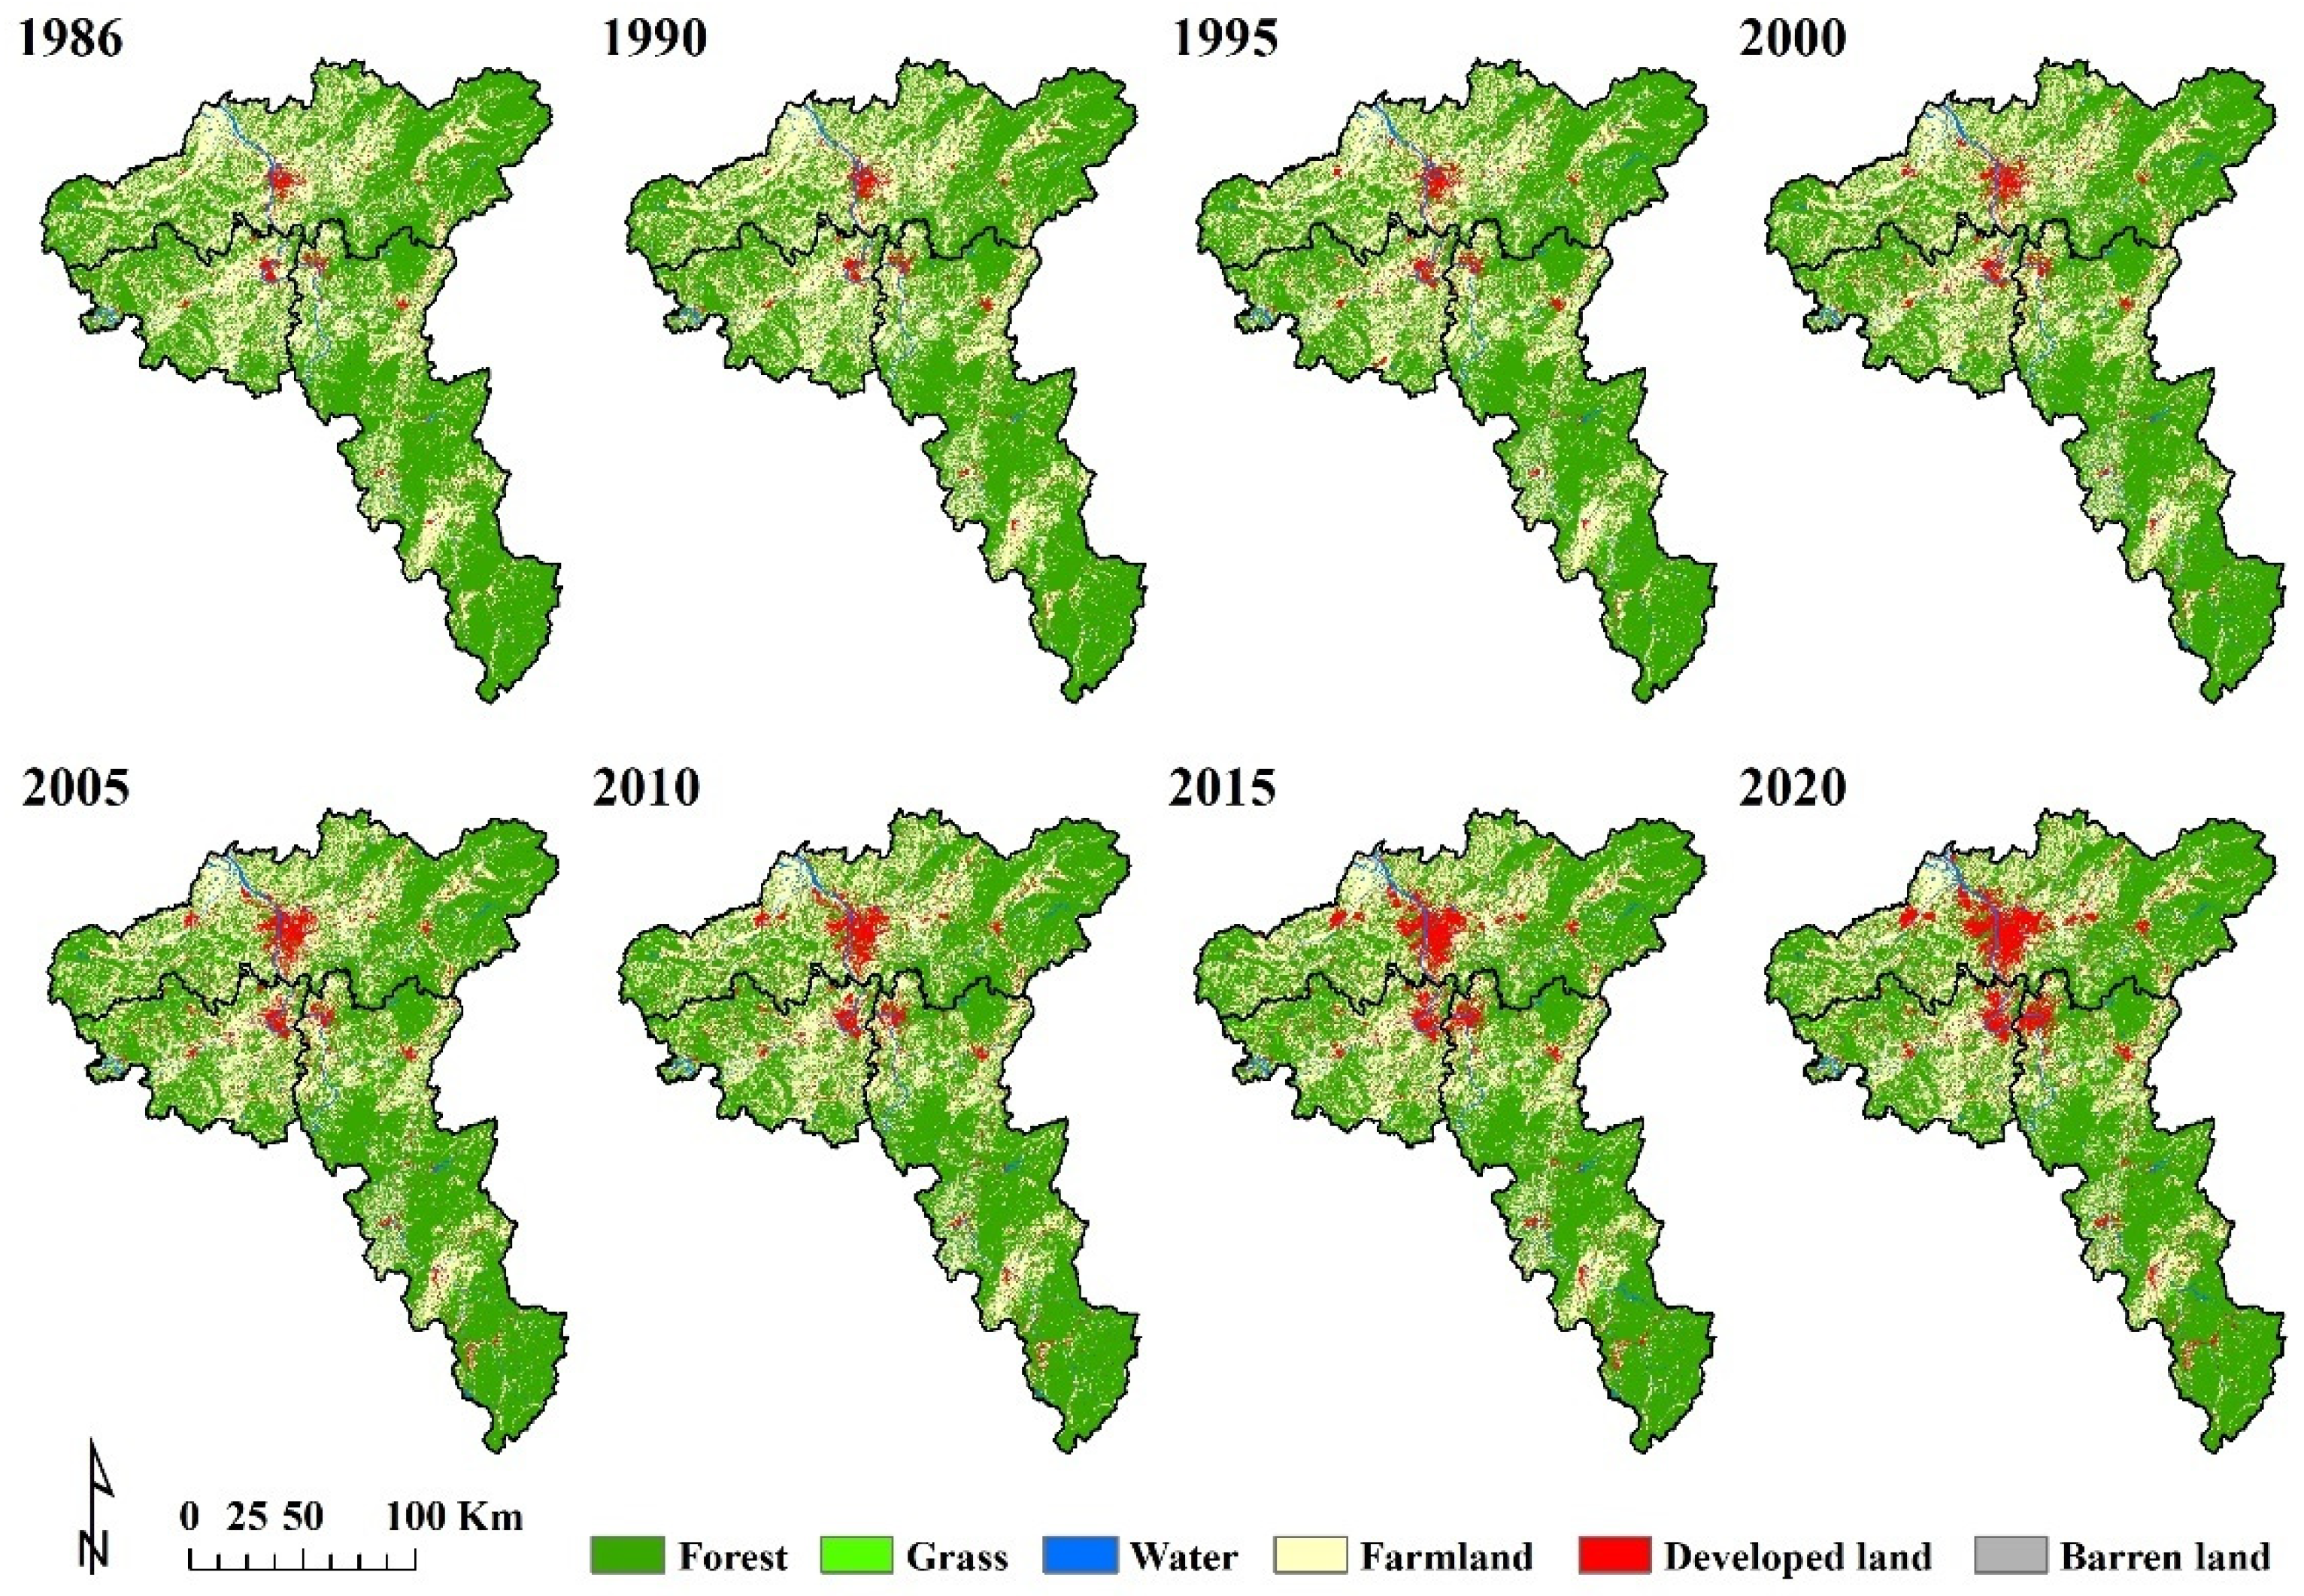
2.2. Data
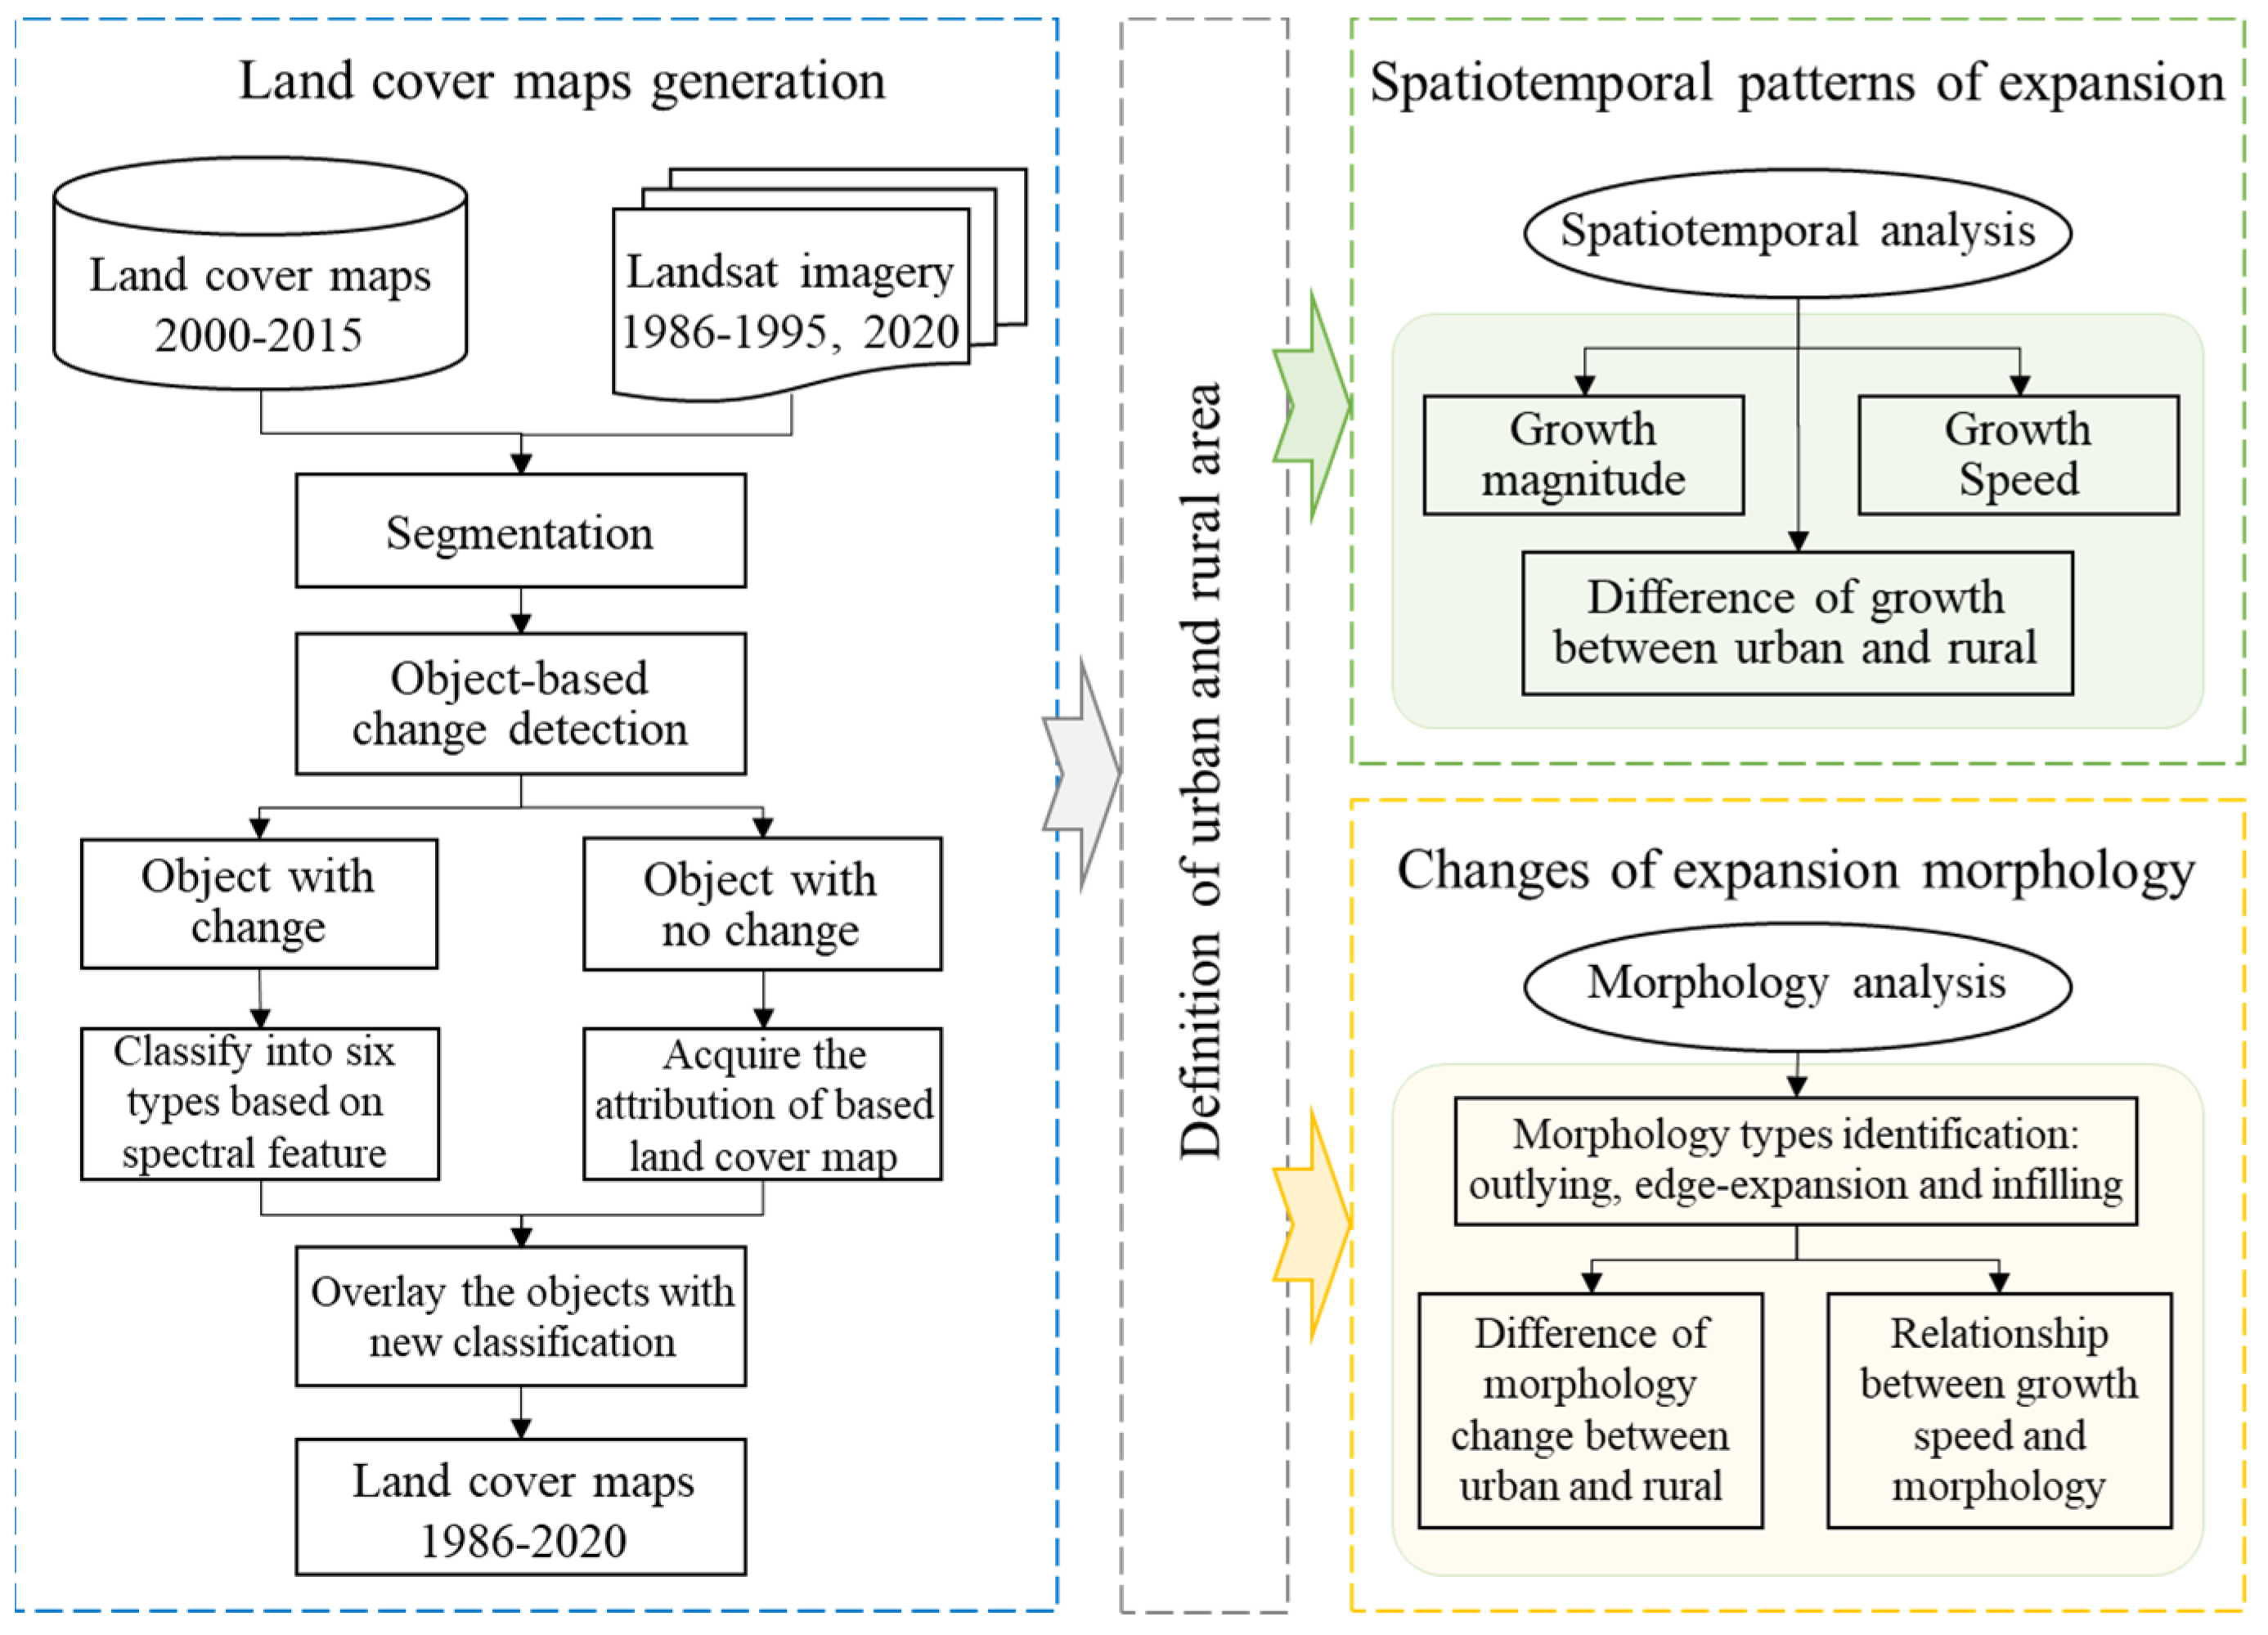
2.3. Methods
2.3.1. Definition of Urban and Rural Areas
2.3.2. Spatiotemporal Analysis
2.3.3. Morphology Analysis
3. Results
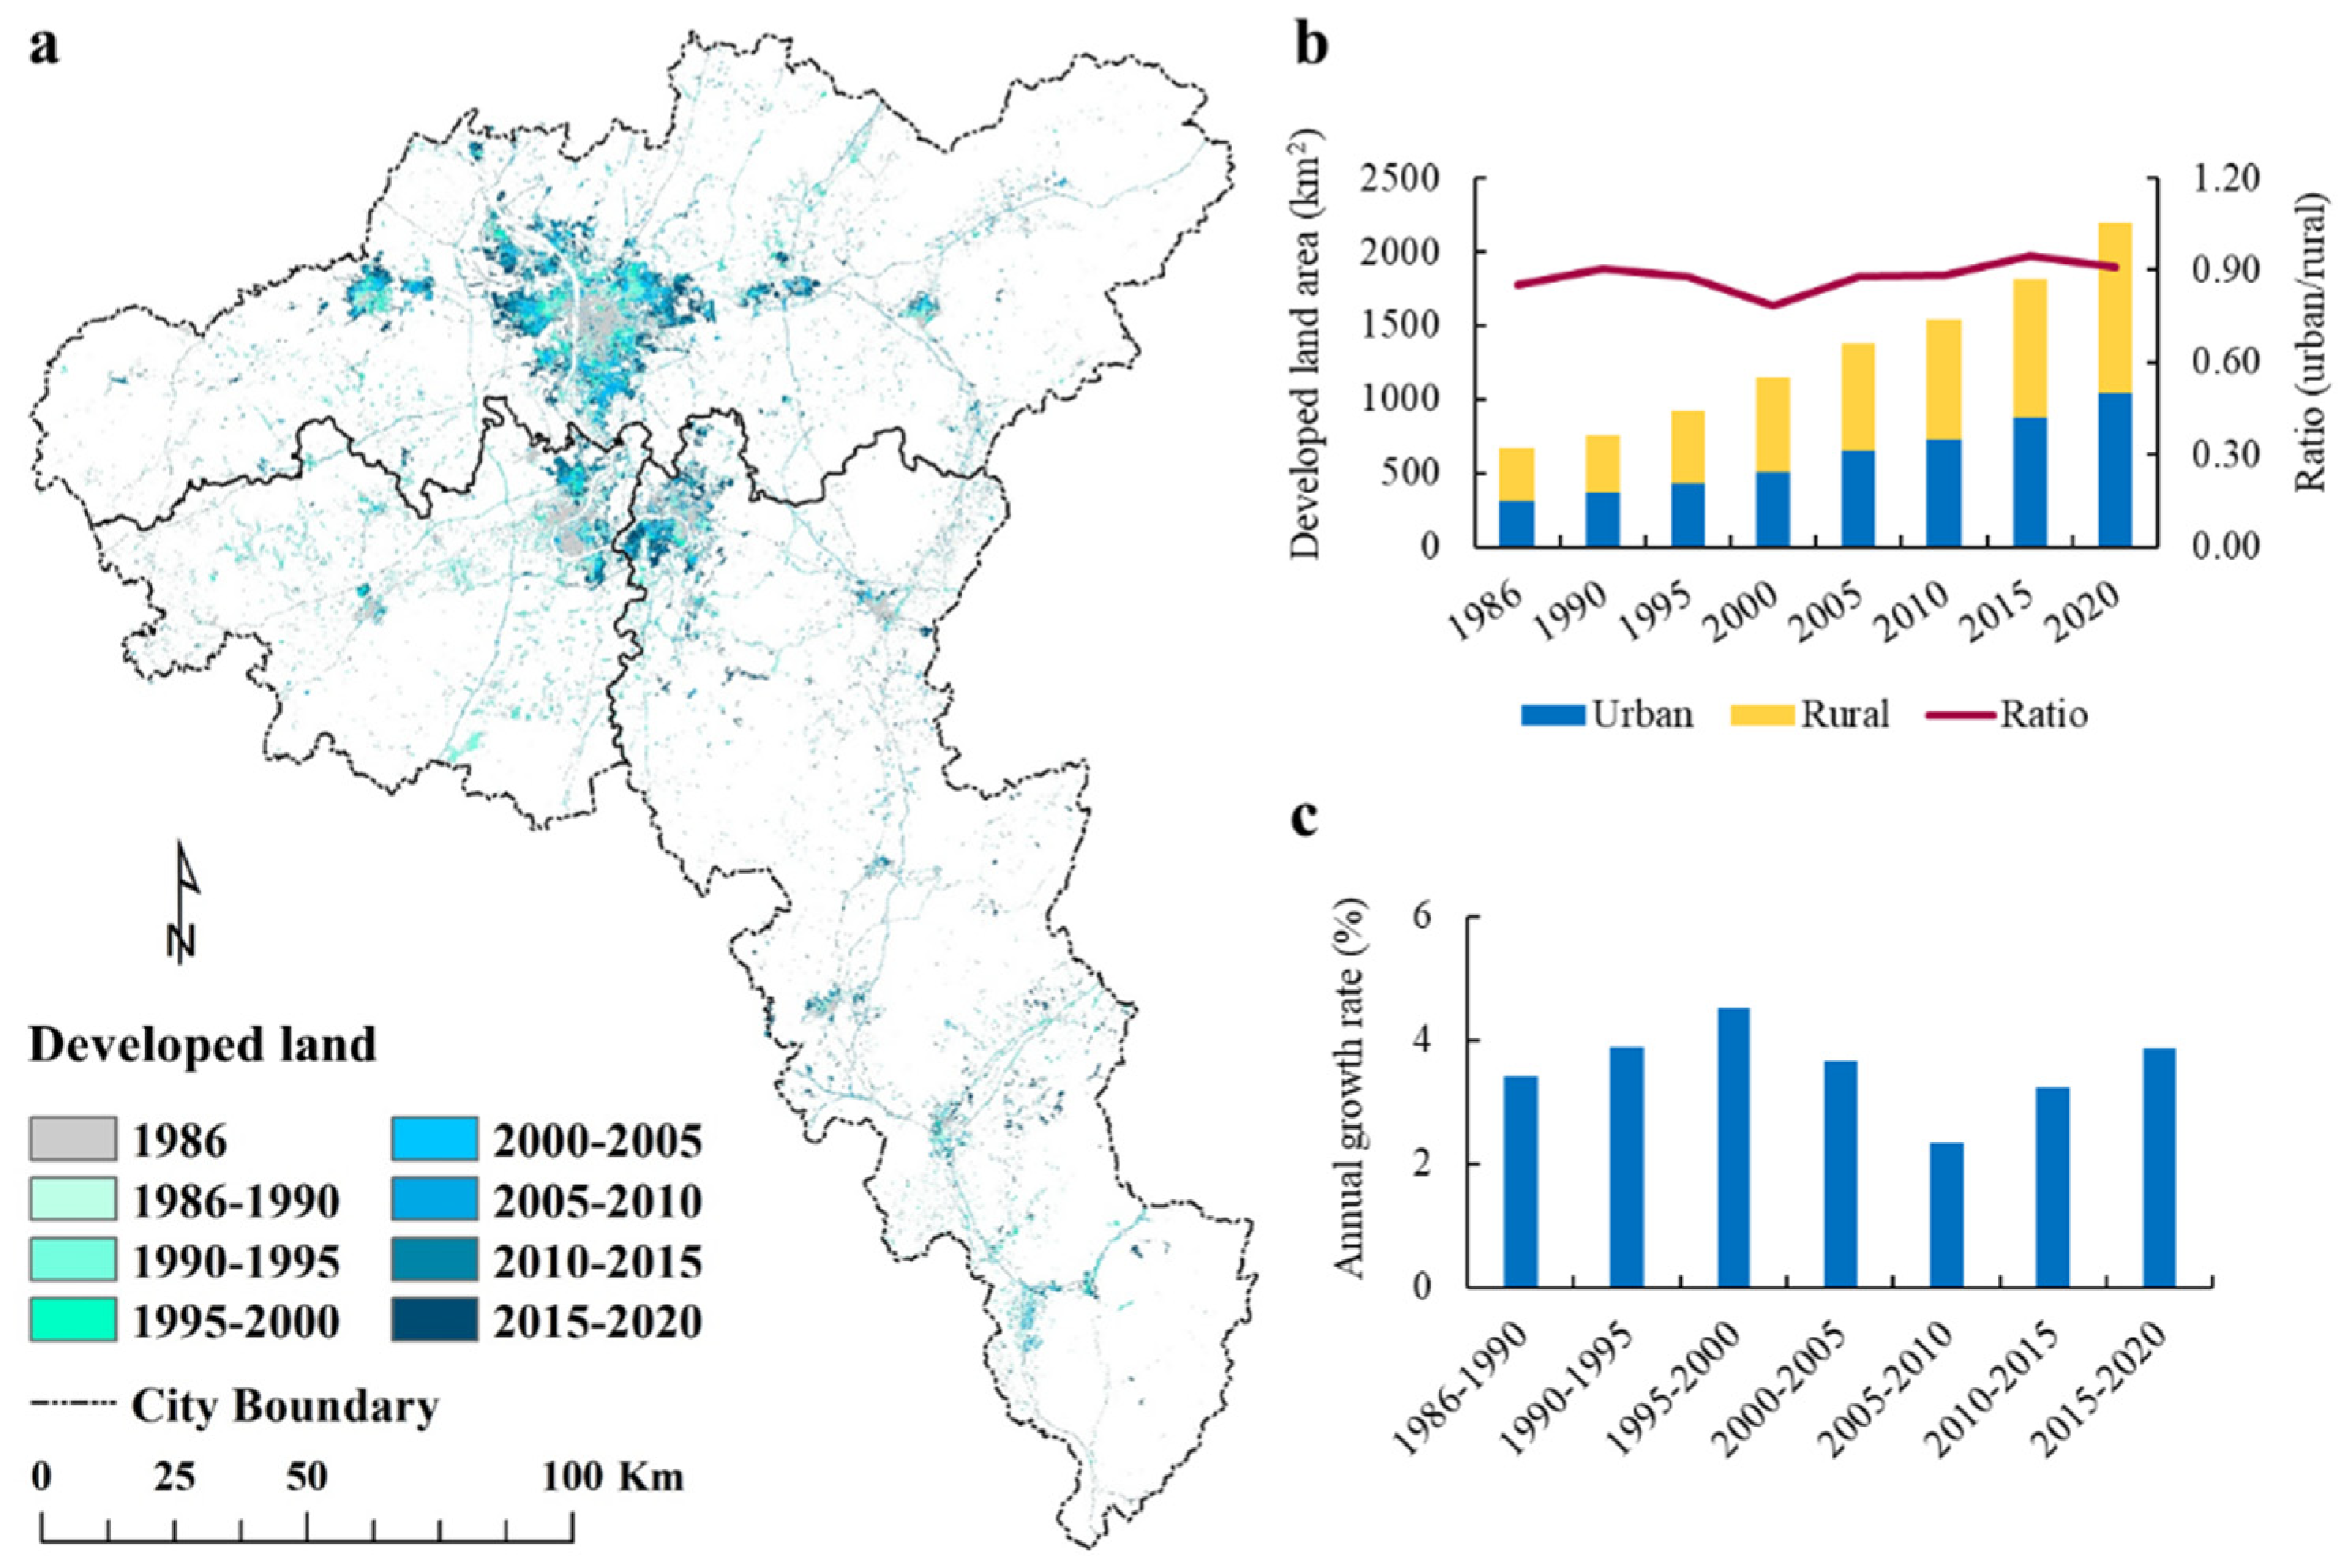
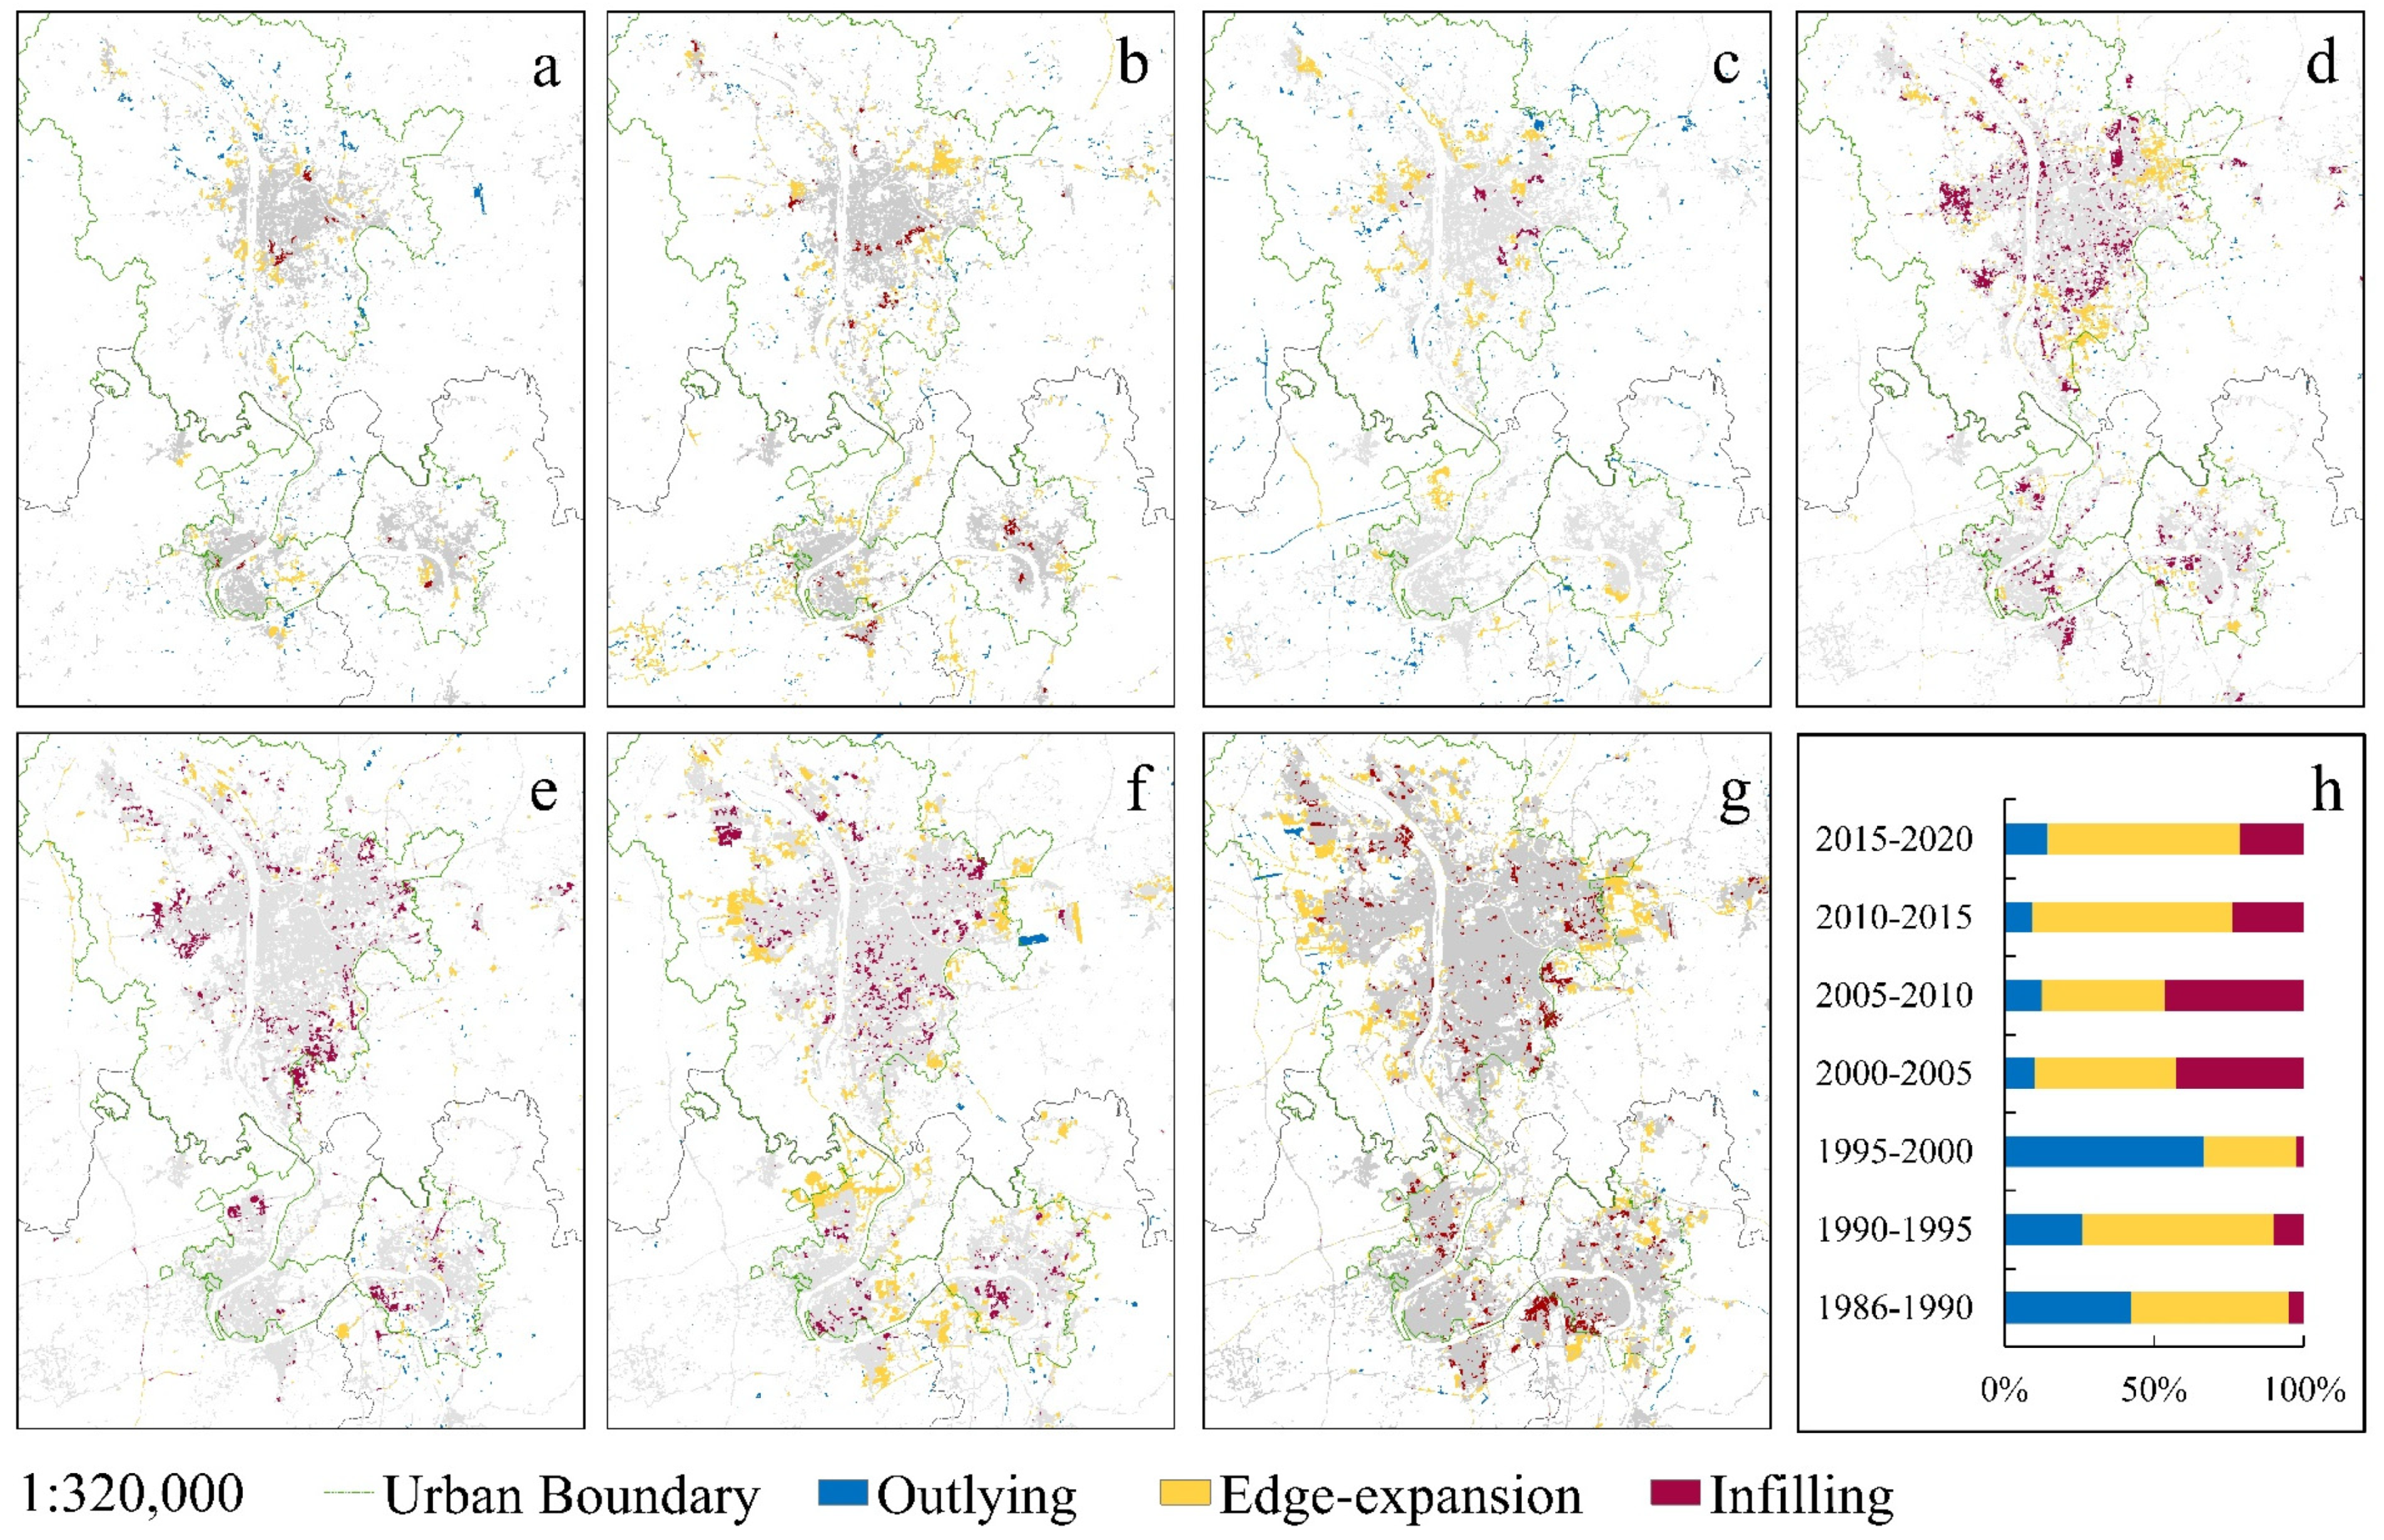
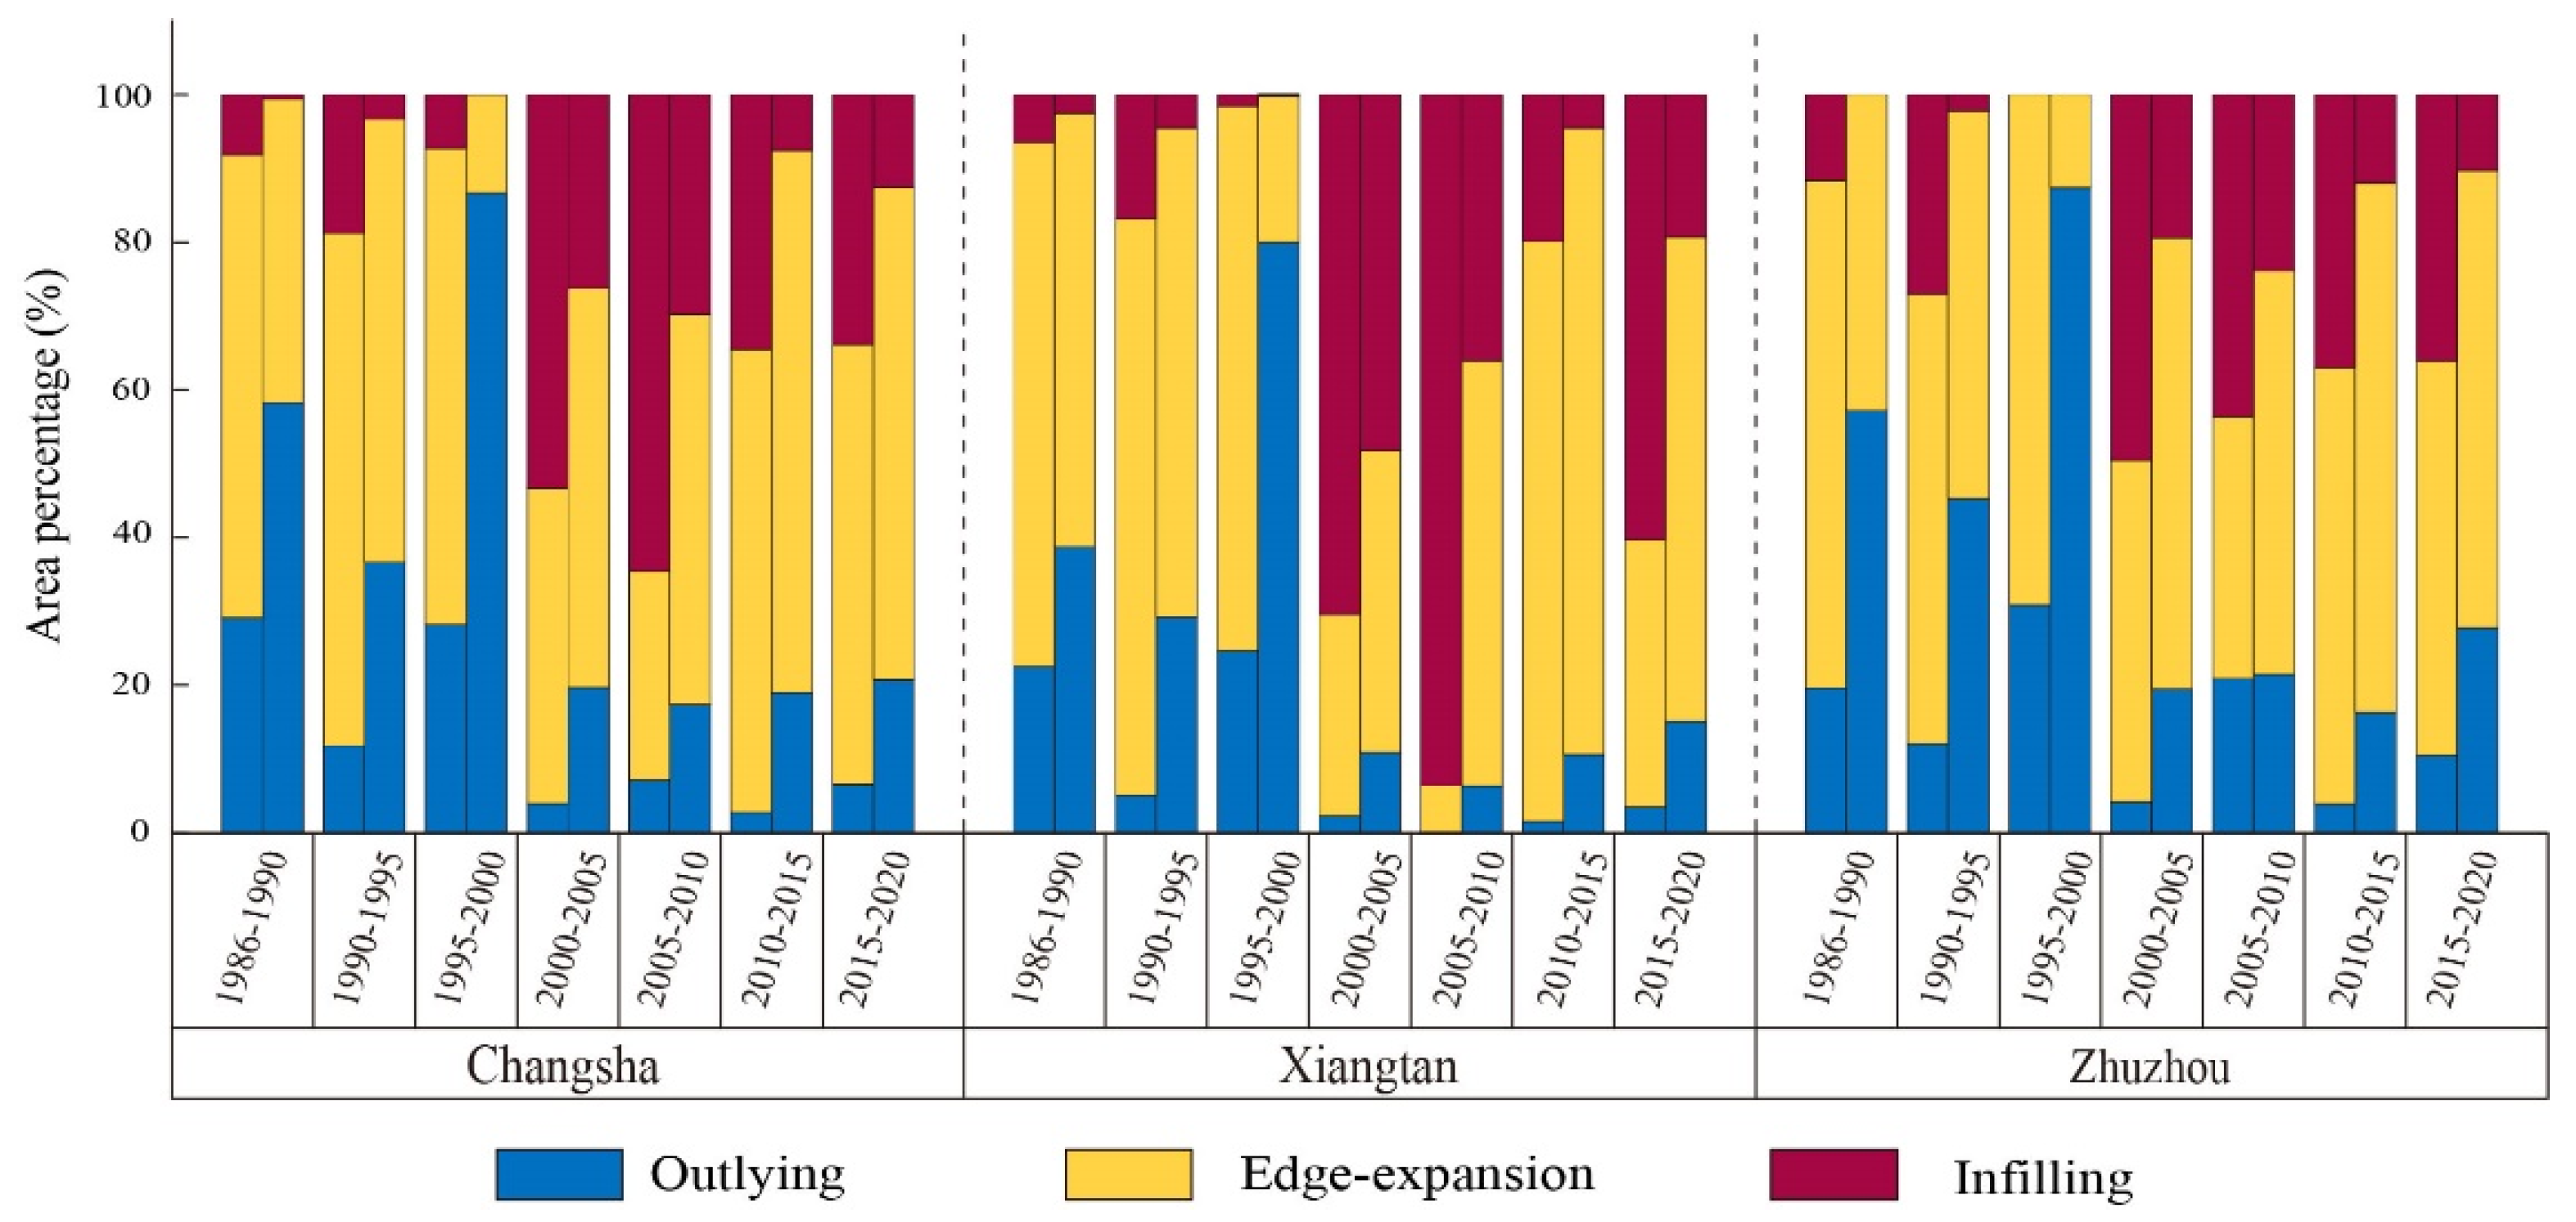
3.1. Spatiotemporal Patterns of Expansion
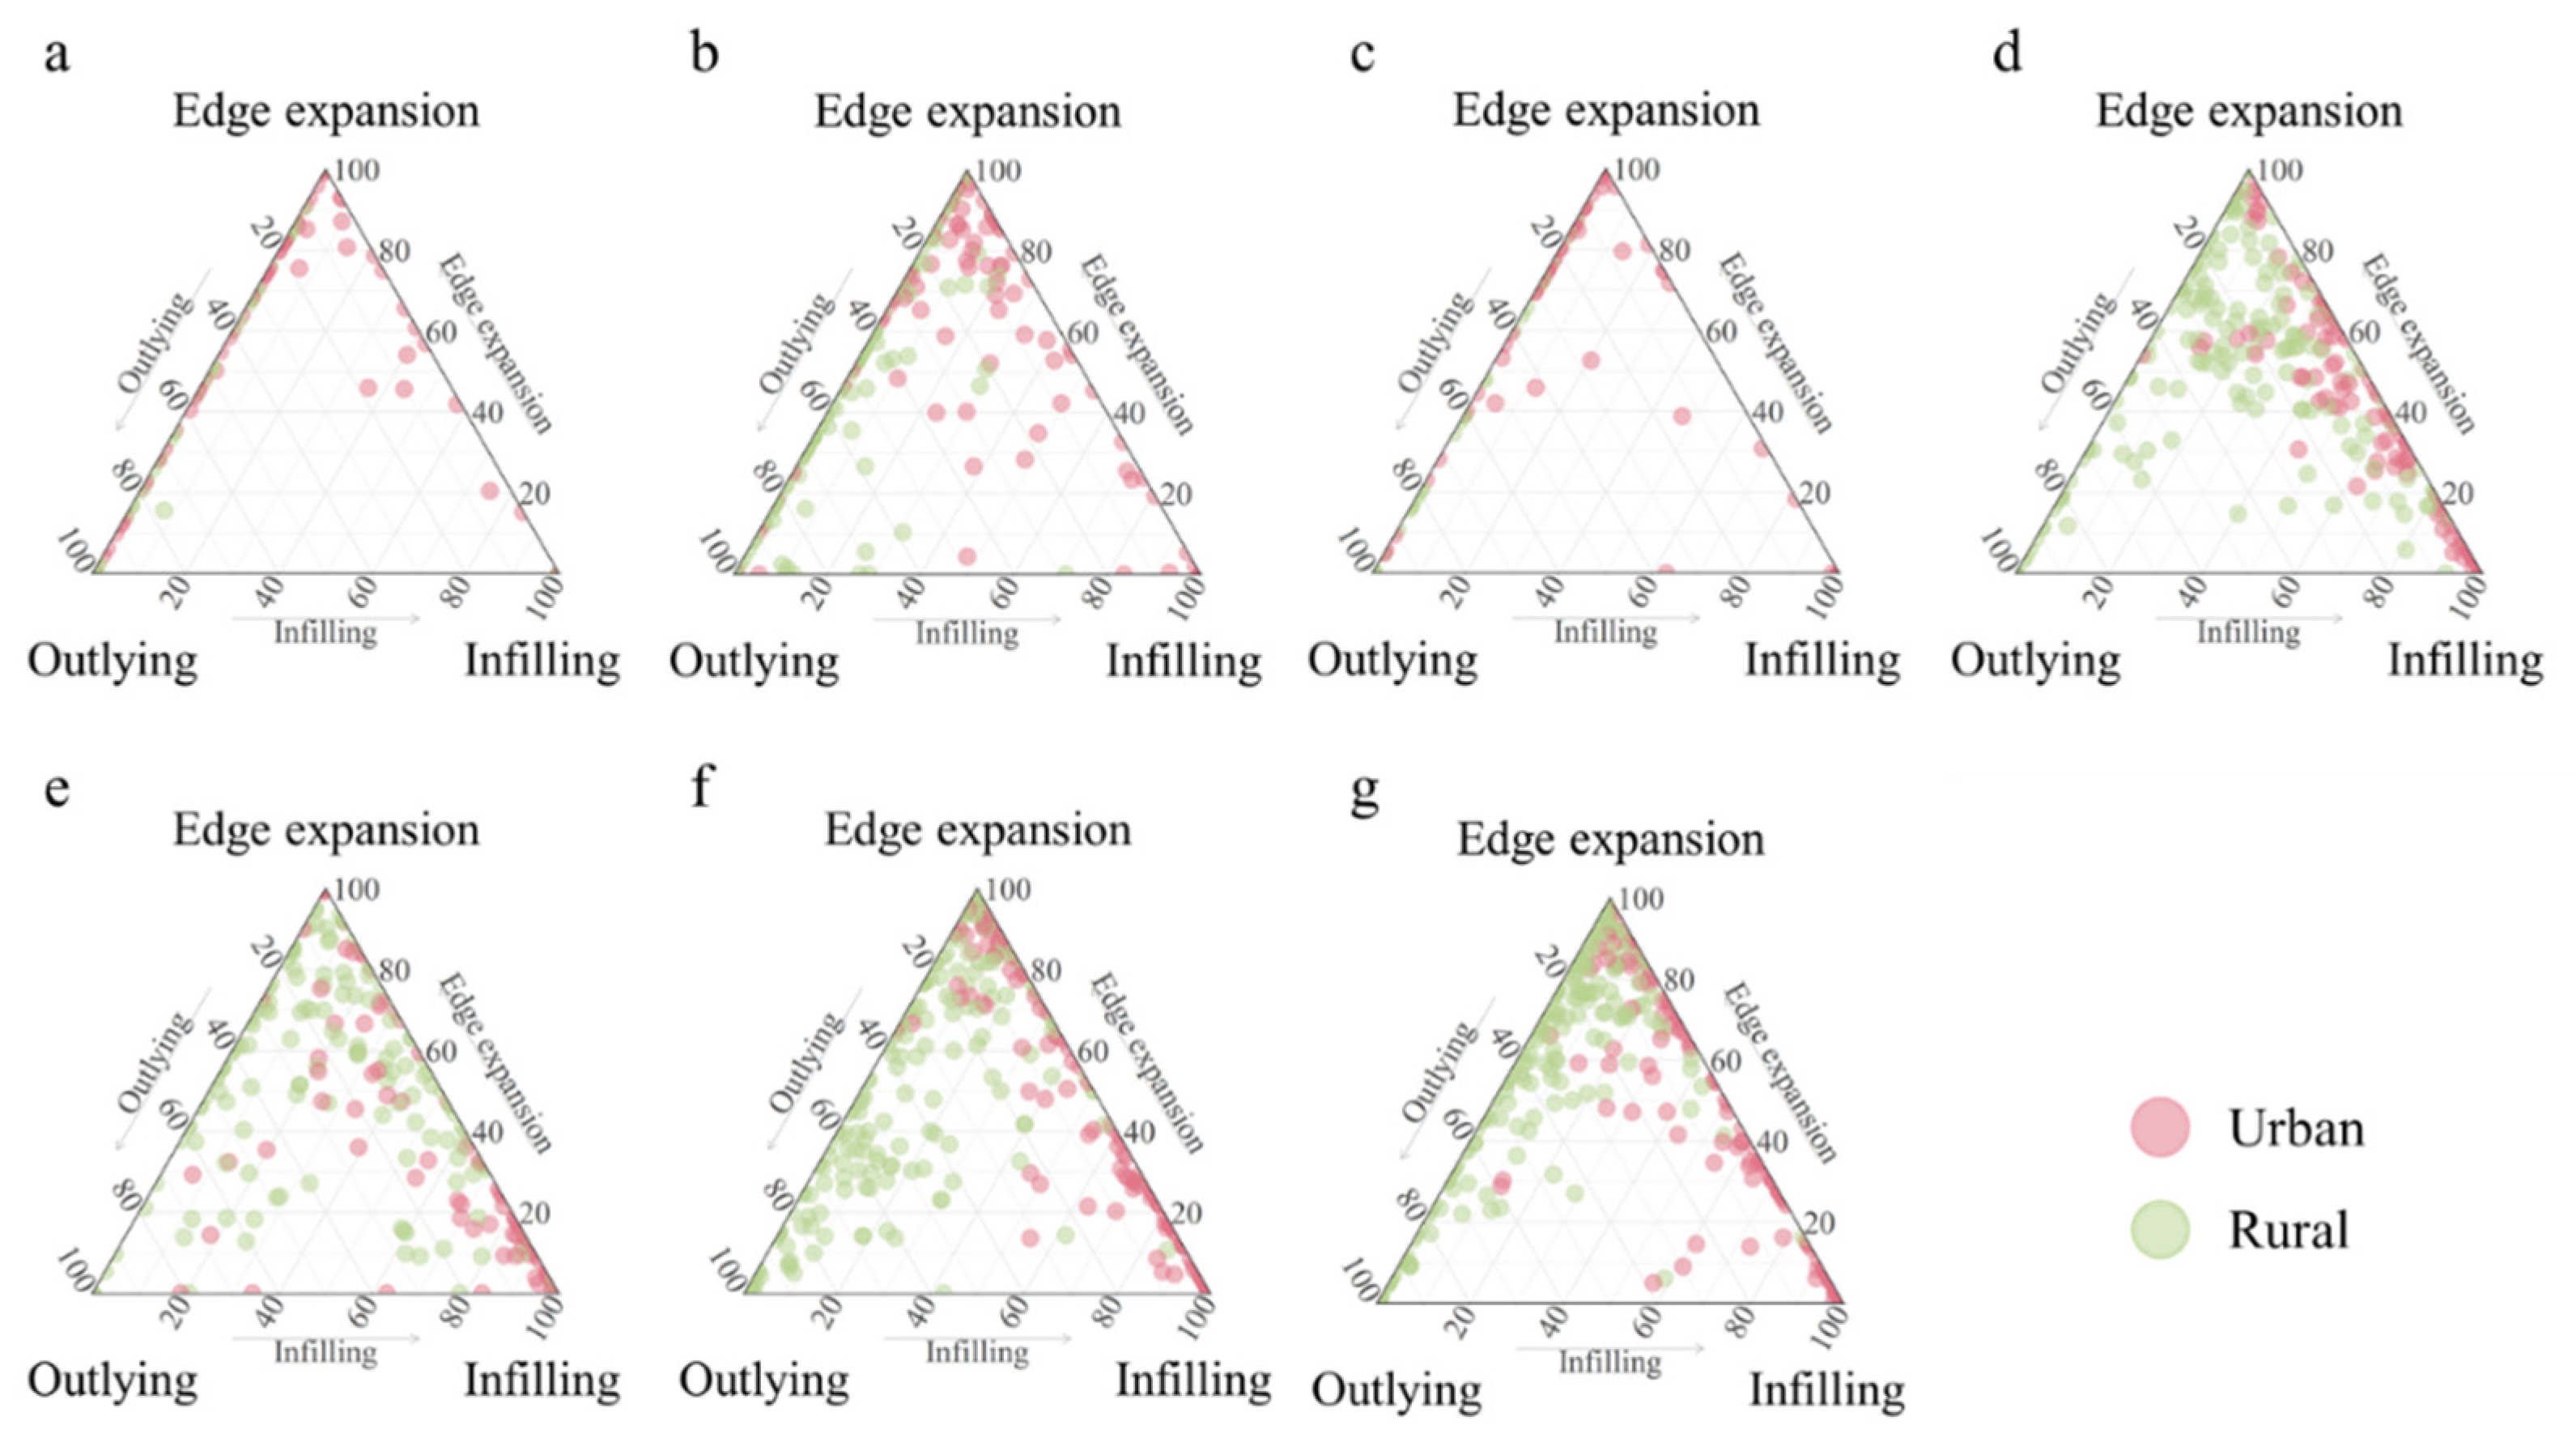
3.2. Changes in Morphology between Urban and Rural Areas
4. Discussion
4.1. Policies for Differential Changes between Urban and Rural Areas
4.2. Implications for Regional Development
4.3. Limitations and Future Work
5. Conclusions
Author Contributions
Funding
Data Availability Statement
Acknowledgments
Conflicts of Interest
References
- Forman, R.T.T. Land Mosaics: The Ecology of Landscape and Region; Cambridge University Press: Cambridge, UK, 1995. [Google Scholar]
- Burgess, E.W. The Growth of the City: An Introduction to a Research Project. In The City; Park, R.E., Burgess, E.W., McKenzie, R.D., Eds.; The Chicago University Press: Chicago, IL, USA, 1925; pp. 31–40. [Google Scholar]
- Jenerette, G.D.; Wu, J.G. Analysis and simulation of land-use change in the central Arizona-Phoenix region, USA. Landsc. Ecol. 2001, 16, 611–626. [Google Scholar] [CrossRef]
- Zhu, X.; Qiu, C.; Hu, J.; Shi, Y.; Wang, Y.; Schmitt, M.; Taubenböck, H. The urban morphology on our planet-Global perspectives from space. Remote Sens. Environ. 2022, 269, 112794. [Google Scholar] [CrossRef] [PubMed]
- Zhou, W.; Wang, J.; Qian, Y.; Pickett, S.T.A.; Li, W.; Han, L. The rapid but “invisible” changes in urban greenspace: A comparative study of nine Chinese cities. Sci. Total Environ. 2018, 627, 1572–1584. [Google Scholar] [CrossRef] [PubMed]
- Bren d’Amour, C.; Reitsma, F.; Baiocchi, G.; Barthel, S.; Guneralp, B.; Erb, K.H.; Haberl, H.; Creutzig, F.; Seto, K.C. Future urban land expansion and implications for global croplands. Proc. Natl. Acad. Sci. USA 2017, 114, 5. [Google Scholar] [CrossRef] [PubMed] [Green Version]
- Seto, K.C.; Reenberg, A.; Boone, C.G.; Fragkias, M.; Haase, D.; Langanke, T.; Marcotullio, P.; Munroe, D.K.; Olah, B.; Simon, D. Urban land teleconnections and sustainability. Proc. Natl. Acad. Sci. USA 2012, 109, 7687–7692. [Google Scholar] [CrossRef] [Green Version]
- Pickett, S.T.A.; Zhou, W. Global urbanization as a shifting context for applying ecological science toward the sustainable city. Ecosyst. Health Sustain. 2015, 1, 1–15. [Google Scholar] [CrossRef]
- Liu, J.G.; Hull, V.; Batistella, M. Framing Sustainability in a Telecoupled World. Ecol. Soc. 2013, 18, 26. [Google Scholar] [CrossRef]
- McManamay, R.A.; Brinkley, C.; Vernon, C.R.; Raj, S.; Rice, J.S. Urban land teleconnections in the United States: A graphical network approach. Comput. Environ. Urban Syst. 2022, 95, 1822. [Google Scholar] [CrossRef]
- Florida, R.; Gulden, T.; Mellander, C. The rise of the mega-region. Camb. J. Reg. Econ. Soc. 2008, 1, 459–476. [Google Scholar] [CrossRef]
- Li, Y.; Jia, L.; Wu, W.; Yan, J.; Liu, Y. Urbanization for rural sustainability e Rethinking China’s urbanization strategy. J. Clean. Prod. 2018, 178, 580–586. [Google Scholar] [CrossRef]
- Fang, C.; Yu, D. Urban agglomeration: An evolving concept of an emerging phenomenon. Landsc. Urban Plan 2017, 162, 126–136. [Google Scholar] [CrossRef]
- Liu, J.; Zhang, J.; Deng, X. Spatio-temporal patterns and driving forces of urban land expansion in China during the economic reform era. AMBIO A J. Hum. Environ. 2005, 34, 450–455. [Google Scholar] [CrossRef]
- Li, Y.; Li, Y.; Westlund, H.; Liu, Y. Urban-rural transformation in relation to cultivated land conversion in China: Implications for optimizing land use and balanced regional development. Land Use Policy 2015, 47, 218–224. [Google Scholar] [CrossRef]
- Yu, W.; Zhou, W. Spatial pattern of urban change in two Chinese megaregions: Contrasting responses to national policy and economic mode. Sci. Total Environ. 2018, 634, 10. [Google Scholar] [CrossRef] [PubMed]
- Zhang, S.; Fang, C.; Kuang, W.; Sun, F. Comparison of changes in urban land use/cover and efficiency of megaregions in China from 1980 to 2015. Remote Sens. 2019, 11, 1834. [Google Scholar] [CrossRef] [Green Version]
- Peen, J.; Schoevers, R.A.; Beekman, A.T.; Dekker, J. The current status of urban-rural differences in psychiatric disorders. Acta Psychiat. Scand. 2010, 121, 84–93. [Google Scholar] [CrossRef]
- Zhong, S.; Wang, M.; Zhu, Y.; Chen, Z.; Huang, X. Urban expansion and the urban–rural income gap: Empirical evidence from China. Cities 2022, 129, 103831. [Google Scholar] [CrossRef]
- Zhang, X.; Wu, Y.; Skitmore, M.; Jiang, S. Sustainable infrastructure projects in balancing urban–rural development: Towards the goal of efficiency and equity. J. Clean. Prod. 2015, 107, 445–454. [Google Scholar] [CrossRef]
- Xu, C.; Liu, M.S.; Zhang, C.; An, S.Q.; Yu, W.; Chen, J.M. The spatiotemporal dynamics of rapid urban growth in the Nanjing metropolitan region of China. Landsc. Ecol. 2007, 22, 925–937. [Google Scholar] [CrossRef]
- Liu, F.; Zhang, Z.; Wang, X. Forms of Urban Expansion of Chinese Municipalities and Provincial Capitals, 1970s–2013. Remote Sens. 2016, 8, 930. [Google Scholar] [CrossRef]
- Chakraborty, S.; Maity, I.; Dadashpoor, H.; Novotny, J. Building in or out? Examining urban expansion patterns and land use efficiency across the global sample of 466 cities with million+ inhabitants. Habitat Int. 2022, 120, 102503. [Google Scholar] [CrossRef]
- Schneider, A.; Woodcock, C.E. Compact, dispersed, fragmented, extensive? A comparison of urban growth in twenty-five global cities using remotely sensed data, pattern metrics and census information. Urban Stud. 2008, 45, 659–692. [Google Scholar] [CrossRef]
- Clarke, K.C.; Hoppen, S. A self-modifying cellular automaton model of historical urbanization in the San Francisco Bay area. Environ. Plan. B Plan. Des. 1997, 24, 15. [Google Scholar] [CrossRef] [Green Version]
- Debbage, N.; Bereitschaft, B.; Shepherd, J.M. Quantifying the Spatiotemporal Trends of Urban Sprawl Among Large U.S. Metropolitan Areas Via Spatial Metrics. Appl. Spat. Anal. 2017, 10, 29. [Google Scholar] [CrossRef]
- Kuang, W.H.; Chi, W.F.; Lu, D.S.; Dou, Y.Y. A comparative analysis of megacity expansions in China and the U.S.: Patterns, rates and driving forces. Landsc. Urban Plan 2014, 132, 121–135. [Google Scholar] [CrossRef]
- Weng, Y.C. Spatiotemporal changes of landscape pattern in response to urbanization. Landsc. Urban Plan 2007, 81, 341–353. [Google Scholar] [CrossRef]
- Liu, X.; Li, X.; Chen, Y.; Tan, Z.; Li, S.; Ai, B. A new landscape index for quantifying urban expansion using multi-temporal remotely sensed data. Landsc. Ecol. 2010, 25, 671–682. [Google Scholar] [CrossRef]
- Dietzel, C.; Herold, M.; Hemphill, J.J.; Clarke, K.C. Spatio-temporal dynamics in California’s central valley: Empirical links to urban theory. Int. J. Geogr. Inf. Sci. 2005, 19, 175–195. [Google Scholar] [CrossRef]
- Li, C.; Li, J.X.; Wu, J.G. Quantifying the speed, growth modes, and landscape pattern changes of urbanization: A hierarchical patch dynamics approach. Landsc. Ecol. 2013, 28, 1875–1888. [Google Scholar] [CrossRef]
- Luck, M.; Wu, J.G. A gradient analysis of urban landscape pattern: A case study from the Phoenix metropolitan region, Arizona, USA. Landsc. Ecol. 2002, 17, 327–339. [Google Scholar] [CrossRef]
- Shi, Y.; Sun, X.; Zhu, X.; Li, Y.; Mei, L. Characterizing growth types and analyzing growth density distribution in response to urban growth patterns in peri-urban areas of Lianyungang City. Landsc. Urban Plan. 2012, 105, 425–433. [Google Scholar] [CrossRef]
- Zhao, S.; Zhou, D.; Zhu, C.; Qu, W.; Zhao, J.; Sun, Y.; Huang, D.; Wu, W.; Liu, S. Rates and patterns of urban expansion in China’s 32 major cities over the past three decades. Landsc. Ecol. 2015, 30, 1541–1559. [Google Scholar] [CrossRef]
- Huang, X.; Xia, J.; Xiao, R.; He, T. Urban expansion patterns of 291 Chinese cities, 1990–2015. Int. J. Digit. Earth 2019, 12, 62–77. [Google Scholar] [CrossRef]
- Yu, W.; Zhou, W. The Spatiotemporal Pattern of Urban Expansion in China: A Comparison Study of Three Urban Megaregions. Remote Sens. 2017, 9, 45. [Google Scholar] [CrossRef] [Green Version]
- Yang, C.; Li, Q.; Hu, Z.; Chen, J.; Shi, T.; Ding, K.; Wu, G. Spatiotemporal evolution of urban agglomerations in four major bay areas of US, China and Japan from 1987 to 2017: Evidence from remote sensing images. Sci. Total Environ. 2019, 671, 232–247. [Google Scholar] [CrossRef]
- The State Council the People’s Republic of China. Tenth Five-Year Plan for National Economic and Social Development. 2001. Available online: http://www.gov.cn/gongbao/content/2001/content_60699.htm (accessed on 20 October 2022). (In Chinese)
- People’s Government of Hunan Province. Plan for Chang-Zhu-Tan Regional Development. 2017. Available online: http://www.hunan.gov.cn/zhuanti/cztcsq/fzgh/ (accessed on 20 October 2022). (In Chinese)
- Yu, W.; Zhou, W.; Qian, Y.; Yan, J. A new approach for land cover classification and change analysis: Integrating backdating and an object-based method. Remote Sens. Environ. 2016, 177, 37–47. [Google Scholar] [CrossRef]
- Zhu, Z.; Woodcock, C.E.; Holden, C.; Yang, Z. Generating synthetic Landsat images based on all available Landsat data: Predicting Landsat surface reflectance at any given time. Remote Sens. Environ. 2015, 162, 67–83. [Google Scholar] [CrossRef]
- Li, X.; Gong, P.; Zhou, Y.; Wang, J. Mapping global urban boundaries from the global artificial impervious area (GAIA) data. Environ. Res. Lett. 2020, 15, 094044. [Google Scholar] [CrossRef]
- Peng, J.; Liu, Q.; Liu, Y.; Hu, Y.; Li, Y.; Yue, Y. Spatial-temporal change of land surface temperature across 285 cities in China: An urban-rural contrast perspective. Sci. Total Environ. 2018, 635, 487–497. [Google Scholar] [CrossRef]
- Wang, P.; Zeng, C.; Song, Y.; Guo, L.; Liu, W.; Zhang, W. The Spatial Effect of Administrative Division on Land-Use Intensity. Land 2021, 10, 543. [Google Scholar] [CrossRef]
- Mao, Q.; Ying, Z.; Kang, W. Spatio-Temporal Changes of Population Density and Urbanization Pattern in China (2000–2010). China City Plan. Rev. 2016, 25, 8–14. [Google Scholar]
- Seto, K.C.; Fragkias, M.; Guneralp, B.; Reilly, M.K. A Meta-Analysis of Global Urban Land Expansion. PLoS ONE 2011, 6, e23777. [Google Scholar] [CrossRef] [PubMed]
- Jiang, W.; Chen, Z.; Lei, X.; He, B.; Jia, K.; Zhang, Y. Simulation of urban agglomeration ecosystem spatial distributions under different scenarios: A case study of the Changsha–Zhuzhou–Xiangtan urban agglomeration. Ecol. Eng. 2016, 88, 112–121. [Google Scholar] [CrossRef]
- Yang, Y.; Liu, Y.; Li, Y.; Li, J. Measure of urban-rural transformation in Beijing-Tianjin-Hebei region in the new millennium: Population-land-industry perspective. Land Use Policy 2018, 79, 595–608. [Google Scholar] [CrossRef]
- Li, G.; Cao, Y.; He, Z.; He, J.; Cao, Y.; Wang, J.; Fang, X. Understanding the diversity of urban–rural fringe development in a fast urbanizing region of China. Remote Sens. 2021, 13, 2373. [Google Scholar] [CrossRef]
- Zhou, Y.; Chen, T.; Feng, Z.; Wu, K. Identifying the contradiction between the cultivated land fragmentation and the construction land expansion from the perspective of urban-rural differences. Ecol. Inform. 2022, 71, 101826. [Google Scholar] [CrossRef]
- Yang, R.; Zhang, J.; Xu, Q.; Luo, X. Urban-rural spatial transformation process and influences from the perspective of land use: A case study of the Pearl River Delta Region. Habitat Int. 2020, 104, 102234. [Google Scholar] [CrossRef]
- Fang, C. Policy implication process and prospect of Chinese urban agglomerations formation and development. Sci. Geogr. Sin. 2012, 32, 257–264. (In Chinese) [Google Scholar]
- People’s Government of Hunan Province. Development Plan for Chang-Zhu-Tan Metropolitan Area. 2022. Available online: http://www.hunan.gov.cn/hnszf/xxgk/wjk/szfwj/202203/t20220329_22725038.html (accessed on 20 October 2022). (In Chinese)
- Tan, X.; Ouyang, Q.; An, T.; Mi, S.; Jiang, L.; Zhou, G. Evolution and driving forces of rural functions in urban agglomeration: A case study of the Chang-Zhu-Tan region. J. Geogr. Sci. 2019, 29, 1381–1395. [Google Scholar] [CrossRef] [Green Version]
- Curtis, P.G.; Slay, C.M.; Harris, N.L.; Tyukavina, A.; Hansen, M.C. Classifying drivers of global forest loss. Science 2018, 361, 1108–1111. [Google Scholar] [CrossRef]
- Zhou, W.; Yu, W.; Qian, Y.; Han, L.; Pickett, S.T.A.; Wang, J.; Li, W.; Ouyang, Z. Beyond city expansion: Multi-scale environmental impacts of urban megaregion formation in China. Natl. Sci. Rev. 2022, 9, nwab107. [Google Scholar] [CrossRef] [PubMed]
- Qian, J.; Peng, Y.; Luo, C.; Wu, C.; Du, Q. Urban land expansion and sustainable land use policy in Shenzhen: A case study of China’s rapid urbanization. Sustainability 2016, 8, 16. [Google Scholar] [CrossRef]


| Year | Changsha | Zhuzhou | Xiangtan | ||||||||||||
|---|---|---|---|---|---|---|---|---|---|---|---|---|---|---|---|
| Total | Urban | Rural | Ratio | AGR | Total | Urban | Rural | Ratio | AGR | Total | Urban | Rural | Ratio | AGR | |
| 1986 | 286.98 | 167.17 | 119.81 | 1.40 | / | 225.54 | 79.00 | 146.53 | 0.54 | / | 153.95 | 60.91 | 93.04 | 0.65 | / |
| 1990 | 334.62 | 203.01 | 131.61 | 1.54 | 3.91 | 255.97 | 88.75 | 167.23 | 0.53 | 3.22 | 172.06 | 70.09 | 101.97 | 0.69 | 2.82 |
| 1995 | 408.11 | 253.79 | 154.32 | 1.64 | 4.05 | 283.37 | 99.59 | 183.78 | 0.54 | 2.05 | 231.68 | 77.90 | 153.78 | 0.51 | 6.13 |
| 2000 | 522.99 | 317.57 | 205.43 | 1.55 | 5.09 | 351.46 | 102.55 | 248.91 | 0.41 | 4.40 | 276.97 | 85.67 | 191.30 | 0.45 | 3.64 |
| 2005 | 660.17 | 421.71 | 238.46 | 1.77 | 4.77 | 411.05 | 121.88 | 289.17 | 0.42 | 3.18 | 306.07 | 100.52 | 205.55 | 0.49 | 2.02 |
| 2010 | 774.31 | 482.96 | 291.35 | 1.66 | 3.24 | 452.22 | 137.47 | 314.76 | 0.44 | 1.93 | 319.20 | 105.41 | 213.79 | 0.49 | 0.84 |
| 2015 | 924.38 | 581.95 | 342.43 | 1.70 | 3.61 | 510.88 | 160.53 | 350.35 | 0.46 | 2.47 | 378.16 | 140.15 | 238.01 | 0.59 | 3.45 |
| 2020 | 1123.96 | 697.17 | 426.80 | 1.63 | 3.99 | 648.33 | 191.21 | 457.11 | 0.42 | 4.88 | 418.55 | 154.43 | 264.12 | 0.58 | 2.05 |
| Year | CZT Megaregion | Urban | Rural | ||||||
|---|---|---|---|---|---|---|---|---|---|
| Outlying | Edge Expansion | Infilling | Outlying | Edge Expansion | Infilling | Outlying | Edge Expansion | Infilling | |
| 1986–1990 | 0.58 ** | 0.46 ** | 0.04 | 0.58 ** | 0.49 ** | 0.01 | 0.73 ** | 0.38 ** | −0.02 |
| 1990–1995 | 0.41 * | 0.71 ** | 0.08 | 0.43 ** | 0.68 ** | 0.12 | 0.44 ** | 0.73 ** | 0.07 |
| 1995–2000 | 0.34 ** | 0.20 ** | −0.02 | 0.46 ** | 0.54 ** | 0.02 | 0.31 ** | 0.12 | −0.05 |
| 2000–2005 | 0.34 ** | 0.67 ** | 0.46 ** | 0.51 ** | 0.67 ** | 0.53 ** | 0.45 ** | 0.68 ** | 0.19 * |
| 2005–2010 | 0.43 ** | 0.56 ** | 0.36 ** | 033 ** | 0.53 ** | 0.53 ** | 0.47 ** | 0.58 ** | 0.32 ** |
| 2010–2015 | 0.37 ** | 0.52 ** | 0.24 ** | 0.46 ** | 0.55 ** | 0.32 ** | 0.44 ** | 0.52 ** | 0.12 |
| 2015–2020 | 0.46 ** | 0.55 ** | 0.10 | 0.42 ** | 0.77 ** | 0.26 ** | 0.45 ** | 0.45 ** | 0.09 |
Disclaimer/Publisher’s Note: The statements, opinions and data contained in all publications are solely those of the individual author(s) and contributor(s) and not of MDPI and/or the editor(s). MDPI and/or the editor(s) disclaim responsibility for any injury to people or property resulting from any ideas, methods, instructions or products referred to in the content. |
© 2023 by the authors. Licensee MDPI, Basel, Switzerland. This article is an open access article distributed under the terms and conditions of the Creative Commons Attribution (CC BY) license (https://creativecommons.org/licenses/by/4.0/).
Share and Cite
Qin, J.; Yu, W.; Li, S.; Zhou, W.; Shen, S. Does Regional Urbanization Promote Balanced Land Development? Evidence from Long Time Series Satellite Imagery. Remote Sens. 2023, 15, 783. https://doi.org/10.3390/rs15030783
Qin J, Yu W, Li S, Zhou W, Shen S. Does Regional Urbanization Promote Balanced Land Development? Evidence from Long Time Series Satellite Imagery. Remote Sensing. 2023; 15(3):783. https://doi.org/10.3390/rs15030783
Chicago/Turabian StyleQin, Jun, Wenjuan Yu, Sheng Li, Weiqi Zhou, and Shouyun Shen. 2023. "Does Regional Urbanization Promote Balanced Land Development? Evidence from Long Time Series Satellite Imagery" Remote Sensing 15, no. 3: 783. https://doi.org/10.3390/rs15030783