Article

Temporal and Spatial Change in Vegetation and Its Interaction with Climate Change in Argentina from 1982 to 2015

1
Institute of Soil and Water Conservation, Northwest A&F University, Xianyang 712100, China
2
Institute of Soil and Water Conservation, Chinese Academy of Sciences and Ministry of Water Resources, Xianyang 712100, China
3
Instituto Argentino de Nivología, Glaciología y Ciencias Ambientales (IANIGLA-CONICET), 5500 CCT Mendoza, Argentina
4
Instituto Argentino de Investigaciones de Las Zonas Áridas (IADIZA-CONICET), 5500 CCT Mendoza, Argentina
*
Author to whom correspondence should be addressed.
Remote Sens. 2023, 15(7), 1926; https://doi.org/10.3390/rs15071926
Submission received: 9 February 2023 / Revised: 29 March 2023 / Accepted: 31 March 2023 / Published: 3 April 2023

Abstract

:
Studying vegetation change and its interaction with climate change is essential for regional ecological protection. Previous studies have demonstrated the impact of climate change on regional vegetation in South America; however, studies addressing the fragile ecological environment in Argentina are limited. Therefore, we assessed the vegetation dynamics and their climatic feedback in five administrative regions of Argentina, using correlation analysis and multiple regression analysis methods. The Normalized Difference Vegetation Index 3rd generation (NDVI3g) from Global Inventory Monitoring and Modeling Studies (GIMMS) and climatic data from the Famine Early Warning Systems Network (FEWS NET) Land Data Assimilation System (FLDAS) were processed. The NDVI of the 1982–2015 period in Argentina showed a downward trend, varying from −1.75 to 0.69/decade. The NDVI in Northeast Argentina (NEA), Northwest Argentina (NWA), Pampas, and Patagonia significantly decreased. Precipitation was negatively correlated with the NDVI in western Patagonia, whereas temperature and solar radiation were positively correlated with the NDVI. Extreme precipitation and drought were essential causes of vegetation loss in Patagonia. The temperature (73.09%), precipitation (64.02%), and solar radiation (73.27%) in Pampas, Cuyo, NEA, and NWA were positively correlated with the NDVI. However, deforestation and farming and pastoral activities have caused vegetation destruction in Pampas, NEA, and NWA. Environmental protection policies and deforestation regulations should be introduced to protect the ecological environment. The results of this study clarify the reasons for the vegetation change in Argentina and provide a theoretical reference for dealing with climate change.

1. Introduction

As a critical “producer” in terrestrial ecosystems, vegetation is inseparable from natural factors such as climate, soil, terrain, animals, and water [1,2]. Plants convert carbon dioxide (CO2) and water into oxygen and organic matter through photosynthesis and decompose oxygen and organic matter into CO2 and water through respiration [3], which play a crucial role in terrestrial carbon storage, material cycle, energy flow, and maintaining ecological balance [4,5]. Climate changes the vegetation growth structure, in which seasonal changes in precipitation can alter soil water availability to plants [6], and temperatures can directly and simultaneously affect plant photosynthesis and respiration [7]. Although climate change can promote vegetation growth and its phenological response [8,9], it can also bring about negative impacts such as vegetation degradation, soil erosion, and land degradation [10,11].
Air temperature, precipitation, and solar radiation are considered the dominant climate drivers of vegetation growth [12]. Variations in temperature and precipitation can affect the availability of nutrients and water for plant growth. For example, some studies have pointed out that the increase in temperature leads to changes in the evapotranspiration of plants, which affects the greenness of vegetation [13,14]. One study found that the vegetation coverage in Patagonia decreased with increasing drought severity and temperature [15]. At the same time, precipitation is a limiting condition for vegetation growth in arid and semi-arid regions [6]. Olivares-Contreras et al. found that increased temperature and decreased rainfall may be contributing factors to the declines in greenness at the regional scale in Chilean Patagonia, increasing the vulnerability of Patagonian forests [16]. Solar radiation is an energy source for plant photosynthesis, affecting plant morphology, growth, and development through light intensity, light length, and spectral composition [17,18]. In contrast, tropical forest ecosystems are more vulnerable to rainfall and solar radiation [19,20]. Other than climate change, human activity is a vital factor in vegetation growth, affecting vegetation coverage by improving or destroying the growth environment of plants. Land-use change is considered a major factor leading to vegetation changes [21,22]. For example, measures such as ecological engineering, afforestation, and grazing prohibition can promote the greening trend of vegetation [23]. Afforestation and ecological engineering can provide natural conditions such as sufficient water, temperature, light, and fertile soil for the growth and development of trees [24], and improve plants’ living environment, thereby promoting tree growth and increasing vegetation coverage. However, human activities such as soybean expansion [25] and farmland irrigation [26] may bring about deforestation and vegetation degradation. The agriculture expansion, intensive production in Pampas, and pastoral activities in Patagonia have changed the natural species composition, and the natural appearance of plants has been destroyed [27]. These human disturbance activities have greatly changed the energy balance and chemical cycle of surface matter [28], thereby affecting surface properties and vegetation ecosystems. The transition from forest to farmland and pasture in the Chaco region has changed the water supply, which in turn affects the water use efficiency of vegetation and hinders the growth and development of vegetation [29]. Furthermore, economic activities such as logging, reclamation, and land clearing directly lead to the loss of a large amount of natural vegetation [21].
The terrestrial ecosystem in South America is comprehensively affected by climate change, persistent droughts, extreme weather events, and anthropogenic land-use changes [30]. On the one hand, Argentina has suffered from increasingly severe droughts in recent decades [31,32]. Water shortages have a significant impact on soil water availability and vegetation growth, aggravating the drought in farmland and grassland [33,34]. The fragile ecological environment in Argentina faces greater risks because of the more frequent extreme climate events [35]. On the other hand, deforestation has become a major environmental problem in Argentina owing to land-use change [21,36], especially in the north [37], where the forest ecosystem has been seriously damaged. Climate- and human-driven variations in vegetation have seriously influenced soil and water resources, ecosystems, agricultural development, and socioeconomic security in Argentina and even South America. A series of studies have demonstrated the interaction of vegetation change in several regions of South America with climate variables and human activity, particularly in the Amazon [38], Brazil [39], and Patagonia [40]. These studies have provided valuable observations on the long-term monitoring of vegetation dynamics in South America, but few studies have been conducted in Argentina. Argentina is the second largest country in South America, abundant in natural resources and diverse vegetation. However, influenced by the Andes Mountains [41], El Niño [42], and other factors, Argentina has a fragile ecological environment and is very sensitive to climate change. Therefore, it is crucial to assess the temporal and spatial changes in vegetation in Argentina and their interaction with climatic factors, which helps us to better understand the impact of global warming on vegetation growth in Argentina and South America.
Among the commonly used vegetation indices, the Normalized Difference Vegetation Index (NDVI) is closely related to chlorophyll content, vegetation net productivity, photosynthetically active radiation, and leaf area index, which can enhance vegetation representation ability to a certain extent and provide valuable information on vegetation dynamics [43,44,45]. The NDVI can also provide reliable information on ecosystem attributes such as vegetation coverage and species richness [15], playing an increasingly important role in assessing and monitoring land degradation and drought [34,46]. It is considered the best for characterizing the vegetation growth state and studying the spatial characteristics of vegetation [47,48], which are widely used in regional- or global-scale vegetation dynamic change and environmental monitoring research [49]. In addition, the residual trend-based method detects vegetation changes caused by human activities by establishing a multiple regression model of climatic factors (such as temperature and precipitation) and the NDVI [50], thereby further quantitatively distinguishing the driving mechanisms that affect vegetation dynamics (climatic and anthropogenic factors) [51]. This study used several methods to analyze vegetation change and its influencing factors in Argentina from 1982 to 2015 (34 years). The objectives include (1) understanding the spatiotemporal vegetation pattern in Argentina from 1982 to 2015, and (2) analyzing the impact mechanism of vegetation change driving factors. This study contributes to a comprehensive understanding of vegetation increase (decrease) and its climate feedback in Argentina and provides valuable references for Argentina to cope with climate change and protect the ecological environment.

2. Materials and Methods

2.1. Study Area

The study area was located in continental Argentina (52°–72°W, 21°–55°S), with a land area of 2,780,400 km2. The terrain of the study area is high in the west and low in the east (Figure 1a), derived from the Global Digital Surface Model (DSM) dataset ALOS World 3D-30m (AW3D30) (https://www.eorc.jaxa.jp/ALOS/en/dataset/aw3d30/aw3d30_e.htm, accessed on 24 September 2022). The west of Argentina is high and dominated by the Andes Mountains, accounting for approximately 30% of the national area. The eastern and central areas are primarily farmland and rangeland, and to the west are irrigation oases and deserts; in the north, there is a significant area of tropical forest and shrubs, and the vast plateau is in the south. According to the National Institute of Statistics and Censuses of the Argentine Republic (INDEC in Spanish: www.indec.gob.ar, accessed on 1 October 2022), the study area is divided into five administrative regions [52], namely, Cuyo, Northeast Argentina (NEA), Northwest Argentina (NWA), Pampas, and Patagonia.
Argentina has a diverse climate with a large north–south span. The highest and lowest points of South America are both in Argentina, located in the northwest of Cuyo and a large depression in the southwest of Patagonia, respectively. Most of the areas have subtropical climates and mid-latitudes, varying from hot in the north to very cold in the southernmost region and at the heights of the Andes Mountains. The average annual temperature in Argentina is 14.22 °C, the average annual precipitation is 640.71 mm, and the annual average solar radiation is 2638.66 (W·m−2) (Figure 2). Based on the European Space Agency Climate Change Initiative (ESA-CCI) land cover product from 1992 to 2015 (300 m) (http://maps.elie.ucl.ac.be/CCI/viewer/download.php, accessed on 13 March 2023), combined with the classification system of the International Geosphere-Biosphere Program (IGBP), the land cover of Argentina was divided into 13 classes (Figure 1b). Pampas is dominated by agricultural land, with savanna and shrubland in the north and southwest, and a small part of natural grassland. Most of the vegetation in Cuyo is shrubland. The NEA has evergreen deciduous forests, deciduous coniferous forests, and savannas. The eastern NWA is dominated by deciduous coniferous forests, while the western part is sparse vegetation. Patagonia is dominated by sparse vegetation and shrubland, with deciduous coniferous forests in the southernmost and western region. Argentina has a large variety of vegetation types, from savannas and swamps in the northern region to tundra in the far south, with strong spatial heterogeneity.

2.2. Data Collection and Preprocessing

2.2.1. GIMMS NDVI3g

In this study, the NDVI data originated from the National Aeronautics and Space Administration (NASA) Global Inventory Monitoring and Modeling Studies (GIMMS) Normalized Difference Vegetation Index 3rd generation (NDVI3g) dataset (https://ecocast.arc.nasa.gov/data/pub/gimms/3g.v1/, accessed on 10 October 2022). GIMMS NDVI3g dataset originated from the Advanced Very High-Resolution Radiometer (AVHRR) sensors on board the National Oceanic and Atmospheric Administration (NOAA) satellites. Compared with the previous GIMMS NDVI, the third generation GIMMS NDVI3g has a great improvement [51]. The dataset has the highest temporal consistency among the long-term AVHRR datasets and is considered the most appropriate choice for NDVI trend analysis [53]. The dataset has a spatial resolution of 8 km and a temporal resolution of 15 days, covering the period from July 1981 to December 2015.
The NDVI is calculated based on the near-infrared band (NIR) and red band (RED) reflectance [14]:
NDVI = NIR RED NIR + RED
where NIR is the spectral reflectance of the near-infrared (0.58–0.68 μm) band, and RED is the spectral reflectance of the red (0.725–1.10 μm) band. The NDVI ranges from −1 to 1. The NDVI value between −1 to 0 indicates that the ground is covered by clouds, water, and snow, highly reflective to visible light. The NDVI value of 0 indicates that there are rocks or bare soil, and NIR and RED are approximately equal. The NDVI value between 0 and 1 indicates the presence of vegetation coverage, which increases with the increase in coverage.

2.2.2. Climatic Data

Climatic data were obtained from the Famine Early Warning Systems Network (FEWS NET) Land Data Assimilation System (FLDAS). As one of the custom instances of the NASA Land Information System (http://lis.gsfc.nasa.gov/, accessed on 8 January 2023), the FLDAS global model can adapt to the environmental data monitoring and prediction requirements of developing countries with scarce data [54]. FLDAS variables such as air temperature, precipitation, evapotranspiration, soil moisture, and solar radiation are related to agriculture and water resources and can monitor vegetation variation and hydrological drought. The spatial resolution of this dataset is 0.1°, and the time coverage was from 1982 to the present with a time resolution of one month. Monthly air temperature (°C), precipitation (mm), and solar radiation (W·m−2) were downloaded from the NASA Goddard Earth Science Data and Information Service Center (GES DISC) (https://disc.gsfc.nasa.gov/datasets/FLDAS_NOAH01_C_GL_M_001/summary?keywords=FLDAS_NOAH01_C_GL_M_001, accessed on 12 October 2022).

2.2.3. Data Preprocessing

In this study, all data (Table 1) were processed in MATLAB version R2021a and ArcGIS version 10.7, and graphs were drawn in OriginPro version 2022. The NDVI data and climatic data from January 1982 to December 2015 were processed as follows. First, in MATLAB, the NDVI NetCDF format data with a temporal resolution of 15 days were synthesized into the NDVI TIFF format of monthly scale using the maximum value composite (MVC) [55]. This method can eliminate the impact of clouds, atmosphere, and solar altitude angles on the image and has been widely used in NDVI preprocessing. Second, we used the clip tool in ArcGIS to clip the Argentine extent NDVI from the global scale; we defined the coordinate system of all TIFF files as GCS-WGS-1984 and projected to UTM-21S. In addition, to match the spatial resolution of the NDVI time series, the resample tool in ArcGIS (nearest neighbor method) was used to resample the monthly climate data to 8 km. Based on the synthesized monthly NDVI data, we calculated the annual mean and multi-year variation in NDVI in Argentina. We also calculated the annual average values of temperature, precipitation, and solar radiation based on the monthly data of climatic factors to analyze the effect of climate on vegetation changes. Finally, the NDVI values and climatic data were exported. The corresponding graphs of the NDVI and climatic data were plotted using Origin. Different maps were generated using ArcGIS to represent the spatial pattern of the NDVI.

2.3. Methods

2.3.1. Linear Regression Analysis

The variation trends of the NDVI and climatic factors were calculated pixel by pixel based on the least-squares method [26]. This method constructed a linear regression equation with time as the independent variable and defined the slope of the linear regression equation as the rate of change (slope), which was used to represent the rate of change in the dependent variable over time [56]. The slope coefficient is calculated as follows:
Slope = n × i = 1 n i × X i i = 1 n i i = 1 n X i n × i = 1 n i 2 i = 1 n i
where Slope is the linear trend of the dependent variable (NDVI, temperature, precipitation, and solar radiation), Xi is the value of the dependent variable in the ith year, i represents the ith year, and n is the time series length (34 years). When slope > 0, the dependent variable is an upward trend; when slope < 0, the dependent variable is a decreasing trend. The trend’s significance was detected by a t test, where p < 0.05 and p > 0.05 indicated significance and insignificance, respectively. At the same time, based on the non-parametric test method (Mann–Kendall test), the confidence interval at the 0.05 level is used to detect the breakpoint of the NDVI time series.

2.3.2. Correlation Analysis

Correlation analysis was used to analyze the relationship between the various elements. In this study, this method takes the NDVI as the dependent variable and climatic factors (temperature, precipitation, and solar radiation) as independent variables to calculate the correlation coefficient (r) between the NDVI and climate variables. The formula for r is as follows:
r = i = 1 n X i X ¯ Y i Y ¯ i = 1 n X i X ¯ 2 i = 1 n Y i Y ¯ 2
where r is the correlation coefficient of the NDVI and climatic factors, X i and Y i are the ith values of two elements, X ¯ and Y ¯ are the averages of the two elements, and n is the time series length (34 years). The closer the value of r is to 1 or −1, the closer is the relationship between the two groups of elements; the closer the r is to 0, the weaker is the relationship. The significance of the correlation coefficient between different variables was detected by the t test, where p < 0.05 indicated a significant correlation and p > 0.05 indicated an insignificant correlation.

2.3.3. Residuals Analysis

The residual analysis method proposed by Evans and Geerken [57] can distinguish the effect of human factors and climate variables on vegetation change. This method assumes that there is a close relationship between vegetation growth and precipitation; then it obtains the residuals from the difference between the observed and predicted NDVI using climate variables as explanatory factors [58]. Evans and Geerken reported that if there is a significant change in the residual trend, it can be speculated that the NDVI change may result from human activities. On the contrary, if the residuals do not change significantly, NDVI changes can be attributed to climatic factors such as rainfall.
In this study, based on the multiple regression residual analysis method, first, the predicted NDVI (NDVIpre) was calculated according to the relationship between the actual observed NDVI (NDVIobs) and climate factors [51,58]. Then, the difference between the NDVIobs and NDVIpre was calculated to obtain the value of residual NDVI (NDVIres), which was used to represent the impact of human activities on NDVI. The equation used is as follows:
NDVI pre = θ 1 × Tem + θ 2 × Pre + θ 3 × Solar + ε
NDVI res = NDVI obs NDVI pre
where θ1, θ2, θ3, and ε are model parameters; Tem, Pre, and Solar refer to air temperature, precipitation, and solar radiation, respectively. NDVIres is the residual value, NDVIobs is the observed value, and NDVIpre is the predicted value. According to Formula (2), the slopes of NDVIpre and NDVIres are calculated to represent the NDVI affected by climate change and anthropogenic activity, respectively.

3. Results

3.1. Temporal and Spatial Change in the NDVI

Based on the least squares method and the Mann–Kendall test, the annual, seasonal, and monthly variation trends of the NDVI in Argentina from 1982 to 2015 were calculated, respectively (Figure 3). As shown in Figure 3a, the annual NDVI in Argentina showed a significant downward trend with a change rate of −0.005/decade (p < 0.05). In the period 1982–2015, the UF and UB lines intersect in 2008 (Figure 3c), and the NDVI decreased slowly before 2008. The maximum mean value appeared in 1998 (0.41), and the minimum mean value appeared in 2009 (0.35), indicating that the vegetation in Argentina suffered serious losses in 2009. After 2009, the NDVI gradually increased but was at a low-value period. Similarly, the monthly NDVI in Argentina significantly decreased (p < 0.05) over the past 34 years. Before 2008, the monthly NDVI changes were relatively stable, most of the NDVI value was between 0.33 and 0.44. However, after 2008, the NDVI began to fluctuate with obvious ups and downs. On a seasonal scale (Figure 3d), the NDVI in spring and winter exhibited a downward trend (p < 0.05), while in summer and autumn, the NDVI decreased slightly (p > 0.05). These results indicated that in the past 34 years, the vegetation coverage in Argentina has reduced.
Based on the least squares method, according to Formula (2), the changing trend of NDVI in Argentina over the past 34 years was calculated with time as the independent variable and NDVI as the dependent variable. The trend of the annual NDVI in Argentina had pronounced spatial heterogeneity over the past 34 years (1982–2015), ranging from −1.75 to 0.69/decade (Figure 4b). In general, the area with a declining NDVI trend accounted for 71.38%, which was larger than the area with a rising trend, mainly in Patagonia, eastern NWA, western NEA, and northern Pampas. The vegetation in the eastern NWA and western NEA was widely distributed (0.45 < NDVI < 0.75) (Figure 4a), the NDVI decreased significantly during the study period (p < 0.05), with the change rate as low as −1.75/decade. In most areas of northern Pampas (0.45 < NDVI < 0.75), the NDVI decreased at a rate of less than −0.02/decade, while the NDVI in southern Pampas increased slightly. The NDVI in Patagonia (0.15 < NDVI < 0.30) declined significantly (p < 0.05) with a slight change rate. The regions with an upward trend of the NDVI (28.62%) were mainly distributed in western NWA, eastern NEA, Cuyo, and southern Pampas. The relative change in the 34-year NDVI trend in Argentina based on the NDVI in 1982 was also calculated (Supplemental Figure S1). The area where NDVI decreased by 0–25% in Argentina is the largest, accounting for 41.62% of the study area, mainly distributed in Pampas, eastern NWA, and western NEA; followed by areas with 25–50% NDVI reduction, accounting for 24.03% of the total area, concentrated in Patagonia; the areas with 50–75% and 75–100% NDVI reductions were relatively few, accounting for 5.19% and 0.84% of the study area, respectively. The areas with NDVI increases of 0–25%, 25–50%, 50–75%, and 75–100% in Argentina accounted for 21.93%, 5.03%, 1.01%, and 0.33% of the total area, respectively. It can be seen that the NDVI in Argentina showed a significant decreasing trend in the whole 34 years, and the change was relatively small. The decreasing regions were mainly distributed in Pampas, eastern NWA, western NEA, and Patagonia.
Furthermore, several typical pixels were randomly selected based on the different NDVI changing slopes and calculated their time series (Figure 5). The results showed that sample (a) in western NWA showed a slowly increasing trend in the past 34 years, during 1995–2000 and 2010–2015, NDVI continued to increase yearly. Before 2008, the NDVI change in sample (b) in eastern NWA was relatively stable with a downward trend (p < 0.05); after 2008, NDVI began to fluctuate severely. In Cuyo, the NDVI of sample (c) increased slightly on the whole (p > 0.05), but in 1992–1996 and 2010–2013, NDVI continued to decline. In Patagonia’s sample (d), the NDVI exhibited a significant downward trend and continued to decline in the four years after 2004 and 2010, respectively; during the period from 1982 to 2015, the NDVI of sample (e) decreased (p > 0.05) with obvious fluctuations. The NDVI of sample (f) showed a significant downward trend, during the 2006–2011 period, the NDVI changed like a “V” shape, and the NDVI increased sharply after 2009. In Pampas, the NDVI of sample (g) decreased significantly in the past 34 years (p < 0.05), and during 2005–2010, NDVI first decreased and then continued to increase; the NDVI of sample (h) increased slowly (p > 0.05), and the NDVI continued to increase during the periods of 2000–2005 and 2011–2014. The NDVI in sample (i) decreased significantly, the NDVI continued to decline during 1996–2002, and the downward trend of the NDVI has obvious ups and downs after 2002. The above nine samples all showed that the change range of the NDVI in Argentina had become significantly larger between 2000 and 2015, particularly around 2009. These results indicated that the temporal and spatial variation in vegetation in Argentina all exhibited a significant downward trend, mainly distributed in densely vegetated areas, whereas the changes in sparsely vegetated areas were small.

3.2. Correlation Analysis between the NDVI and Climatic Factors

The correlation coefficient (r) between NDVI and climate factors was calculated to clarify the interaction between vegetation and climate variation. In Pampas, NEA, Cuyo, NWA, and western Patagonia, the NDVI was significantly positively correlated with temperature (p < 0.05), accounting for 73.09% of the entire study area; the areas with a significant negative correlation between the NDVI and temperature were mainly distributed in eastern Patagonia (Figure 6a,b). As shown in Figure 6c,d, the areas with a significant positive correlation between the NDVI and precipitation were mainly distributed in Pampas, NEA, NWA, and eastern Cuyo (64.02%), and the areas where the NDVI was negatively correlated with precipitation were mainly in western Patagonia (p < 0.05). The correlation between the NDVI and solar radiation was similar to that between the NDVI and temperature (Figure 6e,f). The solar radiation in other regions of the study area was positively correlated with the NDVI (73.27%), except for the area in eastern Patagonia, which was negatively correlated with the NDVI (p < 0.05). It can be seen from Figure 5 that a small corporation of the NDVI had no significant correlation with temperature and solar radiation, and less than 20% of the NDVI was insignificantly correlated with precipitation. In general, there was a strong correlation between the NDVI and climatic factors. The positive correlation was primarily distributed in subtropical regions, whereas the arid and semi-arid regions were mainly negatively correlated.

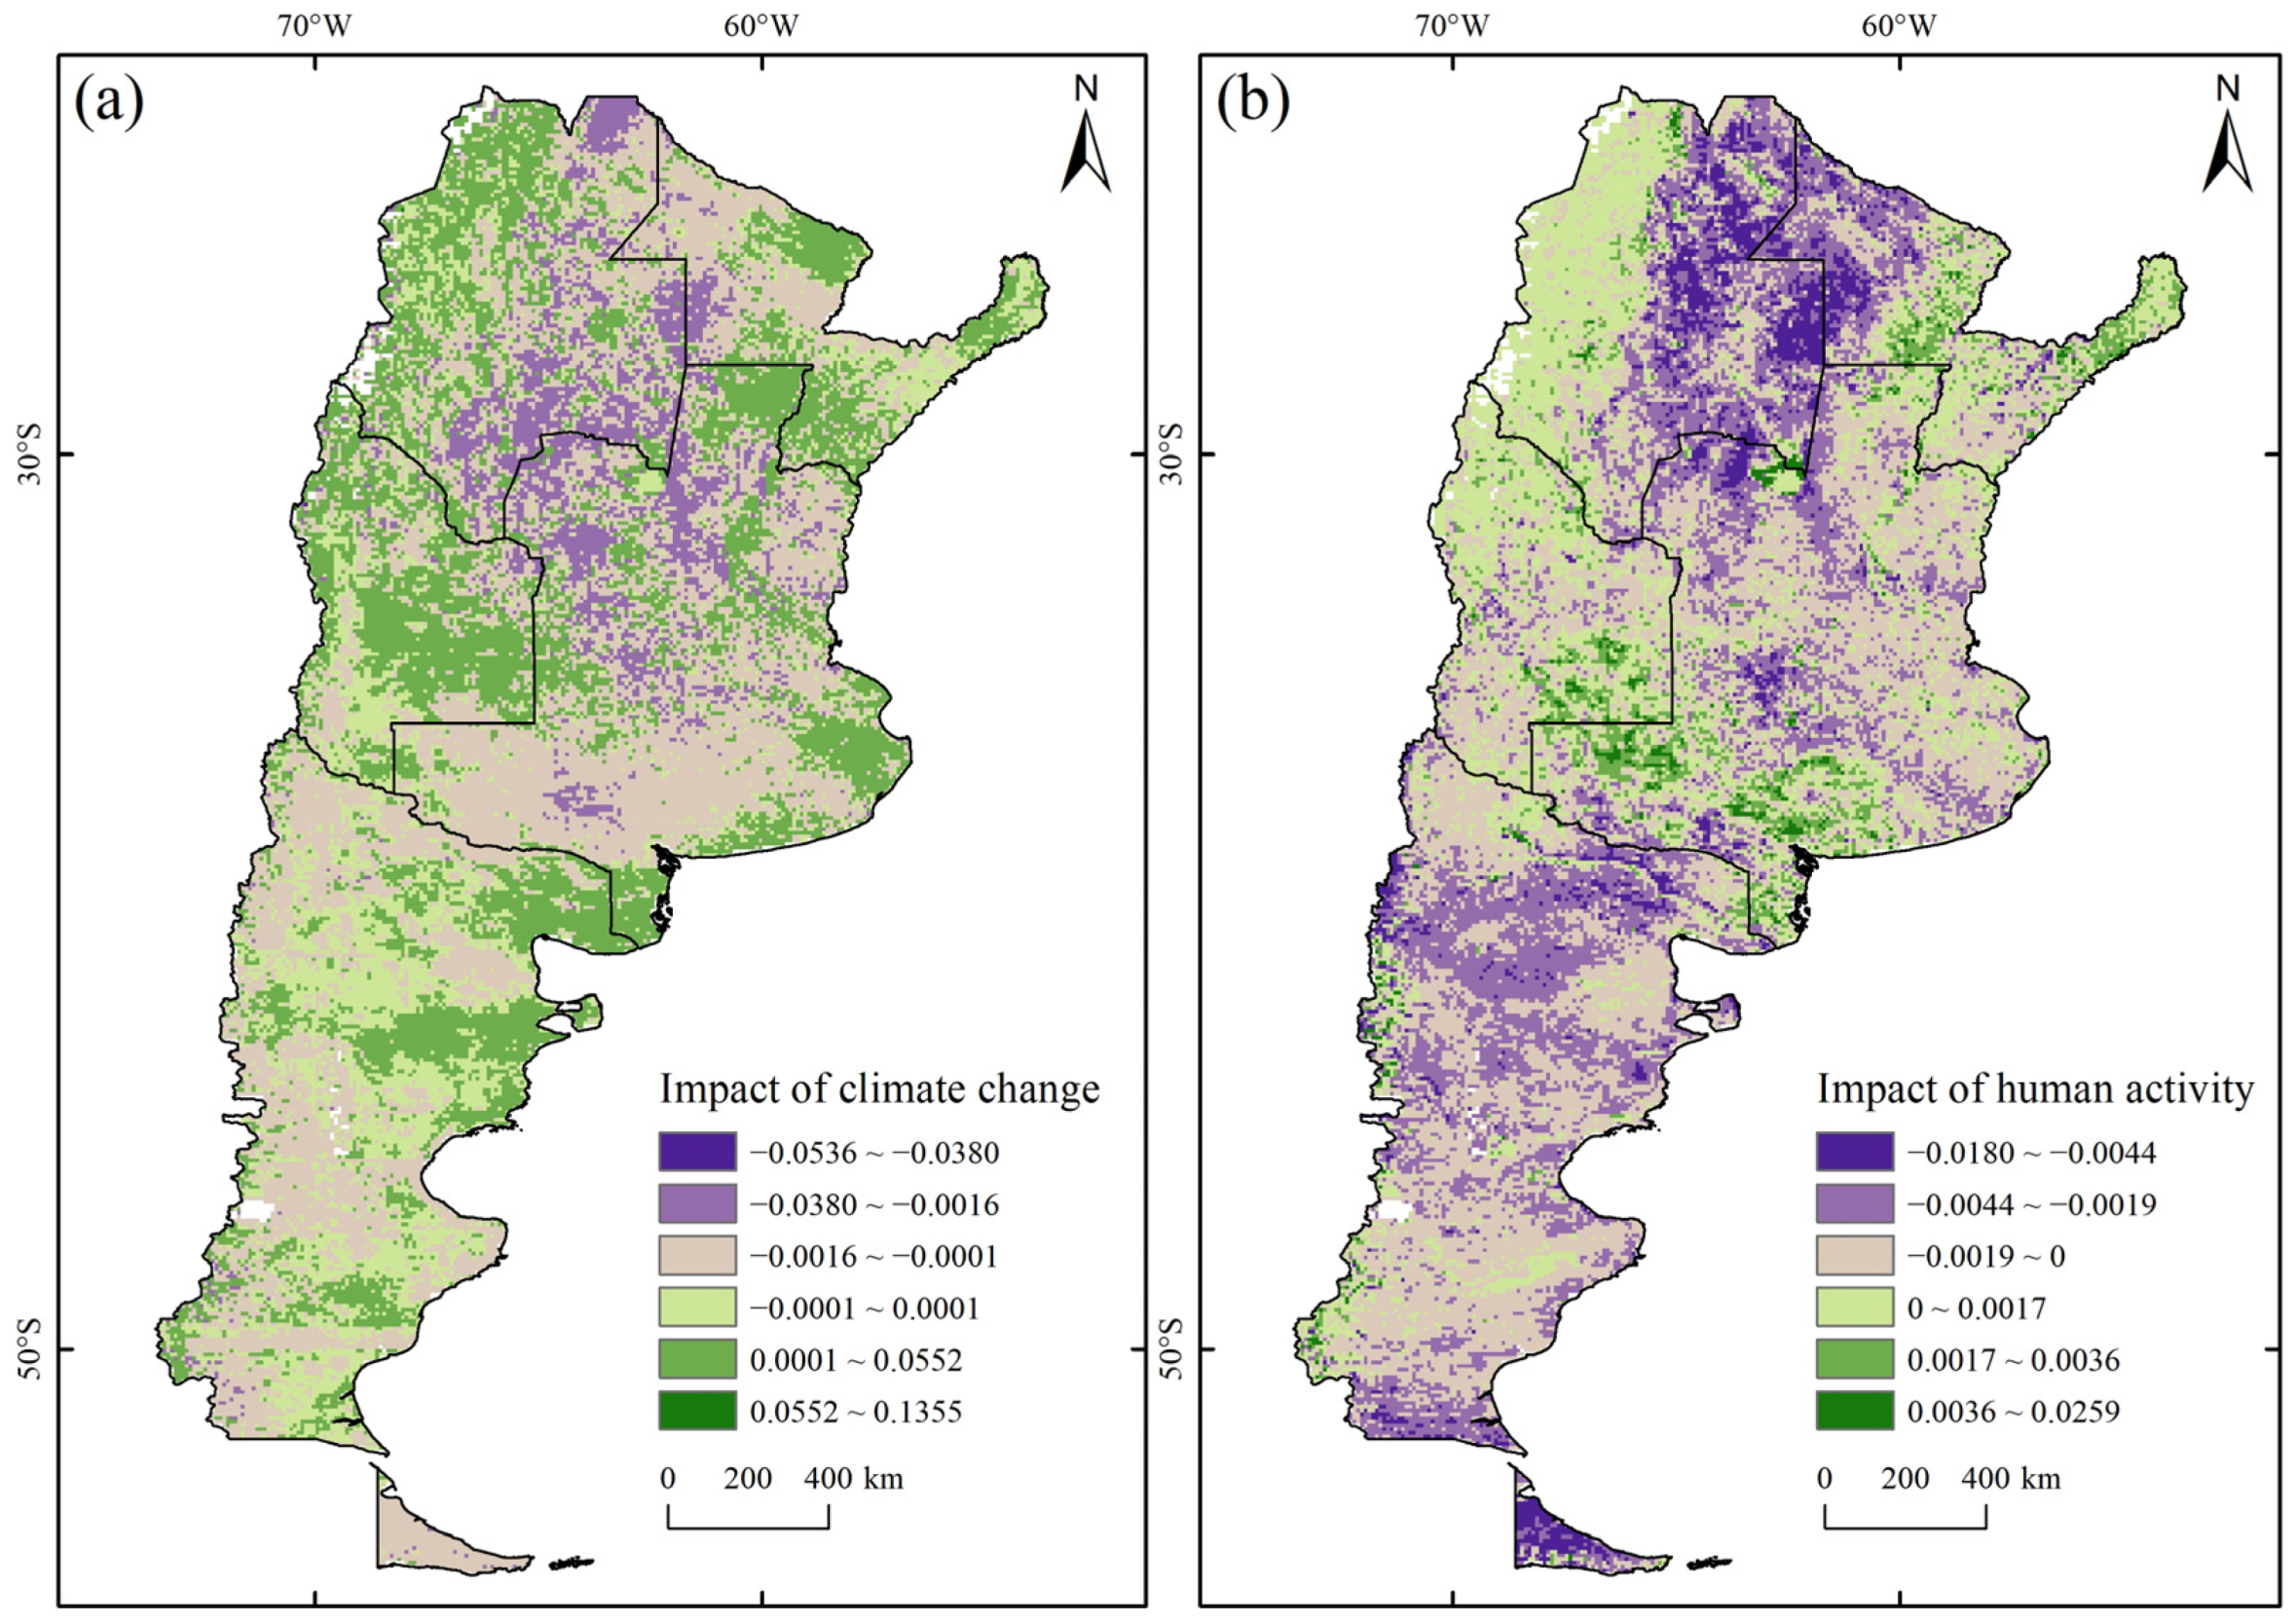
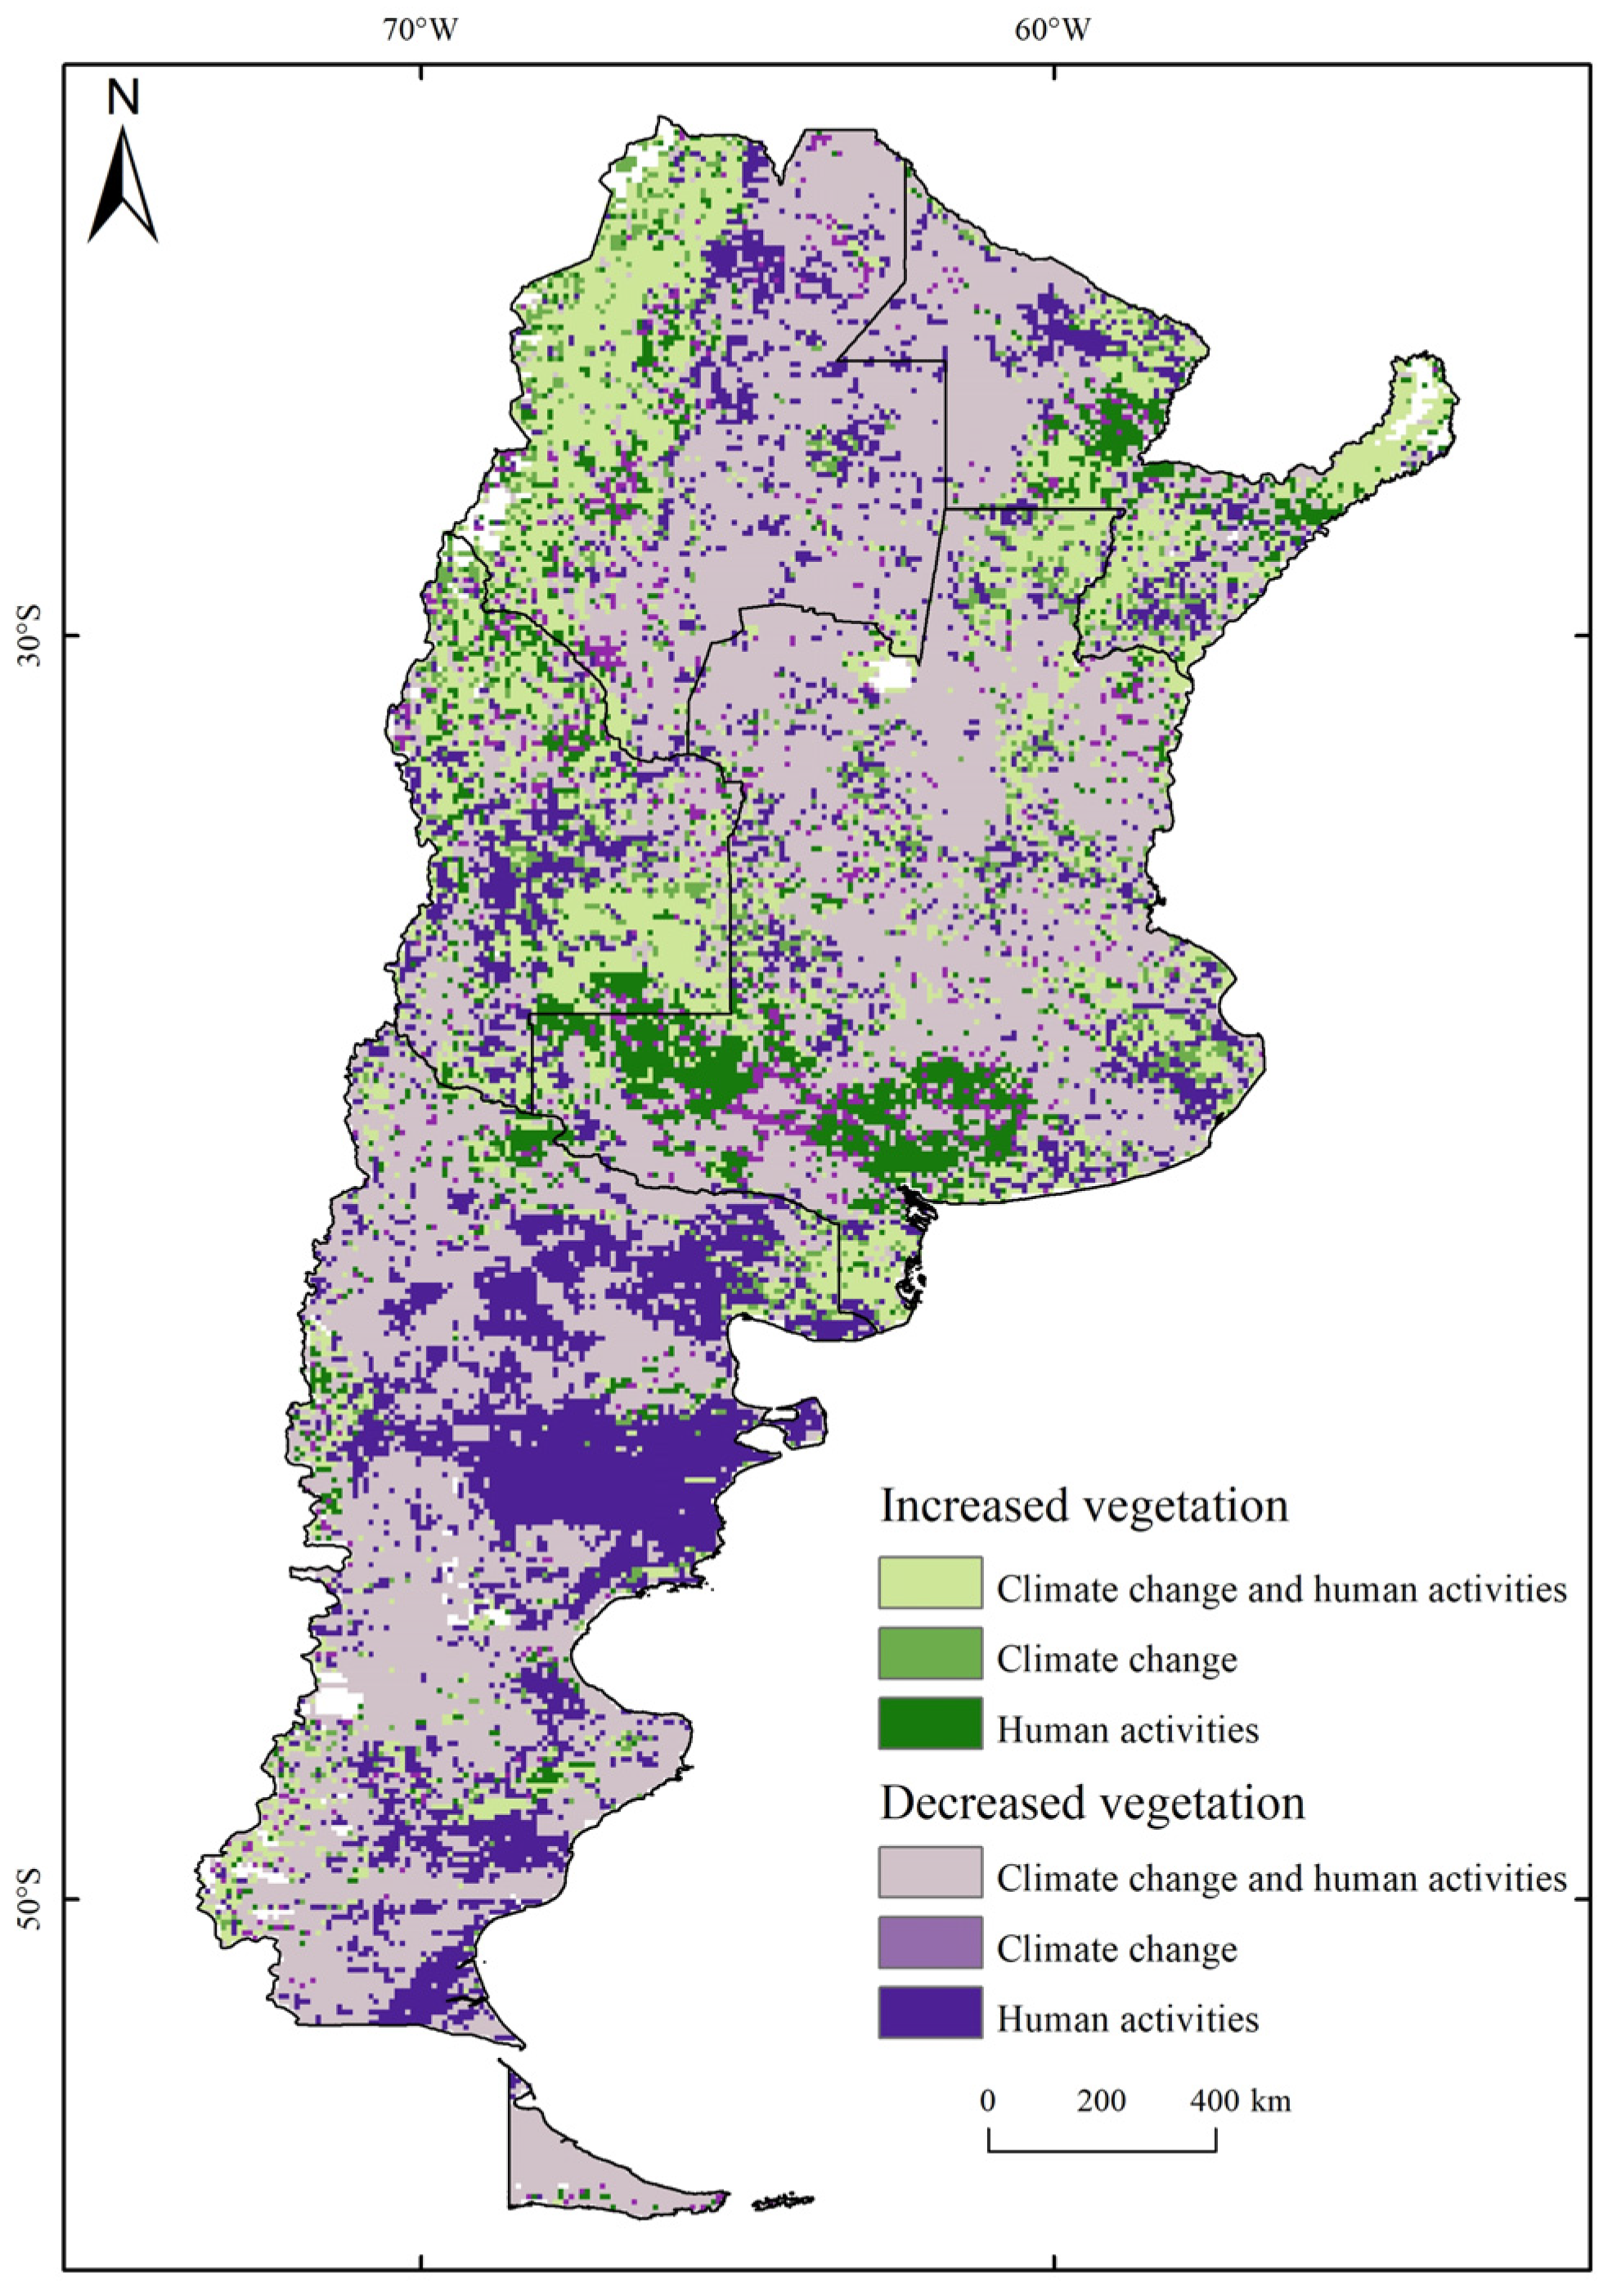
3.3. Residual Analysis

A multiple regression residual analysis was used to assess the effect of climate change and anthropogenic activity on vegetation growth. During the study period, the slope of the NDVIpre in Argentina ranged from −0.54 to 1.36/decade and showed an overall decreasing trend (60.37%), mainly distributed in western Patagonia, western NEA, eastern NWA, and Pampas. In contrast, the areas showing an upward trend were less than 40%, concentrated in Cuyo, western NWA, eastern NEA, and eastern Patagonia (Figure 7a).
Under the influence of human activity, the slope of the NDVIres in Argentina varied from −0.18 to 0.26/decade, with a slight upward trend (27.49%) in western NWA, eastern NEA, southern Pampas, and Cuyo (Figure 7b). The residual NDVI in eastern NWA, western NEA, Patagonia, and northern Pampas showed a downward trend, accounting for 72.51% of the total area. These results indicated that climate change and anthropogenic activity had a dual effect on Argentine vegetation growth.
In this study, the relative contribution rates [59] were calculated to represent the drivers of NDVI changes. Figure 8 indicates that the region in which climatic factors and human activities jointly drove the increase in the NDVI was small (17.33%), mainly in western NWA, eastern NEA, and Cuyo. The contribution rate of the increased NDVI driven by climatic factors alone accounted for 13.57% with a scattered distribution; the contribution rate of the increased NDVI driven by human activities alone was 25.28%, distributed in southern Pampas. Approximately 50% of the study area indicated that climate change and anthropogenic activity jointly caused the NDVI reduction, concentrated in eastern NWA, western NEA, Pampas, and Patagonia. Among them, the decreased NDVI barely driven by climate factors was less than 5%, whereas the NDVI reduction driven by human activities alone was as high as 26%, mainly in central Patagonia. Overall, the joint effect of climate change and human activity was the main reason for the vegetation change in Argentina in the past 34 years.

4. Discussion

4.1. Impact of Climate Change on the NDVI

The results of the study showed that from 1982 to 2015, NDVI in Argentina showed a significant downward trend both in time and space (Figure 3 and Figure 4), consistent with Fensholt and Proud [60] and Liu et al. [61]. Fensholt and Proud compared the NDVI datasets from two different sensor systems in terms of linear regression and trend analysis. Both the GIMMS3g and MODIS NDVI datasets showed significant declining trends in vegetation in Argentina. Liu et al. explored the spatiotemporal variation pattern of the global NDVI from 1982 to 2012, also showing a browning trend in Argentina’s NDVI. These results all indicated that the NDVI in Argentina has decreased in recent decades. Against the background of global warming, most regional vegetation has shown a greening trend, but Argentine vegetation has shown a browning trend. The reasons behind the changes in NDVI are extremely complex, and climate change and human activity are the two main aspects, which are interlinked and affect each other.
Argentina’s geographic features and interactions with the climate determined the effect of global warming on vegetation in the country. Its climatic characteristics were affected by the Andes in the west [41,62], anomalous sea surface temperatures, and El Niño-Southern Oscillation (ENSO) [42]. This study found that the NDVI in Patagonia was negatively correlated with precipitation, particularly on the Andes side (Figure 6c,d), which may have been caused by extreme weather. Abnormal precipitation may lead to floods, resulting in plant roots being unable to breathe and affecting their water and nutrient absorption capacity [7]. The Andes is perpendicular to the direction of atmospheric flow, forming an effective barrier that generates strong orographic uplift and precipitation [63]. Recent studies have shown that extremely wet years in Patagonia are more frequent than extremely dry years [64]. The NDVI in other regions of Argentina was positively correlated with precipitation, which was attributed to increased rainfall. Seasonal water scarcity is a common environmental forcing factor affecting plant growth [6], the results of this study also showed that the NDVI values in winter and spring in Argentina were lower than those in summer and autumn over the past 34 years (Figure 3d). Both transpiration and photosynthesis of plants require water [3]. Insufficient water supply or too much water affects the absorption of water by plant roots and inhibits vegetation growth [7]. Water resources are limited in winter and spring and the soil moisture content is insufficient [65], causing a slowdown in plant growth. Rainfall increased in summer and autumn, depleted soil moisture was supplied, and plant photosynthetic rate and transpiration gradually returned to normal [66], improving vegetation coverage. Posse et al. also reported similar conclusions. In Pampas, although the positive effect of precipitation on NDVI was delayed, in summer, precipitation was positively correlated with NDVI, which was beneficial to the increase in NDVI [67]. It can be seen that sufficient precipitation is conducive to the growth of vegetation in subtropical regions.
This study found a breakpoint in 2008, and the minimum mean value of the NDVI occurred in 2009 (Figure 3a,c), which was possibly the consequence of vegetation change caused by drought. Studies have shown that there was a close relationship between vegetation growth and drought events [68,69]. Under the influence of extreme drought events, forests in Dry Chaco were apparently disturbed [65]. Most of the most persistent drought events in the past 100 years (1901–2001) occurred in northern Argentina (NEA, NWA) [70]. This was similar to the results of this study, under the influence of climate change, the vegetation growth of both NWA and NWA was affected (Figure 7). Owing to the long-term drought, the precipitation was below the normal range, causing widespread water shortages and insufficient water supply demand [71], which seriously affected the normal growth of vegetation, leading to vegetation degradation and even death. Previous research has illustrated that as early as 1998–1999, Patagonia suffered a severe drought event that resulted in a large number of tree deaths [68]. It can be seen that the forest ecosystem in this area is fragile and sensitive, and is easily affected by climate disturbances [16,69]. According to reports, in 2008, southern South America experienced the largest drought in intensity and extent in 50 years, seriously affecting forest growth and crop planting in Argentina [33]. Patagonia experienced a prolonged drought from 2008 to 2013 [46], owing to the decreased rainfall and reduced soil moisture content, unable to meet the water supply needs of vegetation, resulting in a decline in vegetation cover in the region.
The area where the NDVI is negatively correlated with solar radiation and negatively correlated with temperature is mainly in eastern Patagonia (Figure 6a,e). Light energy directly affects the formation of chlorophyll and the photosynthesis of plants [1,72,73]. In sunny weather, as a consequence of the few and thin clouds, the weakening effect of the atmosphere on solar radiation is weak, and the solar radiation reaching the ground is strong, causing the surface temperature to rise [44,74]. Rising temperatures and dry air accelerate vegetation respiration and surface evaporation [75], leading to a lack of soil moisture and reducing the net productivity of vegetation [76], which is not conducive to plant growth and development. Studies have found that above-average temperatures and low precipitation deplete soil moisture, which in turn inhibits vegetation growth [69]. Moreover, from 40°S to the southern tip of Argentina, the Andes gradually lower and the prevailing westerlies become drier with little precipitation [77]. Dry weather patterns with little rainfall may increase the risk of forest fires, further increasing tree mortality and resulting in sparse forest vegetation [7,78]. It can be seen that the rising temperature is not conducive to the growth of vegetation in this area. These results indicated that climate-driven drought was a major cause of the decrease in vegetation coverage in this region. While in Pampas, NEA, NWA, and Cuyo, located in a subtropical climate zone, the NDVI was positively correlated with solar radiation, and the relationship between temperature and NDVI was also positive. Suitable temperature and sufficient solar radiation can provide advantageous light and heat conditions for vegetation growth, which are beneficial to the photosynthesis and evaporation of plants.

4.2. Impact of Human Activity on the NDVI

Under the condition of climate change mainly characterized by warming, Argentine vegetation did not increase but decreased. In addition to the complex natural conditions, human activities had an effect on the vegetation in Argentina. Argentina is the second largest country in South America, with its economic aggregate and per capita income ranking at the forefront. However, Argentina’s economic development is at the expense of destroying the ecological environment.
The results showed that the NDVI in Pampas decreased slightly (Figure 4), which may be the changes in vegetation caused by farming and pastoral activities. Owing to the increase in soybean yield, many natural grasslands in Pampas have been replaced by soybean farmlands [27]. Changes in agricultural technology and production strategies such as intensification, mechanized tillage, and no-tillage have led to significant variations in animal husbandry and agricultural activities in Pampas [36,79]. Overgrazing can lead to grassland degradation [28], and crop pest management such as pesticides and herbicides may directly lead to vegetation loss [22]. Once the natural grassland is converted into agricultural and pastoral land, the drastic changes in land use over time affects the growth and development of vegetation, and it is difficult to recover the ecological environment of vegetation in a short period. Large-scale intensive production makes the soil surface tend to be compacted and closed [80], increasing the difficulty of surface water replenishment and weakening the water use efficiency of vegetation, thereby inhibiting the production and development of vegetation. This result was in compliance with that reported by David et al. [81]. In their study of the sustainability of the agriculturalization process in the Argentine Pampas, David et al. reported that to develop intensive, specialized, and large-scale agricultural production, a large area of grassland in Pampas has been reclaimed, and the grassland area has been obviously reduced. Agostini et al. also revealed that land use (grazing and soybean cultivation) in Pampas had changed significantly in recent decades, overgrazing and soil compaction from agropastoral activities caused grass cover loss, exacerbating soil exposure and environmental pollution [22]. These studies all demonstrated that agricultural expansion and cattle breeding was responsible for the loss of natural vegetation in the Pampas.
With the expansion of cultivated land, pastures began to move from Pampas to Northwest Argentina [36]. The support of economic policies [79] also promoted the cutting of natural vegetation in eastern NWA and western NEA (Chaco). Chaco forests have been drastically reduced by human activities such as logging, charcoal production, dryland agriculture, and pastoralism [29]. Moreover, with the continuous improvement of technology and the expansion of new international and domestic market conditions, large areas of original tropical dry forests, sparse grasslands, savannas, and shrubs have been replaced by agriculture and cattle breeding [82]. Our results also proved this: under the effect of human activity, the NDVI in eastern NWA and western NEA decreased severely, which was in line with the results of Fehlenberg et al. [25]. They assessed the causes of deforestation in the tropical dry forests of Argentina, Bolivia, and Paraguay using a Panel regression model, and the results indicated that soybean area and production were positively correlated with deforestation, with large areas of forests in the Chaco region of Argentina being directly replaced by soybeans. Song et al. also reported that the area of net tree cover in Argentina lost 113,000 km2 from 1982 to 2016 owing to the expansion of the agricultural frontier [28]. Gimenez et al. also reported that during 2000–2015, Chaco’s natural dry forest area decreased by about 40% due to continued agricultural expansion [29]. The above results demonstrated that the rapid development of agriculture has accelerated the process of deforestation, leading to the decline of the NDVI in eastern NWA and western NEA.
In addition to climatic factors, unreasonable land use also reduces the vegetation in Patagonia. The breeding activities of sheep, cattle, and camels promoted the construction of surrounding buildings, fences, roads, and other infrastructure, accelerating the development of major cities [83]. The hardened road surface and buildings occupied a large amount of land, resulting in vegetation coverage loss. With an increase in population density, the conflict between people and land has become prominent, and the urbanization process has further accelerated vegetation destruction in Patagonia [84]. In addition, long-term grazing has resulted in land degradation in this region, further reducing vegetation productivity. Veron et al. also reported that the above-ground net primary productivity (ANPP) in the Patagonia Andes area decreased significantly owing to desertification [85]. These studies all indicated that both traditional grazing and modernization had a damaging impact on Patagonia’s vegetation. Human activities such as agricultural expansion, overgrazing, and deforestation not only directly affect the ecological functions of forests and increase greenhouse gas emissions [36], but also bring risks of non-point source pollution, land degradation, and soil erosion [22,28,36,80]. It can be seen that human disturbance activities on the land hinders the growth and development of vegetation and cause adverse effects on the ecological environment of vegetation, resulting in the reduction in vegetation.

4.3. Suggestions and Limitations

Under the combined influence of climatic and human factors, Argentine NDVI is undergoing extensive variation, although such variations are negative. Because of climate change, floods, droughts, and extreme weather will become more frequent in the future [35]. Deforestation and land degradation exacerbate the negative effects of climate change [30]. With the expansion and intensification of farmland and cattle ranching, the negative impacts of human intervention on natural vegetation and biodiversity will increase [36]. Land-use change and urbanization have also overstretched Argentine forest ecosystems. The vegetation conditions of areas such as savannas, grasslands, and shrubs can be improved through rotational grazing. Environmental protection policies and deforestation regulations [86] should be issued to prohibit cutting native vegetation. Reasonable land management such as rotational grazing, can improve pasture carrying capacity and forage grass quality. The legal system can increase the public’s awareness of primary forest protection. At the same time, it can increase the total amount of forest resources and improve the quality of forest resources, which is conducive to the sustainable development of forestry. Through the results of this study, more attention can be paid to the change in local vegetation and protection of terrestrial ecological environment, which is beneficial to local sustainable land management and ecosystem stability in the future.
However, this study has some limitations. Three climate factors were selected for the multivariate regression residual analysis to distinguish the impacts of climate change and anthropogenic activity on vegetation. Nevertheless, the growth and development of vegetation are complicated processes. The climate is a factor that changes with time and space. In addition to climate, terrain and altitude [49] are constant factors in time, which also affects the growth and development of vegetation. On the other hand, there is a certain lag effect between vegetation and climatic factors. Vegetation’s response to climate variables differs on a seasonal scale [6]. Ecological engineering and farmland irrigation contribute to the management and restoration of the ecosystem, creating a favorable growth environment for plants, and thereby promoting the increase in vegetation coverage. However, irrational land use and deforestation will destroy the living environment of plants, increase the risk of water and soil pollution, and accelerate vegetation degradation. Therefore, in future studies, the driving mechanism of vegetation variation may need to be combined with additional factors to further refine the differentiation between the climatic and anthropogenic impacts. An analysis of the seasonal change in vegetation and the lag effect of vegetation on climatic factors may also be required.

5. Conclusions

Using the GIMMS NDVI3g dataset and FLDAS climatic data, combined with the linear regression, correlation, and multiple regression residual analysis, this study analyzed the temporal and spatial changes and driving factors of the NDVI in Argentina from 1982 to 2015. We reached the following conclusions:
(1) The vegetation change in Argentina had prominent regional characteristics in space, and the NDVI showed an overall downward trend, with an average change rate of −0.005/decade (p < 0.05). The areas where the NDVI decreased significantly were mainly distributed in western NEA, eastern NWA, Pampas, and Patagonia.
(2) Vegetation in Argentina showed different correlations with temperature, precipitation, and solar radiation. The NDVI in Pampas, NEA, NWA, and Cuyo was positively correlated with the three climatic factors. The NDVI in western Patagonia showed an apparent positive correlation with temperature and solar radiation, whereas the NDVI showed a negative correlation with precipitation.
(3) Variations in vegetation in Argentina are driven by climate change and human activity. Extreme weather and unreasonable land use were the major reasons for the decrease in Patagonian vegetation coverage. On the contrary, climate change favored vegetation growth in Cuyo. Deforestation and farmland expansion were the main drivers of vegetation loss in Pampas, NEA, and NWA.

Supplementary Materials

The following supporting information can be downloaded at: https://www.mdpi.com/article/10.3390/rs15071926/s1, Figure S1: The relative change in the 34-year NDVI trend in Argentina based on the NDVI in 1982.

Author Contributions

The authors’ contributions are as follows: conceptualization, F.W. and W.G.; methodology, Q.L.; software, Q.L.; validation, F.W. and F.J.; formal analysis, F.W. and J.H.; investigation, F.W. and H.C.; resources, Q.L.; data curation, Q.L., M.X. and L.C.; writing—original draft preparation, Q.L.; writing—review and editing, F.W. and W.G.; visualization, Q.L.; supervision, F.W., F.A.R. and E.M.A.; project administration, F.W. and W.G.; funding acquisition, F.W. and W.G. All authors have read and agreed to the published version of the manuscript.

Funding

This work was supported by the National Natural Science Foundation of China [Grant No. 42177344, U2243213], International Partnership Program of the Chinese Academy of Sciences, [Grant No. 16146KYSB20200001], the 111 Project [Grant No. B20052].

Data Availability Statement

Not applicable.

Acknowledgments

We would like to thank the National Aeronautics and Space Administration (NASA) Global Inventory Monitoring and Modeling Study (GIMMS) group for providing GIMMS NDVI3g data, which was downloaded from (https://ecocast.arc.nasa.gov/data/pub/gimms/3g.v1/, accessed on 10 October 2022). The climatic dataset was obtained from Famine Early Warning System Network (FEWS NET) Land Data Assimilation System (FLDAS), downloaded from (https://daac.gsfc.nasa.gov/datasets/FLDAS_NOAH01_C_GL_M_001/summary?keywords=FLDAS_NOAH01_C_GL_M_001, accessed on 12 October 2022).

Conflicts of Interest

The authors declare no conflict of interest.

References

  1. Zhong, F.X.; Xu, X.L.; Li, Z.W.; Zeng, X.M.; Yi, R.Z.; Luo, W.; Zhang, Y.H.; Xu, C.H. Relationships between lithology, topography, soil, and vegetation, and their implications for karst vegetation restoration. Catena 2022, 209, 105831. [Google Scholar] [CrossRef]
  2. Jung, G.; Prange, M.; Schulz, M. Influence of topography on tropical African vegetation coverage. Clim. Dyn. 2016, 46, 2535–2549. [Google Scholar] [CrossRef]
  3. Cieslik, S.; Omasa, K.; Paoletti, E. Why and how terrestrial plants exchange gases with air. Plant Biol. 2009, 11, 24–34. [Google Scholar] [CrossRef]
  4. Tong, X.W.; Brandt, M.; Yue, Y.M.; Horion, S.; Wang, K.L.; De Keersmaecker, W.; Tian, F.; Schurgers, G.; Xiao, X.M.; Luo, Y.Q.; et al. Increased vegetation growth and carbon stock in China karst via ecological engineering. Nat. Sustain. 2018, 1, 44–50. [Google Scholar] [CrossRef]
  5. Chen, S.Y.; Zhang, Y.L.; Wu, Q.L.; Liu, S.H.; Song, C.H.; Xiao, J.F.; Band, L.E.; Vose, J.M. Vegetation structural change and CO2 fertilization more than offset gross primary production decline caused by reduced solar radiation in China. Agric. For. Meteorol. 2021, 296, 108207. [Google Scholar] [CrossRef]
  6. Xu, H.; Wang, X.; Yang, T. Trend shifts in satellite-derived vegetation growth in Central Eurasia, 1982–2013. Sci. Total Environ. 2017, 579, 1658–1674. [Google Scholar] [CrossRef] [PubMed]
  7. Frank, D.; Reichstein, M.; Bahn, M.; Thonicke, K.; Frank, D.; Mahecha, M.D.; Smith, P.; Van der Velde, M.; Vicca, S.; Babst, F.; et al. Effects of climate extremes on the terrestrial carbon cycle: Concepts, processes and potential future impacts. Glob. Chang. Biol. 2015, 21, 2861–2880. [Google Scholar] [CrossRef] [PubMed] [Green Version]
  8. Lara, C.; Saldias, G.S.; Paredes, A.L.; Cazelles, B.; Broitman, B.R. Temporal Variability of MODIS Phenological Indices in the Temperate Rainforest of Northern Patagonia. Remote Sens. 2018, 10, 956. [Google Scholar] [CrossRef] [Green Version]
  9. Zhang, Y.H.; Ye, A.Z. Quantitatively distinguishing the impact of climate change and human activities on vegetation in mainland China with the improved residual method. Gisci. Remote Sens. 2021, 58, 235–260. [Google Scholar] [CrossRef]
  10. Li, Q.; Zhou, D.W. Soil respiration versus vegetation degradation under the influence of three grazing regimes in the Songnen Plain. Land Degrad. Dev. 2018, 29, 2403–2416. [Google Scholar] [CrossRef]
  11. Sampietro-Vattuone, M.M.; Pena-Monne, J.L.; Roldan, J.; Dip, A.B.; Maldonado, M.G.; Lefebvre, M.G.; Vattuone, M.A. Land management and soil degradation evidence during the Late Holocene in Northwest Argentina (La Costa 2-Tafi valley). Catena 2019, 182, 104115. [Google Scholar] [CrossRef]
  12. Nemani, R.R.; Keeling, C.D.; Hashimoto, H.; Jolly, W.M.; Piper, S.C.; Tucker, C.J.; Myneni, R.B.; Running, S.W. Climate-driven increases in global terrestrial net primary production from 1982 to 1999. Science 2003, 300, 1560–1563. [Google Scholar] [CrossRef] [Green Version]
  13. Lamchin, M.; Lee, W.K.; Jeon, S.W.; Wang, S.; Lim, C.H.; Song, C.; Sung, M. Long-term trend and correlation between vegetation greenness and climate variables in Asia based on satellite data. Sci. Total Environ. 2018, 618, 1089–1095. [Google Scholar] [CrossRef] [PubMed]
  14. Liu, Y.; Li, L.H.; Chen, X.; Zhang, R.; Yang, J.M. Temporal-spatial variations and influencing factors of vegetation cover in Xinjiang from 1982 to 2013 based on GIMMS-NDVI3g. Glob. Planet. Chang. 2018, 169, 145–155. [Google Scholar] [CrossRef]
  15. Gaitan, J.J.; Bran, D.; Oliva, G.; Maestre, F.T.; Aguiar, M.R.; Jobbagy, E.; Buono, G.; Ferrante, D.; Nakamatsu, V.; Ciari, G.; et al. Plant species richness and shrub cover attenuate drought effects on ecosystem functioning across Patagonian rangelands. Biol. Lett. 2014, 10, 20140673. [Google Scholar] [CrossRef] [Green Version]
  16. Olivares-Contreras, V.A.; Mattar, C.; Gutierrez, A.G.; Jimenez, J.C. Warming trends in Patagonian subantartic forest. Int. J. Appl. Earth Obs. Geoinf. 2019, 76, 51–65. [Google Scholar] [CrossRef]
  17. Wang, H.S.; Liu, D.S.; Lin, H.; Montenegro, A.; Zhu, X.L. NDVI and vegetation phenology dynamics under the influence of sunshine duration on the Tibetan plateau. Int. J. Climatol. 2015, 35, 687–698. [Google Scholar] [CrossRef]
  18. Sun, R.; Chen, S.H.; Su, H.B. Climate Dynamics of the Spatiotemporal Changes of Vegetation NDVI in Northern China from 1982 to 2015. Remote Sens. 2021, 13, 187. [Google Scholar] [CrossRef]
  19. Cho, J.; Yeh, P.; Lee, Y.W.; Kim, H.; Oki, T.; Kanae, S.; Kim, W.; Otsuki, K. A study on the relationship between Atlantic sea surface temperature and Amazonian greenness. Ecol. Inform. 2010, 5, 367–378. [Google Scholar] [CrossRef]
  20. Hashimoto, H.; Melton, F.; Ichii, K.; Milesi, C.; Wang, W.L.; Nemani, R.R. Evaluating the impacts of climate and elevated carbon dioxide on tropical rainforests of the western Amazon basin using ecosystem models and satellite data. Glob. Chang. Biol. 2010, 16, 255–271. [Google Scholar] [CrossRef]
  21. Volante, J.N.; Alcaraz-Segura, D.; Mosciaro, M.J.; Viglizzo, E.F.; Paruelo, J.M. Ecosystem functional changes associated with land clearing in NW Argentina. Agric. Ecosyst. Environ. 2012, 154, 12–22. [Google Scholar] [CrossRef]
  22. Agostini, G.; Deutsch, C.; Bilenca, D.N. Differential responses of anuran assemblages to land use in agroecosystems of central Argentina. Agric. Ecosyst. Environ. 2021, 311, 107323. [Google Scholar] [CrossRef]
  23. Wang, Z.Y.; Xu, D.Y.; Yang, H.; Ding, X.; Li, D.J. Impacts of climate change and human activities on vegetation dynamics in Inner Mongolia, 1981–2010. Prog. Geogr. 2017, 36, 1025–1032. [Google Scholar] [CrossRef]
  24. Liu, Z.J.; Liu, Y.S.; Li, Y.R. Anthropogenic contributions dominate trends of vegetation cover change over the farming-pastoral ecotone of northern China. Ecol. Indic. 2018, 95, 370–378. [Google Scholar] [CrossRef]
  25. Fehlenberg, V.; Baumann, M.; Gasparri, N.I.; Piquer-Rodrigu, M.; Gavier-Pizarro, G.; Kuemmerle, T. The role of soybean production as an underlying driver of deforestation in the South American Chaco. Glob. Environ. Chang.-Hum. Policy Dimens. 2017, 45, 24–34. [Google Scholar] [CrossRef]
  26. Jiang, L.L.; Jiapaer, G.; Bao, A.M.; Guo, H.; Ndayisaba, F. Vegetation dynamics and responses to climate change and human activities in Central Asia. Sci. Total Environ. 2017, 599, 967–980. [Google Scholar] [CrossRef] [PubMed]
  27. Bert, F.E.; Podesta, G.P.; Rovere, S.L.; Menendez, A.N.; North, M.; Tatara, E.; Laciana, C.E.; Weber, E.; Toranzo, F.R. An agent based model to simulate structural and land use changes in agricultural systems of the argentine pampas. Ecol. Model. 2011, 222, 3486–3499. [Google Scholar] [CrossRef]
  28. Song, X.P.; Hansen, M.C.; Stehman, S.V.; Potapov, P.V.; Tyukavina, A.; Vermote, E.F.; Townshend, J.R. Global land change from 1982 to 2016. Nature 2018, 560, 639. [Google Scholar] [CrossRef]
  29. Gimenez, R.; Mercau, J.L.; Bert, F.E.; Kuppel, S.; Baldi, G.; Houspanossian, J.; Magliano, P.N.; Jobbagy, E.G. Hydrological and productive impacts of recent land-use and land-cover changes in the semiarid Chaco: Understanding novel water excess in water scarce farmlands. Ecohydrology 2020, 13, e2243. [Google Scholar] [CrossRef]
  30. Castellanos, E.; Lemos, M.F.; Astigarraga, L.; Chacón, N.; Cuvi, N.; Huggel, C.; Miranda, L.; Vale, M.M.; Ometto, J.P.; Peri, P.L.; et al. Central and South America. In Climate Change 2022: Impacts, Adaptation and Vulnerability. Contribution of Working Group II to the Sixth Assessment Report of the Intergovernmental Panel on Climate Change; Cambridge University Press: Cambridge, UK; New York, NY, USA, 2022; pp. 1689–1816. [Google Scholar]
  31. Salvia, M.M.; Sanchez, N.; Piles, M.; Ruscica, R.; Gonzalez-Zamora, A.; Roitberg, E.; Martinez-Fernandez, J. The Added-Value of Remotely-Sensed Soil Moisture Data for Agricultural Drought Detection in Argentina. IEEE J. Sel. Top. Appl. Earth Observ. Remote Sens. 2021, 14, 6487–6500. [Google Scholar] [CrossRef]
  32. Rivera, J.A.; Araneo, D.C.; Penalba, O.C. Threshold level approach for streamflow drought analysis in the Central Andes of Argentina: A climatological assessment. Hydrol. Sci. J. 2017, 62, 1949–1964. [Google Scholar] [CrossRef]
  33. Muller, O.V.; Berbery, E.H.; Alcaraz-Segura, D.; Ek, M.B. Regional model simulations of the 2008 drought in southern South America using a consistent set of land surface properties (vol 27, pg 6754, 2014). J. Clim. 2015, 28, 7914–7915. [Google Scholar] [CrossRef]
  34. Solano-Hernandez, A.; Bruzzone, O.; Groot, J.; Laborda, L.; Martínez, A.; Tittonell, P.; Easdale, M.H. Convergence between satellite information and farmers’ perception of drought in rangelands of North-West Patagonia, Argentina. Land Use Policy 2020, 97, 104726. [Google Scholar] [CrossRef]
  35. Gulizia, C.; Pirotte, M.N. Characterization of simulated extreme El Nino events and projected impacts on South American climate extremes by a set of Coupled Model Intercomparison Project Phase 5 global climate models. Int. J. Climatol. 2022, 42, 48–62. [Google Scholar] [CrossRef]
  36. Viglizzo, E.F.; Frank, F.C.; Carreno, L.V.; Jobbagy, E.G.; Pereyra, H.; Clatt, J.; Pincen, D.; Ricard, M.F. Ecological and environmental footprint of 50 years of agricultural expansion in Argentina. Glob. Chang. Biol. 2011, 17, 959–973. [Google Scholar] [CrossRef]
  37. Baumann, M.; Gasparri, I.; Piquer-Rodrguez, M.; Pizarro, G.G.; Griffiths, P.; Hostert, P.; Kuemmerle, T. Carbon emissions from agricultural expansion and intensification in the Chaco. Glob. Chang. Biol. 2017, 23, 1902–1916. [Google Scholar] [CrossRef]
  38. Hashimoto, H.; Wang, W.L.; Dungan, J.L.; Li, S.; Michaelis, A.R.; Takenaka, H.; Higuchi, A.; Myneni, R.B.; Nemani, R.R. New generation geostationary satellite observations support seasonality in greenness of the Amazon evergreen forests. Nat. Commun. 2021, 12, 684. [Google Scholar] [CrossRef]
  39. Erasmi, S.; Schucknecht, A.; Barbosa, M.P.; Matschullat, J. Vegetation Greenness in Northeastern Brazil and Its Relation to ENSO Warm Events. Remote Sens. 2014, 6, 3041–3058. [Google Scholar] [CrossRef] [Green Version]
  40. Bianchi, E.; Villalba, R.; Solarte, A. NDVI Spatio-temporal Patterns and Climatic Controls Over Northern Patagonia. Ecosystems 2020, 23, 84–97. [Google Scholar] [CrossRef]
  41. Viale, M.; Garreaud, R. Orographic effects of the subtropical and extratropical Andes on upwind precipitating clouds. J. Geophys. Res.-Atmos. 2015, 120, 4962–4974. [Google Scholar] [CrossRef]
  42. Loikith, P.C.; Detzer, J.; Mechoso, C.R.; Lee, H.; Barkhordarian, A. The Influence of Recurrent Modes of Climate Variability on the Occurrence of Monthly Temperature Extremes Over South America. J. Geophys. Res.-Atmos. 2017, 122, 10524–10538. [Google Scholar] [CrossRef] [Green Version]
  43. Soudani, K.; Hmimina, G.; Delpierre, N.; Pontailler, J.Y.; Aubinet, M.; Bonal, D.; Caquet, B.; de Grandcourt, A.; Burban, B.; Flechard, C.; et al. Ground-based Network of NDVI measurements for tracking temporal dynamics of canopy structure and vegetation phenology in different biomes. Remote Sens. Environ. 2012, 123, 234–245. [Google Scholar] [CrossRef]
  44. Cristiano, P.M.; Madanes, N.; Campanello, P.I.; di Francescantonio, D.; Rodriguez, S.A.; Zhang, Y.J.; Carrasco, L.O.; Goldstein, G. High NDVI and Potential Canopy Photosynthesis of South American Subtropical Forests despite Seasonal Changes in Leaf Area Index and Air Temperature. Forests 2014, 5, 287–308. [Google Scholar] [CrossRef] [Green Version]
  45. Singh, P.; Javeed, O. NDVI Based Assessment of Land Cover Changes Using Remote Sensing and GIS (A case study of Srinagar district, Kashmir). Sustain. Agri Food Environ. Res. 2021, 9, 491–504. [Google Scholar] [CrossRef]
  46. Easdale, M.H.; Farina, C.; Hara, S.; Leon, N.P.; Umana, F.; Tittonell, P.; Bruzzone, O. Trend-cycles of vegetation dynamics as a tool for land degradation assessment and monitoring. Ecol. Indic. 2019, 107, 105545. [Google Scholar] [CrossRef]
  47. Pettorelli, N.; Vik, J.O.; Mysterud, A.; Gaillard, J.M.; Tucker, C.J.; Stenseth, N.C. Using the satellite-derived NDVI to assess ecological responses to environmental change. Trends Ecol. Evol. 2005, 20, 503–510. [Google Scholar] [CrossRef] [PubMed]
  48. Shamsuzzoha, M.; Noguchi, R.; Ahamed, T. Rice Yield Loss Area Assessment from Satellite-derived NDVI after Extreme Climatic Events Using a Fuzzy Approach. Agric. Inf. Res. 2022, 31, 32–46. [Google Scholar] [CrossRef]
  49. Herrmann, S.M.; Didan, K.; Barreto-Munoz, A.; Crimmins, M.A. Divergent responses of vegetation cover in Southwestern US ecosystems to dry and wet years at different elevations. Environ. Res. Lett. 2016, 11, 124005. [Google Scholar] [CrossRef] [Green Version]
  50. Ge, W.Y.; Deng, L.Q.; Wang, F.; Han, J.Q. Quantifying the contributions of human activities and climate change to vegetation net primary productivity dynamics in China from 2001 to 2016. Sci. Total Environ. 2021, 773, 145648. [Google Scholar] [CrossRef]
  51. Ibrahim, Y.Z.; Balzter, H.; Kaduk, J.; Tucker, C.J. Land Degradation Assessment Using Residual Trend Analysis of GIMMS NDVI3g, Soil Moisture and Rainfall in Sub-Saharan West Africa from 1982 to 2012. Remote Sens. 2015, 7, 5471–5494. [Google Scholar] [CrossRef] [Green Version]
  52. Araneda-Cabrera, R.J.; Bermudez, M.; Puertas, J. Benchmarking of drought and climate indices for agricultural drought monitoring in Argentina. Sci. Total Environ. 2021, 790, 148090. [Google Scholar] [CrossRef]
  53. Tian, F.; Fensholt, R.; Verbesselt, J.; Grogan, K.; Horion, S.; Wang, Y.J. Evaluating temporal consistency of long-term global NDVI datasets for trend analysis. Remote Sens. Environ. 2015, 163, 326–340. [Google Scholar] [CrossRef]
  54. Mcnally, A.; Arsenault, K.; Kumar, S.; Shukla, S.; Peterson, P.; Wang, S.G.; Funk, C.; Peters-Lidard, C.D.; Verdin, J.P. Data Descriptor: A land data assimilation system for sub-Saharan Africa food and water security applications. Sci. Data 2017, 4, 170012. [Google Scholar] [CrossRef] [Green Version]
  55. van Leeuwen, W.; Huete, A.R.; Laing, T.W. MODIS vegetation index compositing approach: A prototype with AVHRR data. Remote Sens. Environ. 1999, 69, 264–280. [Google Scholar] [CrossRef]
  56. Zhang, D.J.; Ge, W.Y.; Zhang, Y. Evaluating the vegetation restoration sustainability of ecological projects: A case study of Wuqi County in China. J. Clean. Prod. 2020, 264, 121751. [Google Scholar] [CrossRef]
  57. Evans, J.; Geerken, R. Discrimination between climate and human-induced dryland degradation. J. Arid. Environ. 2004, 57, 535–554. [Google Scholar] [CrossRef]
  58. Wessels, K.J.; van den Bergh, F.; Scholes, R.J. Limits to detectability of land degradation by trend analysis of vegetation index data. Remote Sens. Environ. 2012, 125, 10–22. [Google Scholar] [CrossRef]
  59. Kai, J.; Fei, W.; Jianqiao, H.; Shangyu, S.; Dingwenbin. Contribution of climatic change and human activities to vegetation NDVI change over China during 1982-2015. Acta Geogr. Sin. 2020, 75, 961–974. [Google Scholar] [CrossRef]
  60. Fensholt, R.; Proud, S.R. Evaluation of Earth Observation based global long term vegetation trends-Comparing GIMMS and MODIS global NDVI time series. Remote Sens. Environ. 2012, 119, 131–147. [Google Scholar] [CrossRef]
  61. Liu, Y.; Li, Y.; Li, S.C.; Motesharrei, S. Spatial and Temporal Patterns of Global NDVI Trends: Correlations with Climate and Human Factors. Remote Sens. 2015, 7, 13233–13250. [Google Scholar] [CrossRef] [Green Version]
  62. Rusticucci, M.; Zazulie, N.; Raga, G.B. Regional winter climate of the southern central Andes: Assessing the performance of ERA-Interim for climate studies. J. Geophys. Res.-Atmos. 2014, 119, 8568–8582. [Google Scholar] [CrossRef]
  63. Lenaerts, J.; van den Broeke, M.R.; van Wessem, J.M.; van de Berg, W.J.; van Meijgaard, E.; van Ulft, L.H.; Schaefer, M. Extreme Precipitation and Climate Gradients in Patagonia Revealed by High-Resolution Regional Atmospheric Climate Modeling. J. Clim. 2014, 27, 4607–4621. [Google Scholar] [CrossRef] [Green Version]
  64. Hadad, M.A.; Gonzalez-Reyes, A.; Roig, F.A.; Matskovsky, V.; Cherubini, P. Tree-ring-based hydroclimatic reconstruction for the northwest Argentine Patagonia since 1055 CE and its teleconnection to large-scale atmospheric circulation. Glob. Planet. Chang. 2021, 202, 103496. [Google Scholar] [CrossRef]
  65. De Marzo, T.; Pflugmacher, D.; Baumann, M.; Lambin, E.F.; Gasparri, I.; Kuemmerle, T. Characterizing forest disturbances across the Argentine Dry Chaco based on Landsat time series. Int. J. Appl. Earth Obs. Geoinf. 2021, 98, 102310. [Google Scholar] [CrossRef]
  66. Celleri, C.; Zapperi, G.; Trilla, G.G.; Pratolongo, P. Spatial and temporal patterns of rainfall variability and its relationship with land surface phenology in central east Argentina. Int. J. Climatol. 2018, 38, 3963–3975. [Google Scholar] [CrossRef]
  67. Posse, G.; Oesterheld, M.; Di Bella, C.M. Landscape, soil and meteorological influences on canopy dynamics of northern flooding Pampa grasslands, Argentina. Appl. Veg. Sci. 2005, 8, 49–56. [Google Scholar] [CrossRef]
  68. Suarez, M.L.; Kitzberger, T. Differential effects of climate variability on forest dynamics along a precipitation gradient in northern Patagonia. J. Ecol. 2010, 98, 1023–1034. [Google Scholar] [CrossRef]
  69. Suarez, M.L.; Villalba, R.; Mundo, I.A.; Schroeder, N. Sensitivity of Nothofagus dombeyi tree growth to climate changes along a precipitation gradient in northern Patagonia, Argentina. Trees-Struct. Funct. 2015, 29, 1053–1067. [Google Scholar] [CrossRef]
  70. Minetti, J.L.; Vargas, W.M.; Poblete, A.G.; de la Zerda, L.R.; Acuña, L.R. Regional droughts in southern South America. Theor. Appl. Climatol. 2010, 102, 403–415. [Google Scholar] [CrossRef]
  71. Morales, M.S.; Cook, E.R.; Barichivich, J.; Christie, D.A.; Villalba, R.; Lequesne, C.; Srur, A.M.; Ferrero, M.E.; Gonzalez-Reyes, A.; Couvreux, F.; et al. Six hundred years of South American tree rings reveal an increase in severe hydroclimatic events since mid-20th century. Proc. Natl. Acad. Sci. USA 2020, 117, 16816–16823. [Google Scholar] [CrossRef]
  72. Sellers, P.J. Canopy reflectance, photosynthesis and transpiration. Int. J. Remote Sens. 1985, 6, 1335–1372. [Google Scholar] [CrossRef] [Green Version]
  73. Trilla, G.G.; Pratolongo, P.; Kandus, P.; Beget, M.E.; Di Bella, C.; Marcovecchio, J. Relationship Between Biophysical Parameters and Synthetic Indices Derived from Hyperspectral Field Data in a Salt Marsh from Buenos Aires Province, Argentina. Wetlands 2016, 36, 185–194. [Google Scholar] [CrossRef]
  74. Springer, K.R.; Wang, R.; Gamon, J.A. Parallel Seasonal Patterns of Photosynthesis, Fluorescence, and Reflectance Indices in Boreal Trees. Remote Sens. 2017, 9, 691. [Google Scholar] [CrossRef] [Green Version]
  75. Zhang, K.; Kimball, J.S.; Nemani, R.R.; Running, S.W.; Hong, Y.; Gourley, J.J.; Yu, Z.B. Vegetation Greening and Climate Change Promote Multidecadal Rises of Global Land Evapotranspiration. Sci. Rep. 2015, 5, 15956. [Google Scholar] [CrossRef] [Green Version]
  76. Jiao, K.W.; Gao, J.B.; Wu, S.H.; Hou, W.J. Research progress on the response processes of vegetation activity to climate change. Acta Ecol. Sin. 2018, 38, 2229–2238. [Google Scholar] [CrossRef]
  77. Barros, V.R.; Boninsegna, J.A.; Camilloni, I.A.; Chidiak, M.; Magrin, G.O.; Rusticucci, M. Climate change in Argentina: Trends, projections, impacts and adaptation. Wiley Interdiscip. Rev.-Clim. Chang. 2015, 6, 151–169. [Google Scholar] [CrossRef]
  78. Allen, C.D.; Macalady, A.K.; Chenchouni, H.; Bachelet, D.; Mcdowell, N.; Vennetier, M.; Kitzberger, T.; Rigling, A.; Breshears, D.D.; Hogg, E.H.; et al. A global overview of drought and heat-induced tree mortality reveals emerging climate change risks for forests. For. Ecol. Manag. 2010, 259, 660–684. [Google Scholar] [CrossRef] [Green Version]
  79. Piquer-Rodríguez, M.; Baumann, M.; Butsic, V.; Gasparri, H.I.; Gavier-Pizarro, G.; Volante, J.N.; Müller, D.; Kuemmerle, T. The potential impact of economic policies on future land-use conversions in Argentina. Land Use Policy 2018, 79, 57–67. [Google Scholar] [CrossRef]
  80. Murgida, A.M.; Gonzalez, M.H.; Tiessen, H. Rainfall trends, land use change and adaptation in the Chaco salteo region of Argentina. Reg. Envir. Chang. 2014, 14, 1387–1394. [Google Scholar] [CrossRef]
  81. Manuel-Navarrete, D.; Gallopín, G.C.; Blanco, M.; Díaz-Zorita, M.; Ferraro, D.O.; Herzer, H.; Laterra, P.; Murmis, M.R.; Podestá, G.P.; Rabinovich, J.; et al. Multi-causal and integrated assessment of sustainability: The case of agriculturization in the Argentine Pampas. Environ. Dev. Sustain. 2009, 11, 621–638. [Google Scholar] [CrossRef]
  82. Baldi, G.; Nosetto, M.D.; Aragon, R.; Aversa, F.; Paruelo, J.M.; Jobbagy, E.G. Long-term satellite NDVI data sets: Evaluating their ability to detect ecosystem functional changes in south America. Sensors 2008, 8, 5397–5425. [Google Scholar] [CrossRef] [PubMed] [Green Version]
  83. Mesas, A.; Baldi, R.; Gonzalez, B.A.; Burgi, V.; Chavez, A.; Johnson, W.E.; Marin, J.C. Past and Recent Effects of Livestock Activity on the Genetic Diversity and Population Structure of Native Guanaco Populations of Arid Patagonia. Animals 2021, 11, 1218. [Google Scholar] [CrossRef] [PubMed]
  84. Pou, S.A.; Tumas, N.; Soria, D.S.; Ortiz, P.; Diaz, M.D. Large-scale societal factors and noncommunicable diseases: Urbanization, poverty and mortality spatial patterns in Argentina. Appl. Geogr. 2017, 86, 32–40. [Google Scholar] [CrossRef]
  85. Veron, S.R.; Paruelo, J.M. Desertification alters the response of vegetation to changes in precipitation. J. Appl. Ecol. 2010, 47, 1233–1241. [Google Scholar] [CrossRef] [Green Version]
  86. le Polain De Waroux, Y.; Garrett, R.D.; Heilmayr, R.; Lambin, E.F. Land-use policies and corporate investments in agriculture in the Gran Chaco and Chiquitano. Proc. Natl. Acad. Sci. USA 2016, 113, 4021–4026. [Google Scholar] [CrossRef] [PubMed] [Green Version]
Figure 1. (a) Geographic distribution of the five administrative regions of Argentina. (b) Land cover in Argentina.
Remotesensing 15 01926 g001
Figure 2. (a) Annual average temperature, (b) annual average precipitation, and (c) annual average solar radiation in Argentina from 1982 to 2015.
Remotesensing 15 01926 g002
Figure 3. (a) Annual NDVI time series in Argentina from 1982 to 2015. (b) Monthly NDVI time series in Argentina from 1982 to 2015. (c) Mann–Kendall (M-K) test of the NDVI in Argentina from 1982 to 2015. (d) Seasonal NDVI time series in Argentina from 1982 to 2015.
Remotesensing 15 01926 g003
Figure 4. (a) Average NDVI. (b) NDVI trend in Argentina from 1982 to 2015.
Remotesensing 15 01926 g004
Figure 5. NDVI time series sample at individual pixels in Argentina from 1982 to 2015. (ai) are the time series of selected sample pixels from 1982 to 2015.
Remotesensing 15 01926 g005
Figure 6. (a) Correlation coefficient and (b) significance test of the NDVI and temperature in Argentina from 1982 to 2015. (c) Correlation coefficient and (d) significance test of the NDVI and precipitation in Argentina from 1982 to 2015. (e) Correlation coefficient and (f) significance test of the NDVI and solar radiation in Argentina from 1982 to 2015.
Remotesensing 15 01926 g006
Figure 7. (a) The slope of the predicted NDVI (NDVIpre) in Argentina from 1982 to 2015. (b) The slope of the residual NDVI (NDVIres) in Argentina from 1982 to 2015.
Remotesensing 15 01926 g007
Figure 8. Driving forces of vegetation change in Argentina from 1982 to 2015.
Remotesensing 15 01926 g008
Table 1. Data sources and information.
DatasetVariablesResolution
(Temporal/Spatial)
Temporal SpanURL
GIMMS NDVI3gNDVI15 day/8 kmJuly 1981–December 2015https://ecocast.arc.nasa.gov/data/pub/gimms/3g.v1, accessed on 10 October 2022
FLDASTemperature
Precipitation
Solar radiation
Monthly/0.1°1982–presenthttps://disc.gsfc.nasa.gov, accessed on 12 October 2022
ALOS World 3D-30m (AW3D30)Elevation30 m-https://www.eorc.jaxa.jp/ALOS/en/dataset/aw3d30/aw3d30_e.htm, accessed on 24 September 2022
ESA-CCI
Land cover
-300 m1992–2015http://maps.elie.ucl.ac.be/CCI/viewer/download.php, accessed on 13 March 2023
Disclaimer/Publisher’s Note: The statements, opinions and data contained in all publications are solely those of the individual author(s) and contributor(s) and not of MDPI and/or the editor(s). MDPI and/or the editor(s) disclaim responsibility for any injury to people or property resulting from any ideas, methods, instructions or products referred to in the content.

