Article

Land Surface Greening and CO2 Fertilization More than Offset the Gross Carbon Sequestration Decline Caused by Land Cover Change and the Enhanced Vapour Pressure Deficit in Europe

1
School of Geomatics and Urban Spatial Informatics, Beijing University of Civil Engineering and Architecture, Beijing 100044, China
2
State Key Laboratory of Remote Sensing Science, Aerospace Information Research Institute-Chinese Academy of Sciences and Beijing Normal University, Beijing 100101, China
3
Key Laboratory of Urban Spatial Information, Ministry of Natural Resources of the People’s Republic of China, Beijing University of Civil Engineering and Architecture, Beijing 102616, China
4
Sino-French Institute for Earth System Science, College of Urban and Environmental Sciences, Peking University, Beijing 100091, China
*
Author to whom correspondence should be addressed.
Remote Sens. 2023, 15(5), 1372; https://doi.org/10.3390/rs15051372
Submission received: 6 January 2023 / Revised: 25 February 2023 / Accepted: 27 February 2023 / Published: 28 February 2023

Abstract

:
Satellite observations have revealed strong land surface “greening” (i.e., increases in vegetation greenness or leaf area index (LAI)) in the Northern Hemisphere over the past few decades. European terrestrial ecosystems are a greening hotspot, but how they respond to land surface greening, climate change, CO2 fertilization, land use and land cover change (LULCC) and other factors is unclear. Here, we assessed how these interacting factors might be combined to alter terrestrial gross primary production (GPP) throughout Europe during the period of 2001 to 2016 using a process-based Farquhar GPP model (i.e., FGM). We found a more productive European terrestrial ecosystem and most of the GPP enhancement in Europe was explained by increases in LAI (62%) and atmospheric CO2 concentration (29%). Spatially, the spatial signature of the LAI and GPP trends both suggested widespread (72–73% of the vegetated area) greening phenomena across Europe, among which 23.7% and 13.3% were statistically significant (p < 0.05). The interannual trend of GPP estimated by the FGM (0.55% yr−1) was reasonable compared with other GPP products (0.47% yr−1 to 0.92% yr−1) and the observed LAI increasing rate (0.62% yr−1). FGM factorial simulations suggested that land surface greening (+35.5 Pg C yr−2, p < 0.01), CO2 fertilization (+16.9 Pg C yr−2, p < 0.01), temperature warming (+3.7 Pg C yr−2, p < 0.05), and enhanced downwards solar radiation (+1.2 Pg C yr−2, p > 0.05) contributed to the GPP enhancement, while the enhanced vapour pressure deficit (−5.6 Tg C yr−2, p < 0.01) had significant negative impacts on GPP, especially in 2006 and 2012, when extreme droughts struck south-eastern Europe. Meanwhile, approximately 1.8% of the total area of Europe experienced LULCC from 2001 to 2016 and LULCC exerted a small but significant (−1.3 Tg C yr−2, p < 0.01) impact on GPP due to decreases in the total number of vegetated pixels (−159 pixels yr−1). Although the LULCC effect was negative, the largest increase occurred in forested land (+0.9% of total area). In addition, the increasing trends for the annual mean LAI (0.01 m2 m−2 yr−1, p < 0.001) and total GPP (22.2 Tg C yr−2, p < 0.001) of forests were more significant and higher than those of other vegetation types, suggesting that European forests may continue to play important roles in combating climate change in the future with long-lasting carbon storage potential. These results provide the first systematic quantitative analysis of the driving force of enhanced gross carbon assimilation by European ecosystems by considering variations in leaf physiological traits with environmental adaptations.

1. Introduction

Since the early 1950s, a continuous increase in the atmospheric CO2 concentration has been reported [1]. The rapid release of greenhouse gases into the atmosphere has been associated with global climate warming [2] and anthropogenic climate change. Climate change is rapidly altering the vegetation structure, plant phenology, and carbon uptake of the terrestrial ecosystems [3]. There are serious concerns that sustained global climate change in the European continent may lead to significant impacts on plant distribution, growth and productivity [4]. According to the national reports of the conservation status of species and habits by the EU Habitats Directive [5], 14% of habitats are already under pressure, and 33% of the habitats are projected to be continued threatened by climate change in the near future. Thus, European terrestrial ecosystems are particularly sensitive to climate change and deserve special attention [6]. Thus, a better understanding of the response of carbon dynamics in terrestrial ecosystems across Europe is needed.
Satellite observations have indicated that the Earth has been greening during the past three decades [7,8,9], especially in the middle and high latitudes in the Northern Hemisphere [10,11]. Greening refers to increases in vegetation greenness based on spectral vegetation indices (e.g., the normalized difference vegetation index) or leaf density based on vegetation the leaf area index (LAI). Although identifying the drivers of the observed greening is complicated, recent studies have made advances using model simulation methods. On the global-scale, CO2 fertilization effects explain most of the greening (approximately 70%) [8]. However, there are some differences in the key factors driving the greening phenomenon on a regional scale due to heterogeneous land surfaces impacted by human activities. For example, China and India lead the greening process [6], mainly due to increases in forest area caused by afforestation and increases in farmland due to agricultural intensification, respectively. Thus, land use and land cover change (LULCC) is recognized as the main driver of the observed greening trend [7] and the enhanced terrestrial gross primary production (GPP) in these countries [12]. LULCC is often accompanied by changes in LAI and vegetation structure. Thus, it is difficult to distinguish the contributions of LULCC and LAI to GPP in regions where intense land use and management exist (e.g., China and India).
Europe is among the regions with the largest greening trends, and climate change is the major factor driving land surface greening throughout Europe [8]. Part of the observed greening in northern Europe is due to temperature warming [13], which can prolong the growing season length and allow biochemical and physiological processes to proceed at faster rates [14]. In regions where widespread farmland abandonment has occurred, such as Eastern Europe and southern and central Europe, woody regrowth also contributes to the observed vegetation greening [15]. Compared to India and China, European vegetation cover is relatively high (approximately 97%) and stable without strong correlation between land surface greening and LULCC. Thus, quantifying the driving factors of GPP dynamics in Europe can help us better understand the climate change feedback of the terrestrial ecosystems [7].
GPP is a product of photosynthesis, which is regulated by both environmental factors and biological processes on different temporal and spatial scales. On the leaf-scale, the photosynthetic rate and stomatal conductance can adjust in response to environmental changes within seconds. On the stand scale, individual plants may adjust anatomically to changes in environmental factors due to acclimation and adaptation on longer time scales [16]. Experimental and field evidence has demonstrated that plants adapt to prevailing environmental conditions by reducing stomatal density under drought pressure [17], elevated atmospheric CO2 [18], and low irradiance conditions [19]. Thus, understanding the drivers of changes in GPP is a complex task, but recent studies have made advances using terrestrial biosphere models (TBMs).
TBMs provide a powerful tool to integrate our understanding of ecosystem functioning on site to global scales in response to multiple factors, which can be grouped into three categories: vegetation structure (e.g., land cover and LAI), environmental factors (e.g., atmospheric CO2 concentration and temperature, solar radiation, and soil moisture and fertility), and biophysical parameters (e.g., photosynthetic capacity and stomatal conductance) [12,20,21]. Although the impacts of changes in external factors on GPP have been well studied, the impacts of changes in internal factors on GPP remain poorly understood. For example, the maximum rate of carboxylation at 25 °C (Vcmax) is as a key biophysical parameter determining leaf photosynthetic capacity and largely determines the accuracy of GPP estimated by the photosynthesis model of Farquhar et al. [22]. Although Vcmax varies with space and time [16], it has been widely treated as a constant parameter that varies only with plant functional types (PFTs). TBMs with prescribed PFT-dependent Vcmax values are theoretically inaccurate when simulating the carbon exchange between the terrestrial ecosystem and atmosphere [23]. With advances in remote sensing technology, spatially and temporally continuous global Vcmax datasets have been derived from remote sensing data [24,25,26], providing a new opportunity to better understand the response of European GPP dynamics to multiple external and internal factors.
The main objective of this study was to quantify the spatial and temporal dynamics in GPP across Europe and its drivers using a process-based model with consideration of spatial and temporal variations in Vcmax. We first estimated the long-term trend and spatial distribution of European GPP at a medium spatial resolution and 8-day temporal resolution. Then, we quantified the relative role of different factors on GPP. Specifically, we aimed to answer the following questions: (a) Can the observed greening across Europe result in a proportional increase in GPP? (b) How do land cover change and climate change contribute to European GPP? (c) Is the widespread assumption of Vcmax as a constant likely to affect the magnitude and long-term trend of GPP estimations using the Farquhar model? Exploiting the availability of long-term multisource time series datasets of satellite observations, meteorological factors, and site-level flux observations, we performed a series of model simulations to achieve the above objectives.

2. Materials and Methods

2.1. Model Framework

We developed the Farquhar GPP model (FGM) model [12] to estimate terrestrial ecosystem GPP on a daily time scale using eddy flux tower data from FLUXNET 2015 (https://fluxnet.org/data/fluxnet2015-dataset/, accessed on 19 February 2023) [27] and remotely sensed data [12,28]. Based on the nonlinear response of the leaf photosynthetic rate to solar radiation, leaves in canopies can be separated into two categories: sunlit leaves and shaded leaves. The GPP in the FGM was estimated as the sum of the photosynthesis rate for all sunlit leaves and shaded leaves using the two-leaf model:
GPP = L sunlit + A n shade L shade
where A n sunlit , A n shade , L sunlit , and L shade are the net photosynthesis rate and LAI for sunlit and shaded leaves, respectively.
The FGM model can estimate large-scale GPP with acceptable accuracy. The FGM model was developed based on a site-level model, the Song et al. [29] photosynthetic model, which can precisely simulate the GPP and evapotranspiration (ET) simultaneously by solving the leaf photosynthetic rate using three complex equations: the Fick’s law, the photosynthesis model of Farquhar, von Caemmerer and Berry [22], and the model for stomatal conductance. To calculate GPP more efficiently at a high spatiotemporal resolution on large scales, the FGM incorporates the optimal stomatal theory [30,31] to reduce the computational demand for solving the ratio of the intercellular CO2 concentration ( C i ) and leaf photosynthetic rate. Compared with other models, FGM also considers changes in leaf photosynthetic capacity (Vcmax) with time and space. The theoretical framework [12], model parameters [12], model calibration and validation of the GPP estimated by the FGM for China [12] and Europe [28] can all be found in our previous publications. For more details about how we improved the FGM for estimation of GPP in Europe by considering changes in Vcmax, please refer to our most recent work [28].

2.2. Model Calibration and Validation

Here, the FGM was recalibrated based on eddy flux tower data from FLUXNET2015 obtained at 40 sites in EuroFLUX networks. Given that temporally and spatially continuous global Vcmax maps have been published recently, we recalibrated the FGM using one of these up-to-date datasets. The site-level data were used to calibrate the FGM 500 m GLASS-V5 LAI, and 500 m leaf chlorophyll content-based Vcmax from 2001 to 2016. After data screening [28], a total of 2256 monthly records covering 9 biomes were selected. We randomly split the flux sites and used half of the sites within each biome to calibrate the biome-specific parameter g1, which describes instantaneous water use efficiency in FGM [28] (Table S1). The data collected at reserved sites were used to evaluate the model at the biome and site levels. Overall, the FGM explained 87.5% of the variations in GPP derived from eddy covariance data, with a root mean square error (RMSE) ranging from 0.9 to 2.73 g C m−2 d−1 for different PFTs (Figure S1). The GPP estimated by FGM in China [12] and Europe [28] was comparable to most existing remote sensing-based GPP products. Additional details about model validation against tower-based GPP and other GPP products can be found in previous publications [12,28].
The solid mechanisms of the process-based model, low computational demand, consideration of LULCC and key environmental constraints from temperature, water pressure deficit, and solar radiation, and an improved representation of spatial- and temporal-dynamic Vcmax all make the FGM particularly useful for disentangling the regional climate change impacts on GPP in Europe.

2.3. Multisource Driving Datasets

The multisource remote sensing datasets used to drive the FGM in this study included the 500 m × 500 m yearly land use and land cover data from the MOD12Q1 C6 product (2001–2016) [32], the 500 m × 500 m 8-day LAI data from the GLASS V5 product (2001–2016) [33,34,35], the 500 m × 500 m 8-day clumping index data in 2006 derived from MODIS bidirectional reflectance distribution function (BRDF) data [36], the 500 m × 500 m 8-day photosynthetic capacity (Vcmax) data derived from leaf chlorophyll content (2001–2016) [37,38], and the 5 km × 5 km daily downwards shortwave radiation (DSR) data from the GLASS V5 product (2001–2016) [39]. We obtained the 0.5° × 0.5° 6-h climate data (including air temperature and relative humidity) from the Climatic Research Unit-NCEP (CRUNCEP) V7 (2001–2016) [40]. The vapour pressure deficit (VPD) was calculated from atmospheric pressure, the minimum and maximum air temperature, and relative humidity. Meteorological data used to drive the FGM included the mean air temperature and VPD. In addition, site-level daily ambient CO2 concentrations observed at the Mauna Loa Observatory (MLO) site (2001 to 2016) were used to drive the FGM. DSR data were resampled to a spatial resolution of 500 m × 500 m with bilinear interpolation. Climate data were aggregated to a targeted temporal resolution of 8 days and downscaled to a spatial resolution of 500 m × 500 m with bilinear interpolation. For the 40 EuroFLUX sites used in this study, 8-day LAI time series from 2001 to 2016 were extracted from the GLASS LAI product [33] and interpolated to daily temporal resolution using the linear interpolation method.

2.4. Simulation Design

To disentangle the effects of LULCC, climate change, CO2 fertilization, and photosynthesis capacity change on GPP, we designed a series of simulation scenarios based on different combinations of model inputs (Table 1). First, we produced the actual ensemble GPP dynamics by allowing all model inputs to change with time from simulations (“All”). Then, we fixed one to three factors at the initial 2001 level and allowed all other variables to change with time. In the second group of simulations (i.e., “S1–3”), we simulated the LULCC and greening effects on GPP by maintaining both land use land cover (LULC) and LAI, only LULC, and only LAI at the initial 2001 level. The third group simulated the climate change effect on GPP by maintaining all climate factors (i.e., DSR, air temperature, and VPD) or one climate factor at a time at the initial 2001 level from the simulations “S4-7”. In simulation “S8”, we simulated the CO2 fertilization effect on GPP by maintaining the ambient CO2 concentration at the initial 2001 level at 8-day temporal scales. The fourth group simulated photosynthetic capacity change effects on GPP by maintaining Vcmax at the initial 2001 level from simulation “S9”.

3. Results

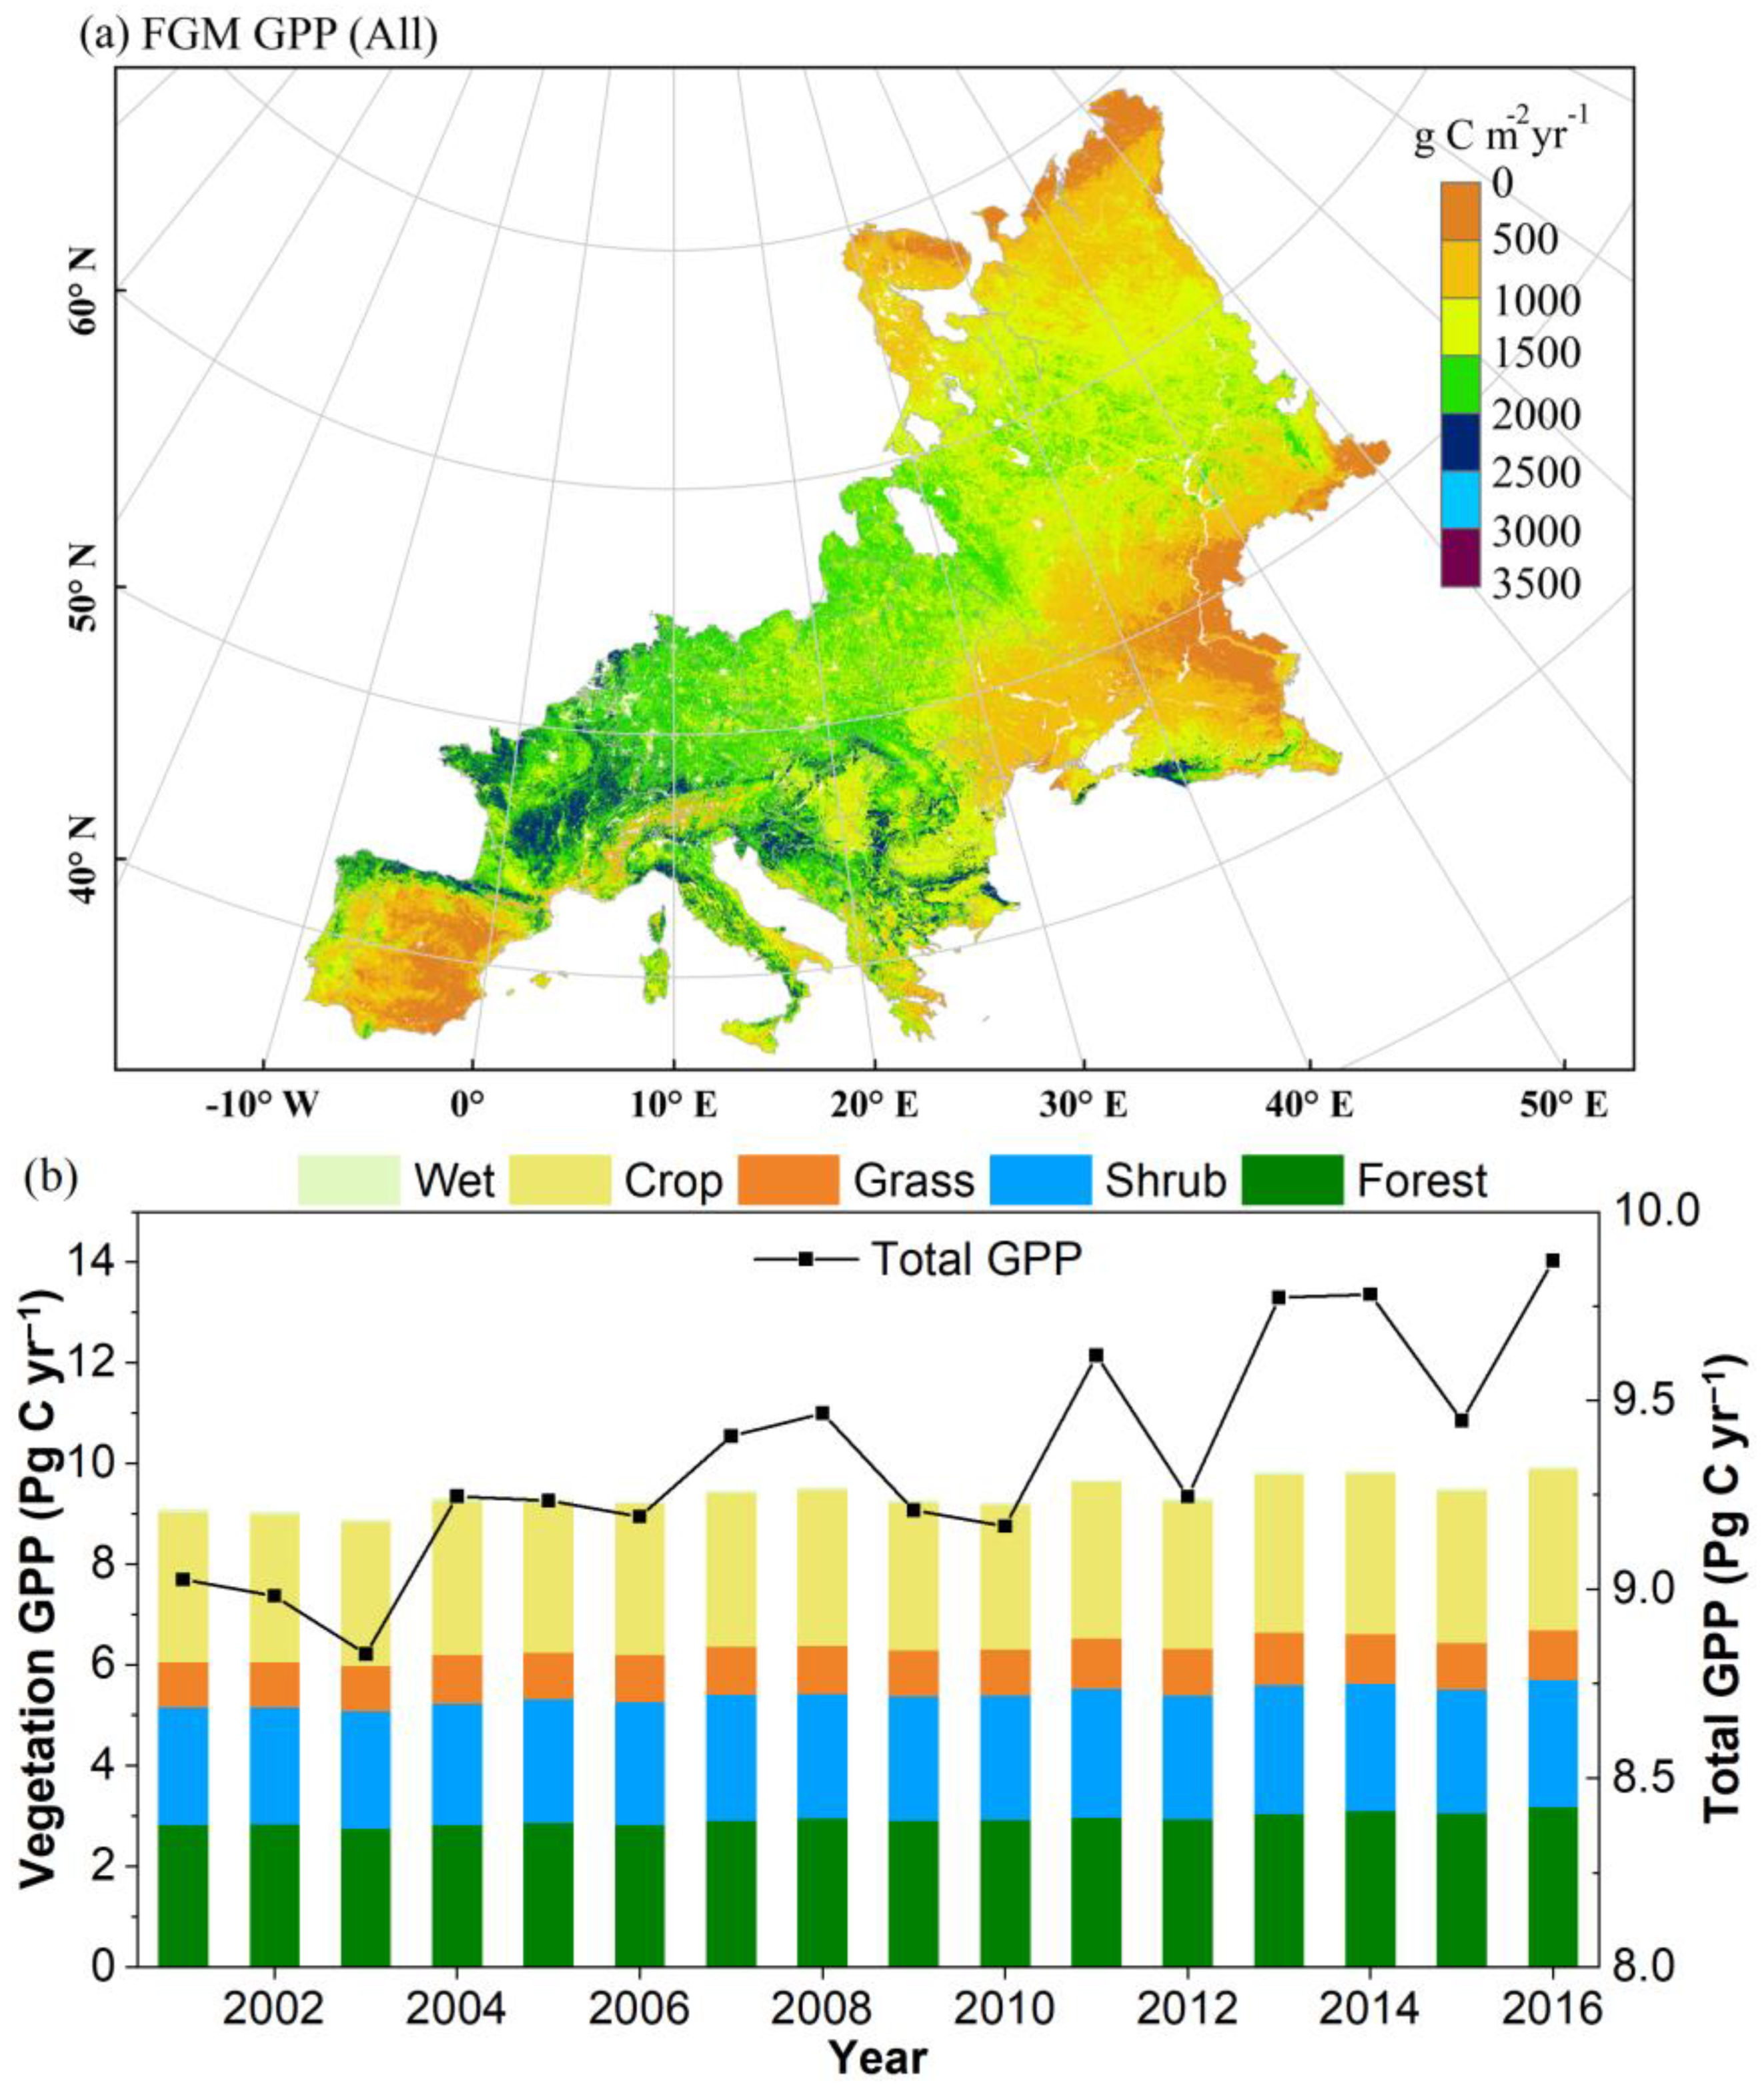
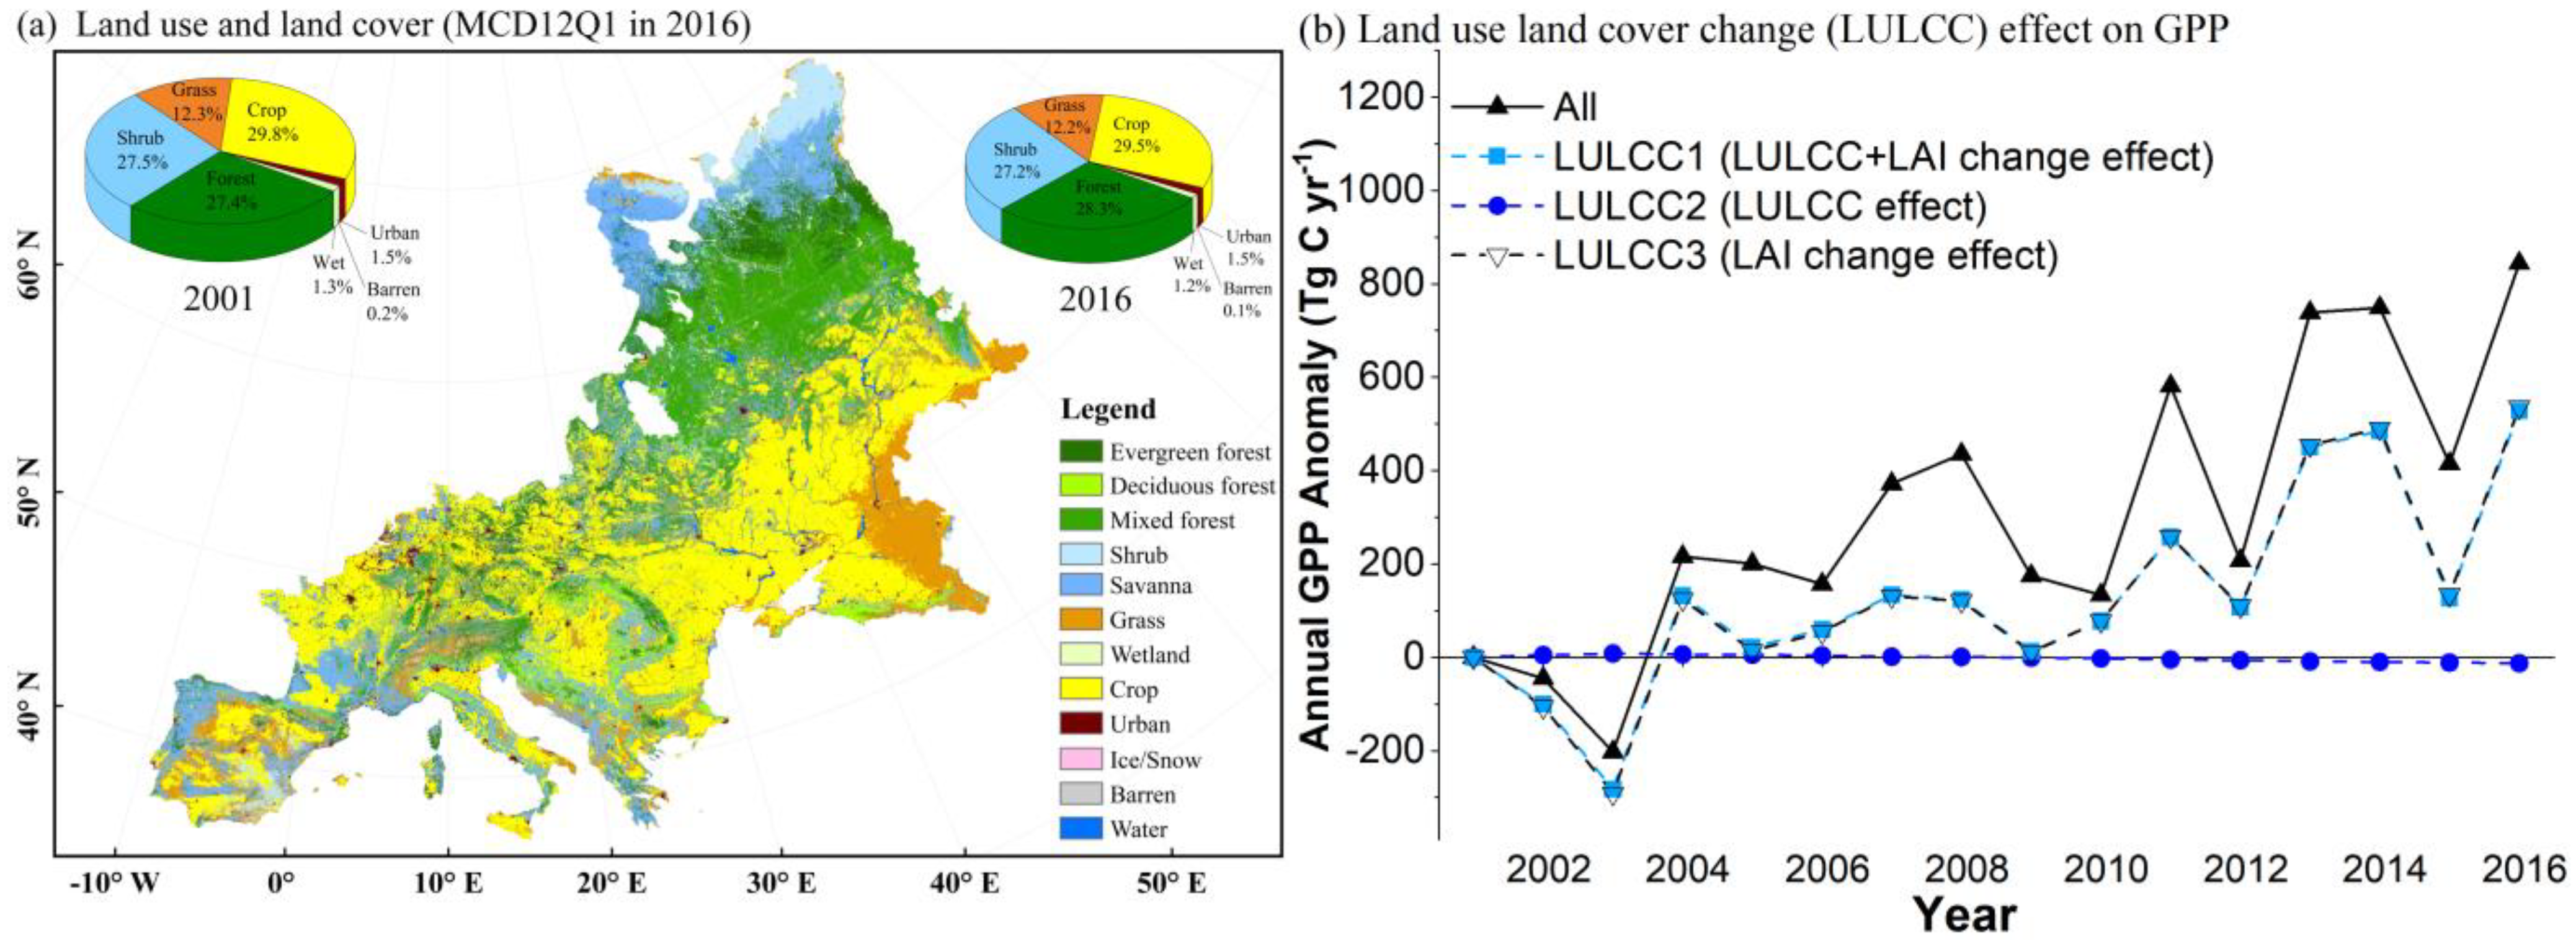
3.1. Spatial Pattern and Interannual Dynamics of GPP across Europe from 2001 to 2016

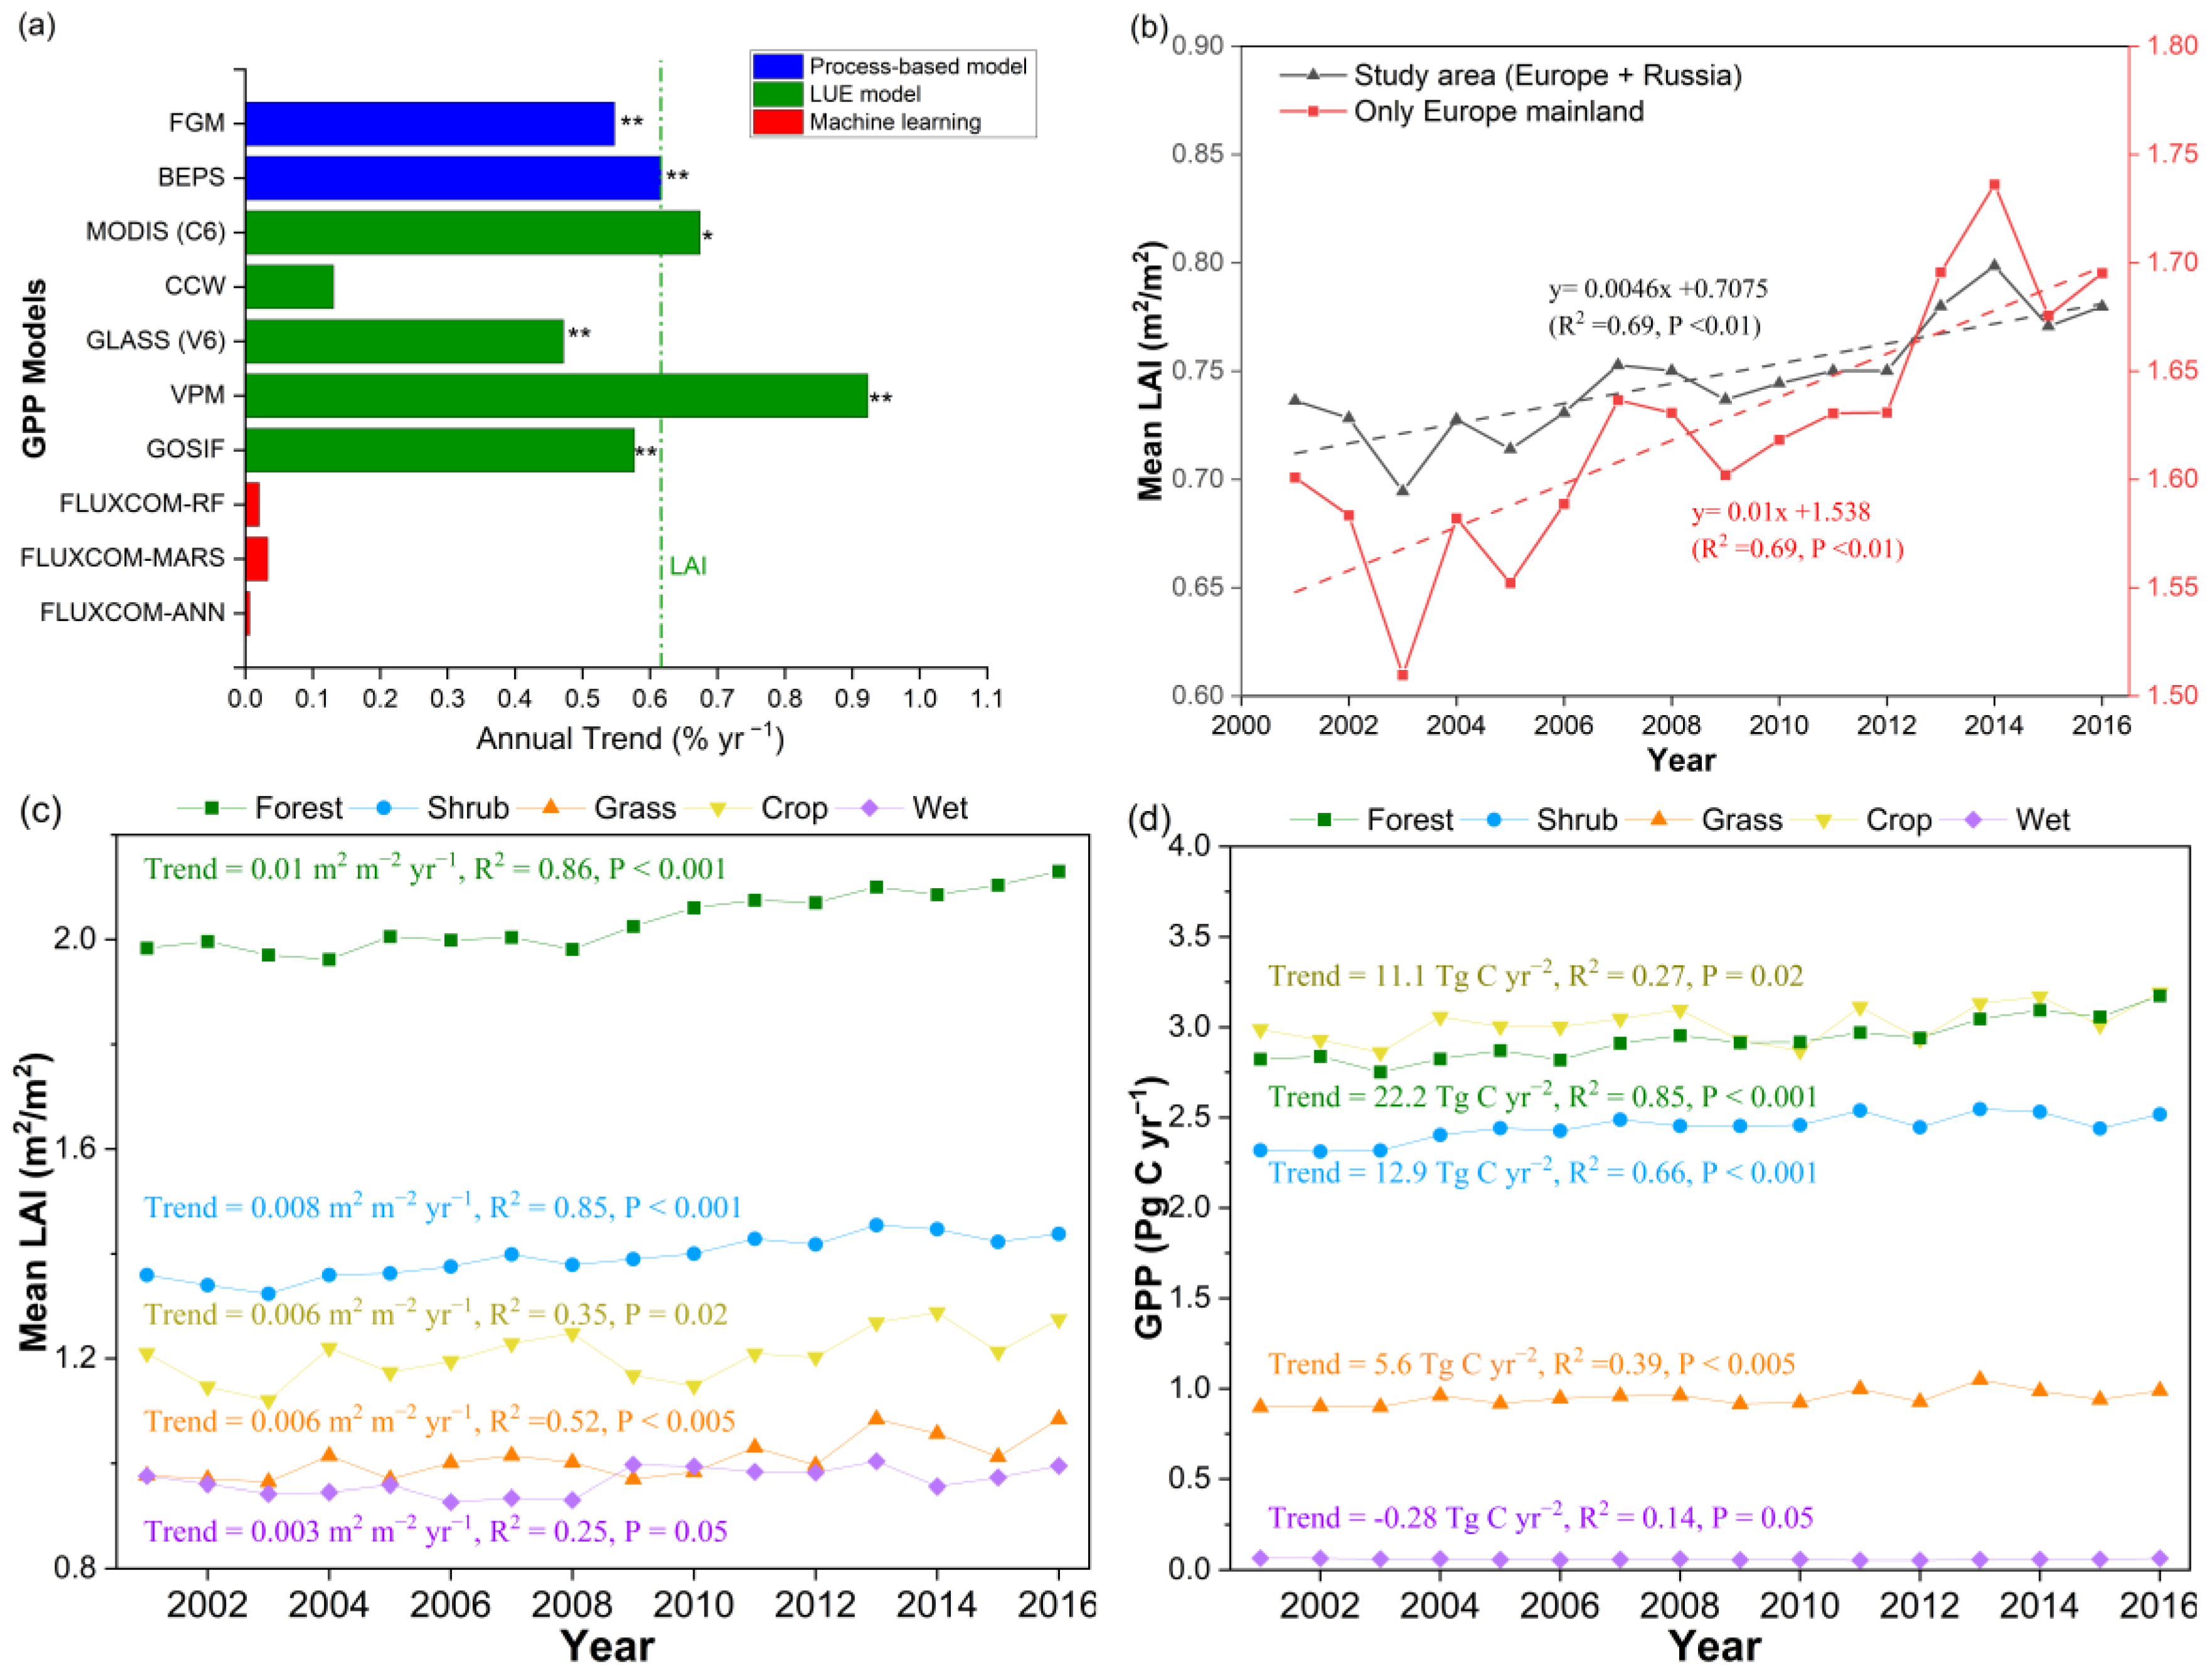
3.1.1. A More Productive European Terrestrial Ecosystem from 2001 to 2016

The study region covers most of the regions of Europe (excluding England, Norway, Sweden, and Finland) and the European section of Russia. We estimated European GPP by FGM using the “All” simulation based on multisource remote sensing data and CRUNECP climate reanalysis data at a spatial resolution of 500   m   × 500   m for the period 2001–2016.
Spatially, the annual GPP estimated by the FGM showed high values in marine and humid subtropical regions, moderate values in humid continental regions, and low values in Mediterranean, highlands, semiarid, subarctic, and tundra regions (Figure 1a). The multiyear mean of European annual GPP estimated by the FGM from 2001 to 2016 was 9.4 Pg C yr−1, of which cropland contributed the most (32.1%), followed by forests (31.2%), shrubland (26.0%), grassland (10.1%), and wetland (0.6%) (Figure 1b). It is worth noting that the European annual total GPP showed a significant increasing trend (0.052 Pg C yr−2, p < 0.001) from 2001 to 2016 (Figure 1b).

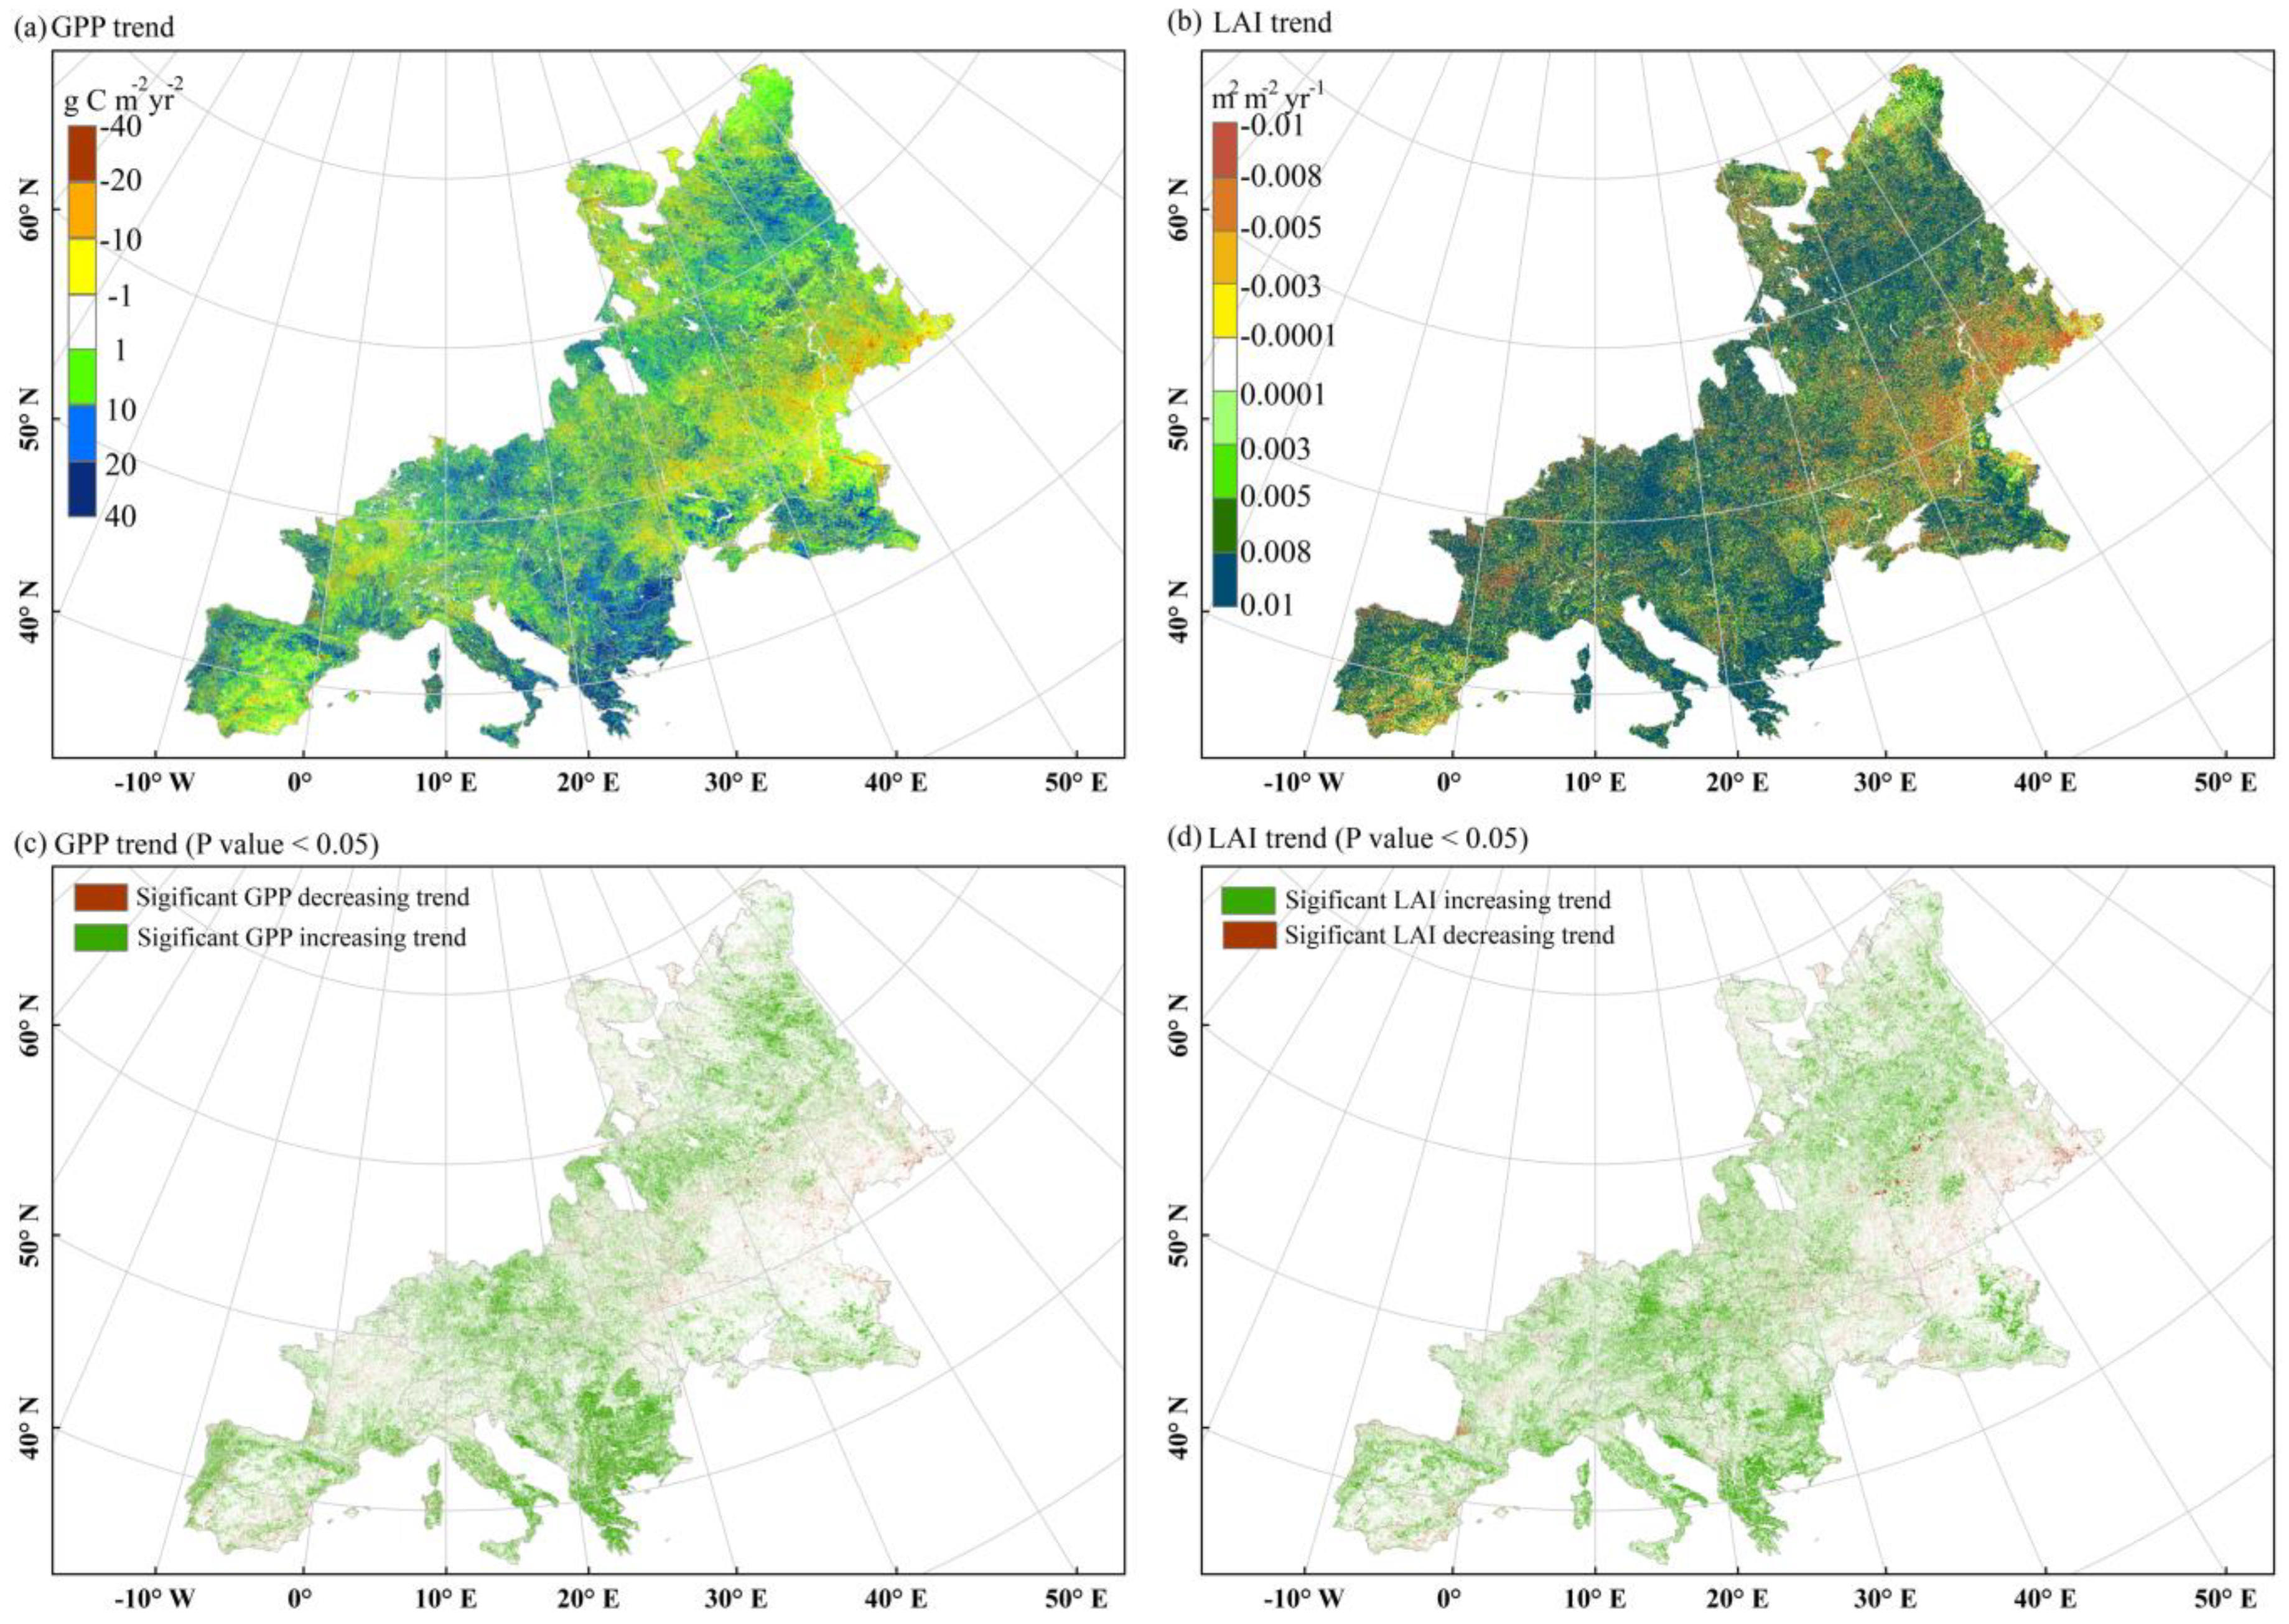
3.1.2. Proportional Increase in GPP and LAI with Rapid Forest Growth across Europe

Spatially, the interannual GPP trends (ranging between −40 and 40 g C m−2 yr−2) showed widespread (71.6% of the vegetated area) increases in most of Europe (Figure 2a), among which 13.3% and 2.0% of European vegetated land exhibited significant increasing and decreasing GPP trends (p < 0.05), respectively (Figure 2c). The GPP of southern, central, and north-eastern Europe showed a significant increasing trend, while the vegetation productivity of a few countries (e.g., France, Ukraine, and Russia in south-eastern Europe) showed a negative trend.
Here, we used LAI to quantify greening. The spatial distribution of the GPP trend correlated well with the vegetation greening trends (Figure 2b). The spatial signature of the LAI trend suggested widespread (73.2% of the vegetated area) greening phenomena across Europe (Figure 2b). Only 3.4% of European vegetated land exhibited significant browning (p < 0.05) according to the GLASS LAI product. Approximately 23.7% of European vegetated land exhibited significant greening (p < 0.05) (Figure 2d) with an average greening rate of approximately 0.0046 m2 m−2 yr−1 or 0.62% yr−1 (i.e., annual linear trend relative to the year 2001 base; the same definition of relative changing rate for annual trend hereafter) by the LAI (p < 0.001) (Figure 3a).
The annual total GPP calculated by BEPS, MODIS, GLASS, VPM, and GOSIF also showed significant positive trends and the annual GPP exhibited increasing trends ranging from 0.47% yr−1 to 0.92% yr−1. Thus, the interannual trend of GPP estimated by the FGM was reasonable compared with other models. In addition, the GPP annual trend estimated by the FGM (0.55% yr−1) was very close to the greening rate (0.62% yr−1) (Figure 3a). The mean annual LAI increased by 0.0046 m2 m−2 yr−1 (p < 0.01) over the study area. Not accounting for the Russia region, the mainland of Europe showed a doubled greening rate (0.01 m2 m−2 yr−1) (Figure 3b).
Among the five dominant vegetation types (i.e., forest, shrub, grass, crop, and wetland), the increasing rates for the LAI of forests (0.01 m2 m−2 yr−1, p < 0.001) and shrubland (0.008 m2 m−2 yr−1, p < 0.001) were more significant and higher than those for other vegetation types (Figure 3c). Although both the increasing LAI rates and the total vegetation cover for shrubs and forests were comparative, the increasing trend of the annual total GPP for shrubland (12.9 Tg C yr−2, p < 0.001) was only approximately half that for forests (22.2 Tg C yr−2, p < 0.001), while it was much lower for grass (5.6 Pg C yr−2, p < 0.001). In contrast, the annual mean LAI and GPP for crops and wetland showed no specific trends.

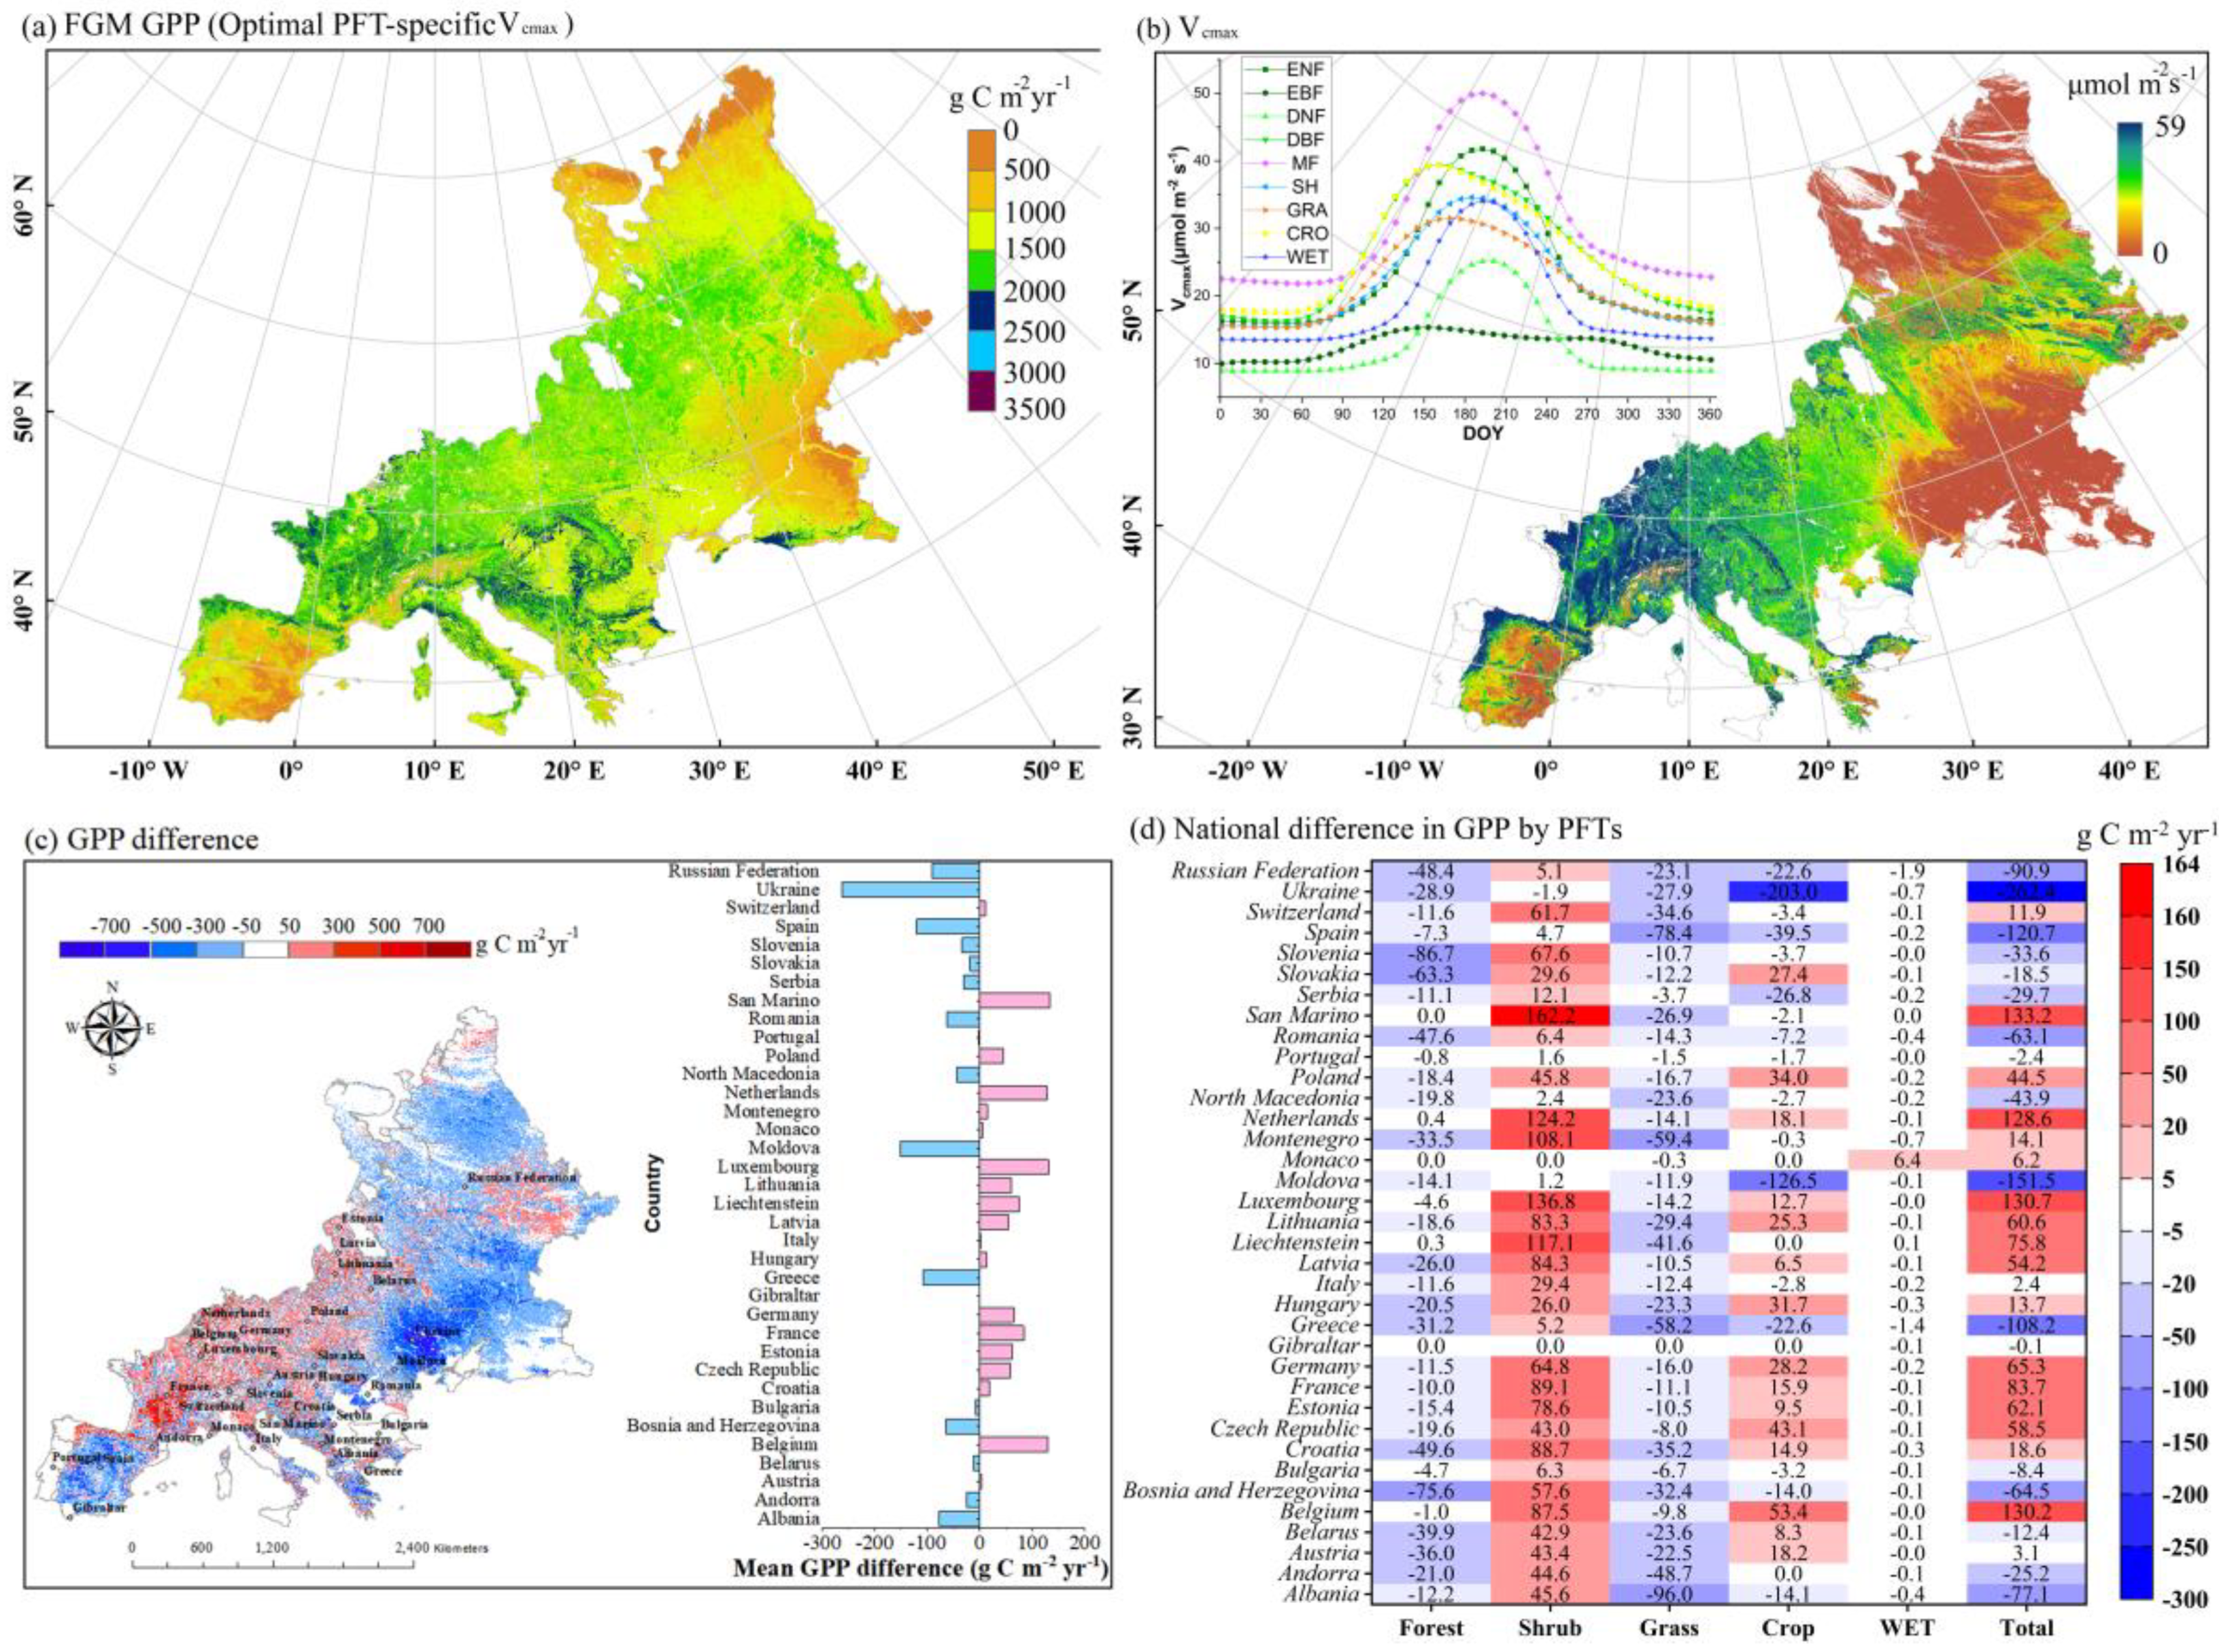
3.2. The Difference in GPP by Including Spatiotemporal Vcmax Dynamics

The state-of-the-art TBMs generally assume a constant Vcmax for a specific PFT. One typical parameterization method is to retrieve the optimal Vcmax from flux tower observations. The mean GPP of Europe estimated by FGM parameterized with such PFT-specific Vcmax values [28] was 9.90 Pg C yr−1 (Figure 4a), which was 0.5 Pg C yr−1 higher than GPP estimations using the “All” simulation. Spatially, the difference in GPP caused by changes in Vcmax exhibited heterogeneous spatial patterns in different countries. With the new data of spatiotemporal information on Vcmax (Figure 4b), we observed a pronounced decrease in GPP for Ukraine (−262.4 g C m−2 yr−1), Moldova (−151.5 g C m−2 yr−1), Spain (−120.7 g C m−2 yr−1), Greece (−108.2 g C m−2 yr−1), and Russia (−90.9 g C m−2 yr−1). In contrast, vegetation in San Marino (+133.2 g C m−2 yr−1), the Netherlands (+128.6 g C m−2 yr−1), Luxembourg (+130.7 g C m−2 yr−1), and France (+83.7 g C m−2 yr−1) appeared more productive (Figure 4c).
In comparison with the GPP based on PFT−specific Vcmax, major differences emerged for the GPP for different PFTs using the “All” simulation, without a consistent bias in any one direction (Figure 4d). When the FGM was constrained by dynamic Vcmax maps, shrubland became more productive while forests and grassland became less productive. The productivity of shrublands noticeably increased in San Marino (+162.2 g C m−2 yr−1), Luxembourg (+136.8 g C m−2 yr−1), the Netherlands (+124.2 g C m−2 yr−1), Liechtenstein (+117.1 g C m−2 yr−1), and Montenegro (+108.1 g C m−2 yr−1) (Figure 4d). The largest reduction in forest productivity occurred in Slovenia (−86.7 g C m−2 yr−1), followed by Bosnia and Herzegovina (−75.6 g C m−2 yr−1) and Slovakia (−63.3 g C m−2 yr−1). Grassland productivity decreased in Albania, Spain, Montenegro, and Greece. There is a pronounced reduction in the productivity of croplands in Ukraine (−203 g C m−2 yr−1) and Moldova (−151.5 g C m−2 yr−1), while the productivity of marine croplands in Belgium, Czech Republic, Poland, Hungary, Germany, and Slovakia increased moderately.

3.3. Driving Force Analysis for Interannual GPP Dynamics

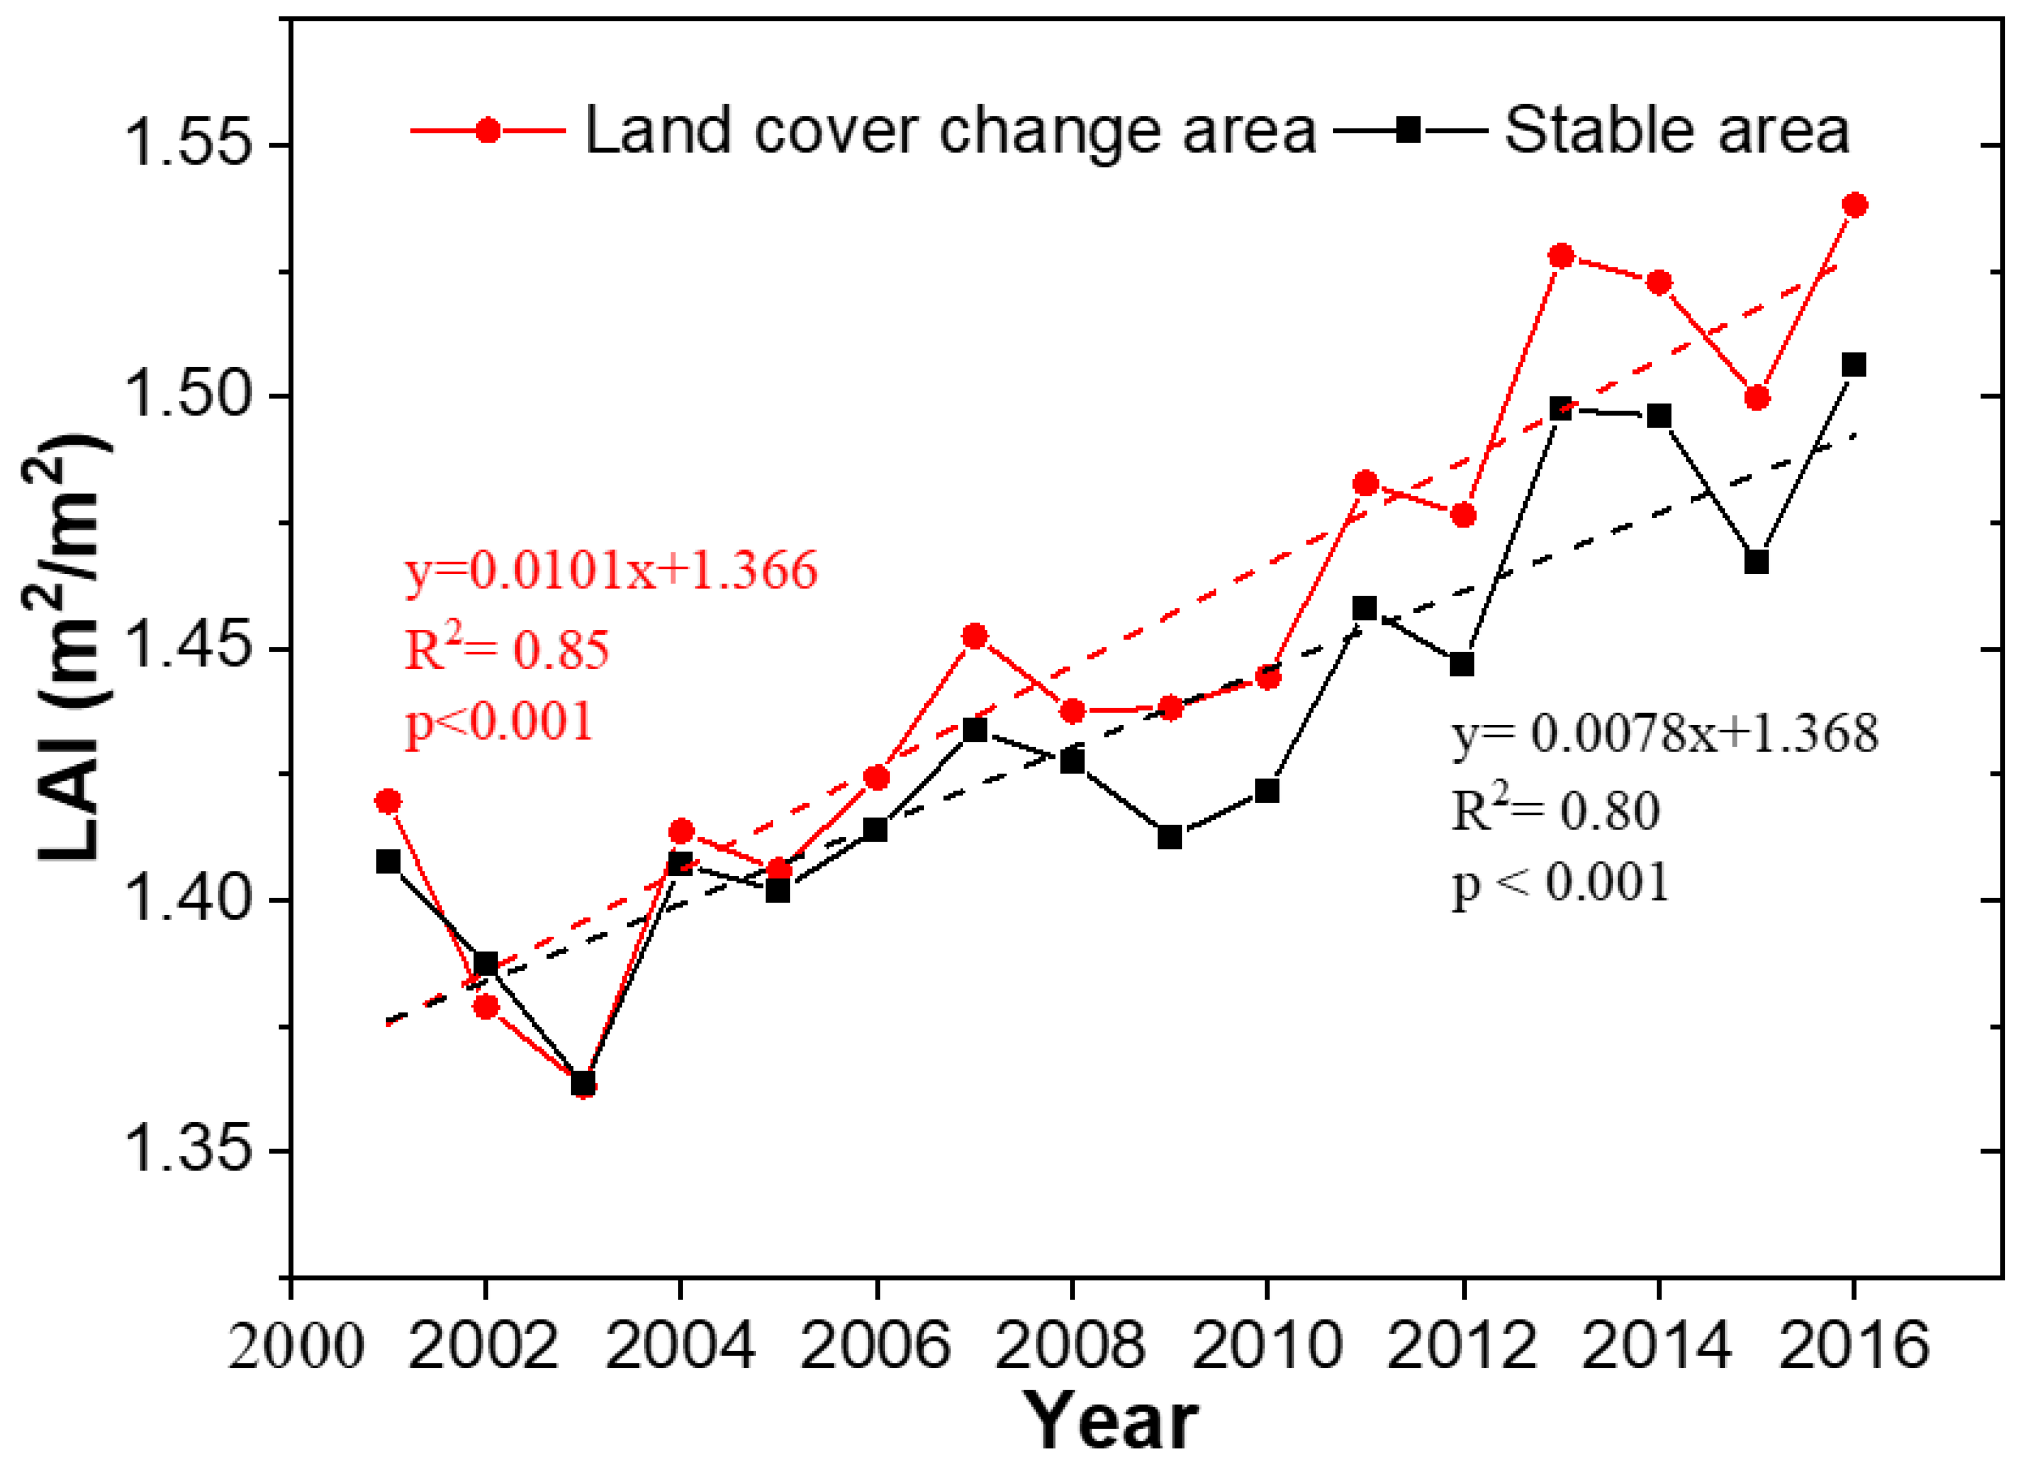
3.3.1. The LULCC Effect on GPP from 2001 to 2016

To separate the effects of LULCC and the observed greening land surface, we first compared the interannual GPP trends using the “LULCC1” (accounting for both LULCC and LAI change), “LULCC2” (only accounting for only LULCC), and “LULCC3” (accounting for only LAI change) model simulations.
From 2001 to 2016, the vegetation cover in Europe was as high as 97% with relatively stable land cover compositions ( ± 1 % changes in fractions of all LULC types) (Figure 5a). However, the total number of vegetated pixels decreased by 3224 at an average rate of −159 pixels per year (the coefficient of determination (R2) = 0.5, p < 0.01), while nonvegetated pixels (including urban, water, and snow and ice) increased correspondingly. Based on the two epochs of MCD12Q1 data in the initial year 2001 and the ending year 2016, 1.8% of the total area of Europe (excluding water, snow, and ice; same hereafter) experienced land cover change from 2001 to 2016. The largest increase occurred in forested land (+0.9% of total area), while all other land cover types decreased slightly (i.e., −0.3% of the total area for shrub/crop; −0.1% of the total area for grass/barren/wetland). The proportion of forested area to total area increased from 27.4% in 2001 to 28.3% in 2016.
Our simulations indicated that the direct LULCC effect explained little of this variation (“LULCC2”), with a small but significant negative effect of −1.3 Tg C yr−1 (R2 = 0.61; p < 0.01). In contrast, the greening effect alone explained approximately 92.8% of this variation (p < 0.01; “LULCC1” and “LULCC3”) (Figure 5b). The greening effect on the interannual GPP trend was 35.5 Tg C yr−2 and enhanced the total GPP by 536 Tg C yr−1, with the largest contribution from forests (31.2%, 167.0 Tg C yr−1), followed by shrubs (25.4%, 136.4 Tg C yr−1), cropland (25.2%, 135.2 Tg C yr−1), grassland (17.6%, 94.3 Tg C yr−1), and wetland (<1%, 3.2 Tg C yr−1) (Figure 5b).

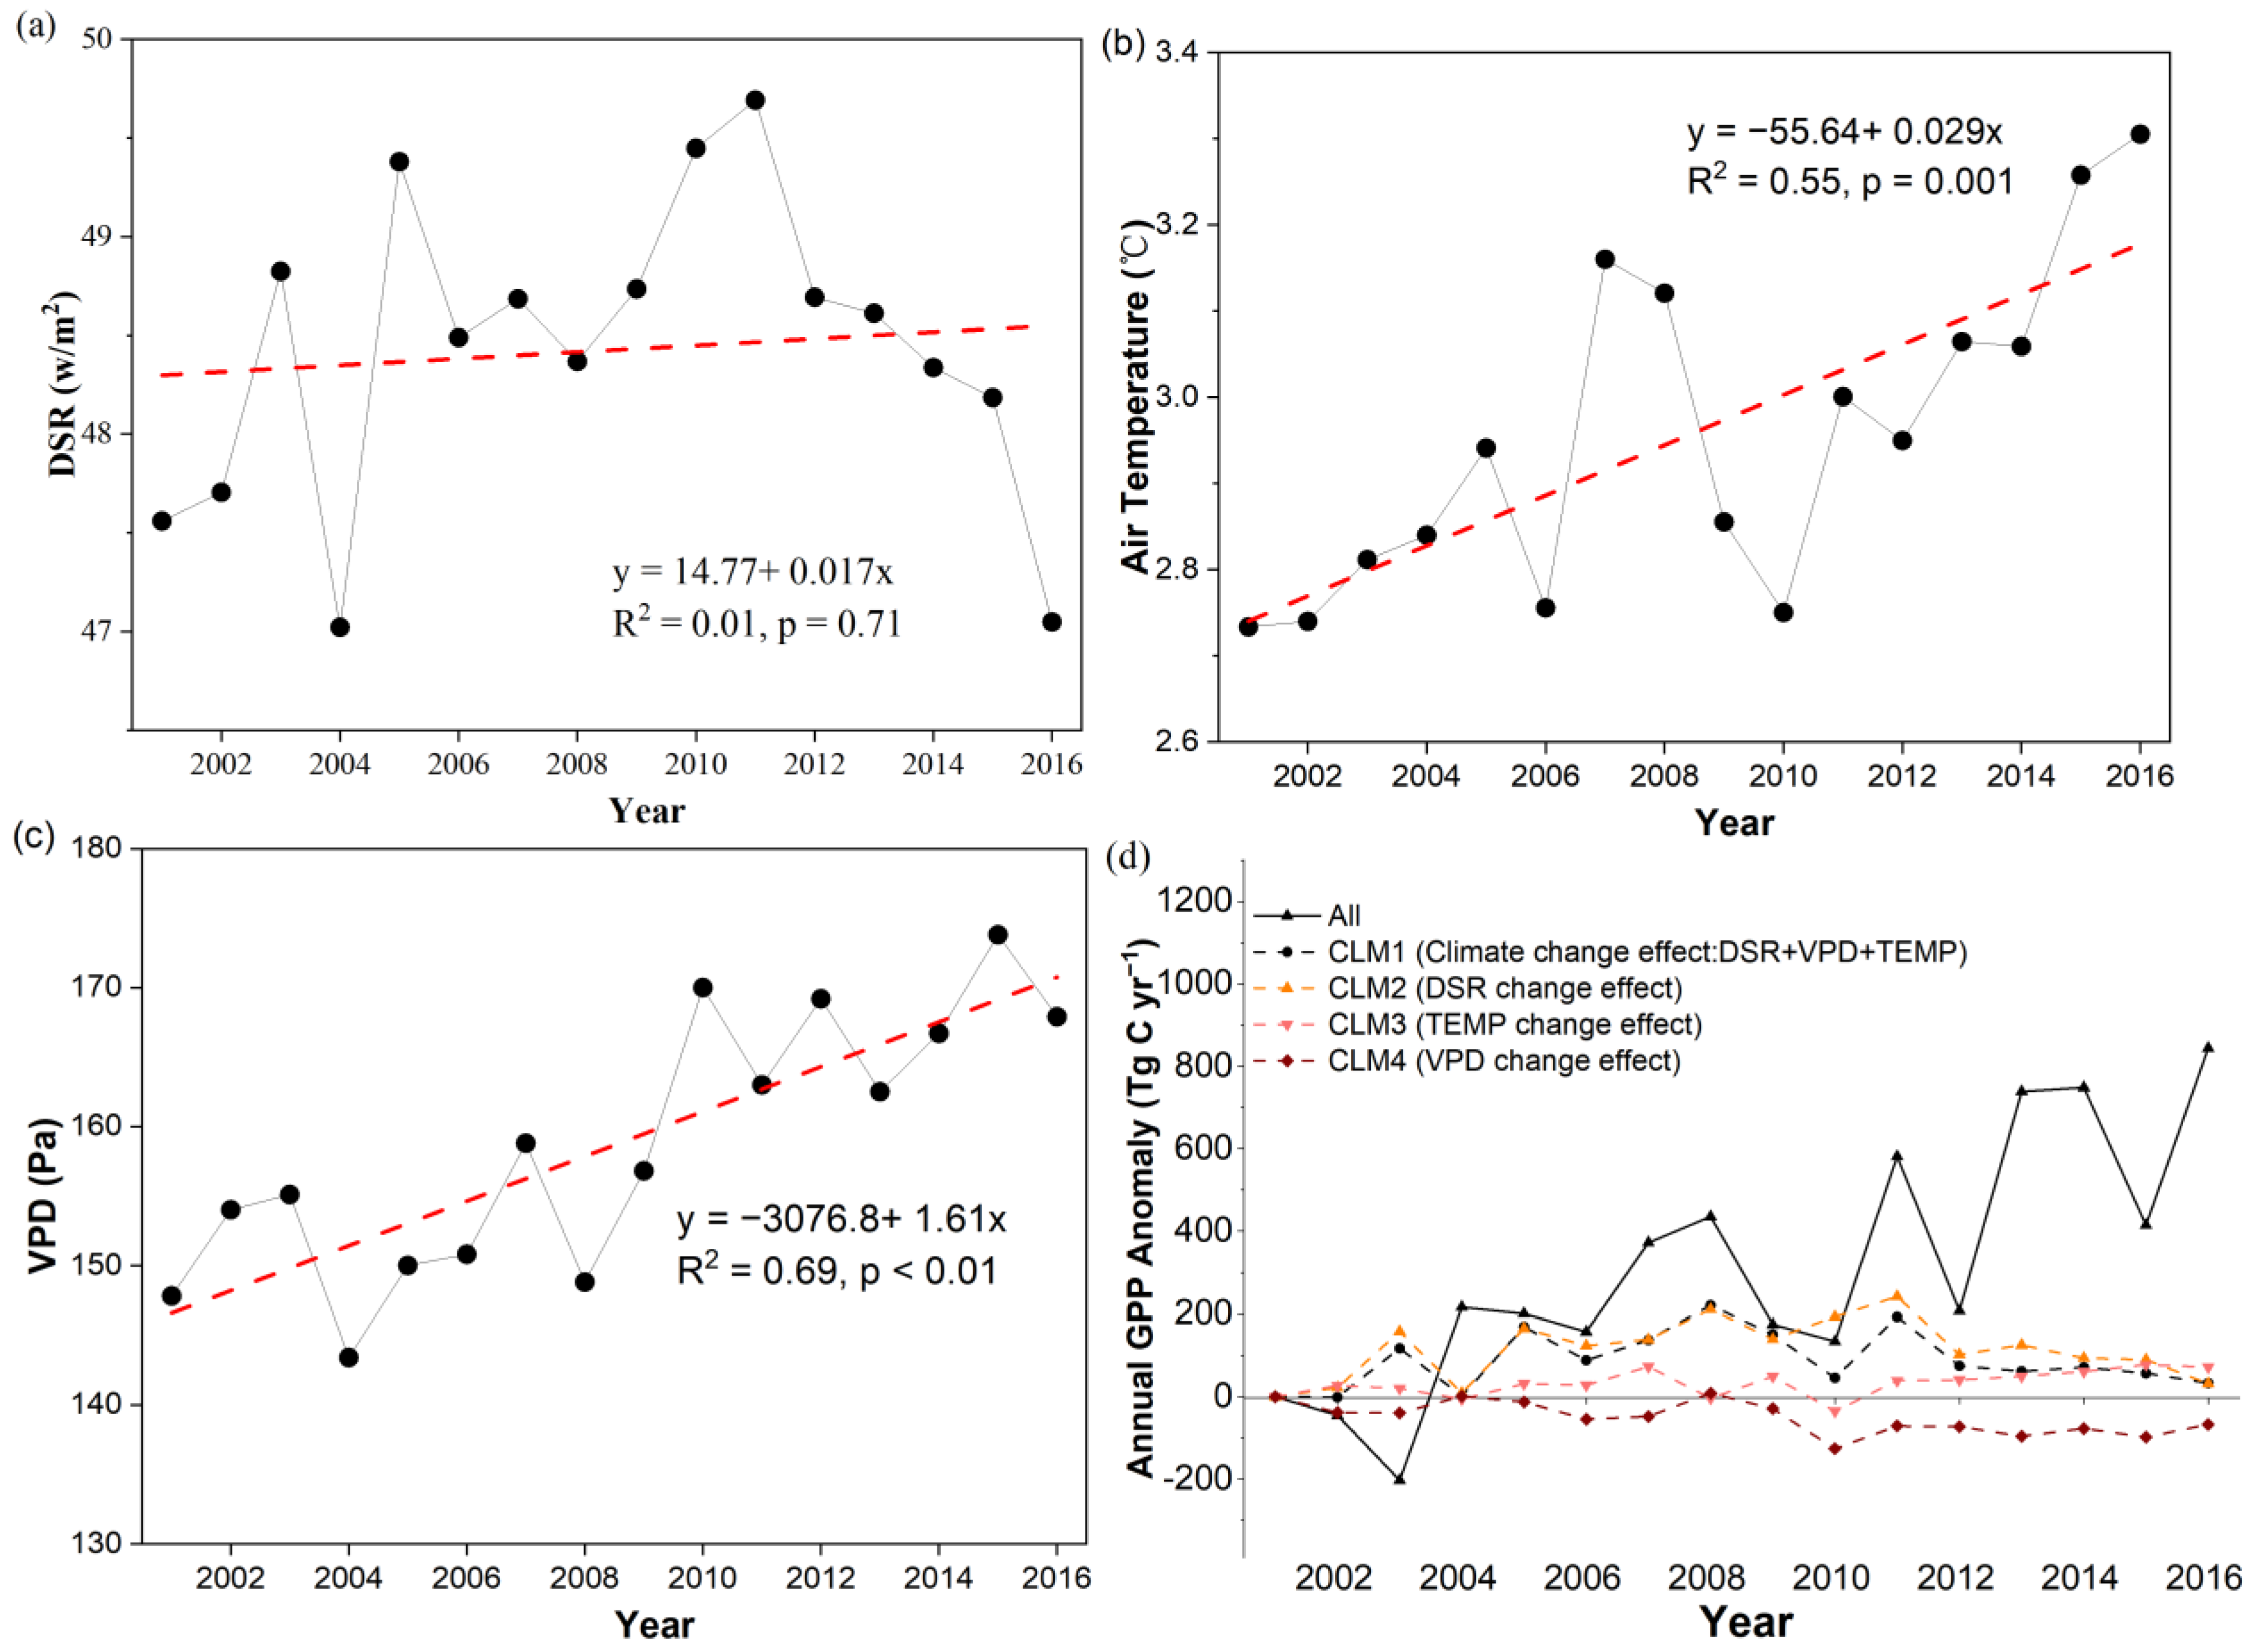
3.3.2. The Climate Change Effect on GPP from 2001 to 2016

We further evaluated the climate change effect on the interannual GPP trends using the “CLM1” (accounting for combined effects of changes in DSR, TEMP, and VPD), “CLM2” (only accounting for only DSR change), “CLM3” (only accounting for only TEMP change), and “CLM4” (only accounting for only VPD change) simulations.
The DSR showed large interannual variations according to the GLASS DSR product, with an overall positive (but not statistically significant) change trend from 2001 to 2016 (Figure 6a). Model simulations indicated that radiation brightening (i.e., increasing DSR) played a minor role in driving the GPP trend (+2.9 Tg C yr−2, p > 0.05; “CLM2”). In contrast, the mean air temperature (TEMP) (+0.029 °C yr−1, p < 0.01) (Figure 6b) and VPD (+1.61 Pa yr−1, p < 0.01) (Figure 6c) both increased significantly during the study period. The warming effect (i.e., increasing TEMP) led to a small but significant increase in GPP (+3.7 Tg C yr−2, p < 0.05; “CLM3”), while the enhanced VPD had an even stronger negative impact (−5.6 Tg C yr−2, p < 0.01; “CLM4”) than the warming effect (Figure 6d). The warming effect and radiation brightening effect marginally offset the GPP decline caused by the enhanced VPD (Figure 6d). Consequently, climate change had a small positive impact on GPP (1.2 Tg C yr−2, p > 0.05; “CLM1”) due to the combined effects of changes in climatic factors.

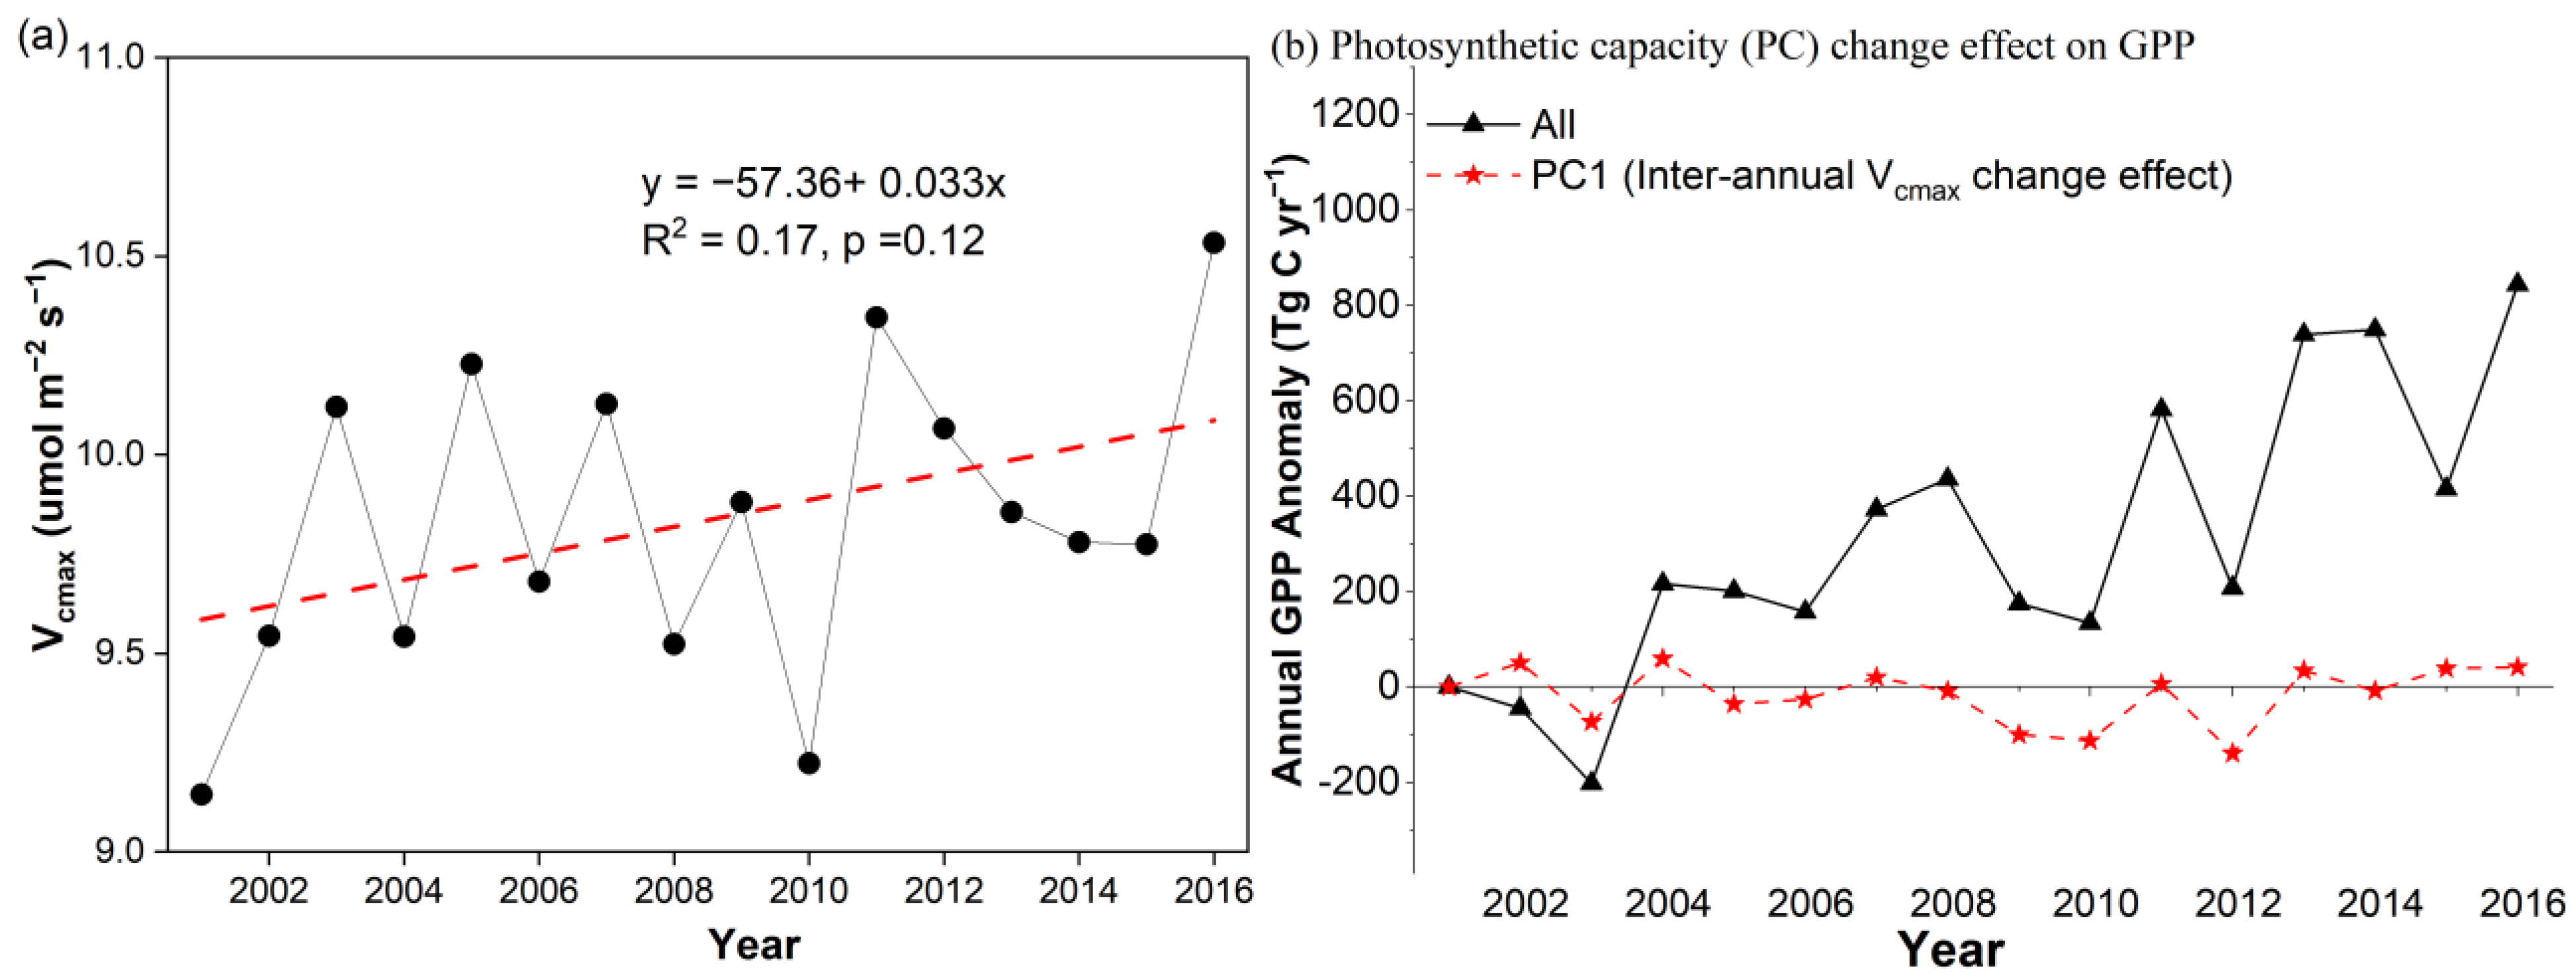
3.3.3. The Interannual Vcmax Change Effect on GPP

In our previous study, we quantified the impact of spatial and seasonal changes in Vcmax on GPP and proved that considering changes in Vcmax could improve GPP estimations [28]. Neglecting spatial and seasonal changes in Vcmax could lead to an overestimation of both the GPP and cause substantial differences in the spatial and temporal signatures in GPP [28]. On long-term scales, leaf photosynthetic capacity (Vcmax) can also change with plant adaptation to climate change (e.g., global warming, radiation brightening, and elevated CO2 concentration) to optimize photosynthesis. Thus, we further quantified interannual Vcmax change effect on GPP at annual time scales using the All and PC1 simulation scenarios to help us understand whether including interannual dynamics in Vcmax could lead to substantial difference in GPP.
From 2001 to 2016, the annual mean Vcmax across Europe showed a small (but not significant) increasing trend (Figure 7a). If we consider the spatial and seasonal changes in Vcmax using the Vcmax derived from the leaf chlorophyll metric in 2001, the average annual total GPP for Europe was 9.42 Pg C yr−1 with a positive rate of increase of 0.052 Pg C yr−2, which was almost equivalent to the GPP estimations from the “All” simulation (annual GPP: 9.4 Pg C yr−1; GPP trend: 0.051 Pg C yr−2). Surprisingly, we found that the interannual changes in Vcmax contributed little to the annual GPP trend (−0.13 Pg C yr−2, p > 0.5) from 2001 to 2016 (Figure 7b). This suggests that FGM without interannual dynamic information on Vcmax but constrained by spatial and seasonal dynamic information on Vcmax may still provide a reasonable estimation of GPP over the limited time period of 16 years. However, interannual changes in Vcmax may continue to affect GPP with climate change on longer time scales.

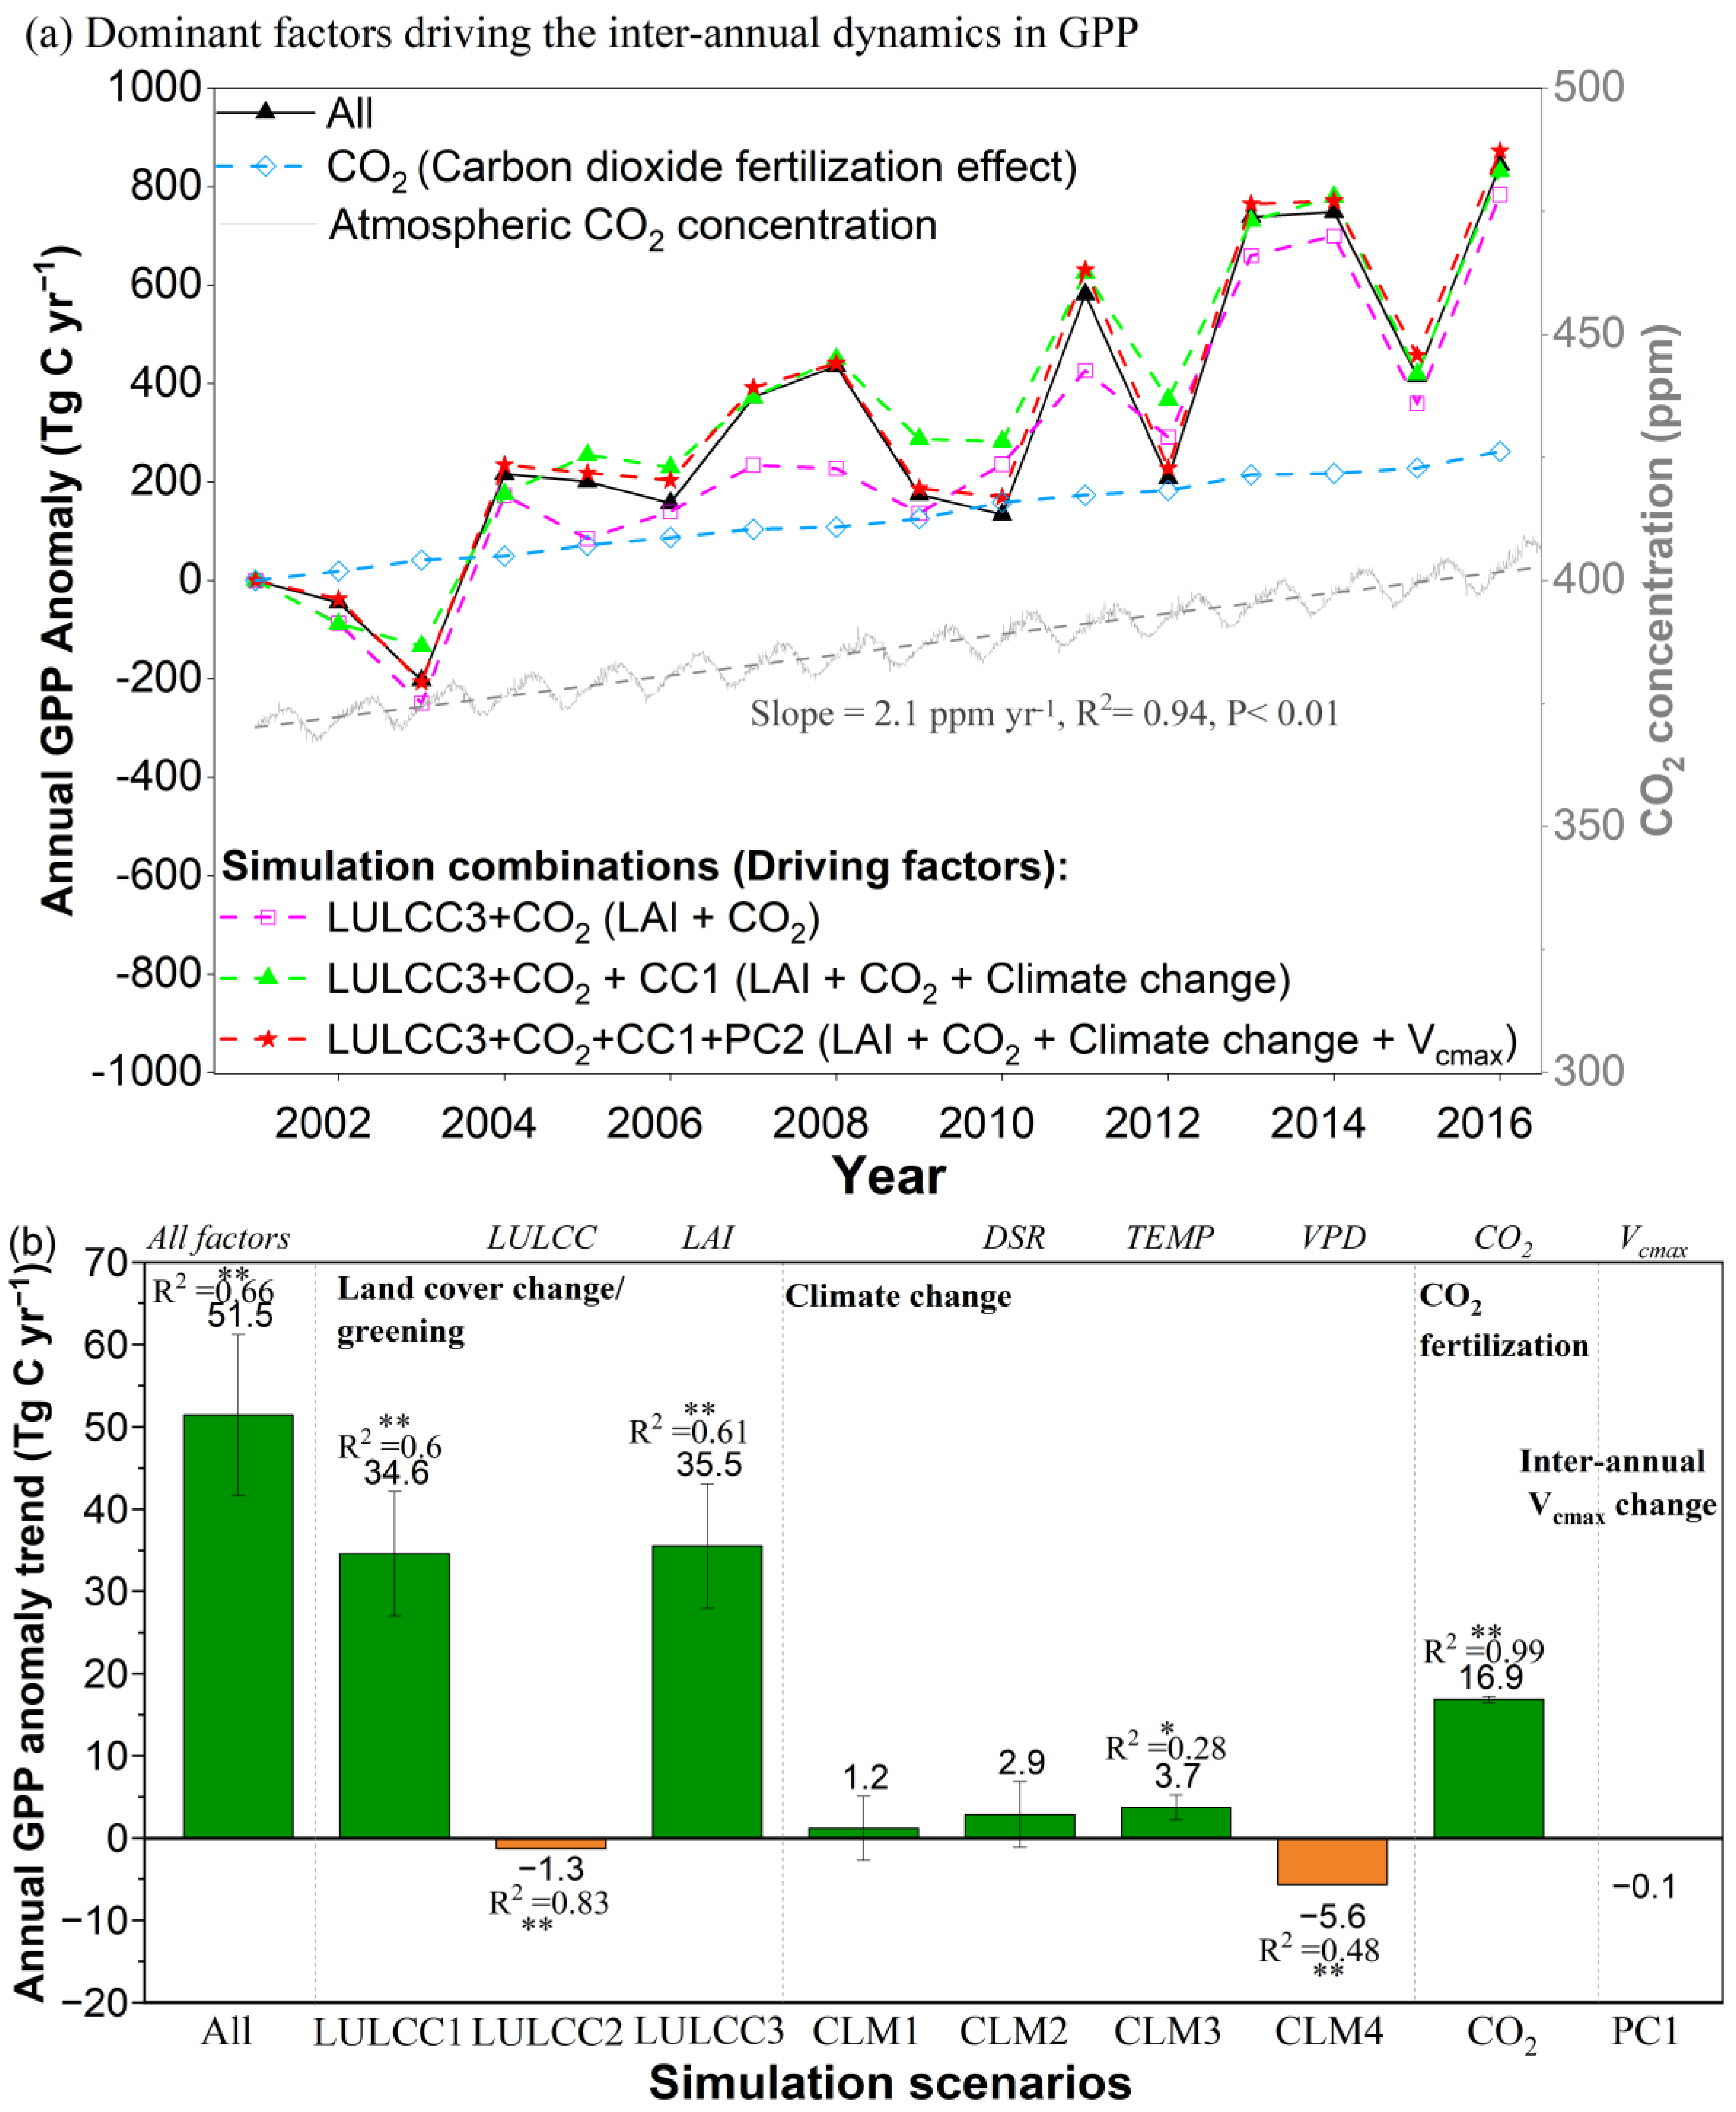
3.3.4. Greening Effect and CO2 Fertilization Dominated GPP Enhancement

The annual average CO2 concentration at the MLO site increased approximately linearly from 2001 to 2016 at an average rate of 2.1 ppm yr−1 (Figure 8a). Correspondingly, the rising ambient CO2 concentration boosted the European GPP at a rate of increase of nearly 16.9 Tg C yr−2 (p < 0.001; “CO2”), accounting for 32.8% of the total interannual increasing GPP trend. Accounting for the CO2 fertilization effect alone, GPP increased by 8.6% per 100 ppm (“CO2”, Figure 8a); if all the factors were included, GPP increased by 27.8% per 100 ppm (“All”; Figure 8a). By calculating cumulative GPP anomalies using different simulation scenarios, we identified the LAI and CO2 as the key factors dominating the GPP dynamics from 2001 to 2016. Although the climate change and interannual Vcmax change effect on GPP is not significant (Figure 8b), they cause interannual fluctuations in GPP (Figure 8a).
Land surface greening and elevated CO2 had significant positive effects of 35.5 Pg C yr−2 and 16.9 Pg C yr−2, respectively (Figure 8b). Climate change exerted minor (statistically insignificant) impacts on the GPP increase (+1.2 Pg C yr−2) but played important roles in driving the interannual GPP dynamics (Figure 8a). In contrast, LULCC had a small but significant negative effect (−1.3 Pg C yr−2; p < 0.001) for the long-term GPP trend. Although the interannual Vcmax change effect on the GPP trend was minor (Figure 8b), it played a minor role in driving the annual dynamics (Figure 8a). Among all the factors, the LAI contributed most significantly to the GPP interannual trend, followed by CO2, VPD, air temperature, and LULCC (Figure 8b).

4. Discussion

Here, we quantitatively analysed how land cover change, climate change, CO2 fertilization, and photosynthetic capacity change contributed to European GPP dynamics in Europe from 2001 to 2016. Despite some fluctuations, the annual total GPP exhibited a significant increasing trend (51.5 Tg C yr−2, p < 0.01) across Europe from 2001 to 2016 (Figure 1b). This increasing GPP trend suggests a considerable role of the European vegetation in the terrestrial carbon cycle, which is in agreement with current expectations for the northern middle-high latitude ecosystem. Many studies have provided evidence of increasing vegetation productivity across the Northern Hemisphere, though these studies have attributed the annual increasing GPP trend to different reasons, such as warming temperatures, elevated atmospheric CO2 concentrations, and land surface greening. However, the role of land cover change and Vcmax change in dominating terrestrial carbon assimilation is still not well understood. Thus, we discuss four aspects of the primary findings: (a) the enhancing VPD offset the GPP enhancement caused by warming; (b) the greening effect and CO2 fertilization dominated the GPP increase across Europe in the last decade; (c) consistent increases in GPP based on different GPP models; and (d) the Vcmax change effect on GPP.
The annual mean temperature in the study area increased from 2.7 to 3.3 °C from 2001 to 2016 at an annual rate of +0.029 °C yr−1 (p < 0.01) (Figure 6b). Temperature warming is considered a dominant factor affecting GPP increases in the Northern Hemisphere [41]. Although a strong correlation existed between TEMP and GPP since they both increased during the study period, we could not conclude that the GPP increase in Europe was caused by the warming effect. In this study, we found only a small positive warming effect (+3.7 Tg C yr−2, p < 0.05) (Figure 7d and Figure 8b), accounting for 7% of the GPP annual increasing trend, which was much smaller than the reported value (~40%) based on regression methods [41]. The warming effect could enhance GPP by prolonging growing seasons and increasing photosynthetic capacity. However, the warming effect could also cause a reduction in GPP by strengthening water stress and causing stomatal closure [42,43]. Extreme droughts could profoundly impact ecosystem functions and result in a reduction in GPP [44]. During the study period, there were three extreme droughts in the south-eastern Europe in 2003, 2007, and 2012. The GPP reductions in 2003 and 2012 were largely linked to extreme droughts in Europe. The annual mean temperature was relatively low in 2006 (Figure 6b), and the warming effect offset the GPP decline caused by the enhanced VPD in 2007 (Figure 6c,d).
The global average CO2 concentration has increased, on average, by 1.8 ppm per year since 1992 [45,46]. Another frequent explanation for the increase in GPP is an elevated atmospheric CO2 concentration [47,48]. Assuming spatially uniform and annually increasing CO2 for large-scale GPP estimation has been proven to be reasonable [49]. Due to the lack of spatially explicit CO2 concentrations over Europe, we utilized daily CO2 concentrations from the Mauna Loa Observatory (MLO) instead. In this study, CO2 fertilization was identified as the second key factor contributing to the GPP increase (Figure 8a). In response solely to CO2 fertilization, the GPP increased by 8.6% (i.e., 0.78 Pg C yr−1) per 100 ppm (Figure 8a), which was slightly smaller than the CO2 fertilization effect on total net primary productivity according to free air CO2 enrichment (FACE) experiments (10 to 13%) [30,50]. However, if all the factors were included, the GPP would increase by 27.8% per 100 ppm (i.e., 2.53 Pg C yr−1) (Figure 8a) across Europe, which was much higher than the sensitivity of vegetation productivity to elevated CO2 at the global scale (ranging from 10% to 18.6%) [6,51,52,53]. This could be explained by land surface greening across Europe, which could further enhance the GPP.
From 2001 to 2016, we found widespread LAI increases (i.e., greening) across Europe (Figure 2b,d) according to the GLASS LAI product, in accordance with the widely reported global greening phenomenon [7,8,21]. The mean annual LAI increased by 0.0046 m2 m−2 yr−1 (p < 0.01) over the study area (Figure 3). FGM factorial simulations suggested that increases in LAI was the dominant factor (62%, 35.5 Pg C yr−2) contributing to the interannual GPP increasing trend in Europe (Figure 5b and Figure 8). On the global-scale, GPP showed no proportional increase from land surface greening [43]. However, the FGM simulations indicated proportional increases in GPP (0.55% yr−1) from the greening terrestrial ecosystem across Europe (Figure 3a). Although substantial discrepancies exist in different LAI products [54,55], the magnitude and annual anomaly of GLASS LAI has been proven to be within a valid range [7,54]. The annual total GPP calculated by BEPS (0.62% yr−1), MODIS C6 (0.67% yr−1), GLASS V6 (0.47% yr−1), and GOSIF (0.58% yr−1) also showed significant increasing trends (Figure 3a), which were close to our estimates (0.55% yr−1). Although these products were produced based on various LAI products, their higher consistent trends (Figure S2a) indicated that employing GLASS LAI as input could reasonably simulate the interannual variations in European GPP trends. In addition, the annual GPP dynamics estimated by FGM correlated well with those estimated by BEPS, GOSIF, VPM, and GLASS V6 GPP products (Figure S2b). While general agreement existes between FGM estimations and other GPP products, the current version of the FGM does not consider nitrogen deposition [56], soil moisture or drought [57], and ozone pollution [58], thus inevitably introducing some uncertainty into European GPP estimations; this topic warrants future research.
Without any land cover transitions from 2001 to 2016, the stable areas still displayed a significant greening trend with an increasing LAI rate of 0.008 m2 m−2 yr−1 (Figure 9), suggesting that most of the European greening was largely due to climate change. In addition, the mean LAI increasing trend for change areas (0.01 m2 m−2 yr−1) was approximately 30% larger than that for stable areas, suggesting that LULCC contributed to approximately 20% of the observed greening in Europe. This result could possibly be explained by the abandonment of agricultural land in Eastern Europe and mountain areas in recent decades [59]. The return of woody vegetation at the expense of the loss of cropland enhanced land surface greening corresponded well to the regions where the annual LAI dynamics showed significant greening trends (Figure 2). LAI dynamics are a complex interplay of climate change and land cover change. Because of the relatively high and stable vegetation cover across Europe from 2001 to 2016 (Figure 4a), the FGM was generally able to separate the greening effect from the LULCC effect in Europe. Prior to this study, MODIS LAI data also detected widespread greening across Europe during the period of 2001 to 2015 [15]. Although different sources of LAI data were used, we obtained similar findings. We further quantified the contribution of land surface greening to GPP across Europe by different vegetation types.
Previous studies on decoupling GPP dynamics from climate change, CO2 fertilization, and land cover change were based mainly on light use efficiency models and process-based models and, in most cases, without the inclusion of spatial and temporal dynamics in Vcmax [25], hampering reliable simulations of photosynthesis–climate interactions with a fine spatial resolution or on a long-term scale. Many studies have demonstrated that the Vcmax changes with both space and time (Figure 4b). Our previous work showed that, compared with GPP using dynamic information on Vcmax derived from leaf chlorophyll content, the conventional method of fixing Vcmax using the calibrated Vcmax or TRY-based Vcmax overestimated the annual GPP of Europe by 0.5 to 2.9 Pg C yr−1 or 5 to 31% and overestimated the interannual increasing GPP trend by 0.007 to 0.01 Pg C yr−2 or 14 to 20%, respectively [28]. Changes in photosynthetic capacity occur since plants acclimate their leaf chemistry in response to climate change, such as global warming and elevated CO2 concentrations [60]. For the limited period of 16 years, the interannual dynamics in Vcmax across Europe had minor impacts on GPP (Figure 4b). However, Vcmax may continue to change on longer time scales due to plant adaptation, especially in light of continuous rising CO2 concentrations and global warming [61]. In this study, the Vcmax change effect on GPP was only based on one typical Vcmax product derived from leaf chlorophyll content. Recently, several global-scale Vcmax products with different time spans and based on different remotely-sensed metrics (e.g., solar-induced chlorophyll fluorescence, SIF) have been distributed [24,25,26]; however, these products have contrasting patterns, which highlights the need for further validation of Vcmax based on time-series experimental studies and the development of mechanistic Vcmax models.

5. Conclusions

By applying a process-based Farquhar GPP model (FGM) with multisource datasets ranging from 2001 to 2016, we showed a widespread and pronounced increase in GPP across Europe during this period. The spatial pattern of land surface greening matched well with the spatial pattern of enhanced GPP. We included spatiotemporal information on leaf photosynthetic capacity (i.e., Vcmax) derived from leaf chlorophyll content in the FGM model. Factorial simulations suggested that the observed land surface greening and rising CO2 concentration tremendously boosted the annual total GPP across Europe. In contrast, the LULCC and enhanced VPD had significant negative impacts on GPP, which were neutralized by the positive effects of temperature warming and radiation brightening. Consequently, the combined impacts of LULCC, land surface greening, CO2 fertilization, and climate change were strongly positive. Changes in Vcmax with both space and time are not well represented in current TBMs and result in uncertainties in GPP estimations. Although the interannual change effect of Vcmax was minor in the limited 16-year study period, considering the spatial and seasonal variations in Vcmax significantly improved GPP estimations at the regional scale. Thus, the process-based model simulation approach developed in this work should improve our understanding of the terrestrial ecosystem photosynthetic response to climate change across Europe.

Supplementary Materials

The following supporting information can be downloaded at https://www.mdpi.com/article/10.3390/rs15051372/s1: Figure S1: Model validation accuracy for nine PFTs: (a) CRO, (b) DBF, (c) SH, (d) EBF, (e) GRA, (f) MF, (g) ENF, and (h) WET; Figure S2: Intercomparison of (a) interannual dynamics in GPP estimated by the FGM and other methods, including one empirical model, four light use efficiency (LUE) models, three machining learning methods, and one process-based biophysical model. (b) Scatter plots between the FGM GPP and other GPP products. As listed in Table S2, the GOSIF GPP product was derived from the empirical relationships between GPP and SIF. The CCW, MOD17, VPM, and GLASS products are estimated based on LUE models. FLUXCOM GPP products are estimated by three machine learning approaches, including an artificial neural network (ANN), the multivariate adaptive regression splines method (MARS), and the random forest method (RF). In addition, one process model-based GPP product (i.e., BEPS) is also included; Table S1. Accuracy of model calibration and validation and the calibrated g1 for nine plant functional types (PFTs); Table S2. Information on nine GPP products for intercomparison.

Author Contributions

Conceptualization, Q.W.; methodology, S.C.; validation, Q.W.; formal analysis, Q.W.; investigation, Q.W.; resources, Q.W.; data curation, Q.W. and X.W.; writing—original draft preparation, Q.W.; writing—review and editing, J.J. and L.W.; visualization, Q.W.; supervision, Q.W.; funding acquisition, Q.W. and J.J. All authors have read and agreed to the published version of the manuscript.

Funding

This research was funded by the National Natural Science Foundation of China (Grant No. 42201381), the open fund of State Key Laboratory of Remote Sensing Science (Grant No. OFSLRSS202209), the Fundamental Research Funds for Beijing University of Civil Engineering and Architecture [Grant No. X21019], the National Key Research and Development Program of China (Grant No. 2021YFE0117500), and the 2020 China-CEEC Joint Education Project of Institutions of Higher Education Project “Ecological Environment Monitoring to Urban Areas along China-Europe Railway based on Remote Sensing and Artificial Intelligence”.

Data Availability Statement

The FGM GPP for Europe at yearly time-resolution has be published online through Zenodo: Qiaoli Wu, & Shaoyuan Chen. (2023). Yearly, 500-m, Gross Primary Production of Europe from 2001 to 2016 [Data set]. In Remote Sensing (Version 1). Zenodo. https://doi.org/10.5281/zenodo.7654606, accessed on 6 December 2022. Part of the FGM GPP for Europe at 8-day time-resolution has be published online through Zenodo: Qiaoli Wu. (2023). 8-day, 500-m Gross Primary Production for Europe from 2001 to 2016 (YEAR_doy: 2001001 to 2004329) (Version V1) [Data set]. Zenodo. https://doi.org/10.5281/zenodo.7654657, accessed on 6 December 2022; Qiaoli Wu. (2023). 8-day, 500-m Gross Primary Production for Europe from 2001 to 2016 (YEAR_doy: 2004337 to 2010073) (Version 1) [Data set]. Zenodo. https://doi.org/10.5281/zenodo.7655301, accessed on 6 December 2022.

Acknowledgments

The authors would like to express their appreciation for the valuable assistance and data support from FLUXNET (https://fluxnet.org/, accessed on 6 December 2022), GLASS LAI, DSR, and GPP products, MODIS LULCC product science team members, National Earth System Science Data Sharing Infrastructure, and National Science & Technology Infrastructure of China (http://www.geodata.cn, accessed on 6 December 2022).

Conflicts of Interest

The authors declare no conflict of interest.

References

  1. Keeling, C.D. The concentration and isotopic abundances of carbon dioxide in the atmosphere. Tellus 1960, 12, 200–203. [Google Scholar] [CrossRef] [Green Version]
  2. IPCC. Global Warming of 1.5 °C; IPCC: Geneva, Switzerland, 2018. [Google Scholar]
  3. Taylor, G.; Tallis, M.J.; Giardina, C.P.; Percy, K.E.; Miglietta, F.; Gupta, P.S.; Gioli, B.; Calfapietra, C.; Gielen, B.; Kubiske, M.E.; et al. Future atmospheric CO2 leads to delayed autumnal senescence. Glob. Chang. Biol. 2008, 14, 264–275. [Google Scholar] [CrossRef]
  4. EEA. Climate Change, Impacts and Vulnerability in Europe, as Indicator-Based Report 12; EEA: Copenhagen, Denmark, 2012.
  5. Marx, A.; Bastrup-Birk, A.; Louwagie, G.; Wugt-Larsen, F.; Biala, K.; Fussel, H.; Kurnik, B.; Schweiger, O.; Settele, J.; Civic, K. Terrestrial ecosystems, soil and forests. In Climate Change, Impacts and Vulnerability in Europe 2016—An Indicator-Based Report; European Environment Agency: Copenhagen, Denmark, 2016; pp. 153–182. [Google Scholar]
  6. Chen, C.; Park, T.; Wang, X.; Piao, S.; Xu, B.; Chaturvedi, R.K.; Fuchs, R.; Brovkin, V.; Ciais, P.; Fensholt, R. China and India lead in greening of the world through land-use management. Nat. Sustain. 2019, 2, 122–129. [Google Scholar] [CrossRef] [PubMed]
  7. Piao, S.; Wang, X.; Park, T.; Chen, C.; Lian, X.; He, Y.; Bjerke, J.W.; Chen, A.; Ciais, P.; Tømmervik, H. Characteristics, drivers and feedbacks of global greening. Nat. Rev. Earth Environ. 2020, 1, 14–27. [Google Scholar] [CrossRef] [Green Version]
  8. Zhu, Z.; Piao, S.; Myneni, R.B.; Huang, M.; Zeng, Z.; Canadell, J.G.; Ciais, P.; Sitch, S.; Friedlingstein, P.; Arneth, A. Greening of the Earth and its drivers. Nat. Clim. Chang. 2016, 6, 791–795. [Google Scholar] [CrossRef]
  9. Zhang, Y.; Song, C.; Band, L.E.; Sun, G.; Li, J. Reanalysis of global terrestrial vegetation trends from MODIS products: Browning or greening? Remote Sens. Environ. 2017, 191, 145–155. [Google Scholar] [CrossRef] [Green Version]
  10. Zhou, L.; Tucker, C.J.; Kaufmann, R.K.; Slayback, D.; Shabanov, N.V.; Myneni, R.B. Variations in northern vegetation activity inferred from satellite data of vegetation index during 1981 to 1999. J. Geophys. Res. Atmos. 2001, 106, 20069–20083. [Google Scholar] [CrossRef]
  11. Myneni, R.B.; Keeling, C.; Tucker, C.J.; Asrar, G.; Nemani, R.R. Increased plant growth in the northern high latitudes from 1981 to 1991. Nature 1997, 386, 698–702. [Google Scholar] [CrossRef]
  12. Chen, S.; Zhang, Y.; Wu, Q.; Liu, S.; Song, C.; Xiao, J.; Band, L.E.; Vose, J.M. Vegetation structural change and CO2 fertilization more than offset gross primary production decline caused by reduced solar radiation in China. Agric. For. Meteorol. 2021, 296, 108207. [Google Scholar] [CrossRef]
  13. Garonna, I.; De Jong, R.; De Wit, A.J.; Mücher, C.A.; Schmid, B.; Schaepman, M.E. Strong contribution of autumn phenology to changes in satellite-derived growing season length estimates across Europe (1982–2011). Glob. Chang. Biol. 2014, 20, 3457–3470. [Google Scholar] [CrossRef]
  14. Buitenwerf, R.; Rose, L.; Higgins, S.I. Three decades of multi-dimensional change in global leaf phenology. Nat. Clim. Chang. 2015, 5, 364–368. [Google Scholar] [CrossRef]
  15. Buitenwerf, R.; Sandel, B.; Normand, S.; Mimet, A.; Svenning, J.C. Land surface greening suggests vigorous woody regrowth throughout European semi-natural vegetation. Glob. Chang. Biol. 2018, 24, 5789–5801. [Google Scholar] [CrossRef] [Green Version]
  16. Jiang, C.; Ryu, Y.; Wang, H.; Keenan, T.F. An optimality-based model explains seasonal variation in C3 plant photosynthetic capacity. Glob. Chang. Biol. 2020, 26, 6493–6510. [Google Scholar] [CrossRef]
  17. Bertolino, L.T.; Caine, R.S.; Gray, J.E. Impact of Stomatal Density and Morphology on Water-Use Efficiency in a Changing World. Front. Plant Sci. 2019, 10, 225. [Google Scholar] [CrossRef] [Green Version]
  18. Gamage, D.; Thompson, M.; Sutherland, M.; Hirotsu, N.; Makino, A.; Seneweera, S. New insights into the cellular mechanisms of plant growth at elevated atmospheric carbon dioxide concentrations. Plant Cell Environ. 2018, 41, 1233–1246. [Google Scholar] [CrossRef] [PubMed]
  19. Woodward, F.I. Climate and Plant Distribution; Cambridge University Press: Cambride, UK; London, UK; New York, NY, USA; New Rochelle, NY, USA; Melbourne, Australia; Sydney, Australia, 1987. [Google Scholar]
  20. Wu, Q.; Song, C.; Song, J.; Wang, J.; Chen, S.; Yang, L.; Xiang, W.; Zhao, Z.; Jiang, J. Effects of leaf age and canopy structure on gross ecosystem production in a subtropical evergreen Chinese fir forest. Agric. For. Meteorol. 2021, 310, 108618. [Google Scholar] [CrossRef]
  21. Chen, J.M.; Ju, W.; Ciais, P.; Viovy, N.; Liu, R.; Liu, Y.; Lu, X. Vegetation structural change since 1981 significantly enhanced the terrestrial carbon sink. Nat. Commun. 2019, 10, 4259. [Google Scholar] [CrossRef] [Green Version]
  22. Farquhar, G.D.; von Caemmerer, S.V.; Berry, J.A. A biochemical model of photosynthetic CO2 assimilation in leaves of C3 species. Planta 1980, 149, 78–90. [Google Scholar] [CrossRef] [PubMed] [Green Version]
  23. Rogers, A.; Medlyn, B.E.; Dukes, J.S.; Bonan, G.; Von Caemmerer, S.; Dietze, M.C.; Kattge, J.; Leakey, A.D.; Mercado, L.M.; Niinemets, Ü. A roadmap for improving the representation of photosynthesis in Earth system models. New Phytol. 2017, 213, 22–42. [Google Scholar] [CrossRef] [Green Version]
  24. He, L.; Chen, J.M.; Liu, J.; Zheng, T.; Wang, R.; Joiner, J.; Chou, S.; Chen, B.; Liu, Y.; Liu, R. Diverse photosynthetic capacity of global ecosystems mapped by satellite chlorophyll fluorescence measurements. Remote Sens. Environ. 2019, 232, 111344. [Google Scholar] [CrossRef] [PubMed]
  25. Wang, J.; Jiang, F.; Wang, H.; Qiu, B.; Wu, M.; He, W.; Ju, W.; Zhang, Y.; Chen, J.M.; Zhou, Y. Constraining global terrestrial gross primary productivity in a global carbon assimilation system with OCO-2 chlorophyll fluorescence data. Agric. For. Meteorol. 2021, 304, 108424. [Google Scholar] [CrossRef]
  26. Alton, P.B. Decadal trends in photosynthetic capacity and leaf area index inferred from satellite remote sensing for global vegetation types. Agric. For. Meteorol. 2018, 250, 361–375. [Google Scholar] [CrossRef] [Green Version]
  27. Pastorello, G.; Trotta, C.; Canfora, E.; Chu, H.; Christianson, D.; Cheah, Y.-W.; Poindexter, C.; Chen, J.; Elbashandy, A.; Humphrey, M. The FLUXNET2015 dataset and the ONEFlux processing pipeline for eddy covariance data. Sci. Data 2020, 7, 225. [Google Scholar] [CrossRef] [PubMed]
  28. Wu, Q.; Chen, S.; Zhang, Y.; Song, C.; Ju, W.; Wang, L.; Jiang, J. Improved Estimation of the Gross Primary Production for Europe by Considering the Spatial and Temporal Changes in Photosynthetic Capacity from 2001 to 2016. Remote Sens. 2023, 15, 1172. [Google Scholar] [CrossRef]
  29. Song, C.; Katul, G.; Oren, R.; Band, L.E.; Tague, C.L.; Stoy, P.C.; McCarthy, H.R. Energy, water, and carbon fluxes in a loblolly pine stand: Results from uniform and gappy canopy models with comparisons to eddy flux data. J. Geophys. Res. Biogeosci. 2009, 114, G04021. [Google Scholar] [CrossRef] [Green Version]
  30. Medlyn, B.E.; Duursma, R.A.; Eamus, D.; Ellsworth, D.S.; Prentice, I.C.; Barton, C.V.; Crous, K.Y.; De Angelis, P.; Freeman, M.; Wingate, L. Reconciling the optimal and empirical approaches to modelling stomatal conductance. Glob. Chang. Biol. 2011, 17, 2134–2144. [Google Scholar] [CrossRef] [Green Version]
  31. Medlyn, B.E.; Duursma, R.A.; Eamus, D.; Ellsworth, D.S.; Colin Prentice, I.; Barton, C.V.M.; Crous, K.Y.; de Angelis, P.; Freeman, M.; Wingate, L. Reconciling the optimal and empirical approaches to modelling stomatal conductance. Glob. Chang. Biol. 2012, 18, 3476. [Google Scholar] [CrossRef] [Green Version]
  32. Friedl, M.; Sulla-Menashe, D. MCD12Q1 MODIS/Terra+ Aqua Land Cover Type Yearly L3 Global 500m SIN Grid V006, NASA EOSDIS Land Processes DAAC [Data Set]. 2019. Available online: https://lpdaac.usgs.gov/products/mcd12q1v006/ (accessed on 20 April 2020).
  33. Xiao, Z.; Liang, S.; Wang, J.; Xiang, Y.; Zhao, X.; Song, J. Long-time-series global land surface satellite leaf area index product derived from MODIS and AVHRR surface reflectance. IEEE Trans. Geosci. Remote Sens. 2016, 54, 5301–5318. [Google Scholar] [CrossRef]
  34. Xiao, Z.; Song, J.; Yang, H.; Sun, R.; Li, J. A 250 m resolution global leaf area index product derived from MODIS surface reflectance data. Int. J. Remote Sens. 2022, 43, 1409–1429. [Google Scholar] [CrossRef]
  35. Xiao, Z.; Liang, S.; Wang, J.; Chen, P.; Song, J. Use of general regression neural networks for generating the GLASS Leaf Area Index Product from Time Series MODIS Surface Reflectance. IEEE Trans. Geosci. Remote Sens. 2014, 52, 209–223. [Google Scholar] [CrossRef]
  36. He, L.; Chen, J.M.; Pisek, J.; Schaaf, C.B.; Strahler, A.H. Global clumping index map derived from the MODIS BRDF product. Remote Sens. Environ. 2012, 119, 118–130. [Google Scholar] [CrossRef]
  37. Croft, H.; Chen, J.M.; Luo, X.; Bartlett, P.; Chen, B.; Staebler, R.M. Leaf chlorophyll content as a proxy for leaf photosynthetic capacity. Glob. Chang. Biol. 2017, 23, 3513–3524. [Google Scholar] [CrossRef] [Green Version]
  38. Lu, X.; Croft, H.; Chen, J.M.; Luo, Y.; Ju, W. Estimating photosynthetic capacity from optimized Rubisco–chlorophyll relationships among vegetation types and under global change. Environ. Res. Lett. 2022, 17, 014028. [Google Scholar] [CrossRef]
  39. Zhang, X.; Wang, D.; Liu, Q.; Yao, Y.; Jia, K.; He, T.; Jiang, B.; Wei, Y.; Ma, H.; Zhao, X. An operational approach for generating the global land surface downward shortwave radiation product from MODIS data. IEEE Trans. Geosci. Remote Sens. 2019, 57, 4636–4650. [Google Scholar] [CrossRef]
  40. Viovy, N. CRUNCEP Version 7-Atmospheric Forcing Data for the Community Land Model. Research Data Archive at the National Center for Atmospheric Research, Computational and Information Systems Laboratory. 2018. Available online: https://doi.org/10.5065/PZ8F-F017 (accessed on 26 February 2023).
  41. Dass, P.; Rawlins, M.A.; Kimball, J.S.; Kim, Y. Environmental controls on the increasing GPP of terrestrial vegetation across northern Eurasia. Biogeosciences 2016, 13, 45–62. [Google Scholar] [CrossRef] [Green Version]
  42. Leuning, R. A critical appraisal of a combined stomatal-photosynthesis model for C3 plants. Plant Cell Environ. 1995, 18, 339–355. [Google Scholar] [CrossRef]
  43. Zhang, Y.; Song, C.; Band, L.E.; Sun, G. No proportional increase of terrestrial gross carbon sequestration from the greening Earth. J. Geophys. Res. Biogeosci. 2019, 124, 2540–2553. [Google Scholar] [CrossRef]
  44. Ciais, P.; Reichstein, M.; Viovy, N.; Granier, A.; Ogée, J.; Allard, V.; Aubinet, M.; Buchmann, N.; Bernhofer, C.; Carrara, A. Europe-wide reduction in primary productivity caused by the heat and drought in 2003. Nature 2005, 437, 529–533. [Google Scholar] [CrossRef] [PubMed]
  45. Friedlingstein, P.; O’sullivan, M.; Jones, M.W.; Andrew, R.M.; Hauck, J.; Olsen, A.; Peters, G.P.; Peters, W.; Pongratz, J.; Sitch, S. Global carbon budget 2020. Earth Syst. Sci. Data 2020, 12, 3269–3340. [Google Scholar] [CrossRef]
  46. National Oceanic and Atmospheric Administration. Trends in Atmospheric Carbon Dioxide. 2021. Available online: http://www.esrl.noaa.gov/gmd/ccgg/trends/ (accessed on 26 February 2023).
  47. Schimel, D.; Stephens, B.B.; Fisher, J.B. Effect of increasing CO2 on the terrestrial carbon cycle. Proc. Natl. Acad. Sci. USA 2015, 112, 436–441. [Google Scholar] [CrossRef] [Green Version]
  48. Walker, A.P.; De Kauwe, M.G.; Bastos, A.; Belmecheri, S.; Georgiou, K.; Keeling, R.F.; McMahon, S.M.; Medlyn, B.E.; Moore, D.J.; Norby, R.J. Integrating the evidence for a terrestrial carbon sink caused by increasing atmospheric CO2. New Phytol. 2021, 229, 2413–2445. [Google Scholar] [CrossRef] [PubMed]
  49. Lee, E.; Zeng, F.-W.; Koster, R.D.; Weir, B.; Ott, L.E.; Poulter, B. The impact of spatiotemporal variability in atmospheric CO2 concentration on global terrestrial carbon fluxes. Biogeosciences 2018, 15, 5635–5652. [Google Scholar] [CrossRef] [Green Version]
  50. Norby, R.J.; DeLucia, E.H.; Gielen, B.; Calfapietra, C.; Giardina, C.P.; King, J.S.; Ledford, J.; McCarthy, H.R.; Moore, D.J.; Ceulemans, R. Forest response to elevated CO2 is conserved across a broad range of productivity. Proc. Natl. Acad. Sci. USA 2005, 102, 18052–18056. [Google Scholar] [CrossRef] [PubMed] [Green Version]
  51. Piao, S.; Sitch, S.; Ciais, P.; Friedlingstein, P.; Peylin, P.; Wang, X.; Ahlström, A.; Anav, A.; Canadell, J.G.; Cong, N. Evaluation of terrestrial carbon cycle models for their response to climate variability and to CO2 trends. Glob. Chang. Biol. 2013, 19, 2117–2132. [Google Scholar] [CrossRef] [Green Version]
  52. Jiang, C.; Ryu, Y. Multi-scale evaluation of global gross primary productivity and evapotranspiration products derived from Breathing Earth System Simulator (BESS). Remote Sens. Environ. 2016, 186, 528–547. [Google Scholar] [CrossRef]
  53. Wenzel, S.; Cox, P.M.; Eyring, V.; Friedlingstein, P. Projected land photosynthesis constrained by changes in the seasonal cycle of atmospheric CO2. Nature 2016, 538, 499–501. [Google Scholar] [CrossRef] [PubMed] [Green Version]
  54. Jiang, C.; Ryu, Y.; Fang, H.; Myneni, R.; Claverie, M.; Zhu, Z. Inconsistencies of interannual variability and trends in long-term satellite leaf area index products. Glob. Chang. Biol. 2017, 23, 4133–4146. [Google Scholar] [CrossRef] [PubMed] [Green Version]
  55. Liu, Y.; Xiao, J.; Ju, W.; Zhu, G.; Wu, X.; Fan, W.; Li, D.; Zhou, Y. Satellite-derived LAI products exhibit large discrepancies and can lead to substantial uncertainty in simulated carbon and water fluxes. Remote Sens. Environ. 2018, 206, 174–188. [Google Scholar] [CrossRef]
  56. Van Der Graaf, S.; Janssen, T.A.J.; Erisman, J.W.; Schaap, M. Nitrogen deposition shows no consistent negative nor positive effect on the response of forest productivity to drought across European FLUXNET forest sites. Environ. Res. Commun. 2021, 3, 125003. [Google Scholar] [CrossRef]
  57. Thompson, R.L.; Broquet, G.; Gerbig, C.; Koch, T.; Lang, M.; Monteil, G.; Munassar, S.; Nickless, A.; Scholze, M.; Ramonet, M. Changes in net ecosystem exchange over Europe during the 2018 drought based on atmospheric observations. Philos. Trans. R. Soc. B 2020, 375, 20190512. [Google Scholar] [CrossRef]
  58. Oliver, R.J.; Mercado, L.M.; Sitch, S.; Simpson, D.; Medlyn, B.E.; Lin, Y.-S.; Folberth, G.A. Large but decreasing effect of ozone on the European carbon sink. Biogeosciences 2018, 15, 4245–4269. [Google Scholar] [CrossRef] [Green Version]
  59. Estel, S.; Kuemmerle, T.; Alcántara, C.; Levers, C.; Prishchepov, A.; Hostert, P. Mapping farmland abandonment and recultivation across Europe using MODIS NDVI time series. Remote Sens. Environ. 2015, 163, 312–325. [Google Scholar] [CrossRef]
  60. Smith, N.G.; Keenan, T.F. Mechanisms underlying leaf photosynthetic acclimation to warming and elevated CO2 as inferred from least-cost optimality theory. Glob. Chang. Biol. 2020, 26, 5202–5216. [Google Scholar] [CrossRef]
  61. Dong, N.; Wright, I.J.; Chen, J.M.; Luo, X.; Wang, H.; Keenan, T.F.; Smith, N.G.; Prentice, I.C. Rising CO2 and warming reduce global canopy demand for nitrogen. New Phytol. 2022, 235, 1692–1700. [Google Scholar] [CrossRef] [PubMed]
Figure 1. Spatial and interannual dynamics in FGM GPP. (a) Sixteen-year averages of European terrestrial GPP (g C m−2 yr−1) in contemporary climate simulated by FGM for vegetated surfaces at a spatial resolution of 500 m × 500 m. (b) Interannual dynamics of total GPP (Pg C yr−1) for different vegetation types. Nonvegetated areas are masked out.
Remotesensing 15 01372 g001
Figure 2. Spatial patterns and interannual trends in the GPP and LAI and corresponding significance levels. (a) Spatial pattern of the linear trend in the annual total GPP from 2001 to 2016. (b) Spatial pattern of the linear trend in the annual mean LAI from 2001 to 2016 based on the GLASS V5 LAI product. (c) Spatial distribution of pixels with significant increasing/decreasing GPP trends. (d) Spatial distribution of pixels with significant increasing/decreasing LAI trends. In (c,d), green and red indicate significant land surface greening and significant land surface browning, respectively (with a significance level of p value < 0.05).
Remotesensing 15 01372 g002
Figure 3. Interannual dynamics of the LAI and GPP for all of the Europe and for different plant functional types. (a) Comparison of interannual trends of annual total GPP based on the FGM and other methods (including BEPS, MOD17, CCW, GLASS V6, VPM, GOSIF, and FLUXCOM RF, MARS, and ANN) and the interannual trend in the mean LAI from 2001 to 2016. (b) Interannual dynamics of the mean LAI based on the GLASS V5 LAI product across the whole study area (including Europe and part of Russia) or only the European mainland (excluding Russia). Interannual dynamics of the mean LAI (c) and GPP (d) for five vegetation types (i.e., forests, shrub, grass, crop, and wetland). The abbreviation LUE in (a) stands for the light use efficiency model. The labels ** and * in (a) represent the interannual GPP trend at significance levels of 0.01 and 0.05, respectively. The GPP unit Tg C in (d) is equivalent to 10−3 Pg C.
Remotesensing 15 01372 g003
Figure 4. Spatial pattern of differences in GPP caused by changes in Vcmax for different vegetation types in different countries. (a) Sixteen-year averages of GPP (g C m−2 yr−1) in contemporary climate simulated by FGM using PFT-specific Vcmax constants. (b) Spatial pattern of annual mean Vcmax and mean seasonality of Vcmax for different PFTs. (c) Difference in GPP due to the two parameterizations in Europe, i.e., GPP in Figure 1a minus GPP in (a). The bar chart in (c) represents the mean difference in GPP caused by changes in Vcmax for different countries. (d) Difference in GPP for five main vegetation types (i.e., forest, shrub, grass, crop, and wet) for different countries caused by changes in Vcmax.
Remotesensing 15 01372 g004
Figure 5. Land use and land cover type across Europe and LULCC and greening effects on GPP. (a) Spatial pattern of LULCC from MCD12Q1 in 2001 and relative area proportions of different land-use types in 2001 and 2016. All permanent ice/snow are masked out. (b) Effects of land cover change and LAI change (i.e., greening effect) on the interannual GPP trend constrained by the “All”, “LULCC1”, “LULCC2”, and “LULCC3” simulations. Model simulations are shown in Table 1.
Remotesensing 15 01372 g005
Figure 6. Climate change effect on GPP. Interannual dynamics of (a) mean downwards solar radiation (DSR) (w m−2), (b) mean air temperature, and (c) vapour pressure deficit (VPD) (Pa). (d) Climate change effect on GPP constrained by the “All”, “CLM1”, “CLM2”, “CLM3”, and “CLM4” simulations. Model simulations are shown in Table 1.
Remotesensing 15 01372 g006
Figure 7. Impacts of interannual changes in Vcmax on GPP. (a) Interannual dynamics of mean Vcmax. (b) Effects of interannual Vcmax change on GPP constrained by the “All” and “PC1” simulations.
Remotesensing 15 01372 g007
Figure 8. Dominant factors driving the interannual dynamics in GPP from 2001 to 2016. (a) Combined effects of LAI change, CO2 fertilization, climate change, and interannual Vcmax change on annual GPP trends constrained by simulation scenarios of the “All”, “LULCC3”, “CO2”, “CLM1”, and “PC1” simulation scenarios. (b) Trends in total GPP simulated by the FGM in ten different simulation scenarios. Model simulations are shown in Table 1. The labels ** and * in (b) represent the GPP interannual trend at significance levels of 0.01 and 0.05, respectively. The R2 in (b) represents the regression coefficient for the interannual GPP trend from 2001 to 2016.
Remotesensing 15 01372 g008
Figure 9. Interannual dynamics of LAI for land cover change areas and stable areas. Stable and change areas in land cover are identified by stacking 16 epochs of MCD12Q1 data together. Pixels were labelled as stable areas only if they were always classified as the same land cover type for 16 years; otherwise, pixels were labelled as change areas.
Remotesensing 15 01372 g009
Table 1. Scenario designs used to quantify the effects of LULCC, climate change, CO2 fertilization, and photosynthesis capacity change on GPP based on the FGM. The symbol ‘△’ indicates that the input variable changes over time, while the symbol ‘▲’ indicates that the parameter is fixed at the level in 2001. The LCC effect is constrained by scenarios “LULCC1” (i.e., All S 1 ) and “LULCC 2” (i.e., All S 2 ). The greening effect is constrained by “LULCC 1” and “LULCC 3” (i.e., All S 3 ). The climate change effect is constrained by scenario “CLM1” (i.e., All S 4 ). The DSR, temperature, and VPD change effects are constrained by scenarios “CLM2” (i.e., All S 5 ), “CLM3” (i.e., All S 6 ), and “CLM4” (i.e., All S 7 ), respectively. The CO2 fertilization effect is constrained by the CO2 scenario (i.e., All S 8 ). The effects of interannual changes in Vcmax on GPP are constrained by the Vcmax effect from PC1 (i.e., All S 9 ).
GroupAllLand Use and Land Cover Change (LULCC)Climate ChangeCO2 FertilizationPhotosynthesis Capacity (PC) Change
Scenario All LULCC1LULCC2 LULCC3CLM1CLM2CLM3CLM4CO2PC1
All All     S 1 All     S 2 All     S 3 All     S 4 All     S 5 All     S 6 All     S 7 All     S 8 All     S 9
SimulationAllS1S2S3S4S5S6S7S8S9
LULC
LAI
DSR
TEMP
VPD
CO2
Vcmax
Disclaimer/Publisher’s Note: The statements, opinions and data contained in all publications are solely those of the individual author(s) and contributor(s) and not of MDPI and/or the editor(s). MDPI and/or the editor(s) disclaim responsibility for any injury to people or property resulting from any ideas, methods, instructions or products referred to in the content.

