1. Introduction
In 2020 the Finnish National Land Survey (FNLS) started producing new, more detailed Airborne Laser Scanning 5p (ALS-5p) data, which corresponding to its name has an average density of at least 5 points per square meter. This is ten times more than the old airborne laser scanning 2008–2019 data publicly available in Finland (FNLS). The Finnish National Heritage Agency, University of Oulu, and Blom Kartta (today Field) are carrying out a study for the potential applications of this new dataset in archaeological analyses, Cultural Resource Management (CRM), and detection of archaeological features within the LIDARK consortium project funded by the Finnish Ministry of Agriculture and Forestry [
1]. Our assessments of the ALS-5p material have already illustrated its high potential for various kinds of archaeological analyses, including the semi-automated detection and measurement of various kinds of archaeological objects [
2,
3].
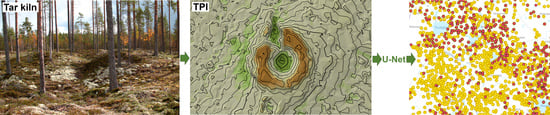
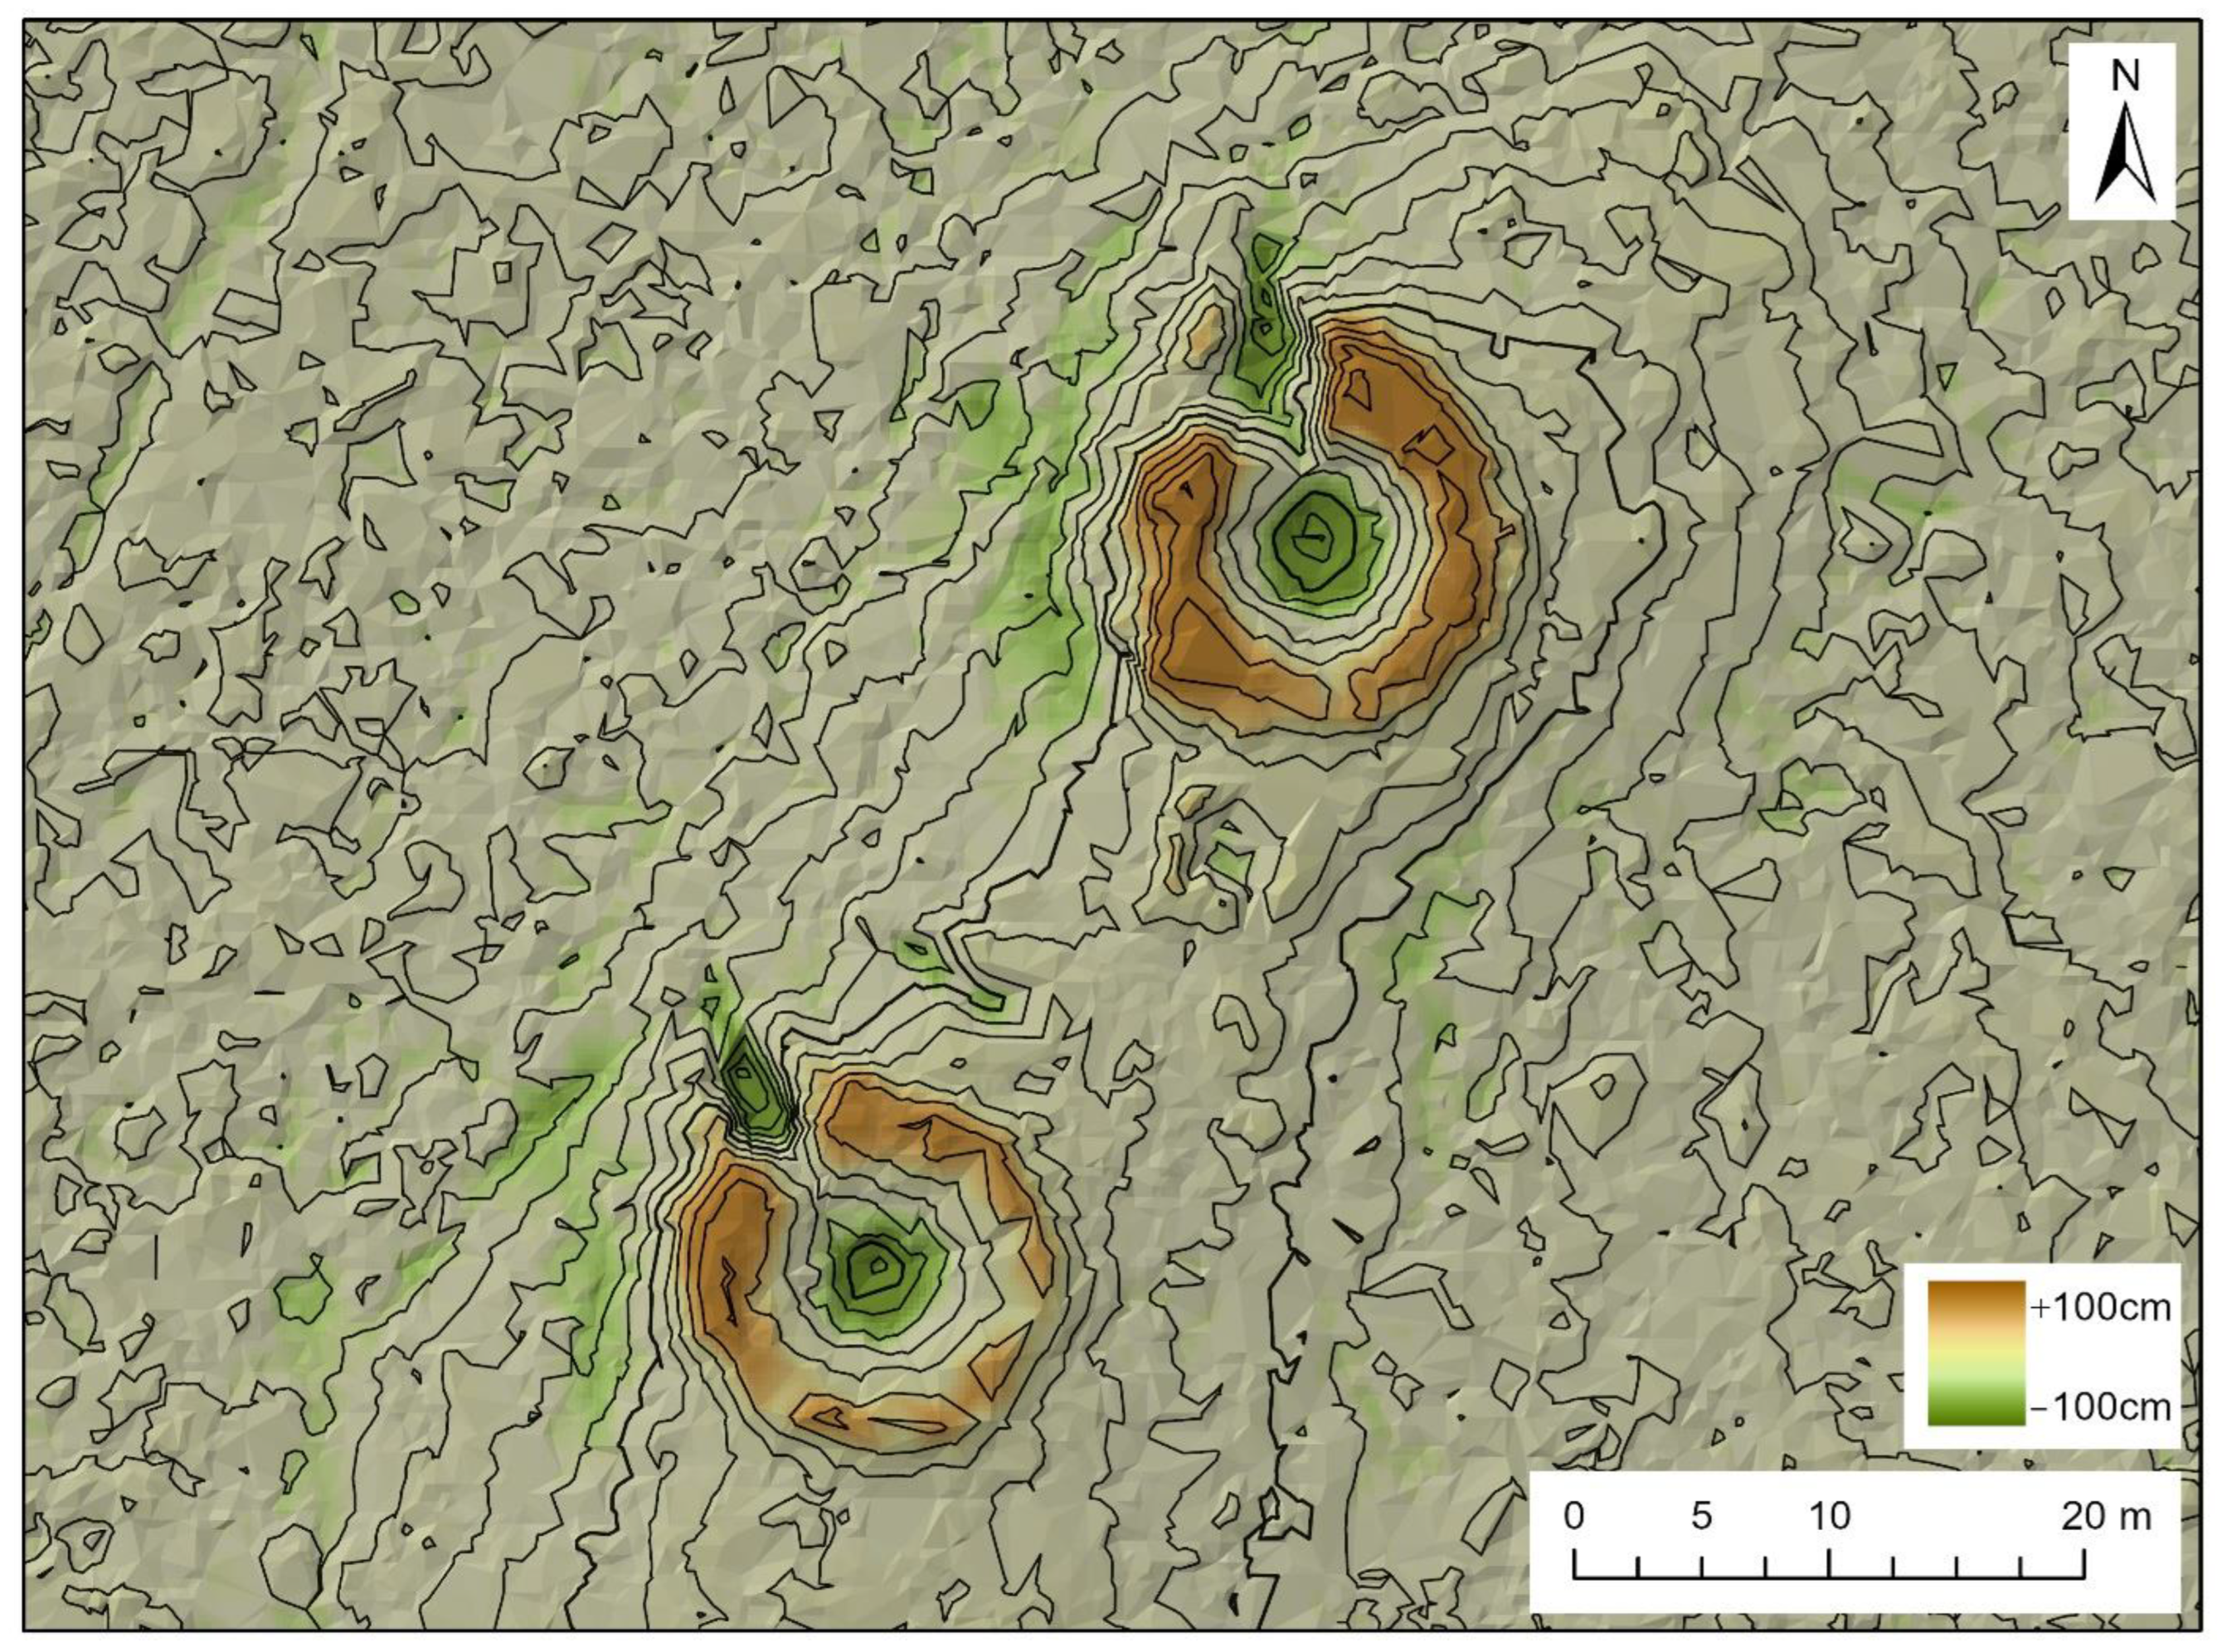
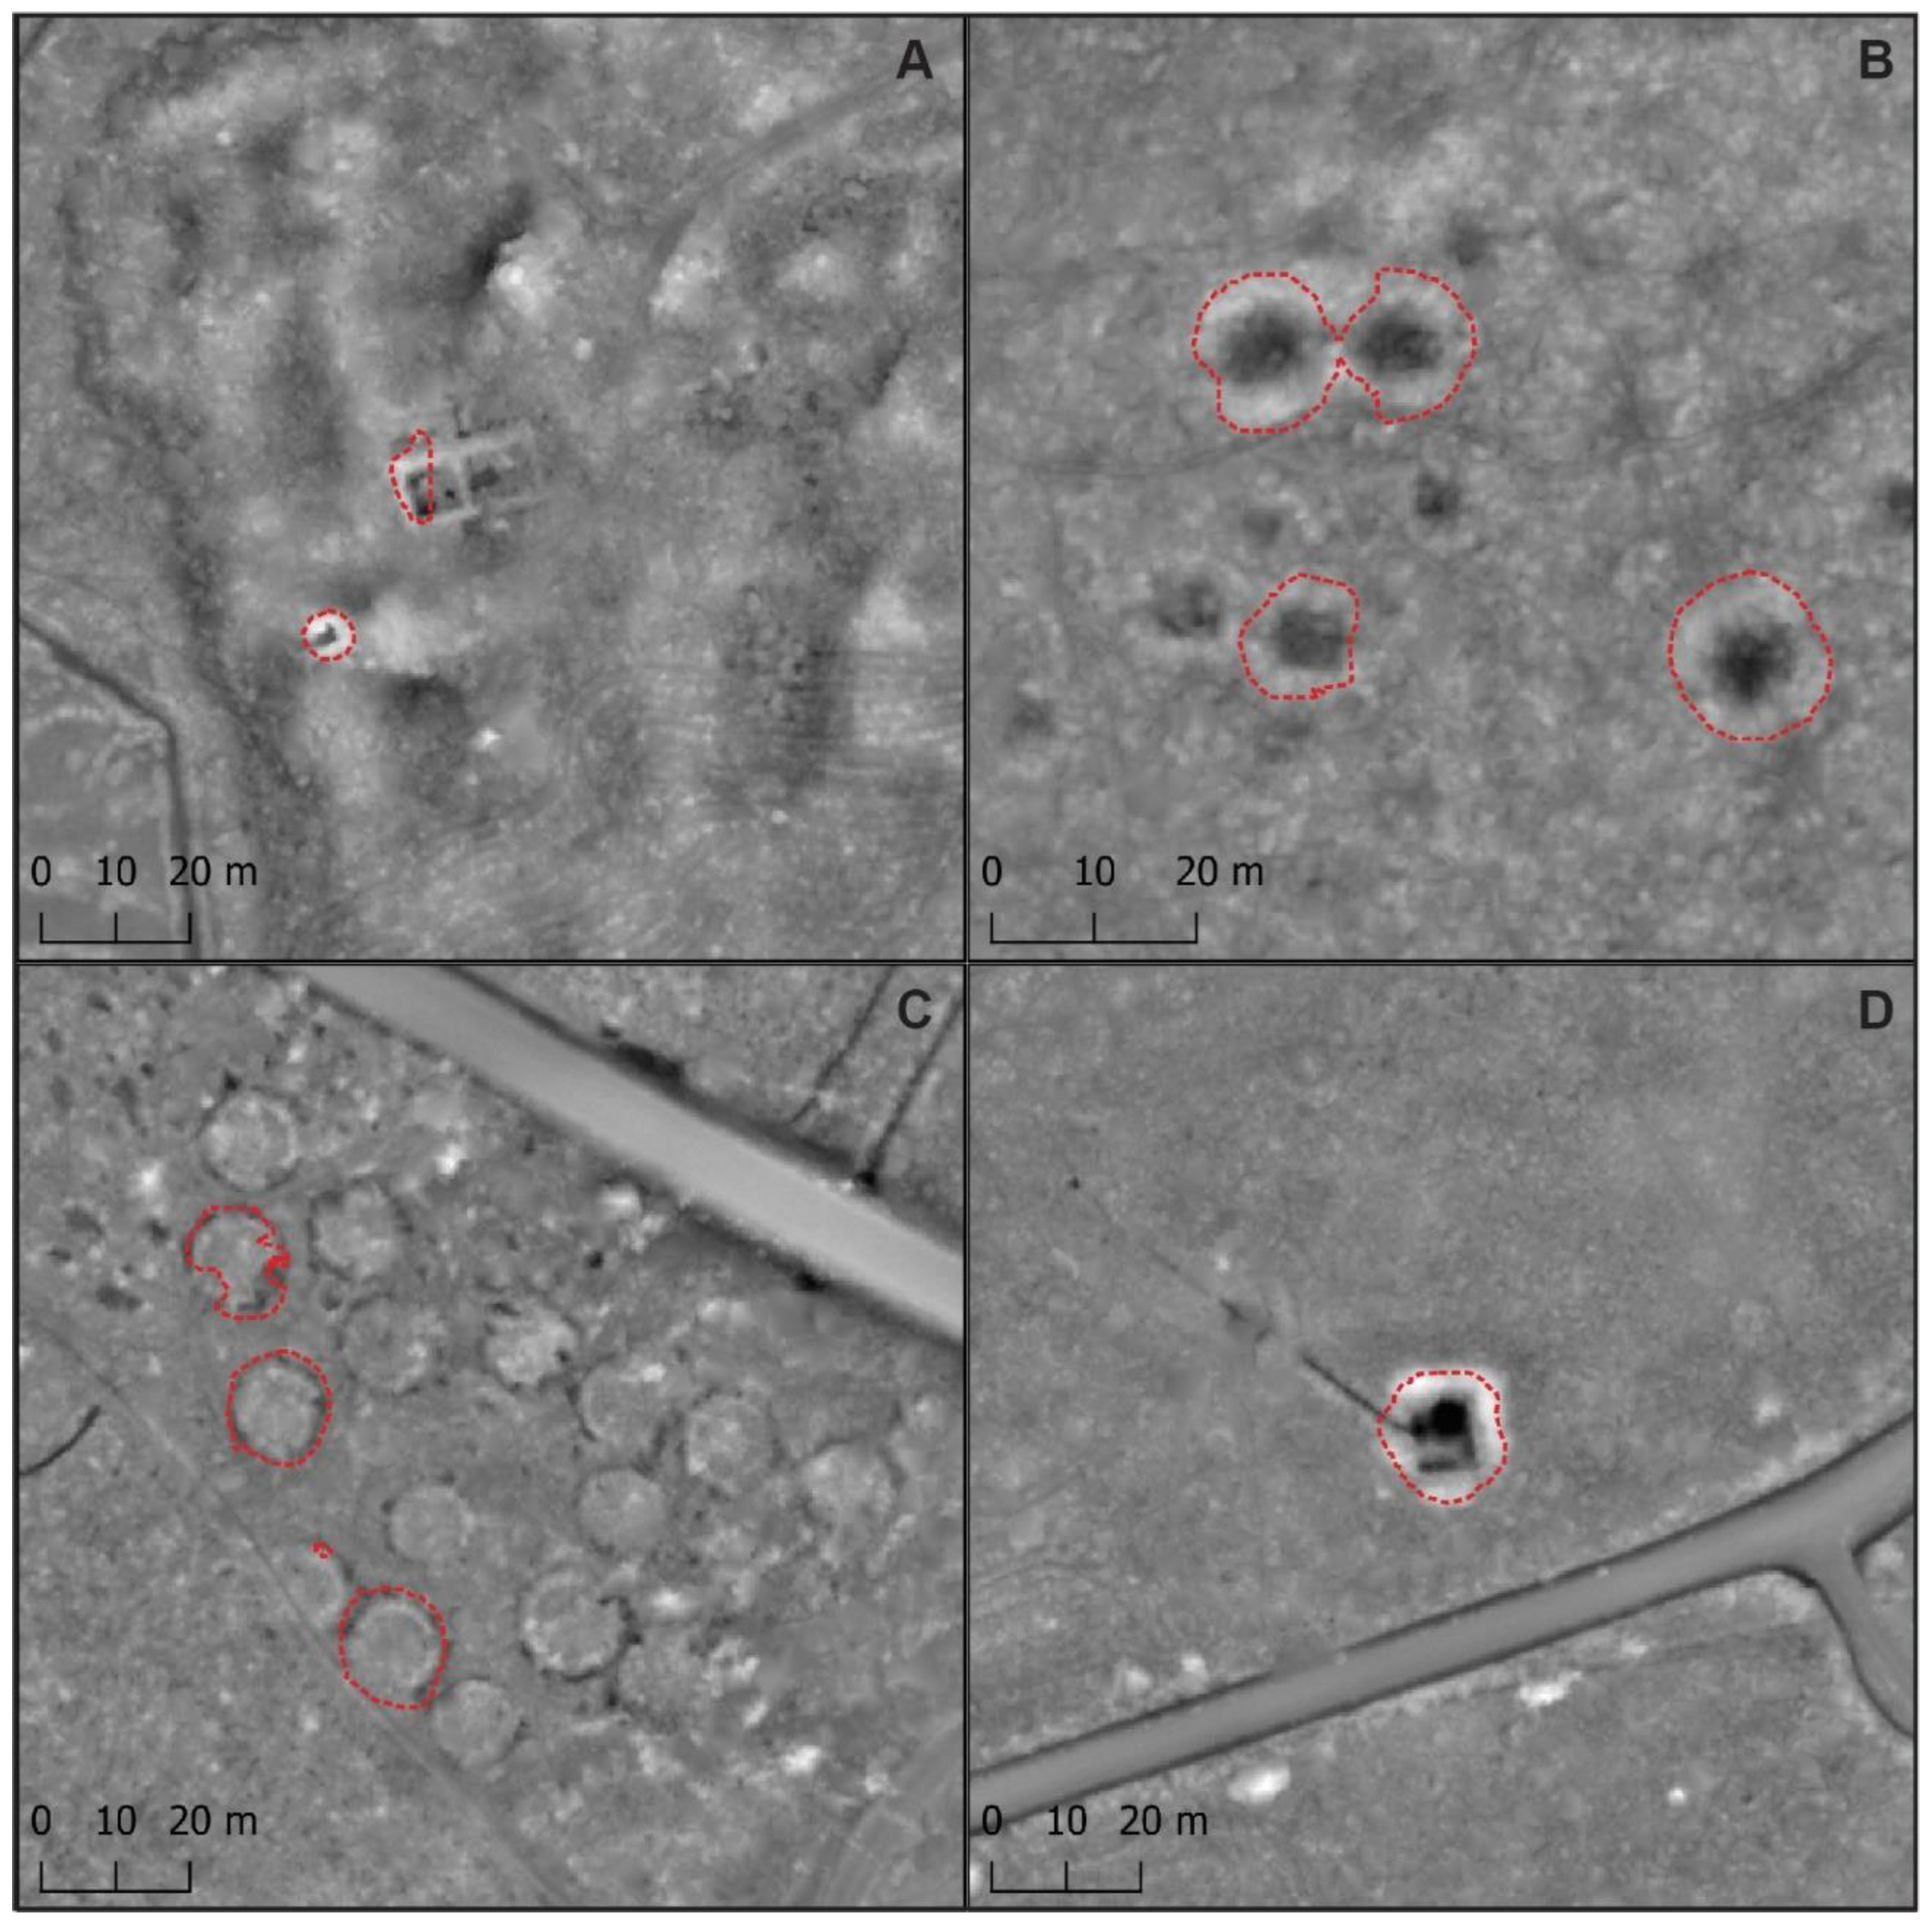
In this article we discuss the development, testing, and first results of using Deep Learning (DL) and a Convolutional Neural Networks (CNN) U-Net-based algorithm for detecting some of the most common and yet most understudied archaeological features in the Finnish boreal taiga forest based on the ALS-5p datasets, namely tar production kilns. These have some distinctive characteristics that make them especially suitable for feature detection (
Figure 1 and
Figure 2). This approach has not been used previously in the country [
4,
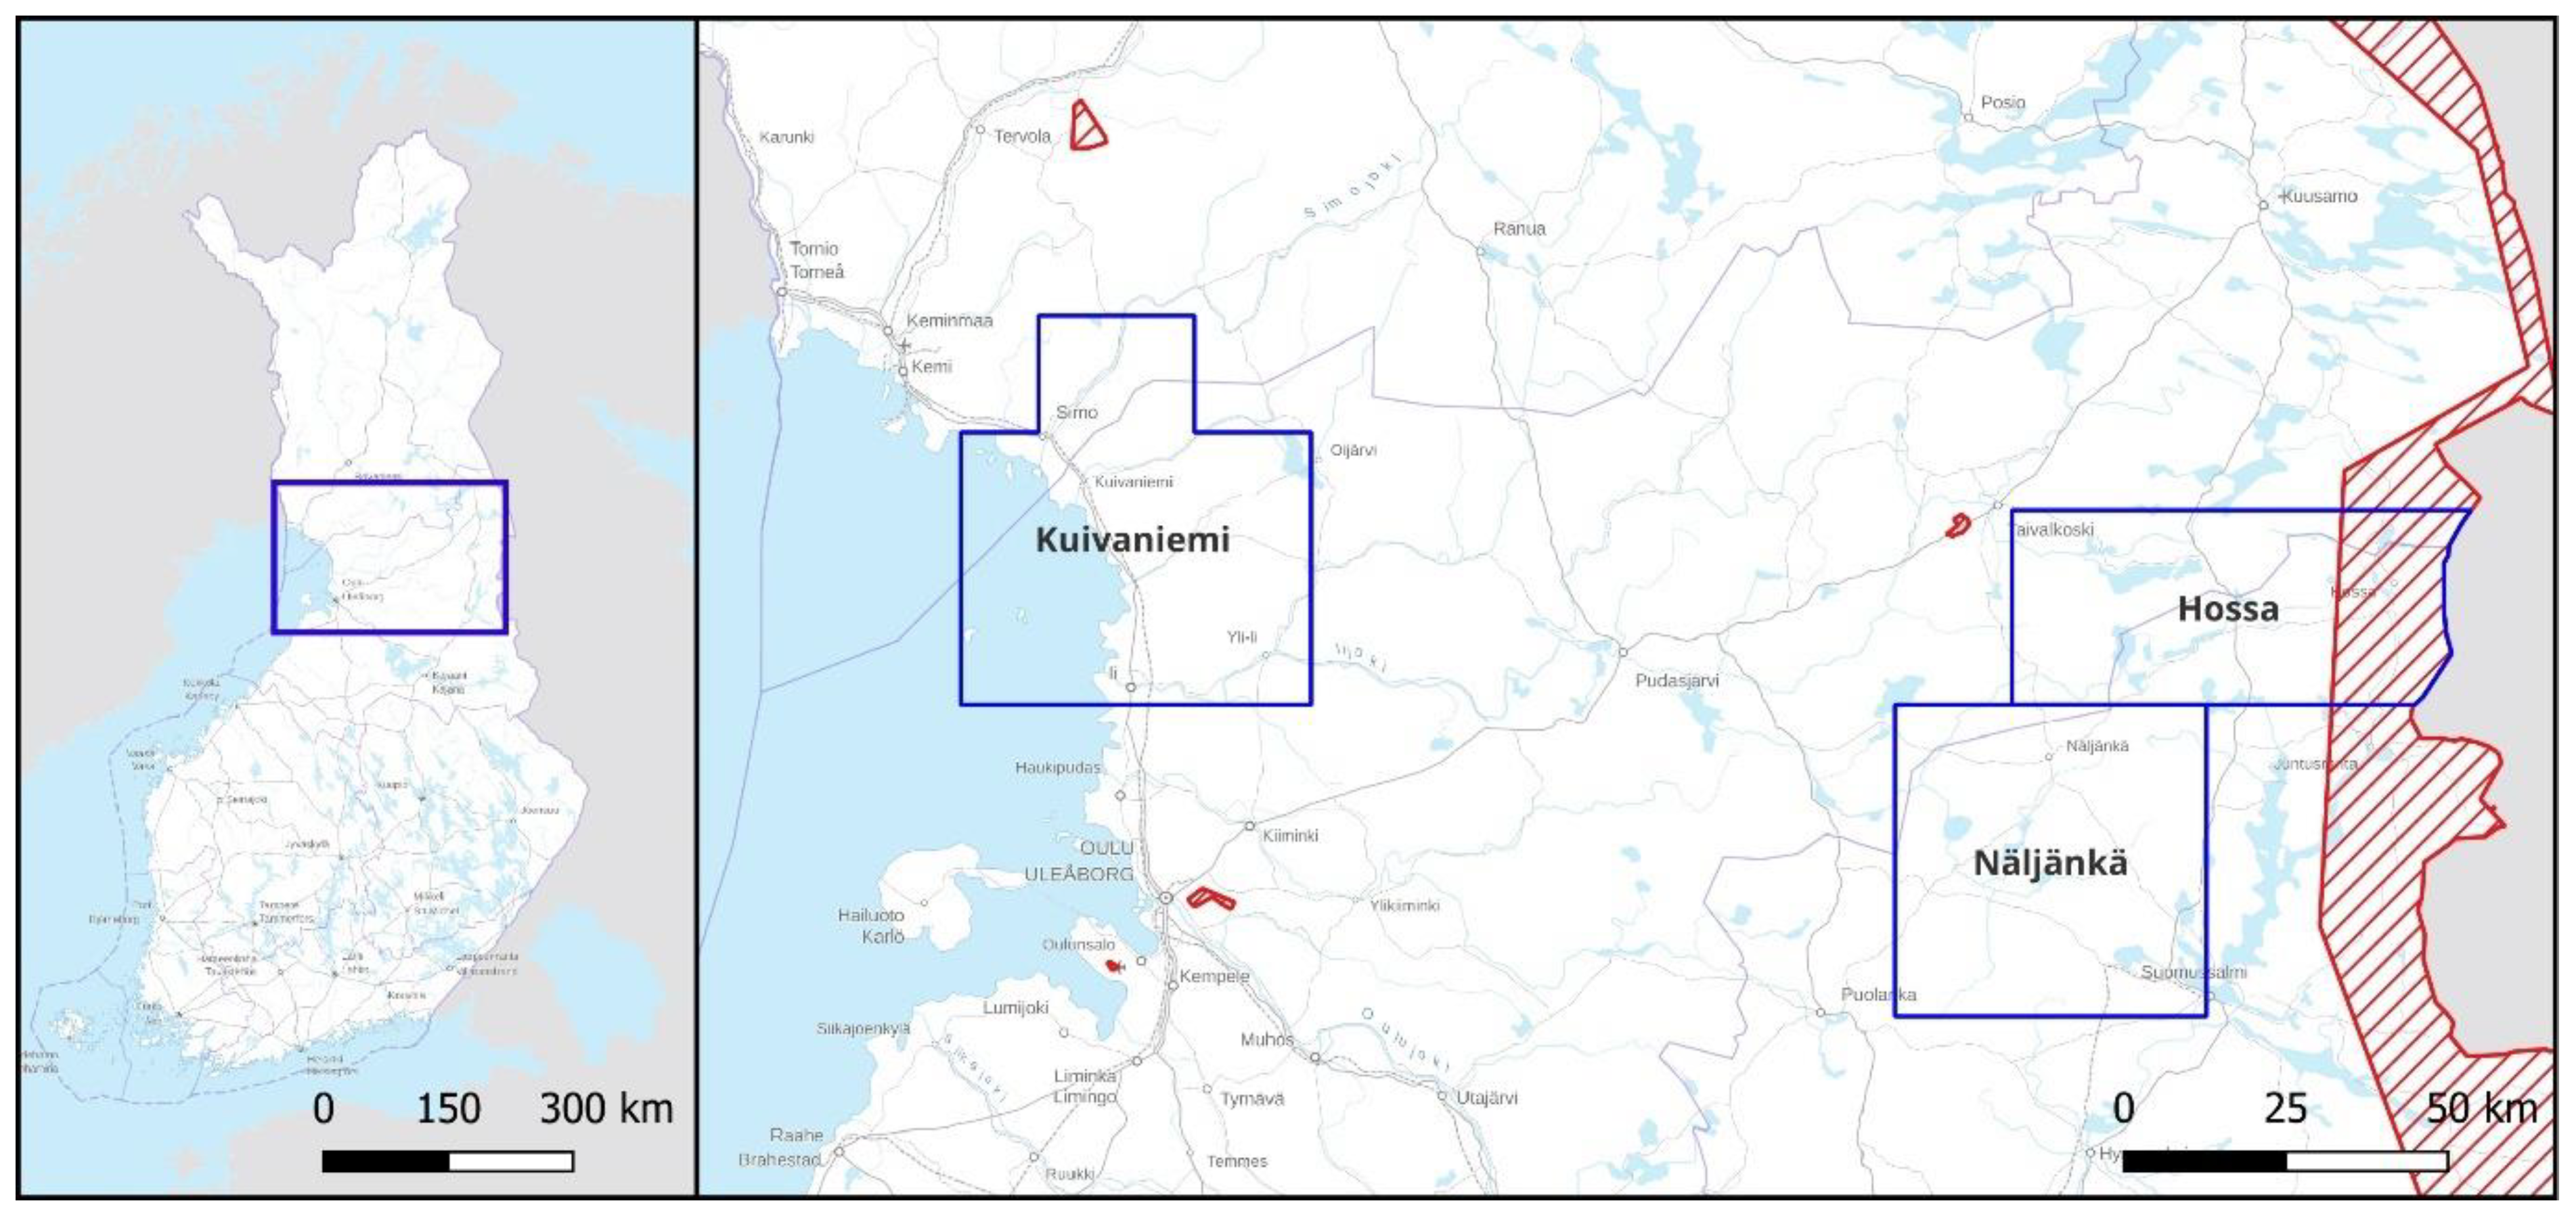
5]. As our test cases, we have used three Airborne Laser Scanning (ALS) production areas that the FNLS flew in 2020 and 2021, Näljänkä, Kuivaniemi and Hossa, all situated in northern Finland but in differing environmental and land use settings (
Figure 3). In this process the Näljänkä area was used for training the detection algorithm, and Kuivaniemi and Hossa for evaluating its performance. All the areas turned out to be very productive for the detection of kiln-like features from the ALS data.
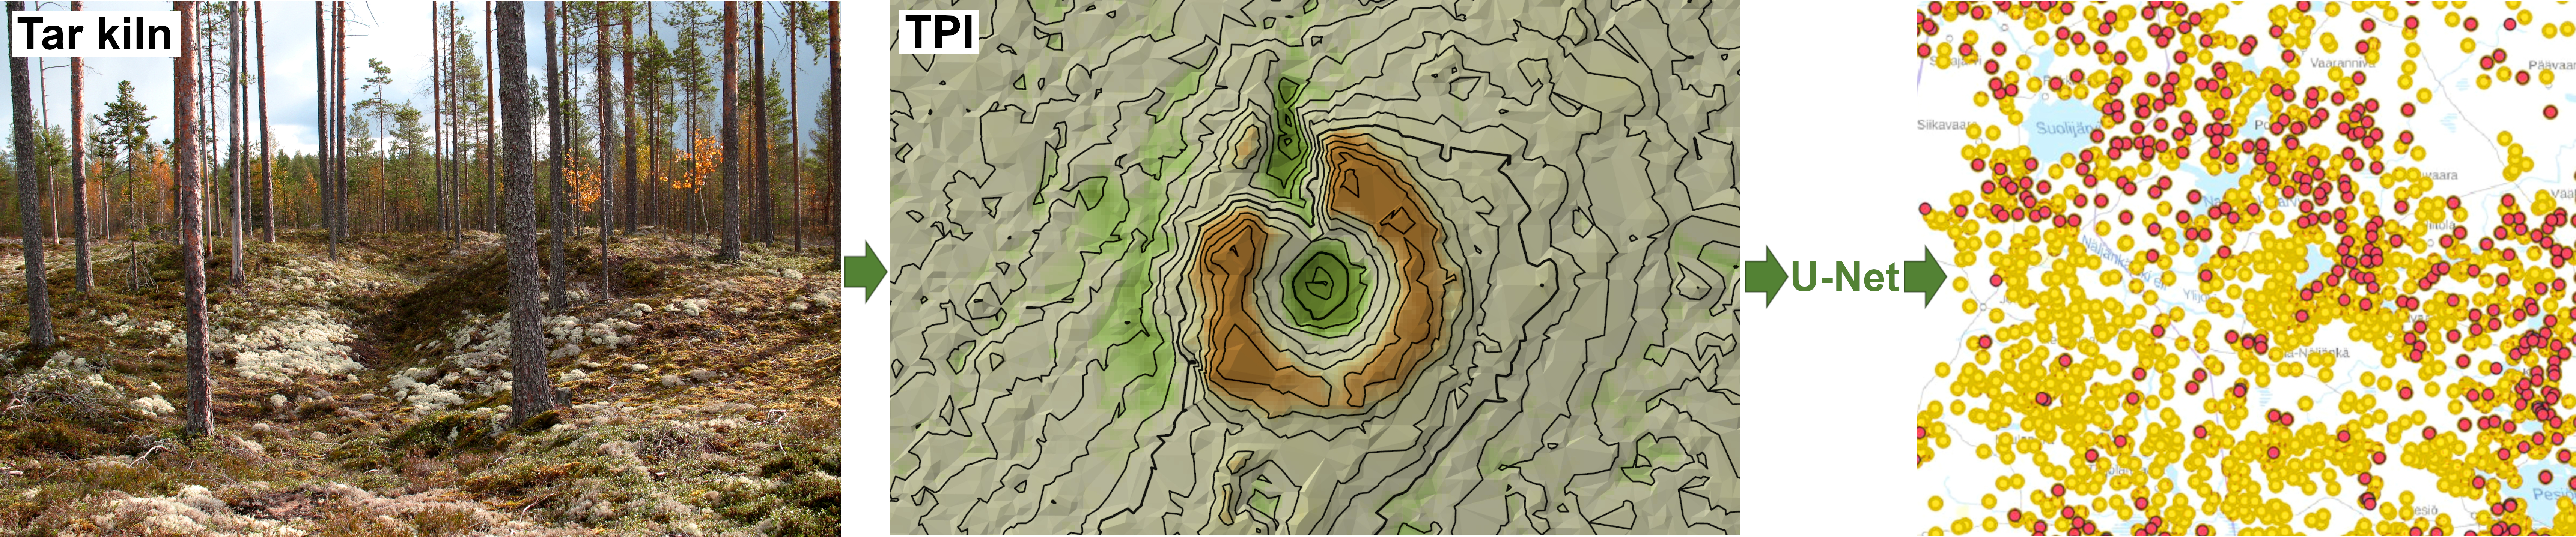
Tar kilns are amongst the most widespread archaeological features in Finland, especially in the northeastern part of the country (
Figure 1 and
Figure 2) [
5]. This mirrors the importance of tar production and export for the Swedish and Finnish economy in the 16th–20th centuries—Finland was part of Sweden until 1809, becoming thereafter momentarily part of the Russian Empire until 1917. Historical accounts report that the tar burning had widespread environmental and ecological impacts, for example due to the high demand for firewood that caused deforestation and changed forest compositions. However, the long-term ecological effects of these activities remain little studied. At the same time, tar kilns are among the least studied and most poorly known archaeological features in the country, largely owing to their general prevalence and commonness in Finnish forests. They were virtually ignored by archaeologists until the 2010s, and owing to that there is very little information beyond the historical and ethnographic accounts [
6,
7,
8], even regarding most fundamental issues like the chronology and typology of tar production kilns [
4].
This is also true more widely in a global perspective [
9]. Most of the recent archaeological activity in this respect has focused on the (semi-)automatic detection of charcoal kilns, also known as relict charcoal hearths, from ALS data [
10,
11,
12,
13,
14,
15,
16,
17,
18]. The research focusing on tar kilns, on the other hand, is limited to a single recent contribution [
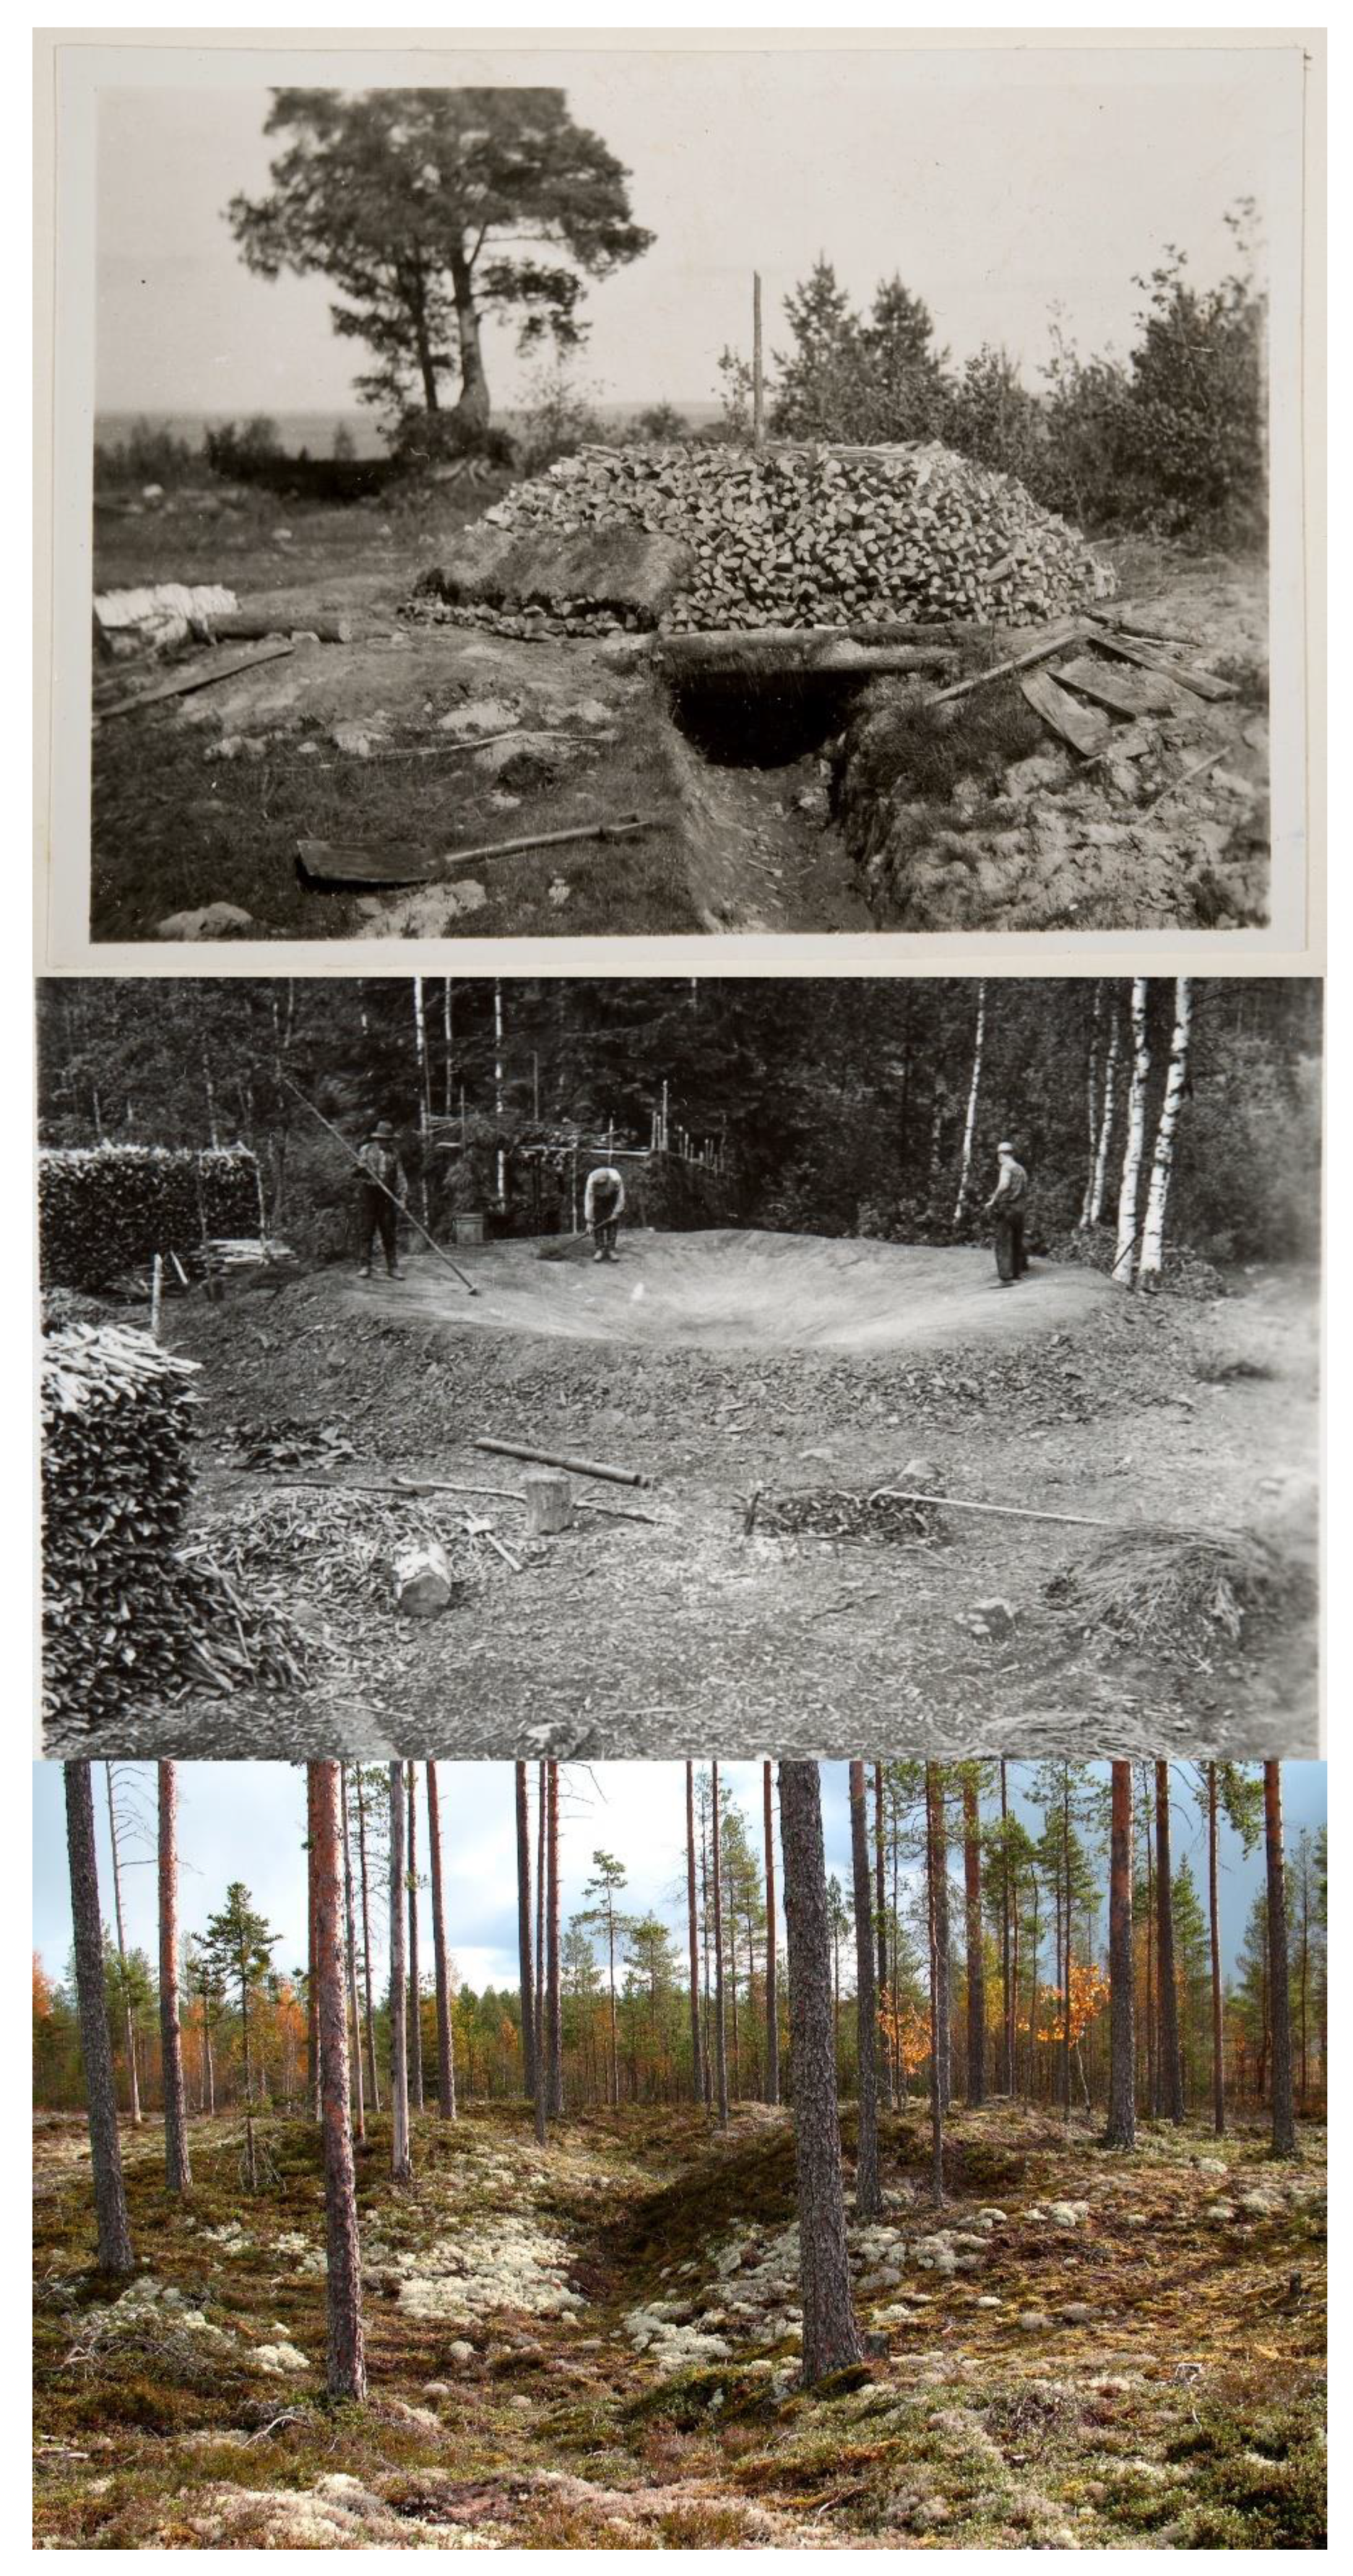
9]. Yet tar kilns have common characteristics both as their own group and together with charcoal kilns that make them especially suitable for detecting. Tar kiln features have a stereotypically round footprint with a central pit and an outlet trench that runs to one side (
Figure 1 and
Figure 2). The outlet trench was originally used to run out the produced tar into barrels on the downhill side, traditionally through a recurrently used wooden pipe. Contrary to their counterparts located and studied by archaeologists in the US [
9], Finnish tar kilns customarily lack trench surrounding the kiln (
Figure 1 and
Figure 2).
In the following we describe first our study areas and the tar kiln data previously known from them, and then the used methods, algorithm development, and the detection results. Lastly, we put forth some remarks about the tar kilns as an archaeological feature type in the Finnish context, and about the effects that the semi-automated detection will have on their identification, number and researchability. In addition, we briefly assess the impact of these novel research methods on the rewriting-in-progress of the Finnish Antiquities Act.
2. Materials and Methods
2.1. Study Areas and the Previously Known Tar Kilns
For the algorithm development we chose three entire ALS-5p production areas from northern Finland, Näljänkä, Kuivaniemi and Hossa (user licenses MML 15920/05 00 00/2021, MML 43580/05 00 00/2020 and MML 46881/05 00 00/2022)—the first two were among the first made available by the FNLS in 2020, and the last became available the following year. Of these Näljänkä covers 2304 km2, Kuivaniemi 2760 km2 and Hossa 2004 km2. These areas are outwardly analogous, especially regarding the landcover that consists dominantly of coniferous and mixed forest as well as bogs and mires, with relatively very agrarian or urban land use. However, as we wanted to examine how the geomorphology and land use impact the detectability of archaeological features, some distinct differences can also be pointed out. Näljänkä and Hossa, located near the eastern border of Finland, belong to the supra-aquatic region left untouched by the successive marine stages that followed the last glaciation. Then again, Kuivaniemi located by the Bothnian Bay in the west has undergone a sequence of subaquatic stages. These differences have impacted the local geomorphology and ecology and influenced the land use. Agriculture and animal husbandry have been practiced for centuries in the river valleys of the Kuivaniemi area, whereas forest-related sources of subsistence have prevailed in Näljänkä and Hossa.
The supra-aquatic region of Hossa is located adjacent to Näljänkä in the northeast. It is a sparsely populated region and has very little land use beyond some logging in its vast boreal pine forest dotted with numerous lakes. The eastern edge of the Hossa area forms the border zone with Russia and for this reason its easternmost quarter (500.754 km2), approximately 13–19 km wide strip, is sanctioned by the Territorial Surveillance Act (755/2000) limiting the gathering and distribution of aerial photographs or geospatial data. For this reason, the FNLS has scaled down the resolution of the respective LiDAR data from 5 points/m2 to 0.3 points/m2. While not necessarily obstructing the successful operation of the detection algorithm, it most certainly was expected to pose a challenge to the interpretation of the results. Thus, as the area is an interesting case regarding the capabilities of our algorithm, a summary of the respective results and interpretations are presented below.
Before the analyses presented here, some tar and charcoal kilns were known from the study areas in both the Finnish Heritage Agency (FHA) and FNLS registers. Of these, the latter registry is more extensive regarding tar kilns due to recent survey program of cultural heritage in Finnish state-owned forests carried out by Metsähallitus, the authority responsible for their maintenance: 743 in Näljänkä, 92 in Kuivaniemi and 553 in Hossa. However, the FNLS register is in part based on a citizen science approach where non-professionals have been reporting their chance tar kiln finds in the woods. A previous study focusing on the tar kilns from the Lake Pesiöjärvi sub-region that forms the SE corner of the Näljänkä study area, carried out based on visual inspection, showed that many of the reported tar kilns in the heritage registers are in fact misidentified charcoal kilns, many of which result from input by non-professionals [
5]. This turned out to be true also with the previously registered tar kiln identifications in the Hossa area. In addition, Ikäheimo’s study proposed a notable increase in the number of tar kilns for the Näljänkä area, based on the nearly four times increase in their number in the Lake Pesiöjärvi sub-region in southeast Näljänkä [
5].
2.2. Generating DEMs and DEM Variants
The new FNLS-generated ALS-5p data is distributed as 1 x 1 km tiles [
3]. The material has not been made available to the general public, but a license can be applied for professional use, while one can freely obtain a downgraded version of it from an FNLS download service (see
https://tiedostopalvelu.maanmittauslaitos.fi/tp/kartta?lang=en, accessed on 6 January 2023). These FNLS point clouds have been automatically pre-classified, of which only ground points (class 2) were used in the production process [
2]. First, a DEM was created from each ALS-5p tile by sampling a TIN (Triangulated Irregular Network) based on the irregularly spaced points into a raster. By experimenting, we settled on the 25 cm resolution that is well aligned with the 5 points/m
2 density and shows a nice level of detail on archaeological features.
For the DEM production, we used LAStools’ las2dem function, with 25 cm DEM resolution, a maximum triangle distance of 50 meters, and a 50 m overlap to neighbouring ALS-5p-tiles. DEM smoothing was also tested using LAStools’ las2dem and lasgrid functions and TerraScan’s smooth points, model keypoints, and thin points options, but no significant enhancement of detection was observed, and therefore no smoothing was applied in the final algorithm.
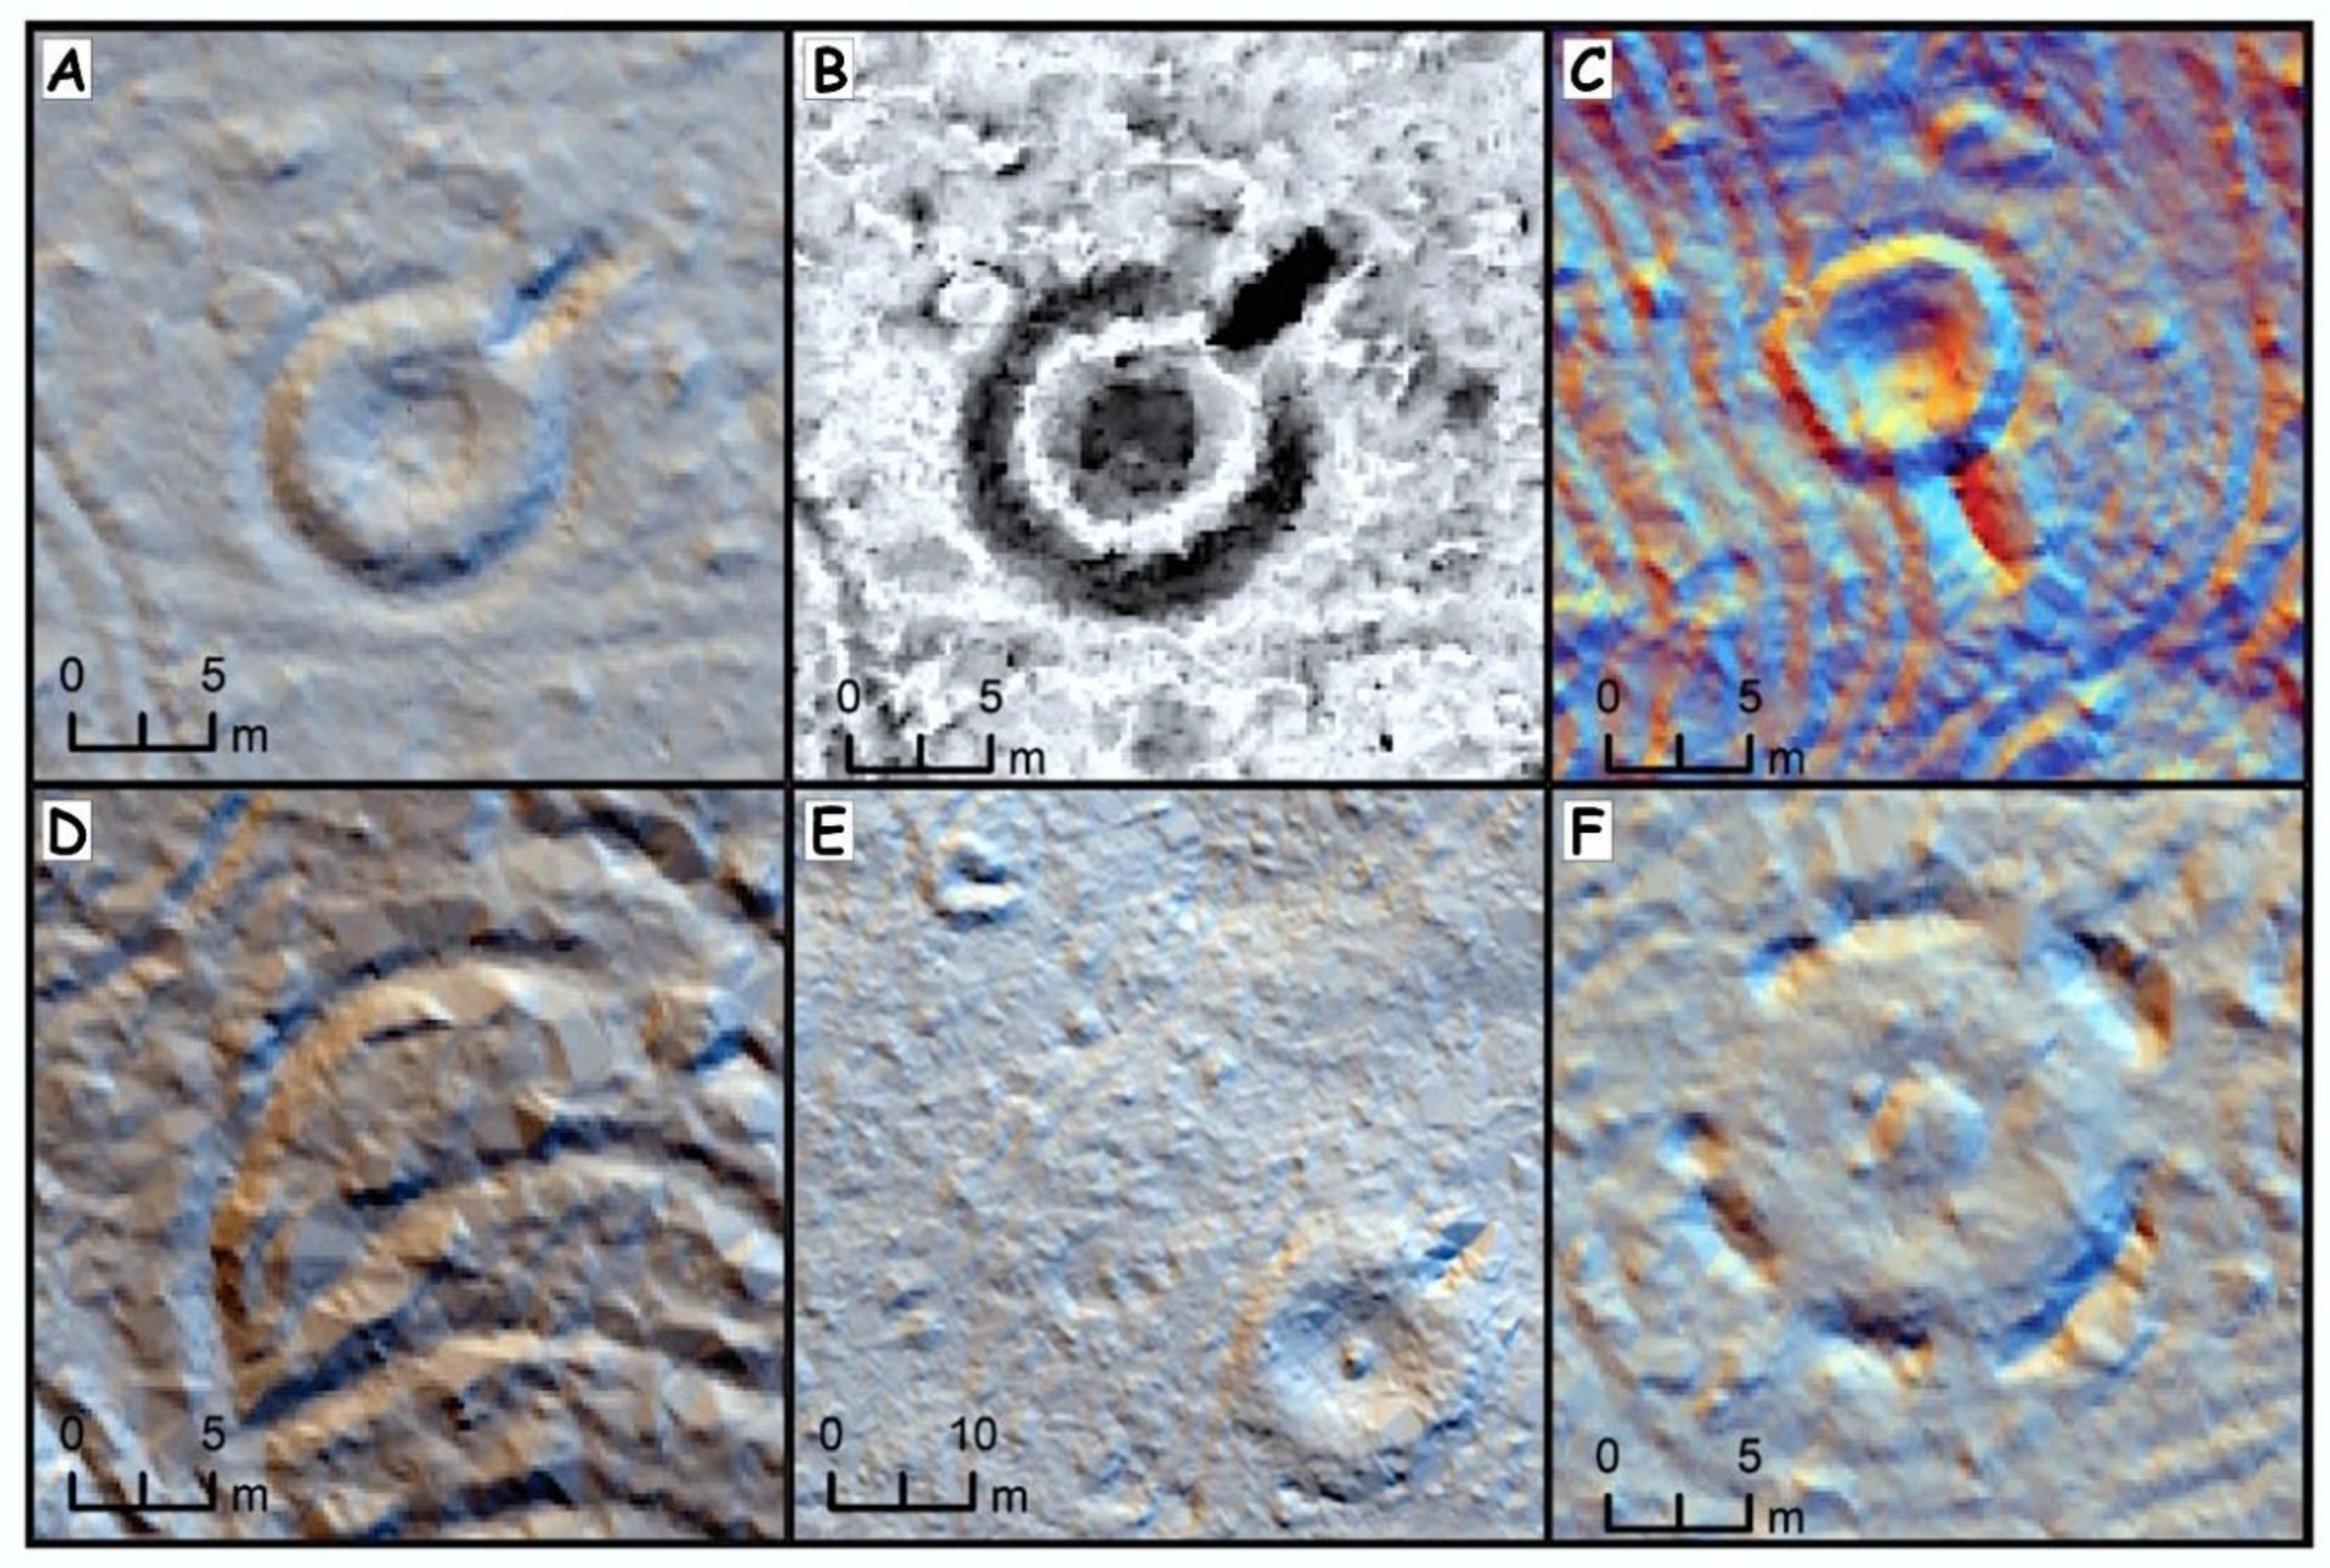
DEMs were created with two goals in mind; firstly as input for the detection algorithms; and secondly, for visualisation of the terrain as background for maps and for on screen quality check of the detection results. For visualizations we experimented with both traditional and multidirectional analytical hillshading, as well as the various outputs generated with the open source Relief Visualization Toolbox [
19,
20]. For example, Local Dominance, Simple Local Relief Models, Positive and Negative Openness, Slope Gradient and Sky-View Factor (SVF) were all tested (
Figure 2) [
5]. For visual inspection of archaeological features and detection results, a combination of Multidirectional Hillshade and SVF was primarily used, augmented by the other layers and orthophotos.
After experimenting with the various visualizations, we settled on using the Topographic Position Index (TPI) as an input for the algorithm development and detection. TPI was created with a Python Numpy routine developed by Zoran Čučković [
21] (
Figure 4 and
Figure 5). The advantage of using the Numpy routine to calculate TPI is the ability to run it on GPU using the Pytorch, which leads to much faster processing times. TPI visualisation illustrates how enclosed or exposed each raster cell is compared to its surroundings, by subtracting from the elevation of the assessed cell the average elevation of the cells within a predeterminate radius. Thus, the cells that are higher than their surroundings get positive values and the ones that are lower get negative values [
22,
23,
24]. The 25 cm DEM resolution was maintained here, but to assess the effects of the radius we tested several settings—namely 5, 10, 20, 30 and 40 cells—in the analyses. The most promising TPI setting in highlighting relevant characteristics in the terrain for analysing and detecting tar production kilns turned out to be the radius of 30 cells; in other words, 7.5 meters (
Figure 4).
The average size of the FNLS ALS-5p-production areas is about 2281 km2, and each includes about 2550 1 × 1 km tiles. With our current setup consisting of a Lenovo Thinkstation P340 Core i7 3.8 GHz with 128 MB RAM and NVIDIA Quadro RTX 4000 8GB GPU, the generation of the LAS-DEM conversion runs at about 550 tiles per hour, taking on average about 4.5 h, and the TPI production runs at about 400 tiles per hour and takes on average about 6 h per production area.
2.3. Deep Learning and Algorithm Development
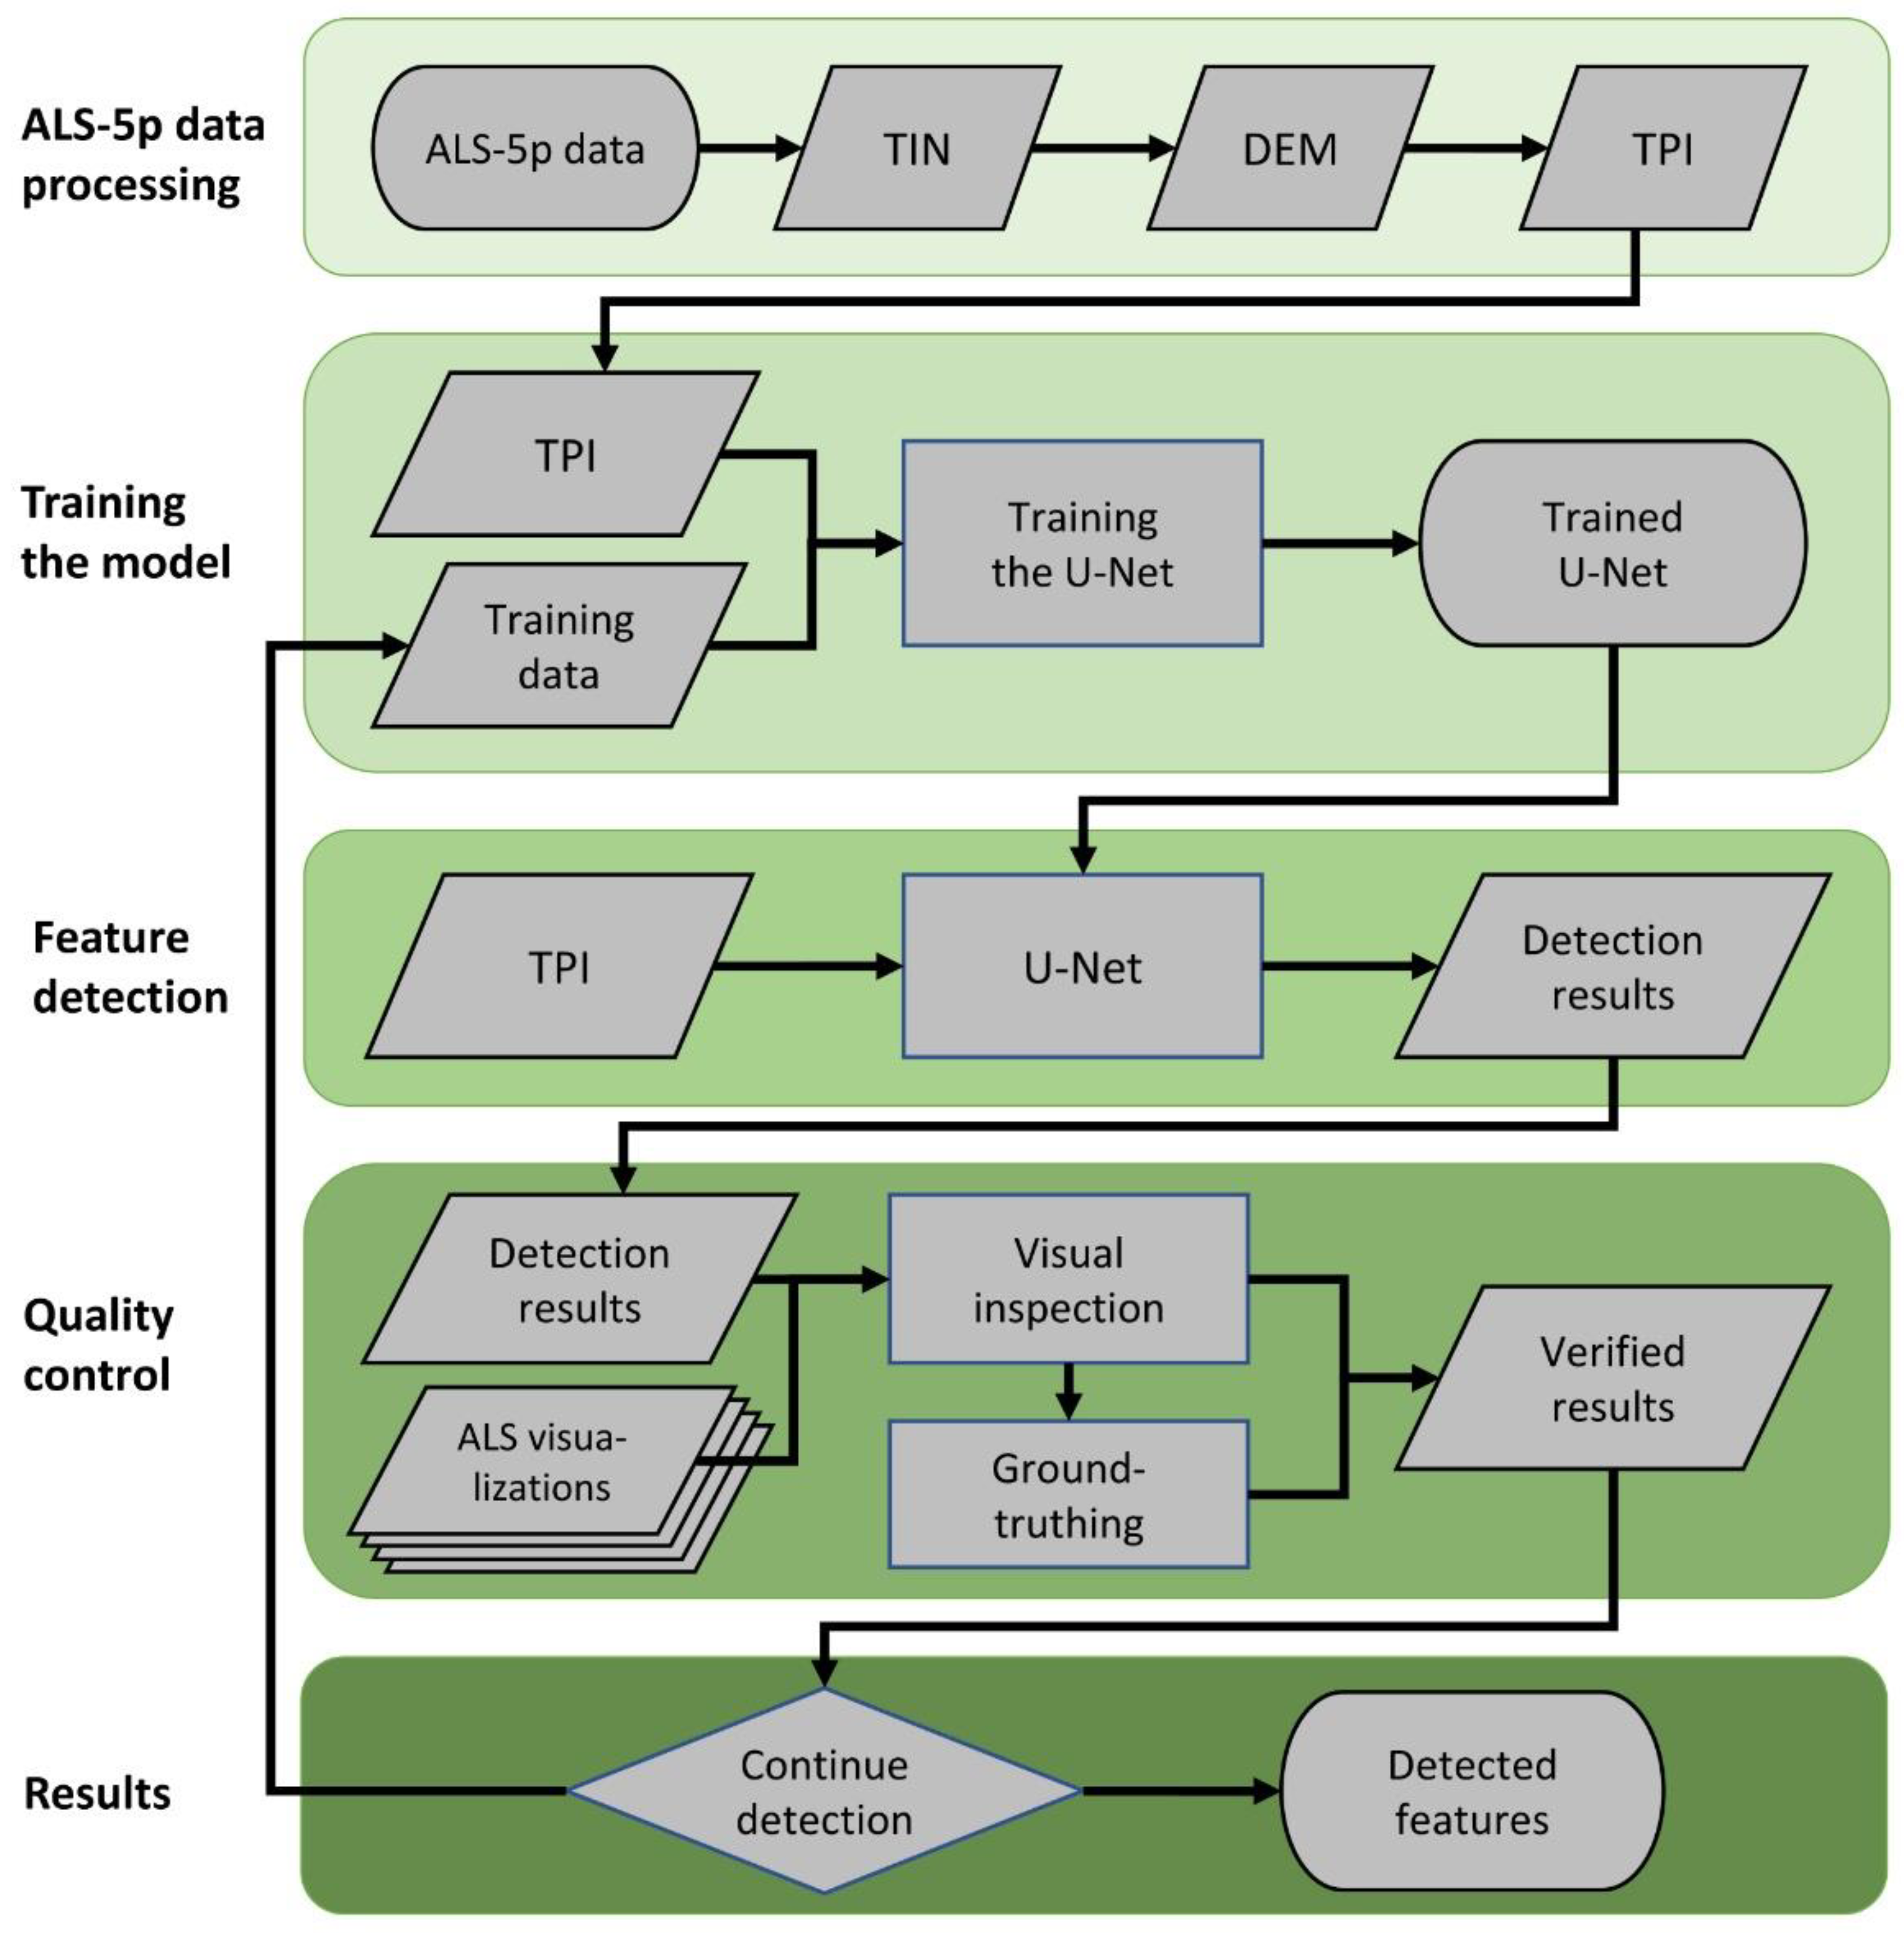
For detection of archaeological features, a convolutional neural network-based U-Net algorithm was developed using semantic segmentation in the Python Keras deep learning environment that applies the TensorFlow machine learning platform (
Figure 5) [
25,
26]. A neural network is a set of weights connected in a structure that information is being sent through, and these weights are adjusted to solve the classification objective. The semantic segmentation approach uses a convolutional neural network (CNN) to predict the class of every single pixel in an image. Convolutions are filters that are applied to input information to find patterns that can be used to understand the information in relation to the classification objectives. Deep learning is then applied when these convolutions are extracted based on derivatives of the original information. U-Net is named after the shape of the overall structure, where the image information is processed down in resolution, and then up again to the full image size, forming a U-curve [
27].
For each ALS-5p tile in the data, a TPI visualisation was generated and then cut into smaller tiles that could be processed by the U-Net. The tile size depends on the available GPU-memory, and should not be too small, as otherwise the background context will be lost. After experimenting, an image tile size of 512 × 512 pixels, with 25 cm resolution and 50% overlap, was selected as a good compromise for assessing the tar kilns, in terms of both the level of detail and background information in the images. This corresponds to a spatial footprint of 128 × 128 meters.
For each image tile, a raster mask based on the vector representation of the training data is stored in tandem with the image. This can include both true and false objects to train the model further. True objects will get positive mask pixels, while false objects will stay negative. When a stack of randomly centred image-mask pairs is generated for each object in the training data, they go through an augmentation process where they are flipped according to their x and y axes. Altogether six images were used of each object in the training dataset, and the processed image pairs were then split randomly into the training (80%) and validation datasets (20%). According to their names, the training dataset is used for training the model, whereas the validation dataset is used for assessing the performance of the model with known archaeological features not used in the training. This gives a better picture of the performance of the model and of its generalization potential to other datasets.
The U-Net model is trained in so-called epochs. Each epoch means one training cycle of the model by going through the training data one time, after which its performance is tested against the validation dataset. During the modelling, its performance gets better to a point, after which it starts to get weaker owing to over-adjusting. We used Intersect-over-Union (IoU) to measure the model performance. IoU illustrates how accurately the predictions produced by the model mirror the masks in the training data. This is calculated by dividing the area shared by the polygon masks in the training data and those produced by the model with their total summed area. The training was continued until the performance of the model did not improve in the ten previous epochs, or at the latest after 200 epochs. The model that showed the best performance when compared with the validation data was then selected for further use. Hyperparameters used in the model are shown in the
Table 1.
During the development both the model and the training data were advanced iteratively by repeating the process of enhancing them based on the results acquired from the previous training cycle. In this case, the first cycle used the training data with about 400 tar kilns and 100 other features, which were mostly generated in a pilot study based on visual inspection of part of the area around the Lake Pesiöjärvi [
5]. After each cycle the features detected by the model were visually inspected and classified into one of the following categories: true, unclear, and false. Based on these validated detections the training data was augmented with the newly detected tar kilns and a sample of the false detections. This process was repeated for three iterations in the Näljänkä study area, after which it was concluded that further iterations would not notably improve the results [
18]. Changes in the model between iterations were mostly small adjustments, mainly enhancing the detection of features located on the borders of ALS-5p tiles.
The prediction result from the binary semantic segmentation is expressed as a heatmap of probability pixels for which, in this case, the Sigmoid activation delivered a range from 0 to 1. To convert the results to a more useable format, values above 0.5 were vectorized as polygons in a shapefile format (*.shp) that is widely used in storing geospatial information. For each polygon, the mean probability value of the encircled pixels and their area were stored as the attribute values. In post-processing, it became apparent that not only did the algorithm occasionally assign several polygons to a single feature, but a single polygon could also contain several features. To reduce the group of multiple identifications, a Python script for merging such partial identifications was developed, instead of mechanically removing all the polygons falling below a pre-agreed area threshold, as carried out by Suh et al. [
16].
After running the three cycles in the Näljänkä area to develop the model, its performance and potential for generalization and application in other areas was assessed using the Kuivaniemi and Hossa ALS-5p production areas that had not been used in the training. The detection process was repeated in these test areas following the above-described steps.
The detection algorithm runs about 110–120 tiles in an hour, taking about 22–23 h per production area. As a rough estimate for the whole workflow starting from the ALS-5p point cloud to the completed detection, our processing time is at the moment bit over 30 h. On average one could estimate that one production area can be processed in about a day. However, then of course comes the quality control of the detection results, firstly on screen and then the ground truthing of at least some observations in the field. Altogether it seems that a good estimate for this whole process, including the fieldwork, is little over one month per ALS-5p production area (
Table 2).
3. Results
In the following we describe the results from the study areas, first from the Näljänkä area and then from the Kuivaniemi and Hossa areas. Here we place emphasis on the characteristics related to the useability and performance of the developed algorithm based on screen truthing and ground truthing of the detection results. Interpretational aspects related to the tar kilns and other features will be discussed in detail in our future contributions.
3.1. Results from the Näljänkä Study Area
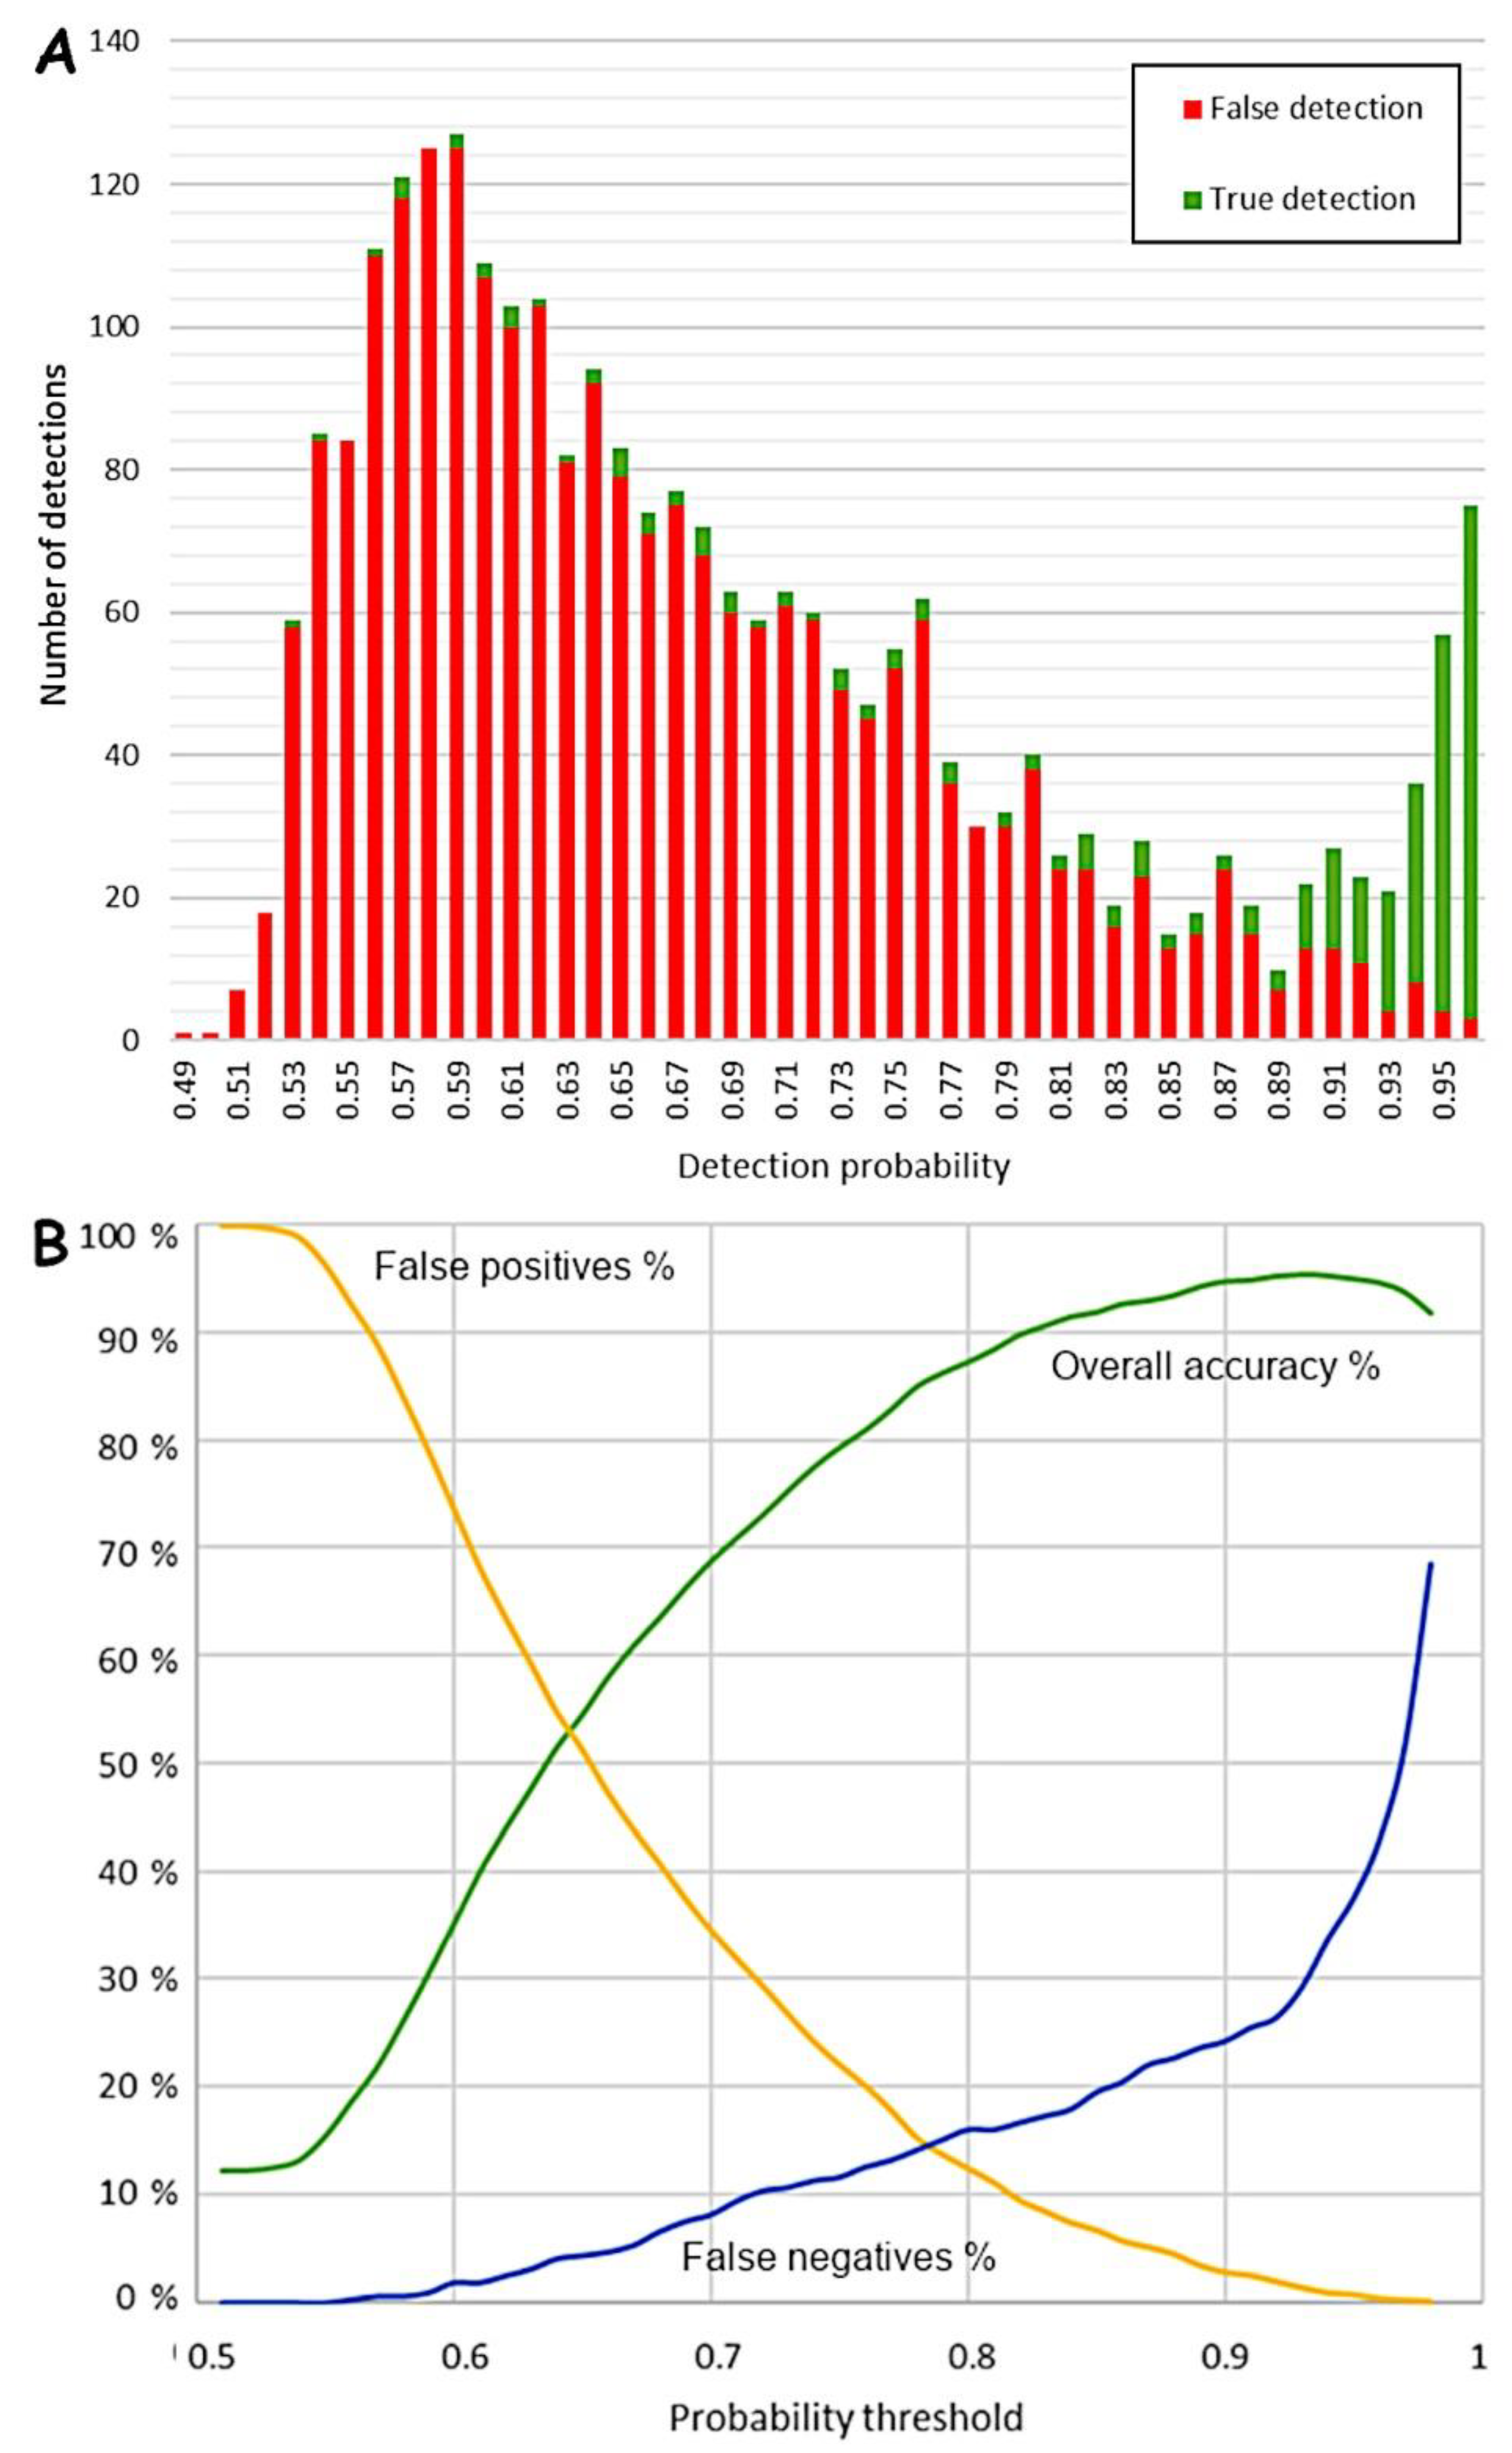
After three cycles of training, predicting, and evaluation of the results, an overall accuracy of 93% was reached, as can be seen from
Table 3 presenting some commonly used accuracy metrics from each study area. The percentage of false positives, or detections that are not tar kilns, is relatively low, at only 3%. The percentage of false negatives is a bit higher, namely 9% (
Table 3). False negatives are real tar kilns that were not detected by the algorithm.
Table 4 shows the confusion matrix of classification for Näljänkä and the other study areas.
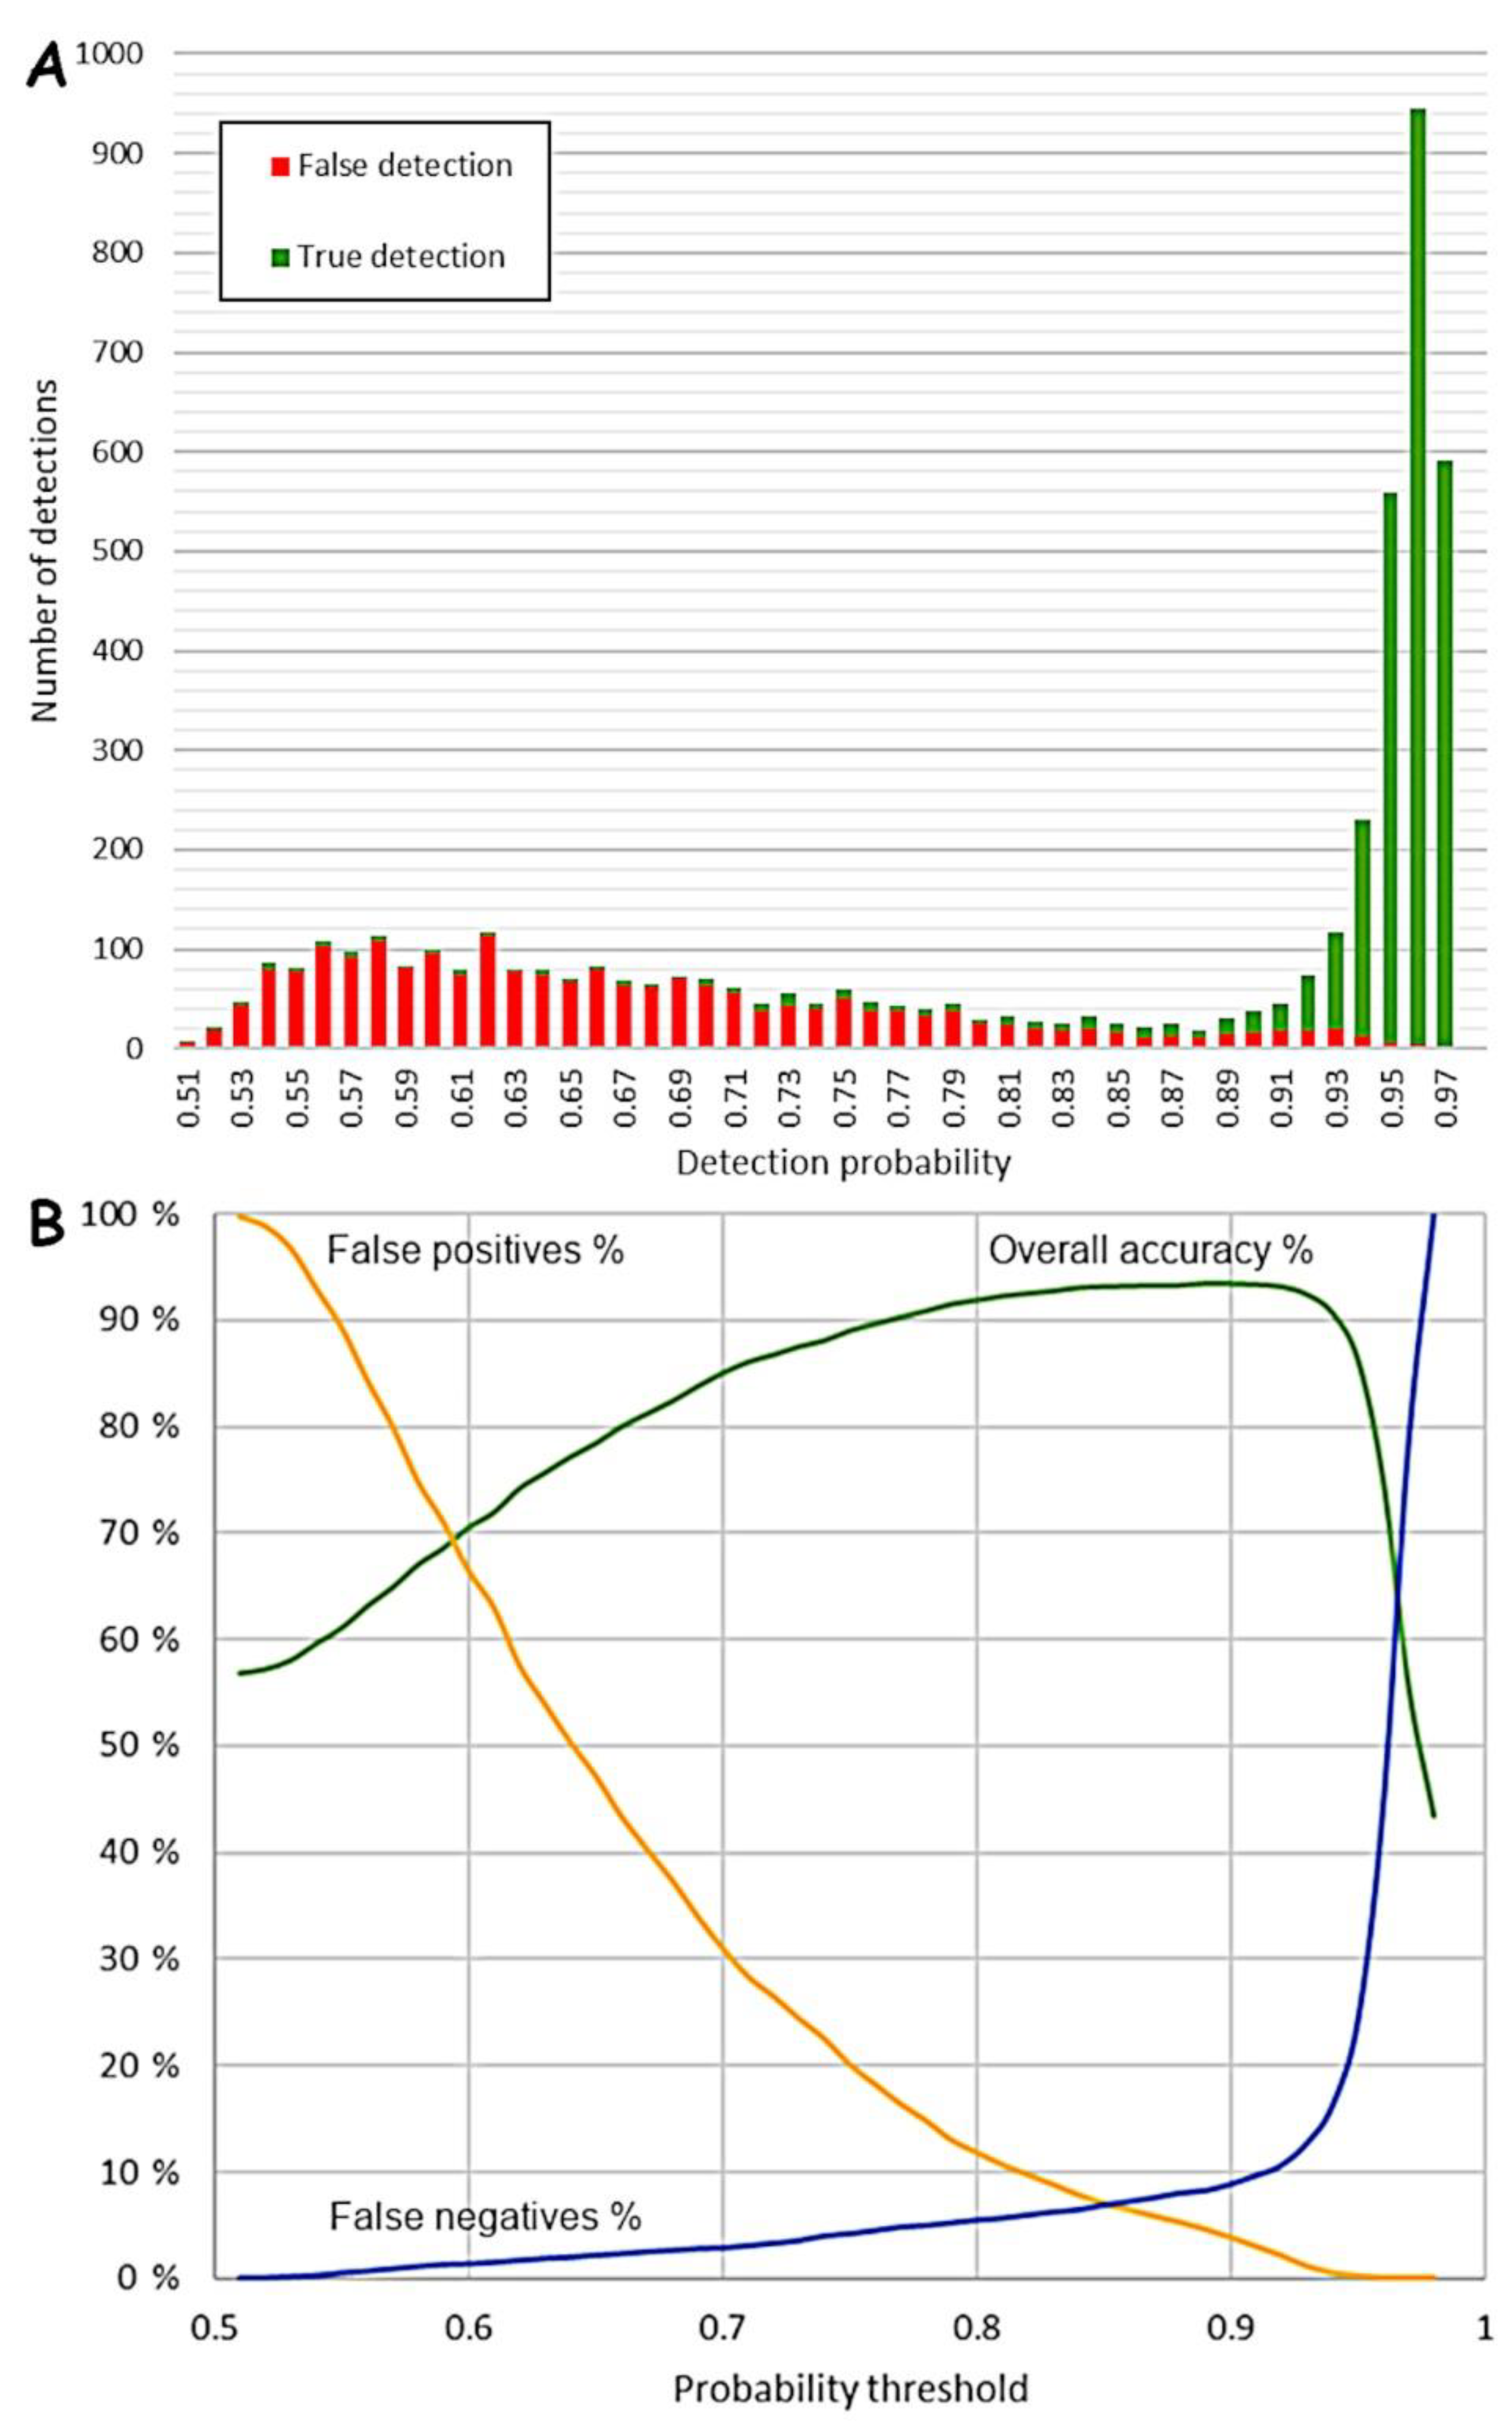
Figure 6 illustrates well how most detections with a low detection probability are indeed false detections. From a probability of 80% upwards the number of true detections increases. At about 89% detection probability, there are almost solely true detections. Using detection probability, one can thus fine-tune the results.
Figure 6 also shows how the overall accuracy changes in tandem with the used probability threshold. For example, if we accept all objects with a detection probability of 70% and higher, then the overall accuracy is 85%. The optimal overall accuracy lies at a probability of 90% (see Carter et al., 2021). Then again, if we only accept detections with a probability of 95%, the accuracy drops to 85%. If we accept detections with a probability of 50% and higher, then we end up with 100% false positives, or detections that are not real tar kilns, and no false negatives, or undetected tar kilns. In other words, we detect everything but at the same time have a high rate of false detections. If we only accept detections with a high detection probability, for example higher than 95%, then we have almost no false positives, but 24% false negatives.
However, why would anyone be interested in the changing rates of false positives and false negatives? The reason is that the “cost” of a false positive and a false negative might be different, depending on the aims. If it is important to discover absolutely all archaeological features of interest, then one must accept that there are more false positives in the results that need to be inspected visually or in the field. On the other hand, if it is important that each single detection is true, then one must accept more false negatives, i.e. missed detections. This is up to the end user to decide and based on the illustrated results, the end user can make an informed decision. Note that the curves and the statistics presented here are based on one test area that has been thoroughly validated. The curves can and will be different in other areas and for other types of cultural heritage objects, like charcoal kilns or pitfall traps.
3.2. Results from the Kuivaniemi Study Area
For the Kuivaniemi study area, we ran one prediction cycle based on the training data from Näljänkä, to test the applicability and transferability of the model to new areas.
Table 5 shows the prediction results with an overall accuracy of 95%, and additional accuracy metrics. Both the percentages of false positives (18%) and false negatives (28%)—in other words missed tar kilns—are much higher than in Näljänkä. However, in this area many more kiln-like features were detected, such as old ground cellars with roughly analogous topographical characteristics. It is also noteworthy that the overall accuracy (95%) is not a very good metric for accuracy, whereas an F1 score allows for better insight (
Table 4).
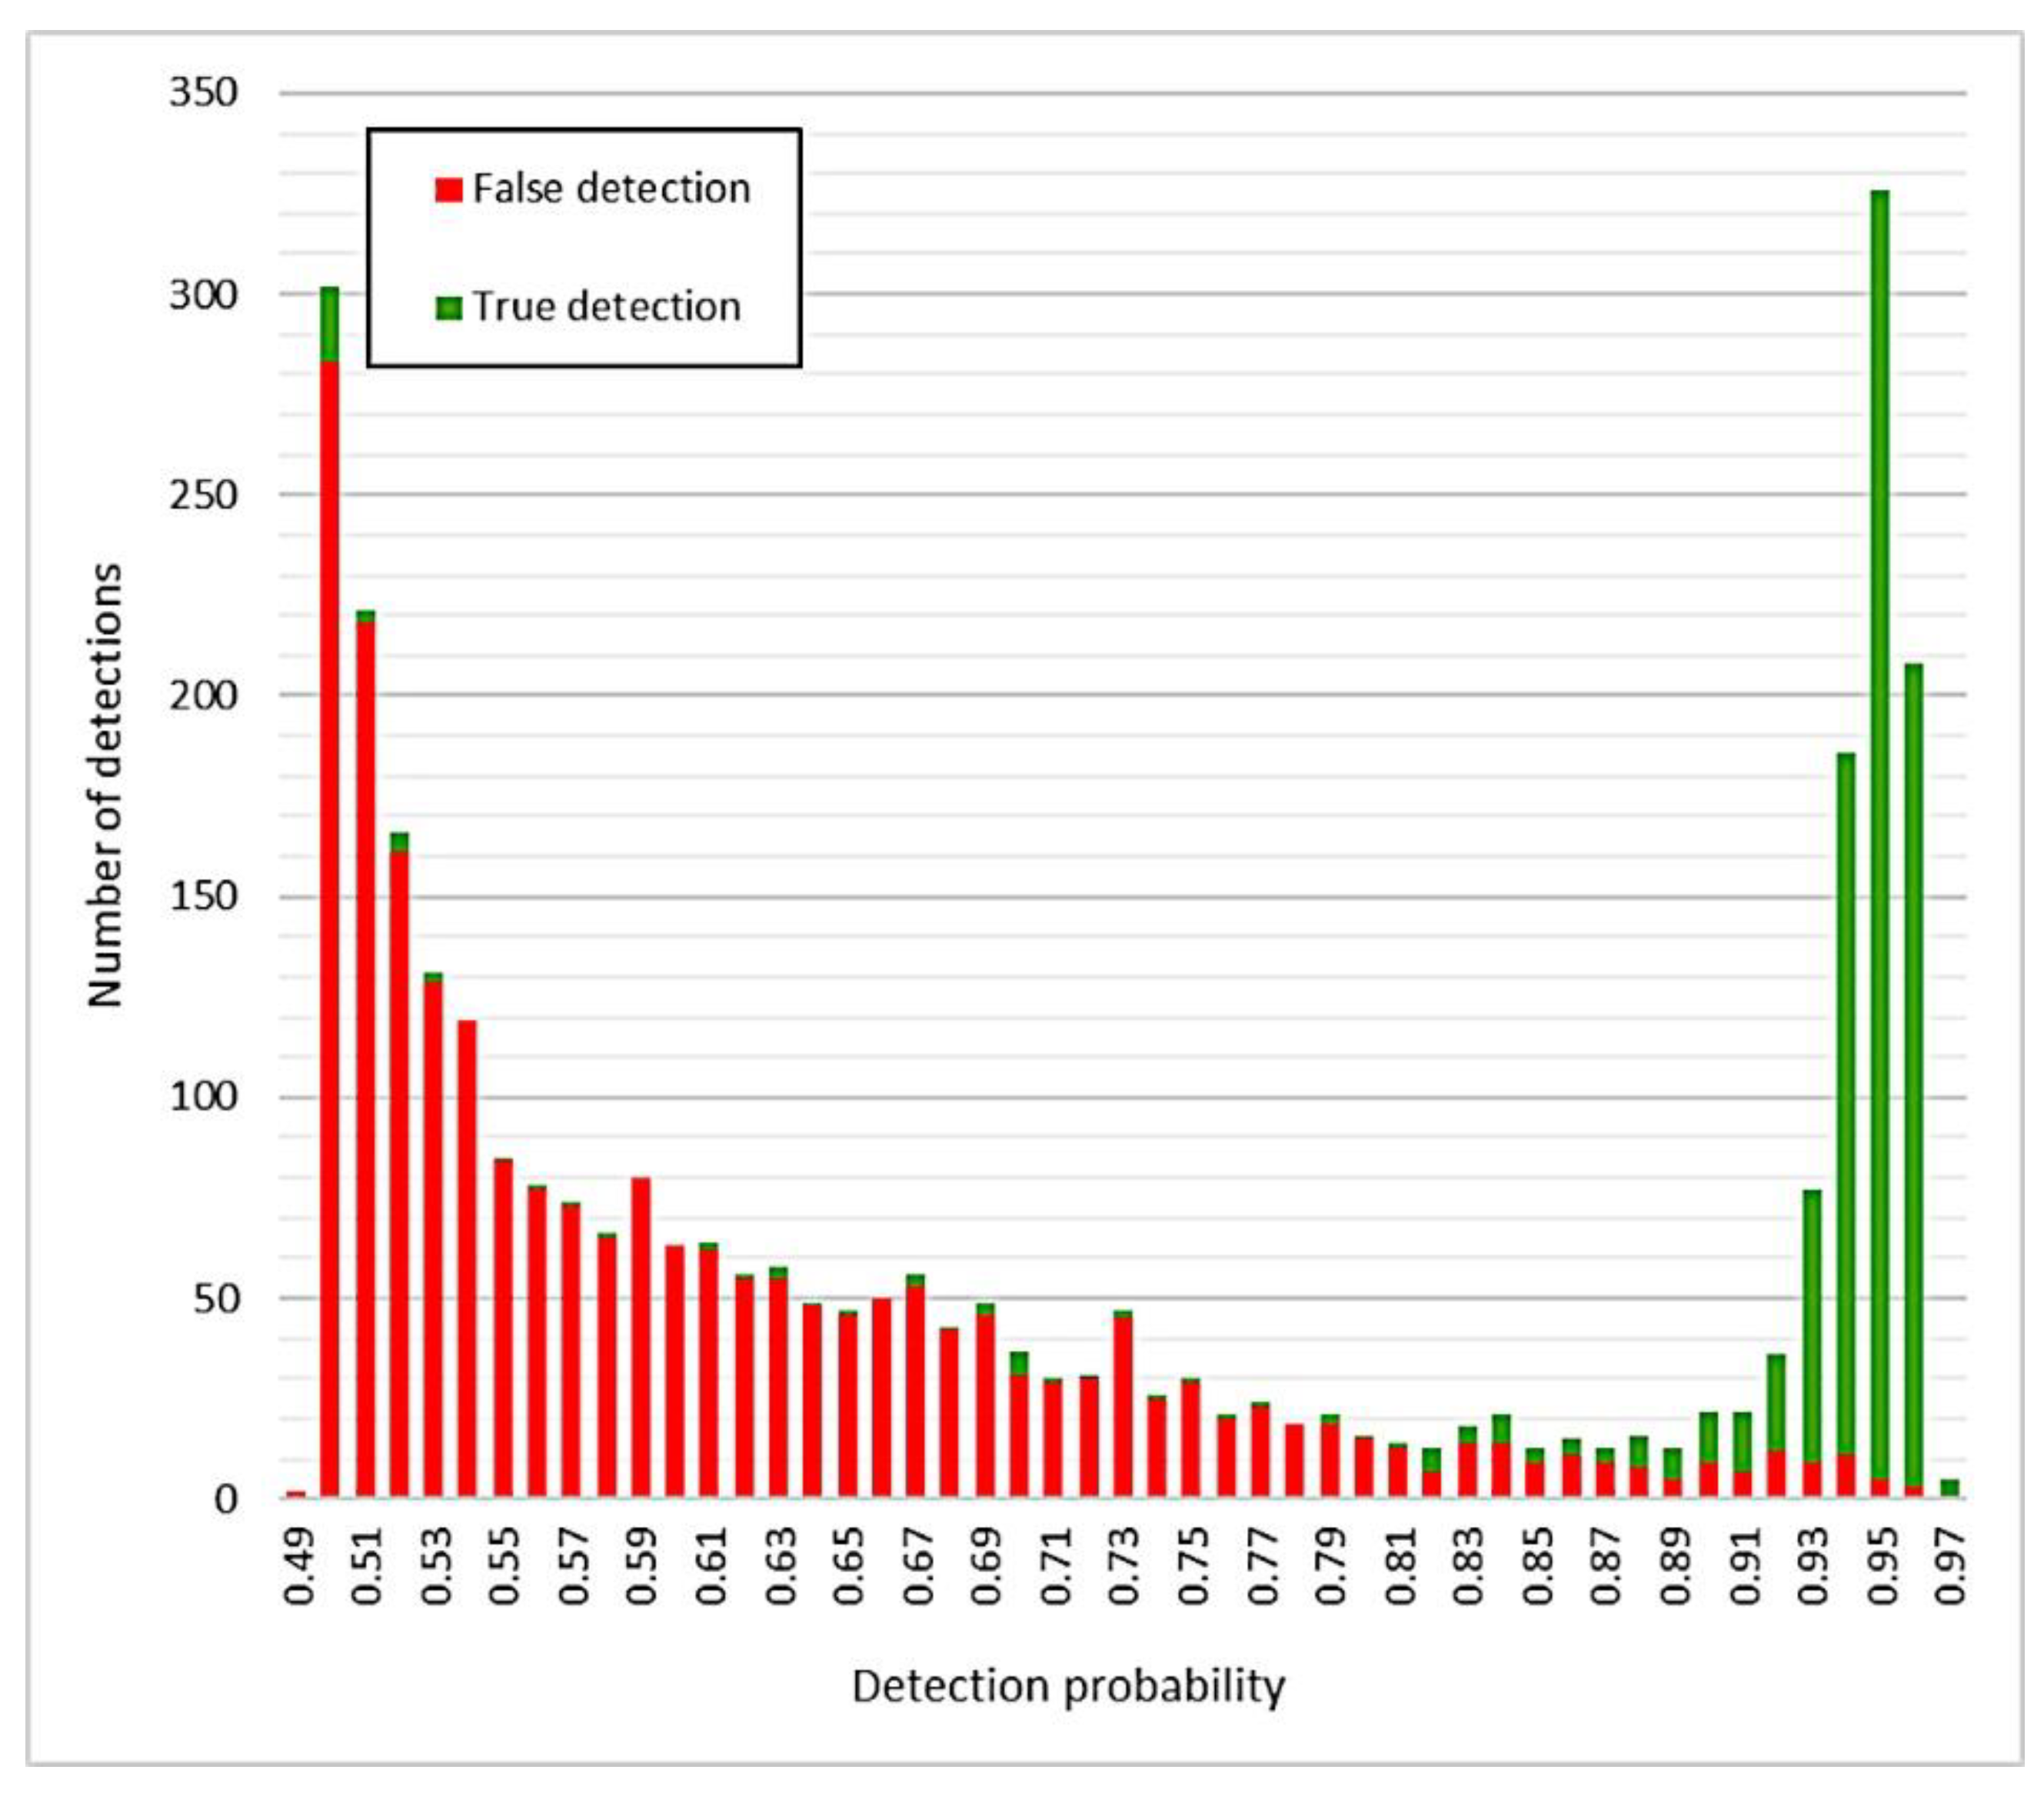
Figure 7 illustrates how most of the detections with a low probability are indeed false. In Kuivaniemi, from around 0.9 probability the number of true detections increases notably. However, throughout the whole probability range from 0.57 to 0.89 there is a small but quite constant number of true detections. In the same vein as in the Näljänkä area, the overall accuracy reaches an optimum at a probability of around 0.90. The false positives show an analogous curve to that of Näljänkä, but the false negative rate, or missed tar kilns, increases much more steeply. There are some possible explanations for this discrepancy; for example, in some cases charcoal seems to have been cleaned or extracted for other purposes from a tar kiln afterwards distorting their appearance (see
Figure 1). This and other aspects related to the afterlives of tar kilns are worth examining in more detail in the future. These observations also underline how little studied and known these features and their
chaînes opératoires are archaeologically.
3.3. Results from the Hossa Study Area
The execution of the algorithm in the Hossa area resulted in 3179 polygons, of which 937 were identified as tar kilns, 12 as charcoal kilns and 29 as other features of interest. By applying a filter of p ≥ 0.9, the number of polygons will be reduced to 882, but as a result, just 841 tar kilns and no other features would be detected. On the contrary, by first manually verifying the polygon data and thereafter cross-checking the identifications with both FNLS and FHA registries, the grand total was brought up to 1011 features: 973 tar kilns and 38 charcoal kilns. Of the 36 additional tar kilns thus discovered, 27 are found in the restricted zone. Only two other features of archaeological interest and no charcoal kilns were identified by the algorithm in the restricted border zone with the downgraded ALS data.
Of the 553 tar kilns from Hossa listed in the FNLS registry, altogether 132 (23.9%) are located within the restricted zone. The FHA registry contains 86 tar kilns from the Hossa area, and yet 16 of them (18.6%) are in the restricted zone. On the other hand, the respective number of tar kilns in the restriction zone identified by the algorithm was 84; that is only 8.96% of the total positive tar kiln identifications. This comparison highlights the underperformance of the detection algorithm with the scaled-down ALS-data. The repercussions of this observation are highly significant, as about 6% of Finland’s land surface falls under the restrictions of the Territorial Surveillance Act.
When attention is turned to the non-scaled-down portion of the Hossa research area, the total number of polygons is 2971, 803 of which have
p ≥ 0.9. The numbers in the unfiltered group are 853 tar kilns and 2118 false positives, of which 39 are other archaeological features of interest. By applying the cut rate of
p ≥ 0.9, these figures are brought down to 762 tar kilns and 41 false positives, of which 28 false positives are other archaeological features of interest (
Table 6,
Figure 8). In addition, one must insert the nine false negatives from this area into the calculation of algorithm performance metrics (
Table 4).
4. Discussion
The single most important outcome of the current study is that it illustrates unequivocally how a semi-automated deep learning approach can be successfully applied over large areas of boreal forest with high confidence levels using the new ALS-5p datasets in Finland. Thus, deep learning-based algorithms can make a notable difference to Cultural Resource Management (CRM), archaeological research, and general knowledge of the country’s past. In this paper we have described one possible strategy to achieve this, using a CNN-based semantic segmentation U-Net approach to detect tar production kilns, one of the most common, but least studied, archaeological features found in Finland [
4,
5].
All the tar kiln detections made by the algorithm were first verified on screen, and following that a sample of sites was verified in the field to assess the working of the algorithm and to train it further. In the future, the ground truthing of results from the algorithmic studies will present a distinct challenge, as more and more new sites will be located in new study areas. As mentioned above, at least a month should be budgeted for evaluating each new study area, if ground truthing will be included. How this will be achieved in practice is something that needs to be widely discussed amongst Finnish heritage professionals.
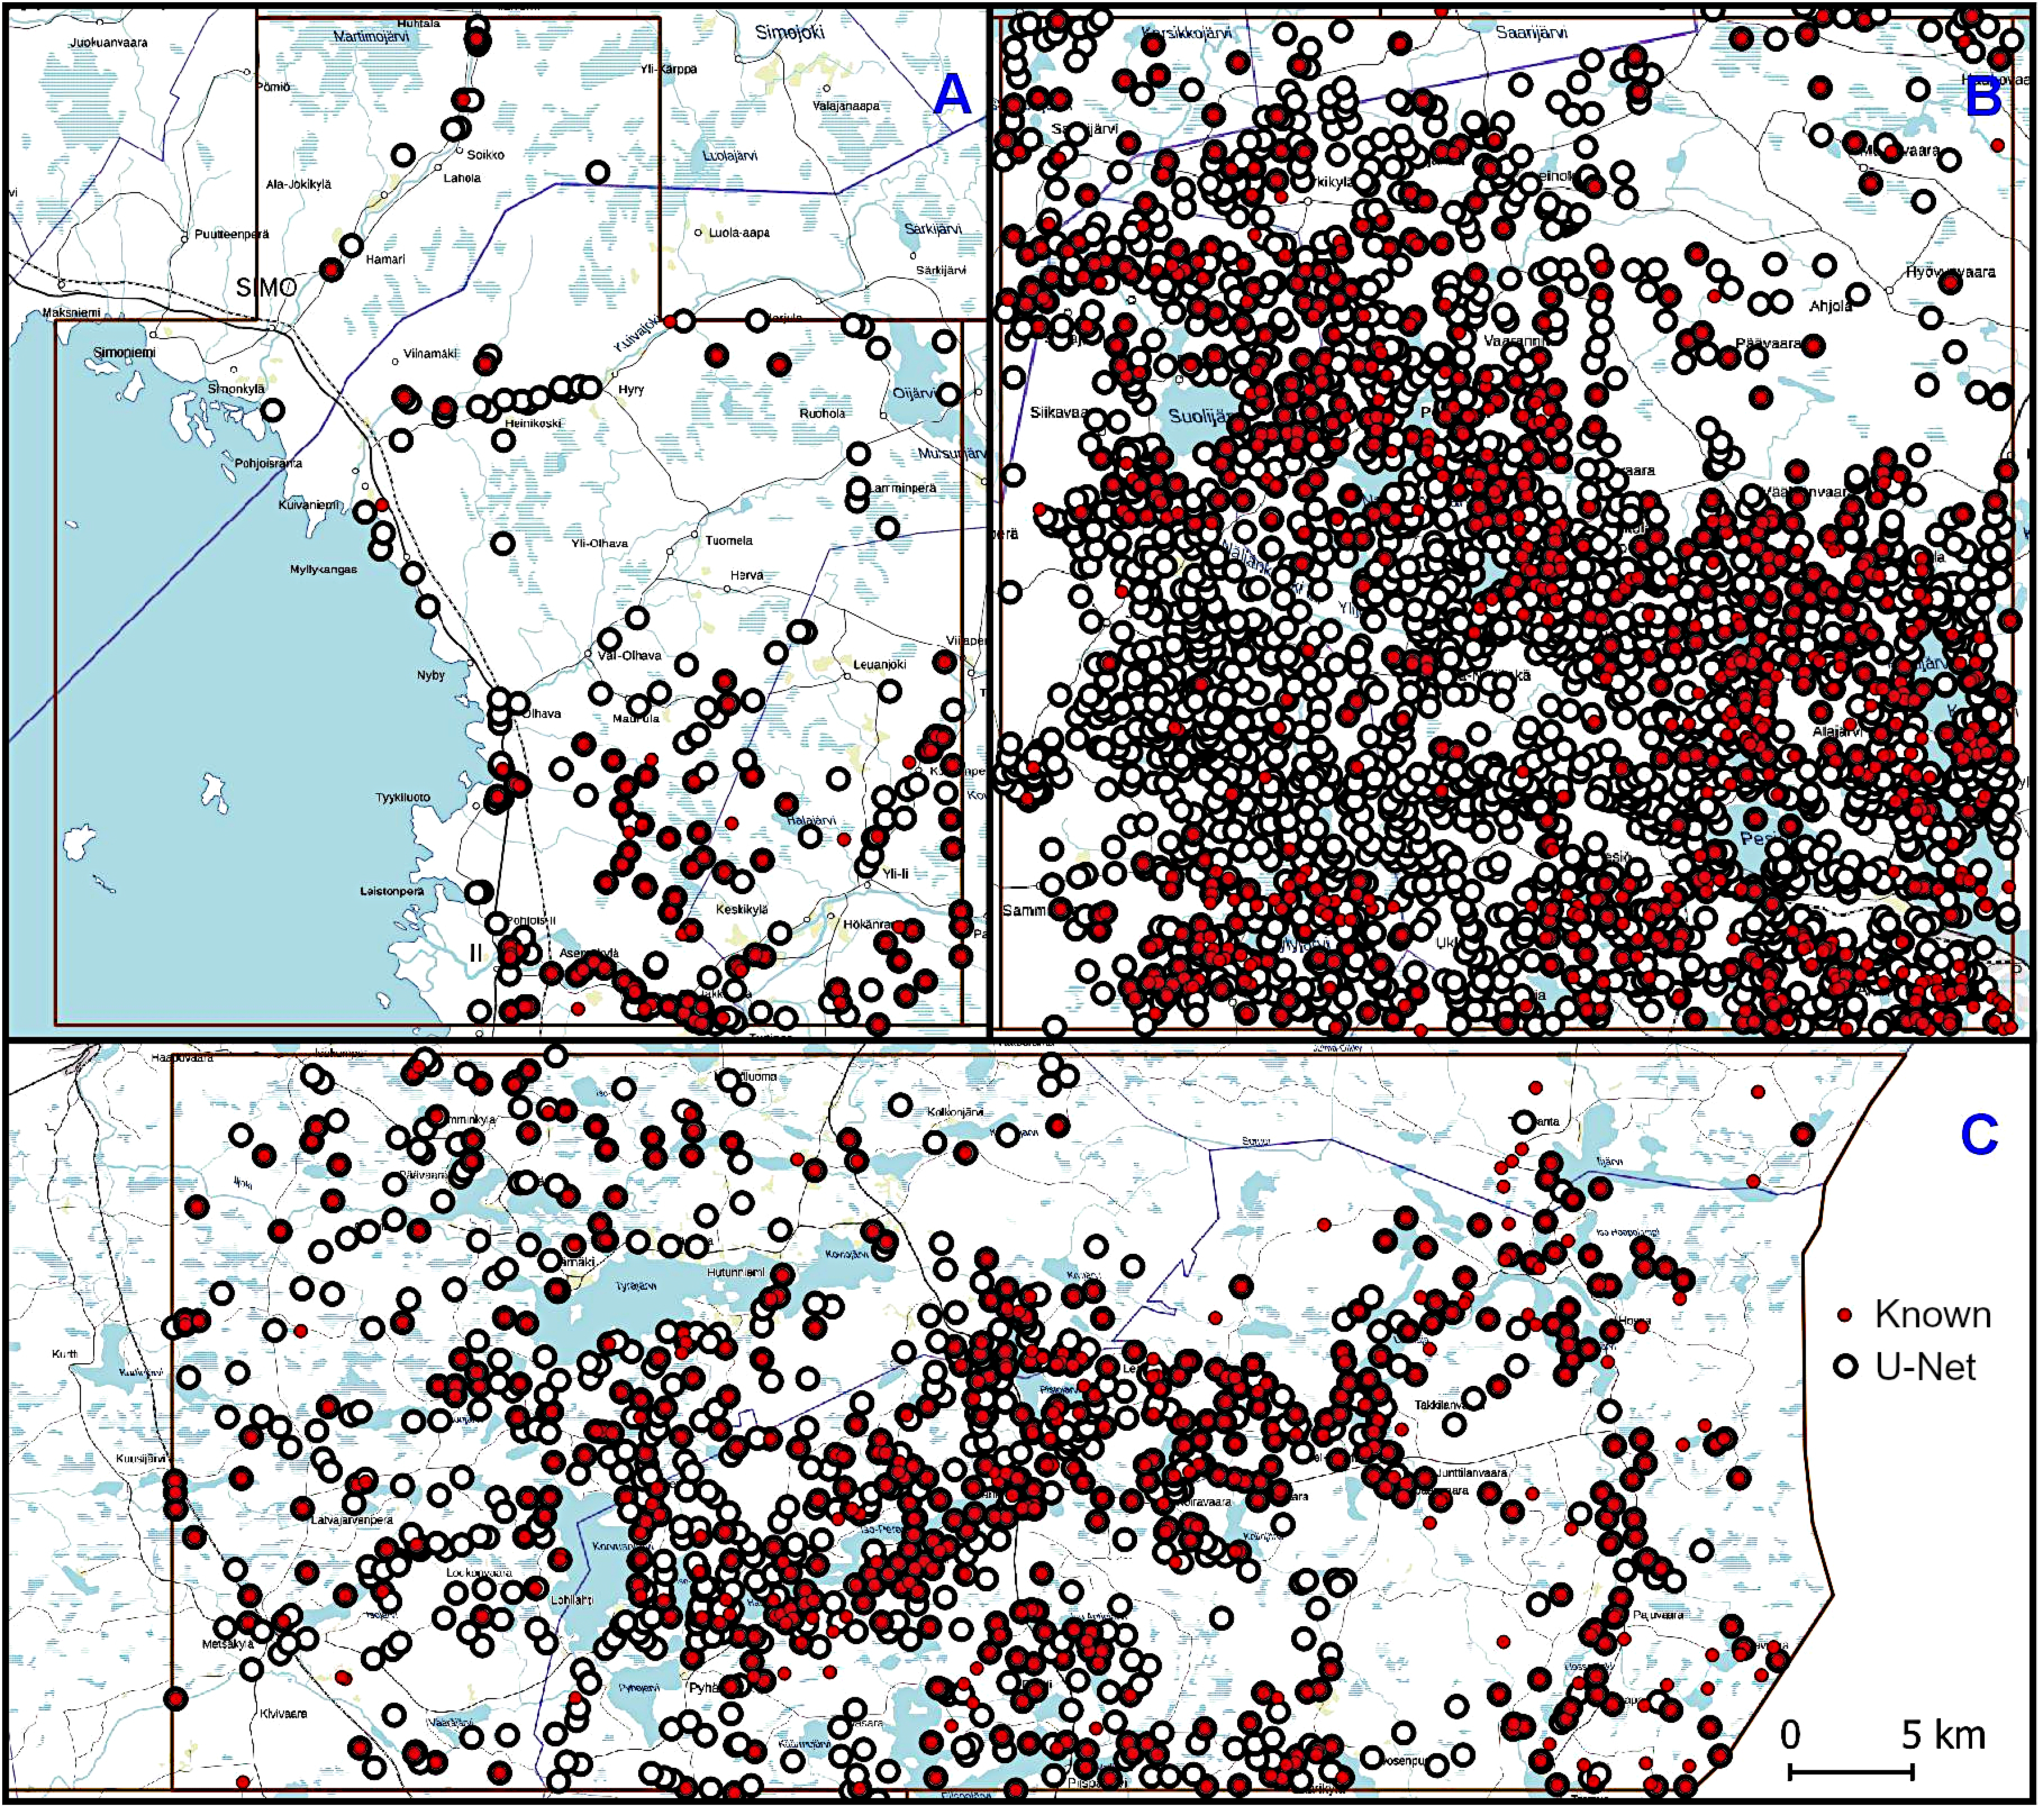
Figure 9 and
Table 7 illustrate the marked increase in the number of tar kilns in each study area compared to the situation before the analysis. The numbers of known archaeological features were more than tripled in the Näljänkä area, nearly doubled in the Kuivaniemi area, and more than doubled in the Hossa area, analogous to observations made by Norstedt et al. [
28]. In Näljänkä this mirrors closely the predictions based on the Pesiöjärvi pilot study [
5].
It is noteworthy that in all areas most of the detected false positives pertain to other types of archaeological features—for example charcoal kilns, ground cellars, and Stone Age housepits—that all share some characteristics with tar kilns (
Figure 10) [
10,
17]. This illustrates the algorithm’s good potential for also detecting other types of archaeological objects. Even if our initial model development focused on the tar production kilns, our smaller-scale tests using other kinds of archaeological feature datasets already show analogous promising results. We have so far tested the algorithm in the detecting of, for instance, charcoal kilns, pitfall traps, Stone Age housepits, and Second World War-era remains like dugouts, foxholes, and trenches [
2,
3,
29]. Moreover, the algorithm detects many of these features despite of modern destructive forest management activities with timber harvesters [
9,
10], which often cause more or less severe damage to the ground surface and archaeological features (see
Figure 2).
There are several possible ways to increase the performance of the model in the future and to make it more robust, besides training the algorithm with more sites. These include, for instance, the use of other kinds of visualisations of DEMs in tandem with the TPI [
27], as well as combinations of TPI with different radii, and including various kinds of attributes for the detected structures, such as roundness, depth, or other characteristic features [
30]. The ALS-5p tiles and the characteristics of the point cloud also merit closer attention, including the impacts of extreme seasonality in parts of Finland [
3], and testing the effects of different spatial resolutions on the analyses. In addition, experimenting with other kinds of predictive approaches and algorithms could be beneficial for comparisons with our current U-Net-based work.
As noted, the detection probability works as a relatively good indicator of true detections in our case studies. However, if one mechanically filters the features with a lower detection probability—or as another possibility their size—to get rid of the main body of false positives [
17], this would inevitably result in also losing true detections. For instance, if one filters out all detections with an area of less than 10 m
2, this results in a notable decrease in the number of polygons to be manually checked either on computer screen or ground truthed in the field in uncertain cases. This would lead to significant savings in work time but would also always result in the loss of a small number of real archaeological features. This should be openly acknowledged when deciding between possibilities and applying the selected approaches to the material at hand.
If mechanical filtering of polygons is applied in some cases, it needs to be carefully documented in the metadata and reports, so that other researchers will know the selected procedures. From our point of view, manual verification of all data on screen should always be on option, as with a bit of training one can process it quite rapidly at a rate of about 2000 polygons per hour. In any case, the original unfiltered polygon data should always be saved, so that one can go back to the beginning if necessary. Long-term storage and archiving of data products require their own special arrangements. Archiving and storage space for digital data are some of the factors that need to be considered when planning the wider use and application of algorithmic approaches based on machine learning. At the moment, we have the advantage of relying on the University of Oulu, National Heritage Agency, and national CSC—IT Center for Science data storage facilities, but how this will be arranged in the long run remains to be seen.
5. Consequences for Archaeological Research and Cultural Heritage Management
Based on our pilot studies [
2,
3,
4,
5,
30], the semi-automated detection of archaeological features will revolutionize future archaeological research and especially the CRM work in Finland. A rough estimate of its effect is that with artificial intelligence and deep learning methods, the number of archaeological sites in Finland will likely grow nearly tenfold from the present approximately 58,000 sites included in the Finnish Heritage Agency registry [
3].
When planning the wider application of algorithmic semi-automated approaches, one notable aspect is the persistent requirement for manual labour—for example in the examination and verification of detection results both on screen and eventually in the field—that needs to be recognized and considered. Attempts can be made to reduce the amount of manual labour for example by mechanically filtering the detection results based on, for instance, the probability values or the size of the predicted features, to minimize the number of false positives. However, if such an approach is selected, it needs to be recognized and openly admitted that the time-saving mechanical filtering will also result in the loss of a small number of archaeological features. One must thus decide what is an acceptable number of true objects that can be lost to save time and resources. From our point of view, the careful manual onscreen and field verification of objects, which results in more accurate data for archaeological and paleoenvironmental research and heritage management [
10], should be aimed for and preferred over temporal or monetary issues.
Even if the predictive model clearly outplays human actors in its accuracy, repeatability, and spatial coverage [
4], it is never perfect. Algorithms always perform only the tasks defined for them and do not consider anything beyond those. However, when dealing with large research areas and datasets, the machine learning approach results in more accurate, consistent, productive, and perhaps more ethically sustainable outcomes than analyses based on, for instance, visual inspection. The latter are always dependent on many possible factors introducing errors; for example, the individual researchers conducting the study, their experience with the different types of archaeological features, and the time invested in the analyses.
Our project has also had an unexpected impact on the renewal of the Finnish Antiquities Act, which has experienced only minor updates since it became effective in 1963. Under the current law, tar and charcoal kilns are regarded as protected archaeological heritage. However, the projected number of tar and charcoal kilns to be detected with deep learning algorithms in the whole of Finland has raised some concerns over perceived impacts on the cultural heritage management and land use sectors. At present, it seems likely that the number of protected tar and charcoal kilns will be reduced by using an artificial terminus ante quem cut-off set to the year 1721 AD, where the features post-dating this terminus would not fall under the protection of the new law. How these features, outwardly largely analogous from the 16th to the 20th century, could be dated this accurately in the first place is an issue that remains to be resolved.
Nevertheless, in the future the detection of tar kilns through deep learning and semi-automatic algorithms is likely to become a routine act in Finland, in tandem with the detection of charcoal kilns. This hopefully brings research on their internal dynamics into focus with questions concerning their chronology and typology as well as geographic, temporal and cultural factors affecting their distributions [
9]. In a similar vein, the impact of tar manufacture on local ecosystems—described in the historical and ethnographical sources as extensive and devastating—can be better evaluated and assessed with improved data on feature locations and their properties, for example, with multi-temporal environmental remote sensing datasets.
6. Conclusions
This paper describes the developing and testing of deep learning-based algorithms on a large-scale for the detection of archaeological features from the new FNLS ALS-5p data. Our iterative experiments with training and validating the routine yielded good results in the Näljänkä area used for developing the used algorithm. When the trained model was transferred and applied to other areas it reached equally promising although slightly lower results. Based on these initial experiments, the model can be relatively easily fine-tuned for new study areas to reach better results [
4].
Even with all their limitations, semi-automated methods produce more consistent and systematic results than, for instance, visual inspection carried out by individual researchers. Algorithms can be run efficiently and effectively over much larger topographic areas than manual detection allows and show excellent locational accuracy with high resolution and good-quality ALS data. In addition, the collecting of various kinds of feature characteristics related to their size and shape can be easily (semi-)automated and used to produce research datasets for further analyses.
Corroborating the observations of Casana [
31], our results also question the fruitfulness of the citizen science approach adopted e.g. by the FNLS for locating tar kilns in the woods. Numerous features reported in their database by the non-professionals as tar kilns are in fact charcoal kilns or other archaeological features not related to wood chemistry at all, such as Second World War dugouts, root cellars, or moraine formations (
Figure 10). In this paper we have omitted these other types of archaeological features, thousands of which have been detected using the algorithmic approach (and which will be discussed elsewhere in detail). Better results may be achieved if the use of citizen science is integrated within the validation of archaeological features detected from ALS data, instead of relying solely on citizen reports [
32]. The use of various forms of (environmental) remote sensing data must also be considered for future analyses in tandem with the ALS data. Combinations of these will allow examining more closely for example the long-term ecological impacts of tar production.
Overall, our studies have shown that the combination of ALS-5p material with deep learning methods offers huge potential for studying the archaeologies and ecologies of historical tar production in the boreal forests. The described approach allows systematic locating of large numbers of previously unknown archaeological features in the vast and understudied northern and eastern Finnish forestlands. It also enables automated determination of their various properties, such as size, shape, depth, and so on [
4,
29,
30]. Gaining a more holistic understanding of the spread and distribution of tar production infrastructure will allow the studying of its wider, long-term cultural and environmental impacts for example with various environmental, ecological, and population datasets. The developed algorithms are also transferable and scalable to new study areas and for different types of archaeological objects and training data beyond tar kilns, as shown by our tests with other types of archaeological objects [
2]. In addition, in the future, once the algorithm is perfected and made publicly available, the use of high-performance computing, such as the supercomputer facilities offered by the national CSC—IT Center for Science for data analyses, can permit more efficient handling of the data.


 ,
, 


