1. Introduction
The devastating wildfires ravaging the United States in recent years have raised concerns about public safety and the environmental impact [
1]. The 2015 Butte Fire burned 70,868 acres of forest land and destroyed 965 structures in northern California [
2]. The 2020 Zogg Fire resulted in 4 fatalities and mandatory evacuation orders were issued for more than 190,000 residents [
3]. The 2022 McKinney Fire that burned 60,138 acres in total was contained after 206 days by 948 firefighting personnel [
4]. One important result about these three events is that the fires were allegedly attributed to a tree contacting power lines during high winds. For example, the California Department of Forestry and Fire Protection (CAL FIRE) reported that the 2015 Butte Fire started when a gray pine tree contacted the power lines, which ignited a spark [
5]. CAL FIRE reported that the 2020 Zogg Fire was derived from the failure in the vegetation management of the utility company. This is because, although the pine tree that began the 2020 Zogg fire had been identified as a potential hazard in 2018, it had not yet been removed [
6]. While the exact cause of the 2022 McKinney Fire is still under investigation, certain evidence suggests that the fire was caused by a ponderosa pine tree and a 12 kV distribution line coming into contact. Thus, multiple lawsuits have been filed alleging that the utility company failed to properly clear the vegetation around its power lines.
Table 1 shows the primary drivers of fire ignitions observed in power distribution lines owned by California’s largest utility company, Pacific Gas and Electric Company (PG&E) [
7]. As per this table, for the 414 fire ignition events recorded between 2015 and 2017, vegetation contact was the most frequent driver (48.6% of total ignition), followed by equipment failure (27.8%), and third-party contact (13.0%) [
7]. These results have brought on discussions of what should be performed to prevent similar tragic wildfires. Many professionals in the field of disaster management have attempted their best to improve the reliability of the power grid [
8]. Utility companies have invested in replacing and upgrading their old equipment. Under the government’s policy of power line fire prevention, thousands of trees near power lines have been trimmed [
9].
Despite many considerable efforts, there has been a requirement for more scientific, scalable, and sustainable approaches rather than manual inspection because of the massive scale of the power grid. Both aerial and satellite images have gained considerable attention because of the ease of monitoring broad and difficult-to-access areas. Qayyum et al. [
10] proposed the fusion CNN framework to compute the height of vegetation close to high-voltage transmission lines using aerial stereo images. Gazzea et al. [
11] used semi-supervised learning for high-resolution multispectral satellite images to determine vegetation density in the vicinity of power lines. With the availability of Google Street View, a transfer learning approach for detecting tree and power line entanglements using street-level imagery has also been developed [
12]. However, these two-dimensional (2D)-based methods allow us to determine only one measure of the distance between a power line and vegetation (e.g., proximity parallel or perpendicular to the power line). Moreover, for classifying vegetation species as flammable or nonflammable, 2D image-processing approaches require more challenging learning tasks because these approaches generally depend on color or texture [
13,
14].
To address this limitation, three-dimensional (3D) imaging techniques have emerged that provide both geometric (e.g., the XYZ coordinates) and radiometric information (e.g., the RGB color space). In terms of accuracy, point cloud data gathered by LiDAR laser scanners have been recognized as an effective means of land and infrastructure monitoring [
15]. Because raw point cloud data does not contain any semantic information about the scanned object, many previous studies have suggested methods for automatically classifying the point data into multiple classes, such as ground, vegetation, conductors, and towers. Generally, random sample consensus [
16], supervised learning algorithms [
17,
18], and deep learning networks [
19] have been popular for extracting power line components. Certain studies that focus on the 3D reconstruction of trees below power lines have used the voxel-based model [
20] or the data fusion model of aerial images and point clouds [
21]. The subsequent step in developing the point cloud model is to calculate the distance between the power line and the nearby tree. Depending on the geometric properties of the objects and the coverage of the surveillance area, the radial distance [
22] (for a complex shape and a narrow range) or the bounding box estimation (for simple shape and wide range) have been used [
23].
In addition to the abovementioned studies, considerable contributions have been made by many researchers to mitigate the wildfire risk posed by the encroachment of trees on a power line. However, most studies regarded the environment as static and did not consider dynamic events. Although certain recent studies have suggested improved approaches, such as by estimating the growth of trees [
21,
22] and by considering the change of a power line sag in hot and cold weather conditions [
24], few studies have discussed sudden and unexpected environmental changes. However, wind is one of the main factors that is closely related to the first and second major drivers of wildfire ignition discussed in
Table 1 [
25,
26,
27].
To bridge this gap, this study aims to determine the critical wind speed that possibly causes fire by calculating the distance between trees and wires under varying wind conditions. Although in real cases a sudden gust of wind may often bring down, uproot, and break trees, this study focuses on how wind increases the potential risk of wildfire by reducing the distance between trees and power lines. To measure this potential risk, two types of minimum vegetation clearance distance (MVCD) are introduced as indicators. The parameters that characterize and map the tree and the wire are extracted from the airborne LiDAR data.
2. Materials and Methods
2.1. Study Area
The study area is located in Sonoma County in northern California, where 115 kV transmission lines are laid out, as shown in
Figure 1 (the center of the area is located at latitude 38.260N, longitude 122.625W). The power grid in this area is operated by PG&E, which faced financial problems after several wildfires. The area is a typical residential area having detached houses on either side of the road and trees planted along the sidewalks. As is common in California, the region has a Mediterranean climate and the dominant vegetation types are conifer trees, which are characterized by having a cone-shaped crown, such as pine, Douglas fir, deodar cedar, and western hemlock [
28]. The total land area is about 2060 m
2.
2.2. Overview of the Method
Figure 2 shows the overview of the proposed method in this research. In the data acquisition phase, the point cloud data of the study area was obtained from the freely available online source, the Sonoma County Vegetation Mapping and LiDAR Program [
29]. This program collected airborne laser scanning data using two airplanes carrying a Leica ALS50 and a Leica ALS70, respectively, between September and November 2013. Other features include an average flying altitude of 900 m above the ground, a pulse density of over 8 pulses per square meter, and a scan angle of 15° from the nadir. The acquired LiDAR data from the Sonoma Veg Map has 16,651 scanned points that have X, Y, and Z coordinates.
In the data preprocessing phase, the ArcGIS Pro software was used to classify each point, and the classification code followed the LAS 1.4 format by the American Society for Photogrammetry and Remote Sensing. For instance, all points were assigned one of the classification codes: Unassigned (value: 1), Ground (value: 2), High-vegetation (value: 5), Building (value: 6), and Wire (value: 14). After classifying the data, only the points having class code values of 5 (High vegetation) were stored and exported as a LAS file. Then, this file was imported into a statistical software, R Studio, for individual tree segmentation. Three different tree segmentation algorithms were compared, and additional details are discussed in the next section.
Finally, in the risk assessment phase, the behavior of the sample tree was analyzed under varying wind speeds. The tallest tree was extracted as the sample because a tall and slender tree is generally vulnerable to horizontal loads such as wind forces. The detailed explanations for the equations used for calculating multiple parameters, including the treetop deflection and the MVCD, are provided in
Section 2.3 and
Section 2.4.
2.3. Data Preprocessing
In the first preprocessing phase, 776 points classified as noise were deleted, and some points (n = 179) that were classified as unassigned were manually assigned to the wire conductor.
Figure 3a shows a modified point cloud model that contains 5 different classes. The proportion of each class was ground (45.98%), unassigned (30.3%), high vegetation (19.67%), building (2.89%), and wire (1.13%).
The second preprocessing was performed to reduce the number of unassigned points. Using both the LAS-to-Raster tool and the Raster-to-Point tool in ArcGIS Pro, the 3D coordinates (x, y, and z) of the point cloud data were generated. As per the coordinates, the mean ground elevation of the study area was set to 19.49 m, and it was used as a baseline to determine the height from the ground of the non-ground points. This study assumed that the unassigned points included multiple objects on the sidewalks (e.g., fences, mailboxes, and benches). Based on this idea, we assigned the unassigned points to the ground points when their height was less than 1 m, thereby reducing the number of unassigned points to 664 (4.18% of the total points). Note that additional details of the number of points, elevation, and height from the ground as per each class are listed in
Table 2, and the point cloud model filtered by elevation is also plotted in
Figure 3b.
In the third phase of preprocessing, R Studio was used to segment the high vegetation points extracted using ArcGIS into an individual tree. We then tested and compared three algorithms for individual tree detection in the airborne LiDAR data, including the algorithms Li 2012 [
30], Dalponte2016 [
31], and Silva2016 [
32]. The Li2012 (LI) is a rule-based algorithm obtained from the idea that the horizontal spacing between trees becomes relatively wider at the treetops. On the other hand, the Dalponte 2016 (DAL) and Silva2016 (SV) algorithms began by identifying the local maxima in a rasterized canopy height model. The primary difference between these two algorithms is the types of segmentation classifiers that were used. To cluster the tree crowns, the DAL applied a decision tree classifier, and the SV applied a k-nearest neighbor classifier. Moreover, the DAL was trained using a broadleaf tree dataset, whereas the SV was tested on a conifer forest dataset.
All algorithms were first tested under default settings. The total number of trees counted using the LI was 43; however, the DAL and the SV detected 18 and 12 trees, respectively. Because it was observed that the study area had between 10 and 15 trees, as shown in
Figure 4a, the result shows that the LI algorithm produces oversegmented detections. One possible reason for such low performance could be that the horizontal spacing between the trees was extremely close. This phenomenon was particularly apparent for two big trees in the study area. Accordingly, an elevation-based segmentation approach that used rasterized images (
Figure 4b) demonstrated relatively better performance for our point cloud model. We reported that the SV algorithm with a grid cell size of 1 m, a convex shape, and a 5 × 5 moving window was superior for detecting the two big trees compared with other conditions. Through the preprocessing step, a total of eight trees were finally detected (see
Figure 4c,d). The height of the tallest tree was about 19.29 m; other detailed geometric information about the trees is summarized in
Table 3.
2.4. Wind Effects on Trees
Swaying trees were analyzed using a mechanistic wind risk model that considers the wind load to be a static drag force. For such an approach, a tree is simply assumed to be a cylindric cantilever beam having a constant diameter that is clamped to the ground. Thus, bending is the dominant deformation of the tree, and the conventional formula for the wind force is as follows [
33]:
where
F is the mean wind force acting on the tree [N],
Cd is the drag coefficient [dimensionless],
ρ is the air density (1.226 kg/m
3 at 15 °C),
A is the projected area of the tree crown [m
2], and
u is the wind speed [m/s].
The drag coefficient was introduced to determine the resistance associated with air flowing over the surface of trees [
34]. A low drag coefficient indicates that the ability to withstand wind load is considerable. In general, a thick tree has a lower drag coefficient than a thin tree. In the field of forest science, many researchers have performed wind tunnel tests that examine wind-induced tree vibration [
35,
36,
37]. Based on the experimental results, it has been observed that the drag coefficient is dependent on the tree shape, especially the ratio between the tree height (
h) and the trunk diameter at breast height (
Dbh) (e.g., 1.3 m). To estimate the drag coefficient for determining the wind force, we therefore, require the value of
Dbh. However, the top-down segmentation approach with airborne LiDAR data is generally specialized to identify the crown, so it faces challenges in identifying the trunk [
38].
To overcome such a lack of trunk information, we used height–diameter relationship models, which were originally developed to estimate the expected tree height using the measured
Dbh (i.e.,
Dbh is used as the input and h is used as the output). This is because, for tall trees, multiple devices may be required to measure the height of the tree, whereas measuring the diameter is relatively simple and incurs little cost. Among the multiple statistical regression models, the Chapman-Richards function has proven its effectiveness at describing tree height over a various tree species [
39,
40]. The basic equation for the Chapman-Richards function is expressed as follows:
where
h is the tree height [m],
Dbh is the trunk diameter at breast height [m], and
α,
β, and
γ are the regression coefficients that depend on the tree species (
α = 22.9430,
β = 0.0967,
γ = 1.9923 for conifer trees).
The next step in examining the wind effects on trees is to estimate the bending deflection of a tree. As mentioned previously, it was assumed that a tree behaves similar to a cantilever beam, and the wind was considered as a static and distributed force. Therefore, a simple structural equation was used to estimate the maximum deflection of a cantilever beam [
41]:
where
Xmax is the maximum deflection [m],
F is the mean wind force acting on the tree [N],
h is the tree height [m],
E is the modulus of elasticity, and
I is the area moment of inertia [m
4].
The modulus of elasticity is defined as the ratio of the stress to the strain, and it explains the linear elastic behavior of trees. The modulus of elasticity of trees is significantly dependent on the tree species and even differs for a single tree as per its moisture content,
Dbh, height, and age. Furthermore, the area of the moment of inertia is related to the capacity of a cross-section to resist bending, and it is generally determined using the following equation when the trunk of a tree is considered to be a circle [
41]:
where
I is the area moment of inertia [m
4], and
Dbh is the trunk diameter at breast height [m].
Referring to Equations (1) and (3), it is apparent that the deflection of a tree is a function of the projected area against the wind. Note that tree crowns are deformed to resist wind loads such that the effective projected area indeed decreases as the wind speed increases. Accordingly, although Equation (4) is frequently used for simplification, it was not sufficient to accurately describe how both the crown and the trunk respond under wind loading. Careful considerations for the estimated tree deflections are required. In this context, we employed the equation for the deflection indicated by tree bending introduced by Peltola et al. [
42]. In Peltola et al.’s approach, the displacement was estimated differently depending on the distance from the crown center because the bending behavior becomes linear only when the points are above the center of mass. For example, assuming the shape of a tree crown to be a cone, the center depends on the point at a distance of one-fourth of its height from its base. Therefore, Equation (5) is used when estimating the deflection of the treetop, whereas Equation (6) is used when estimating the deflection of the crown base.
where
X(
z) is the deflection [m],
F is the mean wind force acting on the tree [N],
h is the tree height [m],
d1 is the distance from the ground level to the crown center [m],
d2 is the distance from the crown center to the treetop [m],
L(
z) is the distance from the treetop to the point [m],
E is the modulus of elasticity, and
I is the area moment of inertia [m
4].
2.5. Minimum Vegetation Clearance Distance
When the electric field produced around a conductor exceeds certain threshold value, the air becomes ionized and this ionization may create an arc flash. Because high voltages can generate greater electric fields, an arc flash can even be produced despite the wires having no direct contact with the trees for the case of high voltages. To prevent this risk, there must be a minimum distance between the wires and the trees, which is known as the MVCD. However, despite the importance of maintaining appropriate levels of MVCD, few studies have been performed to explore the relationship between the fire ignition probability and MVCD. In many cases, the national or local electrical safety standards have been used as a guideline to determine the MVCD. For example, in the general order 95 of the California Public Utilities Commission (CPUC), it has been regulated that there should be a minimum clearance radius of 4 feet for any power line between 2.4 and 72 kV. Another governmental agency, the CAL FIRE, has reported that trees within an approximate 10 feet radius of a utility pole should be removed via their public resource code 4292. In addition, PG&E mandates a minimum clearance of 18 inches around power distribution lines in general and a minimum clearance of 4 feet for high fire-threat areas.
These conventional rules are useful for managing a tree trimming schedule to prevent fire damage; however, they are oversimplified and somewhat conservative. If we follow the abovementioned rules, thousands of trees located within California would be classified as potentially dangerous and would be trimmed. Accordingly, to consider a more feasible approach to determine the MVCD, the Gallet equation, associated with the critical flashover voltage (CFD)—the voltage that is 50% more likely to cause a flashover—is used [
43]. The relationship between the CFD and the MVCD is then expressed as follows:
where CFD is the critical flashover voltage [kV],
kw is the weather condition parameter (1.0 for dry weather and 0.96 for wet weather),
kg is the gap factor (1 for cone-shaped objects),
ρ is the air density (1.226 kg/m
3 at 15 °C), and MVCD is the minimum vegetation clearance [m].
3. Results
3.1. Sample Model and Estimated Parameters
Among the eight trees segmented in the preprocessing phase, we extracted one tree as a sample (tree ID#5, shown in
Figure 4d). Because this tree was sufficiently close to the wires and the height of the trees was higher than the mean height of the wires, it was possibly representative of the potential fire risk of all trees in the model. As shown in
Figure 5, the geometry of the tree crown and trunk were modeled as a cone with an oval base and a cylinder with a circular cross-section, respectively. Three-phase power lines were located on the right behind the tree. In other words, the tree got close to the wires when its x- and y-values increased, and its z-value decreased. Moreover, all points were shifted along the x-axis by −1,945,317 and along the y-axis by −565,972, based on the California state plane coordinate system (unit: meters). The z-value of the points was also adjusted using the level of mean elevation of the ground points (i.e., 19.52 m). This shift was performed to create simple coordinate systems and did not affect the results of the analysis.
Other estimated parameters of the model are as follows: tree height = 19.2 m, crown length = 16.78 m, length of the semi-major axis (ra) = 7.89 m, length of the semi-minor axis (rb) = 3.55 m, treetop coordinates = (13.73, 17.87, 19.2), crown center coordinates = (13.73, 17.87, 6.62), crown projection area = 88.08 m2, Dbh = 22.18 cm, mean height of wires = 14.61 m, wire center coordinates = (25.34, 20.83, 14.61).
3.2. Deflection of Trees
Two different wind directions were considered: the direction when the wind blows perpendicular to the y-z surface, and the direction when the wind blows perpendicular to the x-z surface. As shown in the abovementioned tree model, the semi-major axis of the tree crown is parallel to the y-axis. Therefore, it is rational to assume that the projected area of the tree is greater and the mean wind force acting on trees is greater for the wind direction perpendicular to the y-z surface than for the wind direction perpendicular to the x-z surface. Accordingly, we selected the wind that blows perpendicular to the y-z surface and set it as the worst-case scenario.
Figure 6 shows the boxplots for tree deflection under wind speeds of 10, 20, 30, 40, and 50 m/s. Here, the horizontal line is the mean of the deflection, and the vertical line shows the minimum and maximum value of the deflection. For all wind conditions, the maximum deflection occurs at the treetop point because the tree behaves as a cantilever beam fixed to the ground. The tree began to sway and deflected as much as 0.58 m when the wind speed was 10 m/s. The average deflection linearly increased as per the wind speed, whereas the curve of the maximum deflection was approximated as a quadratic function.
Figure 7 shows the relationships between deflection and the height of each point of the tree at a wind speed of 30 m/s. The relationship was demonstrated using box plots with minimum, maximum, and mean values. To estimate the deflection, two different equations (Equations (5) and (6)) were used, based on the distance from the ground level to the crown center (6.62 m for the model). Nevertheless, linear relationships between the deflection and the height were observed. This relationship might have been because the tree swaying model in this study only considers the first mode of vibration. Moreover, as can be observed in the Figure, there is a relatively skewed distribution when the point height is greater than 18 m. By comparing the tendency of the graphs in
Figure 6 and
Figure 7, it can be presumed that wind speed is the dominant factor in determining the deflection compared to the point height.
3.3. Distances between Wires and Trees
In the next step, we observed whether the tree maintains a sufficient distance from the power lines when deflection occurs because of wind loading. As previously described, two different MVCD values were used as the standard to evaluate the degree of fire threat. The first value was the rule-based MVCD derived from practical rules suggested by California local safety regulations, such as CPUC General Order 95 Rule 35. On the other hand, the second value was the flashover based MVCD, which was determined through an experimental investigation using the Gallet equation. Each MVCD value for the nominal PG&E distribution line voltages (12 to 44 kV) and transmission line voltages (60 to 230 kV) is listed in
Table 4.
Before we could calculate the Euclidean distance between each point of the tree and the wire, new point coordinates reflecting the deflection of the tree were required. Thus, the value of the deflection was converted to the deflection angle. Because it was assumed that the wind direction was perpendicular to the y-z surface, the x-values were deemed to be constant. The equation for coordinate rotation is listed as follows:
where
θ is the deflection angle [°],
X is the deflection [m],
h is the point height [m], (
x1,
y1,
z1) is the original point under normal conditions, and (
x2,
y2,
z2) is the deflected point under windy conditions.
The left graph in
Figure 8 shows a decrease in the minimum distance between trees and wires with an increase in the deflection angle. This curve demonstrates a proportional decrease until the deflection angle reaches 30°; however, after that, it remains relatively constant. In particular, it was observed that the distance between the trees and wires becomes smaller than 1.8 m (the rule-based MVCD for a 115 kV power line) when the deflection angle reaches 20°. In other words, at the deflection angle of 20°, there is a failure to maintain a safe distance for the power grid and a violation of the CPUC rule. Furthermore, when the deflection angle continuously increases and reaches 29°, the trees and wires are likely to become close (<0.268 m, the flashover-based MVCD for a 115 kV power line), enough to cause a flashover. The minimum distance between the trees and wires for the deflection angle can be converted to the wind speed, as shown in the right-side graph in
Figure 7. According to this graph, it can be seen that the minimum safe distance was not met when the wind speed reached 33.8 m/s. Moreover, the potential flashover hazard increases when the wind speed reached 40.3 m/s (the critical wind speed of the tree). Eventually, the tree reached its highest potential for fire ignition when the wind speed was 41.5 m/s.
Figure 9 schematically shows how wind loading deflects the tree towards the power line. The green points in the Figure are the tree under normal conditions, when the wind speed is zero. On the other hand, the orange and red points in the figure represent the tree being subjected to wind load. As previously described, this simulation assumed that the wind blows perpendicularly to the y-z surface, causing the treetop to bend towards the y-z surface. However, the MVCD is not always measured at the treetop. The reason for this is that the proposed method in this research compares all possible points in the tree and the wire to determine the minimum distance.
In
Figure 9, the orange tree’s wind speed of 33.8 m/s indicates that it violates the CPUC safe rule. Considering the flashover-based MVCD, the red tree’s wind speed of 40.3 m/s exposes the potential risk of fire ignition. Therefore, tree trimming can be considered as a recommended action for trees in the orange zone, whereas the trees in the red zone should be immediately managed to ensure the power grid’s safety and to prevent fire.
3.4. Validation
Trees are living things, so it is natural that each tree has different capabilities to respond to wind loading depending on their shape, age, relative moisture content, crown density, and even soil conditions [
44]. Therefore, research to predict tree motion under wind loading contains unavoidable uncertainties arising from modeling assumptions that tree behavior obeys physical laws. To validate the predicted results for tree deflection in this research, a comparison was made with the results from previous wind tunnel tests, analyzing the wind behavior of four different kinds of trees, as listed in
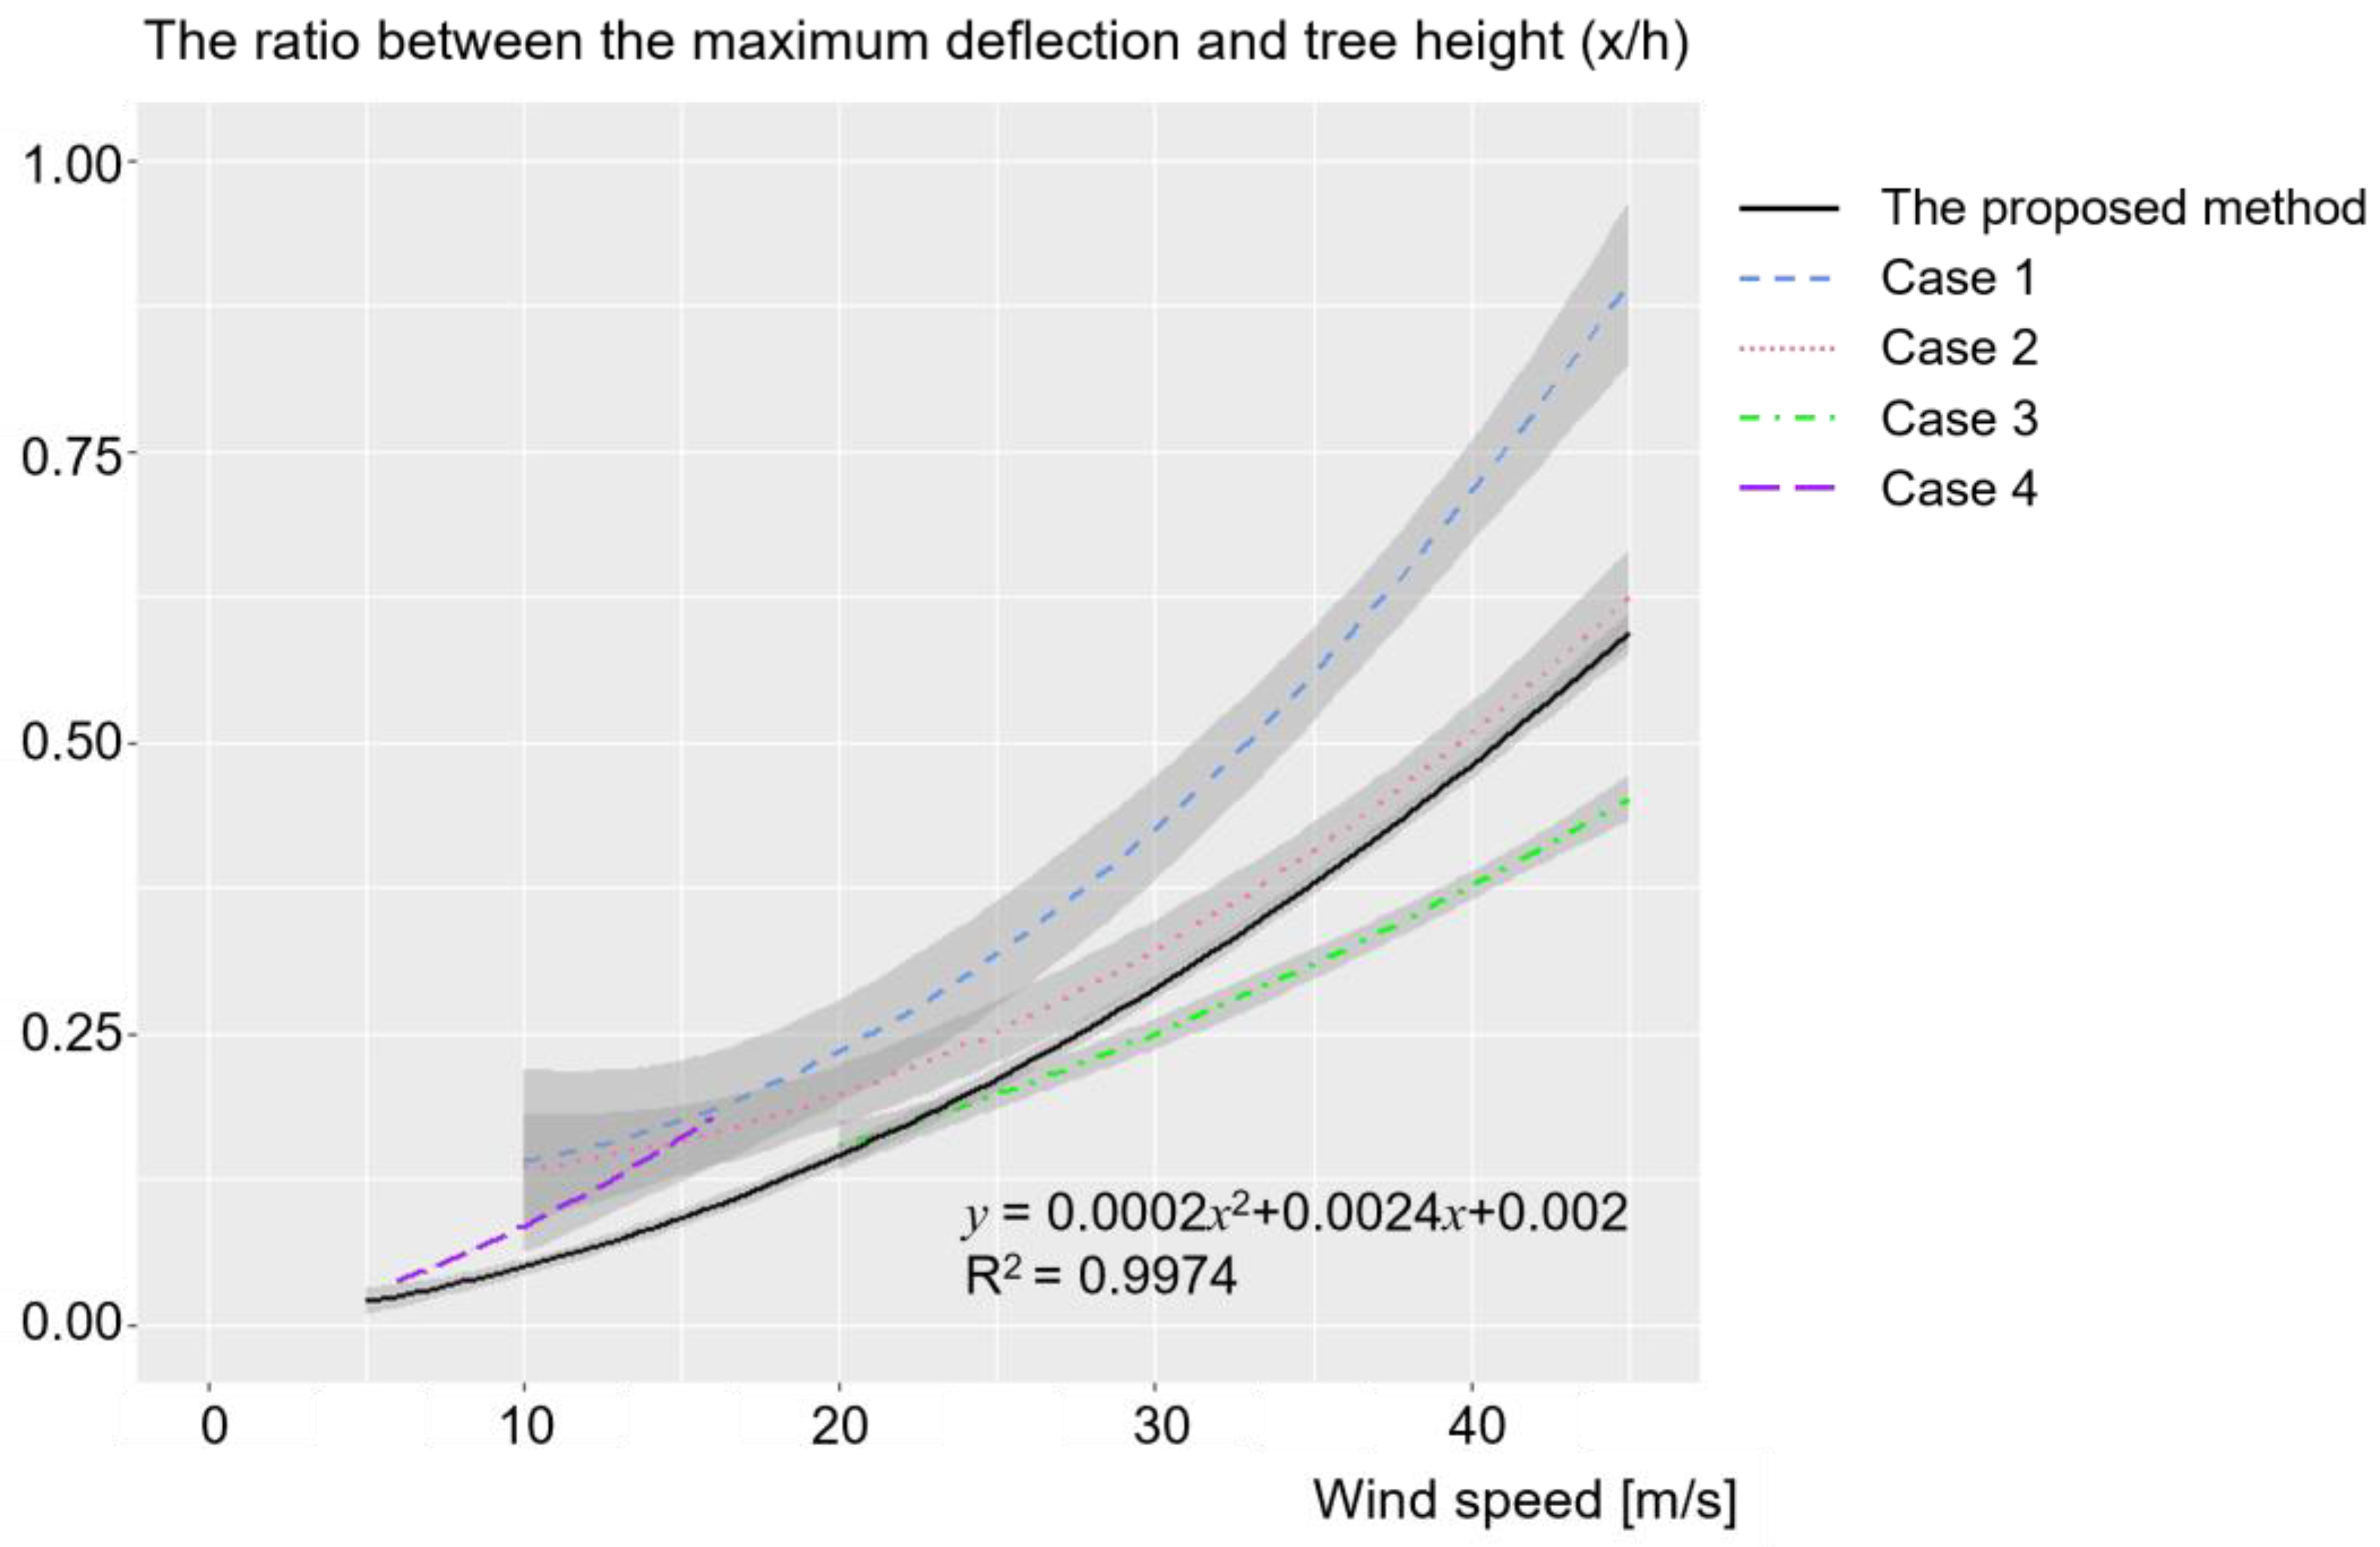
Table 5. However, due to size restrictions in the wind tunnel test, the tree in Case 4 was relatively small (height < 1 m), which may have affected the tree deflection. To address this issue, the slenderness ratio, which is the ratio of the tree height to the trunk diameter, was also considered.
Figure 10 shows a typical power-law relationship between wind speed and tree deflection for both the predicted and measured results. The ratio between the maximum deflection at the treetop and the tree height obtained in this research was somewhat overestimated compared to the results for Case 3 and underestimated compared to the results for Case 1. Nevertheless, the comparisons showed reasonably good agreement considering the complexity of natural environments.
The wind tunnel tests showed a close correlation between the slenderness ratio and the tree deflection. For instance, tall and thin trees typically have a high slenderness ratio, resulting in a greater degree of tree deflection under the same wind speed (Case 1 and Case 3). Interestingly, the behavior of trees with similar slenderness ratios may differ depending on the density of the tree crown. Previous research was aimed at observing different deflections depending on the pruning patterns, testing unpruned trees (Case 1 and Case 2) and crown-thinned trees (Case 3), which explains why two trees (Case 2 and Case 3) had different tree motions. Although data on the correlation between the tree crown shape or tree species and the tree deflection subjected to wind speed was lacking, it is possible that the deflection of a sphere-shaped tree is larger than that of a cone-shaped tree due to the wind-projected area of the leaves. Lastly, the deflection curve for Case 2 was found to be the most comparable to those in this research, indicating that the tree analyzed herein had similar properties to the trees belonging to Case 2, especially in terms of the crown density and mass.
4. Discussion
4.1. Major Factors Determining Tree Deflection
This research presents a model that explains how wind increases the risk of wildfires caused by trees near power lines. The wind force that acts to sway trees and bring them closer to power lines was expressed in terms of the bending deflection of a cantilever beam and various parameters related to the tree geometry. The wind profile was used to measure the deflection. Among the parameters tested, it was found that the slenderness ratio, which is the ratio of the tree height to the trunk diameter, is a dominant factor in determining the degree of bending deflection. As is generally understood, trees with a greater stability in strong winds was observed for trees with a short height or a thick trunk. For example, when the Dbh was reduced to 50% such that the slenderness ratio was reduced to 50%, the deflection increased up to 16 times. This increase in deflection is also related to the assumption that the area moment of inertia (I in Equation (4)) is proportional to the fourth power of the trunk diameter.
Moreover, the wind speed influences tree deflection in two different ways. Firstly, the wind force acting on a tree and the tree deflection are correlated with the square of the wind speed. However, as shown in
Figure 6, this relationship is less apparent for wind speeds of 30 m/s and lower. This is because a tree generally tends to bend toward the leeward side, resulting in a decrease in the effective projection area of the tree crown. The level of decrease becomes nearly uniform when the wind speed is greater than 30 m/s such that the deflection is proportional to the square of the wind speed after this point again.
Finally, it was noted that the relationship between the crown length and deflection can be represented as a concave curve. Because the crown length is positively correlated with the projection area and negatively correlated with the distance from the ground level to the crown center, it could be interpreted to describe the tree size and the center of gravity of the tree mass.
4.2. Requirements for a Better Understanding of the Risk of Fire
While large tree deflections may increase the risk of wildfire, it is not necessarily true in all cases. In fact, the mere contact of a branch with a power line rarely causes wildfire. However, the potential risk of fire can be heightened by the embers that are dropped from the point of contact and ignite flammable material below the lines. This highlights the importance of assessing the risk of flashover based on the MVCD, as it allows for a more precise understanding of the vegetation that requires to be trimmed to reduce the risk of fire.
Although this study focused solely on voltage as a means of determining the minimum vegetation clearance distance needed to prevent the flashover between power lines and trees, it is important to note that other factors—such as tree species, wire diameters, and weather conditions—can also impact the likelihood of fire arc ignition. Furthermore, the age of power lines is a critical factor in the risk of wildfires. As power lines age, their insulation may become brittle and more susceptible to cracking, which can result in electrical arcing and sparking, thereby igniting nearby vegetation. Additionally, the connections between power lines and supporting structures can loosen or corrode over time, leading to sagging lines and increased contact with adjacent vegetation.
In other words, it is still unclear how often power line arcs resulting from vegetation encroachment cause fire accidents. This challenge is further complicated by the various ways wind can impact fires. As discussed in this study, wind can start fires by blowing flames into fresh fuel, bringing it to the ignition point, and providing a continuous supply of oxygen. However, wind can also decrease the ambient air temperature and the duration of arcs, thus reducing the likelihood of a fire occurrence.
4.3. Needs for Further Studies
The proposed method offers a precise understanding of the vegetation that requires trimming to prevent any contact with power lines. Point cloud data has been used to compare all points in the tree and the wire, which has enabled the determination of two types of MVCD. Despite these advantages, additional studies are required to consider various factors to gain a more accurate understanding of tree motion. Firstly, it is essential to note that the wind force depends on the shape of the tree, which is related to the species of the tree. As discussed earlier, the wind force is a function of the drag coefficient, and the tree’s shape can affect it as it influences the way the air flows over the tree’s surface. For instance, a tree with a smooth, cylindrical shape will generally have a lower drag coefficient than a tree with a rough, irregular shape. Secondly, the density of the tree crown can also affect the drag coefficient, as observed in the wind tunnel test results. Typically, a denser crown will have a higher drag coefficient, as it presents a larger surface area for wind to interact with. This increases the wind resistance of the tree and makes it more susceptible to damage from strong winds. On the other hand, a sparser crown will have a lower drag coefficient and will be better able to withstand wind loads. Lastly, the flammability of tree species is another significant factor contributing to the risk of wildfires caused by power lines. Some tree species, such as conifers, have high resin content and are more flammable than other species. In addition to the factors discussed above, it is also important to consider the effect of weather conditions on the motion of trees. Strong winds coupled with weather conditions such as drought can cause vegetation to dry out, increasing the risk of fires. Dried vegetation serves as fuel for fires, making them more combustible, and power lines can easily ignite them. Therefore, further research is needed to consider the combined effect of these factors in determining the clearance distance needed between power lines and trees to reduce the risk of contact and prevent wildfire outbreaks.
5. Conclusions
As a step towards solving wildfire problems, this study presented a model to explain how wind increases the risk of wildfires caused by trees near power lines. Airborne LiDAR data of urban areas in Sonoma County in northern California was used, and eight trees were extracted. We selected a tree with a cone-shaped crown and a height of 19.2 m as a sample. The buckling behavior of trees under wind load was analyzed based on the assumption that the tree behaves similar to a cantilever beam. The experimental results demonstrated that the deflection of trees because of wind forces was dominated by the ratio of tree height to trunk diameter. For the case of the sample tree, the tree began to tilt close to the wires when the wind speed reached 10 m/s. Furthermore, the tree did not meet the MVCD set by the CPUC when the wind speed was about 33.8 m/s. The critical wind speed in terms of preventing the fire ignition of the tree was estimated to be 40.3 m/s. The proposed method has applicability for identifying potentially dangerous trees that possibly lead to wildfire under strong wind conditions. By understanding the impact of wind on tree behavior near power lines, power companies can take proactive measures to reduce the risk of wildfires caused by trees. This can also help to reduce the considerable cost of patrolling the power grid to trim trees close to power lines.
In addition to its practical applications, this research also has important implications for our understanding of tree biomechanics and wind loading. Using a simple model based on the bending deflection of a cantilever beam, the researchers were able to identify the dominant factors influencing the tree behavior in windy conditions. This provides a valuable framework for future research into the complex interactions between wind and trees. Overall, this study provides important insights into the behavior of trees near power lines in windy conditions and highlights the need for proactive measures to prevent wildfires caused by trees. By incorporating the findings of this research into power line management practices, we can help to reduce the risk of power line-related wildfires and protect our communities from the devastating impact of these events.
Despite the useful results of this study, additional research is required to consider various factors that affect tree motion. For example, whereas we assumed that trees are fixed on the ground, it is more rational to assume that a tree is broken or uprooted when the wind load exceeds its allowable stress. Furthermore, work in future will extend to develop a more comprehensive model that accounts for tree species, the density of the tree crown, and weather conditions.


